MAP Agricultural trade in 2012: A good story to tell in a difficult year? Monitoring Agri-trade Policy
|
|
|
- Calvin Skinner
- 6 years ago
- Views:
Transcription


1 MAP Monitoring Agri-trade Policy Agricultural trade in 2012: A good story to tell in a difficult year? Contents 1. International setting 2. Key players: Highlights 3. EU agricultural trade surplus hits a new record high 4. EU exports are mainly final products 5. EU agricultural imports 6. EU: the top importer form developing countries 7. Closer look at EU key partners 8. Conclusions The times where the EU continuously recorded a negative trade balance seem to be over. In 2012, the EU hit a new record in agricultural trade surplus: 12.6 billion. While its imports hardly budged, the exports put the EU just inches behind the US in the ranking of world top agricultural exporters. The increase in exports and a resulting all-time high surplus indicate that the growth in demand for EU products is essentially driven by export markets (especially developing economies) rather than by the economically depressed EU domestic market. In addition, depreciation of the Euro against major currencies has also helped the EU to boost its sales. EU demand for agricultural goods as reflected by EU agricultural imports, did not show particular signs of growth. This can be attributed to the general weakness in EU economy. Price declines of certain commodities, such as coffee or cotton, were also a contributing factor to the stagnation of EU imports in value. It was estimated that, for 15 export products with the highest export gains, on average 44% of the increase of exports value was driven by an increase in the unit price, the remaining 56% being quantity-driven. Alcoholic beverages and wines top the list of products with the biggest export gains. The EU also hit a new record in sales to its top partner, the US, which accounted for some 13% of EU total agricultural exports. Although in 2012 the largest absolute gain in exports was achieved in the US, the fastest growing markets were China and Saudi Arabia. This MAP not only looks at EU agricultural trade, but also briefly discusses developments in trade of key agricultural players such as the US, Brazil, China and Russia. In particular, it reveals that the US had record sales to China, as its soya beans exports soared. On the other hand, Brazil took over the US market shares in Asian and Middle East markets after drought hit the US corn harvest. Agriculture and Rural Development


2 1. International setting The WTO presents a rather gloomy picture of world merchandise trade in World trade growth in real terms (i.e. adjusted for inflation and exchange rate) fell to 2%, down from 5.2% in This weak performance is attributed in particular to slow growth in developed economies and to uncertainty over the euro. The sluggish growth in real terms is accompanied also by an even weaker growth in nominal terms due to significant price declines for certain commodities (e.g. coffee, cotton, coal, iron ore). As prospects in major economies are set to continue over the next year, prospects for trade in 2013 are not much better. To some extent, the unfavourable global economic context has also had an impact on agricultural trade. Following the rebound in 2010, growth in agricultural trade of major agricultural partners continued, although at a slower pace. In 2012, unfavourable weather conditions also had an impact on the trade performance of the agricultural players. As measured in current euros, all the main players, except Argentina, saw an 11-12% increase in their export revenues compared to 2011, which amounts to a lower growth rate than in the previous year. The US, the leading agricultural exporter, recorded nearly 117 billion worth of sales of agricultural goods, up from 105 billion in 2011 (+11%; 14% in 2011). The EU was just inches behind the US, with exports reaching an all-time high of over 114 billion. Although the result looks impressive, the 2012 growth rate was lower than in 2011 (12%; 17% in 2011). Brazil has maintained its position as the world's third largest supplier of agricultural goods, while China and Argentina compete for the fourth. A sluggish export growth on Argentina's part (4%) allowed China to keep ahead. Export sales of the latter in 2012 went up to 34.5 billion (see graph 1). The EU remains by far the world's biggest importer of agricultural goods, with imports reaching an alltime high of 102 billion, still well ahead of the US ( 85 billion). EU imports, however, are just a mere 3% higher than the 2011 outcome. Last year's figures confirm that China's appetite for agri-food products is growing stronger. With an import bill worth some 82 billion it is now only 3 billion behind the US. This means an impressive 30% import growth over Japan and Russia have been left far behind the three big players: their growth in imports has slowed down to 8% and 5%, respectively. Japan imports half as much as the EU, while Russia's food bill is less than a third of the EU's. Graph 2: Top 5 world agricultural importers Graph 1: Top 5 world agricultural exporters 2. Key players: Highlights US: record sales to China, despite the slump in maize exports Despite adverse weather conditions, affecting in particular maize production, the US exports kept on growing (+11% in current euros). This is in particular due to good sales of soya beans, the US top export product. Soya bean exports surged by 49% in value and 21% in volume, reaching 43.5 million t. The US seems to have taken advantage of the drop in 2
3 production and exports of soya beans by Argentina, and increased its sales to China. As a result, in 2012 China jumped to the top of the ranking of US export partners (total US exports to China up by 46%), leaving traditional NAFTA partners behind. Maize exports suffered tremendously because of the drought hitting the US in spring/summer Sales shrunk by 25% in value and 31% in volume. Wheat went down by over 20% both in value and volume, while cotton saw a price decline of 20%, with volume remaining unchanged. Together with soya beans, these commodities accounted for a third of the value of US agricultural exports. Brazil: benefits at the expense of the US Brazil continued to expand its agricultural exports, reaching an all-time high of 65 billion sales in The growth in 2012 (+11%) was however much lower than in the previous year (+21%). As Brazilian imports are very tiny compared to the value of exports, Brazil enjoyed another record high surplus of 57 billion. Brazil filled the gap in the world market caused by the drought in the US. Brazilian maize took over US shares in Asian and Middle East markets (e.g. Japan, Iran, South Korea), and overall doubled its total export volumes to the world (from 9.5 million t to nearly 20 million t in 2012). The cross trade of ethanol between Brazil and the US, i.e. export of cane-based ethanol to the US and imports of corn-based ethanol from the US, which emerged in 2011, continued in 2012, but this time the net balance was in favour of Brazil. In 2012, Brazil sent more ethanol to the US than what it bought from it (3 times more in value and volume). Its imports fell down by some 50%. Brazil is intensively looking for new markets in Mediterranean and Middle East markets as Russia is gradually closing its market for Brazilian supplies. The EU is still Brazil's number one export destination, although its share is declining. China: trade deficit plunges even further China's appetite for agricultural goods is still unfaltering as imports continued their impressive growth. The 30% rise in import value in 2012 made the gap between exports and imports plunge further, to over 47 billion. Exports also grew, but at a much slower pace (+11%) than imports. Soya beans makes up around a third of Chinese imports and its imports keep on rising (in 2012: + 27% in value and 11% in volume) Soya beans is the main driver of growth of Chinese agricultural imports. Other fast growing imports of commodities include cotton, maize (mainly from the US), wheat, and rice. On the export side, China is specializing in fruit and vegetables. 40% of all agricultural exports are fresh and processed fruits and vegetables. In 2012, the biggest absolute gains in exports were achieved by fruit and vegetable preparations, followed by oilcakes. Russia: pushing up exports of commodities Russia, a net importer of agricultural products, saw the gap between imports and exports shrink last year (-8%), mainly due to a gain in agricultural exports, which exceeded the increase in agricultural imports. In value terms, Russia's imports went up by just 5% to reach 28 billion, while exports went up by 47%, reaching 9.6 billion, and continuing the good performance of Russia is mainly specialised in exports of commodities, which account for around half of Russian agricultural exports. Wheat is the top product on the ranking, accounting also for most of the export gains (+33% in value) was also particularly successful for vegetable oils (+101%) and maize (+279%). The biggest import increases were in beef, pork, and spirits, while the biggest losses were for sugar (over 70% drop, both in value and volume) and potatoes (nearly 70% drop). Fruit, another major category of imports, are still keeping up fine (+10% increase in value and +3% in volume). 3. EU agricultural trade surplus hits a new record high The times where the EU continuously recorded a negative trade balance seem to be over. After a switch from a net importer in 2009 to a net exporter in 2010, the EU has now hit a new record: its agricultural trade surplus reached 12.6 billion. This means an addition of almost 8.9 billion to the 2011 surplus. This result is due to the EU's excellent performance in agricultural exports. 3

 but are not ready for final consumption.")
4 The definition "Agricultural products" corresponds to the WTO definition and includes the chapters 1-24 (excluding fish and fish products), in addition to a number of headings in chapters 33, 35, 38, 41, 43 and of the Harmonised System. The following terms have been used to classify agricultural products within then different aggregates: Commodities are products that are mainly traded in bulk (e.g. grains and oilseeds) and have not been processed. Intermediate products have undergone a first stage of processing (e.g. from wheat to wheat flour) but are not ready for final consumption. Final products are ready for or very close to final consumption. This encompasses both processed products and unprocessed ones such as fresh fruit and vegetables. Other products include those products which - although within the WTO definition of agricultural products - have little direct linkage to agriculture. The other category includes human hair, ivory, waters and odoriferous substances (essential oils). The EU's last year exports earnings were around 12 billion higher than those of 2011 (+12%) 1. Graph 3 shows the evolution and structure of EU agricultural trade. Graph 3: EU27 structure of agricultural trade ( ) As opposed to exports, agricultural imports saw only a minor increase: 3.3 billion (+ 3.4%). As in the previous years, final products continued to make up around half of EU imports. Commodities, intermediate and other products accounted for 19%, 29% and 1% of imports, respectively. Some import growth was recorded for intermediate and other products (+9% and 15%, respectively), while for commodities and final goods the change was negligible. 4. EU exports are mainly final products The EU continues to specialize in the export of final products, which, as mentioned, account for two thirds of total agricultural exports. Graph 4 shows the composition of EU exports in 2012 by product categories. The top 10 highlighted categories make up nearly 50% of EU exports, and all of them, except wheat, are final goods for direct consumption. In 2012, similarly to the previous years, the bulk (67%) of EU exports was final goods (for direct consumption). The rest were commodities (9%), intermediate products (20%), and other products (3%) (for definition of the aggregates see Box above). Final, intermediate and other products recorded a quite strong export growth of around 13-14%. By contrast, commodity exports, after a surge in 2010 and a moderate increase in 2011, saw practically no change in Graph 4: EU27 main agricultural exports in The new aggregate of agricultural products does not contain the following tariff codes CN and CN These are odoriferous substances for the food industry. Previously treated as agricultural products, for classification purposes they are now regarded as industrial products. Due to this reclassification the results for the previous years also changed. This caused the 7 billion surplus recorded in 2011 to shrink to some 3.8 billion, with exports and imports in 2011 totalling 102 billion and 98.2, respectively (previously: 105 billion and 98 billion). 4 Spirits and liqueurs weigh the most heavily in the basket of exported products: their total value in 2012 was 10.2 billion (+20% on 2011). Wines and
, ice-cream, chocolate and confectionery, pork, cheese, fruit and vegetable preparations and cigars and cigarettes.")
. Whiskies and wines grow the fastest but only in value The export gain of 12.")
, other products by 371 million (+14%), while commodities remained practically unchanged.")
5 vermouth came second with 9 billion worth of export sales (+9%). They were followed by cereal preparations valued at 7.8 billion (+18%). Other top exported product categories included wheat, other non-specific (yeast), ice-cream, chocolate and confectionery, pork, cheese, fruit and vegetable preparations and cigars and cigarettes. In value terms, exports of all of these products, except wheat, increased, with spirits and liqueurs growing the fastest among the ten product groups. Wheat showed a 7% drop in value and a 9% drop in volume (down to 15.9 million t). Whiskies and wines grow the fastest but only in value The export gain of 12.2 billion (+12%) can be mostly attributed to final products which went up by some 8.9 billion (+13%). Intermediate products increased by 2.7 billion (+13%), other products by 371 million (+14%), while commodities remained practically unchanged. Graph 5 indicates the 15 products (on HS 6-digit level) contributing most to the increase in the value of EU exports in Graph 5: Main Products contributing to the increase of EU27 agricultural exports previously supplied by Argentina. On an aggregate 4-digit level 2 in 2012 EU exports of soybean oil doubled from the previous year. The 15 most dynamic products taken together account for almost half of the absolute gain in agricultural exports. The export competitiveness of the EU on some markets was helped by depreciation of the euro against certain major currencies (-7.7% against US dollar, -7.6% against Japanese yen, -6.7% against Canadian dollar, -2.2% against Swiss franc). It has, however, gained against Brazilian real (+7.8%), which, conversely, made purchases from Brazil more attractive for the EU. Graphs 6 and 7 explain the drivers behind the increased exports of the 15 most dynamic products. On average, 44% of the exports increase was price driven, the remaining 56% being quantity-driven. For certain products, however, the gain was entirely driven by volume increases. These products include: soybean oil, cheese, and cane and beet sugar. Better revenues from the sales of frozen pork and cigarettes were entirely due to higher prices. Graph 6: Change in unit value and volume for the main products contributing to export growth As in previous years, whiskies and wines were the leaders in terms of export gains in value terms (+17% and +9%, respectively). Food preparations for infant use came third on the ranking, with exports up by some 0.5 billion (the main markets are China and Hong Kong). Soybean oil appeared for the first time in such a ranking as the EU took over market shares in Mediterranean countries ( Algeria, Morocco ) For wine, the volume of exports rose by 5% and the average unit value by 4%. For whiskies, the volume of sales grew by 3% and the unit value increased by 14%, which indicates that more expensive spirits do not lose popularity among foreign consumers. The strongest increases in volumes for other products were the following: soybean oil (+301% to t, mainly to Morocco, Algeria), cane or beet sugar (+ 41% up to 1.9 million t, mainly to Middle 2 CN
, spirits (+13%), liqueurs (+13%).")
6 East and Med countries), liqueurs (+22%; up to t, mainly to North America). Graph 8: EU27 agricultural exports by destination The strongest price increases were recorded for: fur skins and mink (+21%, mainly to China), spirits (+13%), liqueurs (+13%). Graph 7: Contribution of volumes and unit prices to the increase in the value of EU exports in 2012 partners, saw moderate increases (up to 13% for Norway), except for Turkey which recorded a slight drop (-1%). EU top export destinations In 2012 the EU continued expansion to the main export markets. Graph 8 shows the evolution of exports to the main destinations since See also page 9 for trade flows between the EU and its major trade partners. Graph 9 shows the main destinations for EU most significant export products: spirits and liqueurs, wines, cereal preparations, other non-specific products (yeast), wheat. Graph 9: Export value of main product categories by destination in 2012 (in thousand euro) The US is the EU's largest market with an export share of 13% in total agricultural exports. After the contraction in 2009, the sales to the US continued to grow to reach an all-time high of 15 billion in 2012 (+13%). Russia remains the EU's second export market, with an export share of 10%, unchanged since It is followed by Switzerland (6% share), China, and Japan. Although in 2012 the largest absolute gain in exports was achieved in the US ( 1.8 billion), the fastest growing markets were China and Saudi Arabia. Sales to China alone (excluding Hong Kong) went up by 25% (i.e. by 1.2 billion, to reach 6 billion). Saudi Arabia saw an increase of 22% (to 3.2 billion). The fast growing sales to this Middle East country reflect its growing demand for final goods (e.g. cigars & cigarettes, food preparations) and commodities, such as wheat and barley, the latter being the EU top exported agricultural product in 2012 to Saudi Arabia. Russia, Switzerland and other major export In 2012, nearly 60% of export revenues from the sales of spirits and liqueurs came from the US, Singapore, Russia, China and Canada. The top markets for wine were the US, Switzerland, Canada, Japan and China, accounting for 64% of EU sales. The US remains the EU key export market for spirits and for wines, accounting, respectively for 32% and 28% of EU exports revenues. These shares have remained practically unchanged since
. China, the fastest growing EU export market, seems to be looking more into highend alcohol brands: although the sold volume of spirits went down by 12%, export sales increased by 19%.")
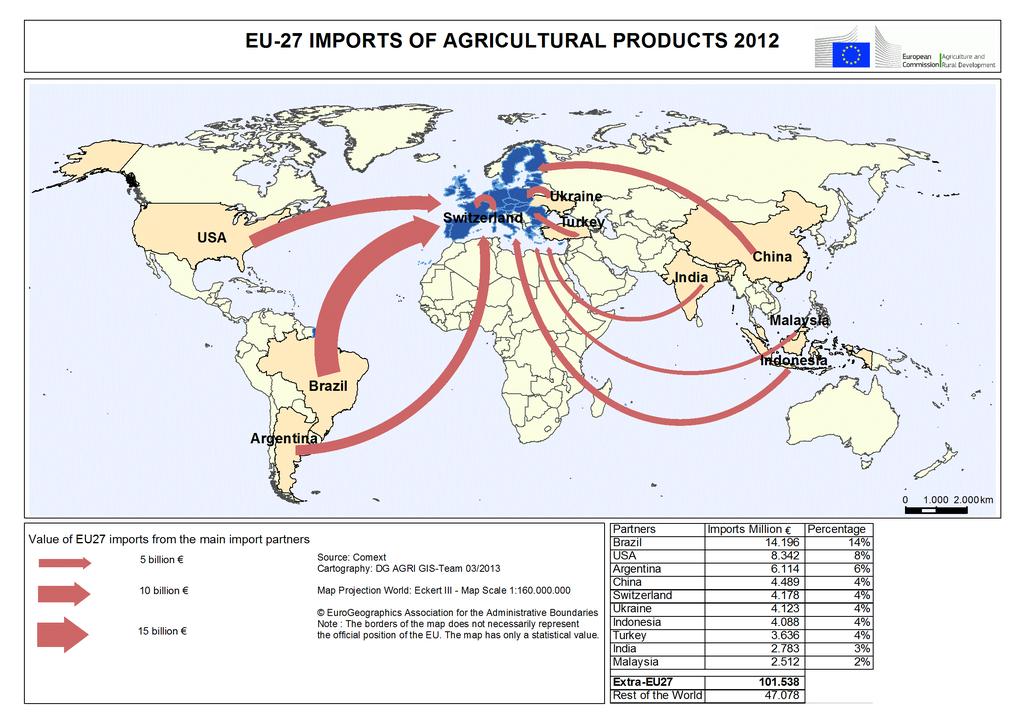
7 Out of the top five markets for spirits and liqueurs the highest growth rate was recorded for Russia (+37% in value and +25% in volume), while for wines Japan was the growth leader (+26% in value and +23% in volume). China, the fastest growing EU export market, seems to be looking more into highend alcohol brands: although the sold volume of spirits went down by 12%, export sales increased by 19%. Middle East and Mediterranean markets are the key buyers of wheat from the EU. Nearly two thirds of export revenues for wheat came from that region and one fourth from Algeria alone was a record year for the EU in Iran's wheat market ( 613 million, 2.3 million t) as in previous decade annual exports were negligible or zero (except for with 1.2 million t of exports). The boom in export sales to Iran did not translate however into a surge in total sales of wheat to all markets due to a significant drop in sales to Morocco by nearly 50% (in volume and value). As a result, the total exported volume of wheat dropped by 9%, down to 15.9 million t. Other important product categories in EU exports are cereal preparations and other non-specific products (yeasts). The five markets identified for each products, as illustrated by Graph 9, account for, respectively, 36% and 33% of EU exports of those products. 5. EU agricultural imports The top ranking product in EU imports in 2012 was coffee (8% share alone, worth 7.8 billion). Other high-ranking imported products were oilcakes from soya bean ( 7.4 billion), soya beans ( 5.3 billion), and palm oil ( 3.7 billion). Graph 10 illustrates the composition of EU imports by product category. Coffee and tea made up 10% of total EU agricultural imports; other animal and vegetable oils (including palm oil) and oilcakes followed closely behind with a 9% share. Tropical fruits and spices (including bananas) accounted for 8% EU imports. Although at aggregate level practically no change has been observed, imports of particular products have gone up or down. In fact, lower prices for coffee and cocoa, as well as decreased imports of sugar (down from 4.5 million t in 2011 to 3.6 million t in 2012) helped to net out an increase in imports of other products. This also contributed to the achievement of a relatively high agricultural trade surplus. Graph 10: EU27 main agricultural imports in saw an 8% drop in the unit price of coffee 3 after an impressive 40% surge in the preceding year. For cocoa beans, after a sharp increase of prices in 2010, they started to decline; in 2012 prices dropped by 9% vs In volume terms, in 2012 the total imports of coffee and cocoa beans were comparable to the 2011 level (2.8 million t and 1.5 million t, respectively). Cotton also experienced price declines (-27%). Products showing significant absolute gains in imports were the following: oilcakes (+20% in value and +3% in volume terms), soya beans (+13% in value but -1% in volume), (other) products of oilseeds (+19% in value and +13% in volume). Graph 11 (on the next page) shows the evolution of total EU imports and by main supplier. Brazil is the EU's top import partner (14% of imports), followed by the US (8%), Argentina (6%), China (4%) and Switzerland (4%). Ukraine, Indonesia, Turkey and India (not in the graph) follow. 3 Excluding roasted and decaffeinated coffee 7


8 Graph 11: EU 27 agricultural imports by origin However, after a surge of coffee prices in 2011 its share diminished (down to 27% from 31%), as EU importers switched to a more affordable (Robusta) coffee from Vietnam. As a result, Vietnam is now closely behind Brazil with a share of 25% in EU imports of coffee in volume terms. Graph 12: EU27: Import value of main products by origin in 2012 (in thousand euro) From the above countries Ukraine stands out as the one with the highest growth in sales to the EU. In fact, 2012 was another record-breaking year for Ukraine: EU imports from this country surged by 56% up to 4.1 billion. This is due to increased demand for Ukrainian products, such as maize (imports more than doubled up to 5.8 million t), oilcakes from vegetable fats, soya beans or rape seed. Other countries which have recorded high growth rates in supplies to the EU include Malaysia (+28%; palm oil up), Australia (+19%; rape or colza seeds up), Viet Nam (+26%; coffee up); Russia (+64%; oilcakes from vegetable fats, maize, sunflower seeds up). Graph 12 shows the origin of the EU's top 5 imports (product categories) in 2012 and the share of countries of origin in EU total imports of a particular product category. The soya market remains highly concentrated with Brazil and Argentina dominating the scene as oilcake suppliers (together covering over 90% of imports of soybean meal), and Brazil being the number one supplier of soya beans. However, in 2012 supplies of oilcakes from Argentina diminished in volume terms (-18%) to the benefit of geographically more proximate suppliers such as Russia (+118% in volume) and Ukraine (+61%). Brazil also remains the top supplier of coffee with a 27% share in total EU coffee imports (volume terms). The tropical fruit and spices category illustrated in graph 12 includes in particular nuts and bananas. Colombia, Ecuador and Costa Rica are the EU's main suppliers of bananas, accounting for over 70% of EU banana imports. The US and Turkey provide the EU with nuts, with the US specializing in almonds, pistachios and walnuts, and Turkey mainly in hazelnuts. 6. EU: the top importer from developing countries As in previous years, the EU continues to be the top importer of products from developing countries. On average between 2009 and 2011, 72% of EU imports came from developing countries ( 67 billion). This share is significantly higher than the 43% share in total agricultural imports of the "Big 5" taken together: Canada, US, Australia, New Zealand and Japan. Moreover, EU imports from developing countries are growing. In 2011 their value reached 75.4 billion (+15% on 2010). 8

9 Agricultural trade in
 to reach an all-time high of over 15 billion (13% of EU agricultural exports).")
 (see graph 15) Graph 15: EU27 agricultural trade with the US Note: New Zealand data are only for 2009-2010 When it comes to imports from least developed countries (LDC), the EU scores even")
 Note: New Zealand data are only for 2009-2010 This share however, is almost seven times bigger than")
. 7.")
10 Graph 13: EU imports from developing countries as a share of EU total agricultural imports (average ) biggest market for the US. After a recovery in 2010 and a moderate increase in 2011, EU sales on the US market kept on growing (+13% over 2011) to reach an all-time high of over 15 billion (13% of EU agricultural exports). These record sales can be mainly attributed to the increase in the value of final goods (up by 14%). The EU surplus with the US in 2012 reached a record 6.8 billion (in 2011: 5.2 billion) (see graph 15) Graph 15: EU27 agricultural trade with the US Note: New Zealand data are only for When it comes to imports from least developed countries (LDC), the EU scores even better. 2.5 billion (average ) of imports from LDCs is just a minor share of EU total agricultural imports (2.7%). Graph 14: EU imports from the LDC as a share of total EU agricultural imports (average ) Note: New Zealand data are only for This share however, is almost seven times bigger than the share of the "Big 5", which procure on average only 0.6 billion worth of goods from LDCs (see graph 14). EU agricultural imports from LDC's are on the rise as well. In 2011 they surged up to 3 billion (+30% on 2010). 7. Closer look at EU key partners The EU and US: EU record sales in the US The US continues to remain the EU's biggest market for agricultural exports, while the EU is the fifth 10 The EU main agricultural exports to the US, final goods, made up close to 80% of all the products, and also accounted for almost 80% of the absolute export gains. In 2012 the EU sold 11.6 billion worth of final goods and 2.1 billion worth of intermediate products. Commodities have a minor share in the structure of EU exports to the US: their value in 2012 was only 0.6 billion. Wine stood firm as the EU top export product in 2012 valued at 1.9 billion ( 2.5 billion together with sparkling wine). It was followed by beer ( 1.2 billion), whiskies ( 1 billion) and vodka ( 0.8 billion). The next in line were cheese, spirits, olive oil, liqueurs and certain food preparations. The top 10 products (on a HS 6-digit basis) accounted for over 50% of EU exports to the US (see graph 16 next page). The biggest increase in the value of exports was recorded for whiskies (+24% or by 214 million), wine (excluding sparkling) followed closely (+11% or 190 million). Beer and vodka also saw a significant rise in export sales. These export gains in value terms were not, however, accompanied by a corresponding increase in exported volumes.
 and final goods (+6%).")
, the supplies of which went up fivefold in value and fourfold in volume (up to 123 million or 1.8 million hl).")
11 Graph 16: Composition of EU exports to the US in 2012 As to the imports from the US, only a slight increase was observed (+3%) up to 8.3 billion. A 12% drop in the value of commodities was compensated by an increase in intermediate (+11%) and final goods (+6%). The biggest absolute import gains were for oilcakes, back to the level of 2010 (+144%, or + 185m) and nuts (especially pistachios, almonds) (+13%, or 150m). A particular surge was also observed for ethanol (CN 2207), the supplies of which went up fivefold in value and fourfold in volume (up to 123 million or 1.8 million hl). As a result of the 2012 drought in the US supplies of maize shrank from t in 2011 to t in 2012 (-84% in value terms). Grain sorghum imports also went down dramatically to just t, compared to t in 2011, and t in Graph 17: Composition of EU imports from the US in 2012 The EU and Russia: EU exports slow down but imports rise impressively The EU remains the biggest agricultural supplier to Russia, accounting for nearly 40% of its imports in Russia is the EU's second biggest export market, although its growth is rather slowing down. In 2012, exports in value went up by 9%, compared to 14% in the preceding year. Export gains in Russia were lower than those in the US: 1 billion, compared to the additional 1.8 billion made overseas. Since 2007, the agricultural trade balance with Russia has been positive and growing (except the slump in trade in 2009). In 2012, it went up to 9.5 billion - slightly up from 9.3 billion in Graph 18: EU27 agricultural trade with Russia As in other major markets, exports to Russia are dominated by final products, which account for over 80% of EU sales to Russia. Similarly to the preceding year, the top exports in 2012 were fresh fruit 4, cheese, and pork. The principal fruit exports, apples and pears, worth over 0.5 billion (+17%), made up close to 50% of fresh fruit sold to Russia. Russia is EU's key buyer of apples and pears, accounting for around 46% of EU total sales of these fruit. The biggest export gains in 2012 were recorded for spirits and liqueurs (+ 200 million or +36%), mostly for whiskies. Other big winners included fresh fruit (e.g. apples, pears, peaches) (+19%), tomatoes (+76%), cheese (+16%), and cereal preparations (+33%). 4 Excluding citrus fruit 11
.")

 find their way to the demanding Japanese")
12 The sales of pork, an important product in export to Russia, seem to have stopped growing. In volume terms, they virtually came back to the 2010 level (-13%; down to t). since 2009, surplus has been significantly going up (see graph 20). Graph 20: EU27 agricultural trade with Japan As Russia continues its self-sufficiency oriented policy, EU sales of poultry meat remained roughly at the 2011 level ( t), although in value terms EU exporters gained 35% on Potatoes, the most dynamically growing export product in 2011, came back to pre-2010 levels: only t sold, worth some 53 million. The biggest drop in exports was observed for live animals (-27% on 2011 in value), fresh vegetables (including potatoes) (-8%), and bovine meat (-18%). Graph 19: Composition of EU exports to Russia in 2012 Due to the geographical distance, mainly processed and long-lasting products (rather than fresh produce) find their way to the demanding Japanese market. The EU flagship product sold on the Japanese market is pork, accounting for 16% of EU sales. Next in line are wine, cigars and cigarettes, and cheese. Altogether these products make up nearly 50% of EU agricultural exports. Graph 21 illustrates the composition of EU exports to Japan. Graph 21: Composition of EU exports to Japan In 2012, imports from Russia, dominated by intermediate products, increased more significantly than exports (+64%), reaching a record 1.8 billion. The culprits for this impressive rise are mainly vegetable oils (mainly sunflower oil), oilcakes (based on rapeseed and sunflower), and maize. Their supplies doubled (in value and volume), or even tripled as in the case of maize. The EU and Japan: trade balance hugely in favour of the EU Japan is an important partner for EU products, ranking 5 th among the main export destinations for EU agricultural products (behind China). In 2012 the EU sold some 5.2 billion of agricultural products to Japan. In contrast, imports were negligible (slightly less than 180 million) which led to an impressive surplus of 5 billion in the EU agricultural trade balance with Japan. Moreover, Although pork is the principal product sent to Japan, its sales are still below the pre-2005 levels. Sales of pork in 2012 were 14% lower than in 2004, the record year of pork exports to Japan. Wines picked up strongly after the slump in 2009, reaching 770 million in The second part of the last decade was also particularly positive for cigars and cigarettes. Japanese customers are also developing 12

.")
13 their interest for EU olive oil and fruit and vegetable preparations. Cheese exports have remained largely at the same level as in recent years (over 200 million). The EU imports little from Japan; main products are soups and sauces as well as food preparations. Graph 23: Composition of EU exports to China in 2012 The EU and China: China is still a fast growing market China continues to be the EU's top growing export market. After the 2011 increase, in 2012 EU agricultural sales to China grew further by 25%, i.e. by additional 1.2 billion. This translated to a recordhigh surplus of 1.5 billion with China (see graph 22). Graph 22: EU27 agricultural trade with China Sales of spirits and liqueurs, as well as wines, also grew in 2012 but less impressively than the abovementioned products (+19% and 10%, respectively). EU agricultural imports from China remained roughly at the 2011 level, amounting to some 4.6 billion. In general, the EU imports mostly final and intermediate products. As shown in graph 24, animal products unfit for human consumption (such as animal bladders, guts and stomachs) are the outstanding products imported from China (13% share), products for which China is the principal supplier of the EU. Most of the gains in exports to China were for final and intermediate products, which went up by 33% and 20%, respectively. The top product categories sought after by Chinese buyers in 2012 were raw hides and fur skins, wines, cereal preparations, spirits and liqueurs. These five product groups accounted for nearly 50% of EU exports. Graph 24: Composition of EU imports from China in 2012 The biggest absolute gains in exports were recorded for cereal preparations (+ 240 million, or +67%) as well as raw hides and mink fur skins (+ 187 million; +23%). Pork posted an impressive growth of 71% (+ 149 million), as well as other meat and offal with a 61% gain (+ 177 million). China is the EU's main buyer of whey, accounting for around 30% of EU exports of this product. Since 2008, whey exports almost tripled in value and doubled in volume. In 2012 only, sales went up by over 40%. China is also buying a substantial amount of milk and cream powder, the exports of which have been constantly on the rise over the recent years (+17% in 2012). 13 Fruit and vegetable preparations (e.g. tomato paste), as well as fresh and chilled vegetables (e.g. garlic, mushrooms), are equally significant in Chinese sales to the EU. The EU also sends a significant volume of agricultural goods to Hong Kong. Sales to that destination, which in 2012 amounted to 4.2 billion (only +4% on 2011)

14 are largely re-exported to China. Again, the major traded categories of products are raw skins and fur skins, wines, cereal preparations, and pork as well as other meat and offal. 8. Conclusions As the WTO signals, trade in 2012 reflected the weak performance of developed economies. To some extent, the unfavourable global economic context has also had an impact on agricultural trade. After the slump in 2009, growth in agricultural trade of major agricultural partners continued, but at a slower pace brought also another proof that weather-related events can have an impact on the trade performance of agricultural players. After switching from a net importer position to a net exporter in 2010, the EU surplus in agricultural trade kept growing. In 2012 it even hit a new record in agricultural trade surplus: 12.6 billion. While its imports hardly budged, the exports put the EU just inches behind the US in the ranking of world top agricultural exporters. Depreciation of the EU against major currencies has helped the EU to boost its sales. Price declines of certain commodities (coffee, cotton, cocoa beans) as well as lower imports (e.g. sugar) also contributed to the higher surplus. EU demand for agricultural goods, as reflected by EU agricultural imports, does not show signs of strong growth. This can be attributed to the general weakness in the EU economy. However, the growth in exports, and a resulting all-time high surplus, indicates a continuing demand for EU products of developing economies. We have estimated that for 15 export products with the highest export gains, on average 44% of the increase of exports was price driven, the remaining 56% being quantity-driven. Alcoholic beverages and wines top the list of products with the biggest export gains. The EU also hit a new record in sales to the US, its top partner, accounting for some 13% of EU total agricultural exports. Although in 2012 the largest absolute gain in exports was achieved in the US ( 1.8 billion), the fastest growing markets were China and Saudi Arabia. The growing sales to Japan also indicate an increased interest of EU exporters in new, although geographically distant markets. As in previous years, in 2012 the EU continued to be the top importer of products from developing countries: 72% of EU imports came from developing countries, as opposed to just 43% for the five major developed players (Canada, US, Australia, New Zealand, Japan). When it comes to imports from the least developed countries, the EU scored even better. Although their share of EU agricultural imports is just 2.7%, it is almost seven times higher than the share of the "Big 5". The drought in the US, which caused a significant drop in volume sales of American maize to the world, provided an opportunity for Brazil to take over US shares in Asia and Middle East. The interesting story of reciprocal trade in ethanol between the US and Brazil continued in 2012, this time in favour of Brazil, which recorded a trade surplus with the US in that product. The fall in Argentinian production and exports of soya beans allowed the US to boost its exports of this product worldwide and in particular achieve record sales in China, which now ranks first among the US agricultural export partners. Russia gave a further boost to its commodity exports, which led to a reduction in its agricultural trade deficit. Chinese appetite for agricultural products is still unfaltering, as its already huge deficit has plunged even further. This newsletter does not necessarily represent the official views of the European Commission Contact: DG Agriculture & Rural Development: Agricultural Trade Policy Analysis unit. Tel: / agri-trade-analysis@ec.europa.eu. European Communities, 2013 Reproduction authorised provided the source is acknowledge 14
The latest MAP looks at developments in trade over the
 No. 1-11 May 211 MAP Monitoring Agri-trade Policy European Commission Directorate-General for Agriculture and Rural Development Global and EU agricultural exports rebound Editorial CONTENTS EU still a
The most recent publication of MAP (in June)
") Composition of agricultural trade of major WTO players 2 July 26 MAP - Brief Monitoring Agri-trade Policy European Commission Directorate-General for Agriculture and Rural Development The most recent publication
Composition of agricultural trade of major WTO players 2 July 26 MAP - Brief Monitoring Agri-trade Policy European Commission Directorate-General for Agriculture and Rural Development The most recent publication
This MAP takes a look behind the headline figures and
 No. 2-7 July 27 MAP Monitoring Agri-trade Policy European Commission Directorate-General for Agriculture and Rural Development The Changing Face of EU Agricultural Trade Editorial CONTENTS EU becomes the
Table 1. U.S. Agricultural Exports as a Share of Production, 1992
 Export markets are important to U.S. agriculture, absorbing a substantial portion of total production of many important commodities. During the last two decades there have been periods of expansion and
Global Agricultural Supply and Demand: Factors contributing to recent increases in food commodity prices
 Global Agricultural Supply and Demand: Factors contributing to recent increases in food commodity prices Ron Trostle Economic Research Service U.S. Department of Agriculture Agricultural Markets and Food
Commodity Market Monthly
 Commodity Market Monthly Research Department, Commodities Unit May 12, 216 www.imf.org/commodities commodities@imf.org Commodity prices surged 4.7 percent in April, with gains in all main indices, and
Minnesota Agricultural Exports
 Minnesota Agricultural Exports Minnesota ranked No. 4 in agricultural exports among all states 2018 Update 10 pages Prepared by Su Ye, Chief Economist Minnesota Department of Agriculture, Agricultural
Trading patterns: Global and regional perspectives
 Chapter V Trading patterns: Global and regional perspectives World merchandise trade in value terms fell by 3 per cent in 2016 following a 13 per cent slump recorded in 2015, with trade growth remaining
Since MAP was launched a little over a year ago not much
 No. 1-6 June 26 MAP Monitoring Agri-trade Policy European Commission Directorate-General for Agriculture and Rural Development The agricultural trade developments of major WTO players CONTENTS Editorial
agriculture, forestry & fisheries Department: Agriculture, Forestry and Fisheries REPUBLIC OF SOUTH AFRICA
 2014 agriculture, forestry & fisheries Department: Agriculture, Forestry and Fisheries REPUBLIC OF SOUTH AFRICA Economic Review of the South African Agriculture 2014 DEPARTMENT OF AGRICULTURE, FORESTRY
Adding Imports to Producer Price Measures for Food By Alberto Jerardo
 Adding Imports to Producer Price Measures for Food By Alberto Jerardo Paper presented at the International Agricultural Trade Research Consortium Analytic Symposium Confronting Food Price Inflation: Implications
WORLD AGRICULTURAL OUTLOOK
 WORLD AGRICULTURAL OUTLOOK FEBRUARY 21 FAPRI Food and Agricultural Policy Research Institute CENTER FOR AGRICULTURAL AND RURAL DEVELOPMENT IOWA STATE UNIVERSITY AMES, IOWA 511-17 TELEPHONE: 515.294.7519
Janvier D. Nkurunziza, Commodities Branch, UNCTAD
 United Nations Conference on Trade and Development 10th MULTI-YEAR EXPERT MEETING ON COMMODITIES AND DEVELOPMENT 25-26 April 2018, Geneva Recent trends and outlook on commodity markets By Janvier D. Nkurunziza,
High commodity prices and volatility what lies behind the roller coaster ride?
 Agricultural Markets Brief Brief nº 1 June 2011 High commodity prices and volatility what lies behind the roller coaster ride? 1. Is agricultural price volatility on the rise? 2. Is increased price volatility
Price developments in the EU
 Price developments in the EU Content 1. Development of world agricultural prices over time... 3 2. Price gap between EU and world prices... 7 3. Price volatility... 8 This document does not necessarily
System development and analysis of long-term projection on global food supply and demand used synthetic model
 System development and analysis of long-term projection on global food supply and demand used synthetic model Report on the Analysis of Baseline Projection Results March, 2012 Contents 1. Overview of
Are Competitors Free Trade Agreements Putting U.S. Agricultural Exporters at a Disadvantage?
 Are Competitors Free Trade Agreements Putting U.S. Agricultural Exporters at a Disadvantage? A M B E R WAV E S V O L U M E 9 I S S U E 2 8 Shutterstock E C O N O M I C R E S E A R C H S E R V I C E / U
Agriculture Commodity Markets & Trends
 Agriculture Commodity Markets & Trends Agenda Short History of Agriculture Commodities US & World Supply and Demand Commodity Prices Continuous Charts What is Contango and Backwardation Barge, Truck and
Commodity Market Monthly
 Commodity Market Monthly 1 Research Department, Commodities Team* October 9, 214 www.imf.org/commodities Commodity prices fell by 3.8 percent in September, with declines in most main indices. The decreases
Market Overview Vietnam
 MARKET ACCESS SECRETARIAT Global Analysis Report Market Overview Vietnam August 2016 MARKET SNAPSHOT Vietnam had a gross domestic product (GDP) of US$193.4 billion in 2015, which is expected to grow by
Commodity Market Monthly
 Commodity Market Monthly 1 Research Department, Commodities Team* January 1, 214 www.imf.org/commodities Commodity prices rose by 2.4 percent in December, with increases in most main indices. During 213,
China at a Glance. A Statistical Overview of China s Food and Agriculture. Fred Gale
 China at a Glance A Statistical Overview of China s Food and Agriculture Fred Gale The United States and China are at very different stages of development and have quite different resource endowments that
World Agricultural Outlook Board Interagency Commodity Estimates Committee Forecasts. Lockup Briefing June 11, 2014
 World Agricultural Outlook Board Interagency Commodity Estimates Committee Forecasts Lockup Briefing World Wheat Production Country or Region 2014/15 Million Tons World 714.0 701.6 0.7-1.7 United States
Fresh Deciduous Fruit (Apples, Grapes, & Pears): World Markets and Trade
: World Markets and Trade") United States Department of Agriculture Foreign Agricultural Service June 2015 Fresh Deciduous Fruit (Apples, Grapes, & Pears): World Markets and Trade FRESH APPLES World apple production in is estimated
United States Department of Agriculture Foreign Agricultural Service June 2015 Fresh Deciduous Fruit (Apples, Grapes, & Pears): World Markets and Trade FRESH APPLES World apple production in is estimated
Outlook for U.S. Agricultural Trade
 United States Department of Agriculture Electronic Outlook Report from USDA s Economic Research Service and Foreign Agricultural Service AES-99 May 25, 2017 Outlook for U.S. Agricultural Trade FY 2017
CANADIAN AGRIFOOD EXPORT PERFORMANCE AND THE GROWTH POTENTIAL OF THE BRICS AND NEXT- 11
 CANADIAN AGRIFOOD EXPORT PERFORMANCE AND THE GROWTH POTENTIAL OF THE BRICS AND NEXT- 11 CATPRN Trade Policy Brief 2012-05 December 2012 Alexander Cairns Karl D. Meilke Department of Food, Agricultural
Why Another Food. Commodity Price Spike?
 18 Why Another Food Commodity Price Spike? Ronald Trostle, rtrostle@ers.usda.gov Shutterstock Large and rapid increases have occurred for many food commodity prices during 21-11. Long-term production and
January 12, USDA World Supply and Demand Estimates
 January 12, 2017 - USDA World Supply and Demand Estimates Corn This month s U.S. corn outlook is for lower production, reduced feed and residual use, increased corn used to produce ethanol, and smaller
CURRENT SITUATION AND MEDIUM-TERM OUTLOOK FOR TROPICAL FRUITS
 CURRENT SITUATION AND MEDIUM-TERM OUTLOOK FOR TROPICAL FRUITS Prepared by the Sugar and Beverages Group Raw Materials, Tropical and Horticultural Products Service Commodities and Trade Division Food and
World Agricultural Outlook Board Interagency Commodity Estimates Committee Forecasts. Lockup Briefing April 9, 2014
 World Agricultural Outlook Board Interagency Commodity Estimates Committee Forecasts Lockup Briefing World Wheat Production Country or Region Million Tons World 656.5 712.5 8.5 United States 61.7 58.0-6.0
The relation between commodity markets and resource markets. (and the impact of Russian embargo) Trevor Donnellan FAPRI-Ireland Teagasc
 Trevor Donnellan FAPRI-Ireland Teagasc") The relation between commodity markets and resource markets (and the impact of Russian embargo) Trevor Donnellan FAPRI-Ireland Teagasc Overview Boom in Prices Relationship in Price Across Sectors Decline
The relation between commodity markets and resource markets (and the impact of Russian embargo) Trevor Donnellan FAPRI-Ireland Teagasc Overview Boom in Prices Relationship in Price Across Sectors Decline
China s Choice and its implication: Import meat or soybean
 China s Choice and its implication: Import meat or soybean Li Shantong, He Jianwu With the increase of population and households income level, China s demand on meat will continue to rise rapidly. However,
Agriculture: expansions highlighted developments
 Agriculture: expansions highlighted developments A broad-based expansion in livestock production and another bumper grain harvest highlighted agricultural developments in 1976. Meat production rose 9 percent
World Agricultural Outlook Board Interagency Commodity Estimates Committee Forecasts. Lockup Briefing July 11, 2014
 World Agricultural Outlook Board Interagency Commodity Estimates Committee Forecasts Lockup Briefing World Wheat Production Country or Region estimate 2014/15 forecast June 11 Million Tons Percent Percent
World Agricultural Supply And Demand Estimates
 United States Department of Agriculture Office of the Chief Economist World Agricultural Supply And Demand Estimates Agricultural Marketing Service Economic Research Service Farm Service Agency Foreign
U.S.-Cuba Agricultural Trade: Past, Present, and Possible Future
 U.S.-Cuba Agricultural Trade: Past, Present, and Possible Future Bryce Cooke USDA Economic Research Service Steven Zahniser and Nathan Childs USDA Economic Research Service Presentation for C-FARE Program
Emerging Global Trade Patterns: USDA s Long-term Agricultural Projections
 Emerging Global Trade Patterns: USDA s Long-term Agricultural Projections Midwest Agriculture s Ties to the Global Economy Federal Reserve Bank of Chicago November 28, 217 Chicago Jim Hansen, Ph.D. USDA,
Required Report - public distribution Date: 2/24/2005 GAIN Report Number: KE5005
 GAIN Report Global Agriculture Information Network Template Version 2.08 Required Report - public distribution Date: 2/24/2005 GAIN Report Number: KE5005 KE5005 Kenya Food Processing Ingredients Sector
Market Fundamentals. August October 2017
 Market Fundamentals August October 2017 1 Safe Harbor Statement & Disclosures This presentation includes forward-looking comments subject to important risks and uncertainties. It may also contain financial
African Agriculture Through a Trade Lens
 Integrating African Agriculture into Global Markets Moving African Agriculture Up the Value Chain African Agriculture Through a Trade Lens By Christophe Bellman, Programmes Director, International Centre
Food Price Outlook,
 Provided By: Food Price Outlook, 2017-18 This page provides the following information for August 2017: Consumer Price Index (CPI) for Food (not seasonally adjusted) Producer Price Index (PPI) for Food
AUSTRALIAN AGRICULTURE TRADE PERFORMANCE 2016/17
 AUSTRALIAN AGRICULTURE TRADE PERFORMANCE 216/17 AUSTRALIAN AGRICULTURE TRADE PERFORMANCE 216/17 Crops 13.9 billion, increased by 3,714m (page 7) Beef and cattle 9.5 billion, decreased by 1,885m (page 8)
A global meat industry outlook
 A global meat industry outlook Capturing business opportunities in a fast changing world Copenhagen Nan-Dirk Mulder, 18 February 2017 Rabobank international introduction and global network of branches
Production, yields and productivity
 Production, yields and productivity Contents 1. Production development... 3 2. Yield developments... 6 3. Total factor productivity (TFP)... 8 4. Costs of production in the EU... 1 This document does not
GTAP Research Memorandum No. 28
 Development of the GTAP Land Use Data Base for 2011 By Luis Peña-Lévano Farzad Taheripour Wallace E. Tyner GTAP Research Memorandum No. 28 June 2015 Development of the GTAP Land Use Data Base for 2011
Milk and Milk Products: Price and Trade Update
 Milk and Milk Products: Price and Trade Update International dairy prices December 2017 1 The FAO Dairy Price Index d 204.2 points in November, up 11.2 points (5.8 percent) from January 2017. At this level,
Winter Short Term Outlook for arable crops, meat and dairy markets in the European Union HIGHLIGHTS. Contents. 1. Macroeconomic outlook
 Winter 2014 Contents 1. Macroeconomic outlook 2. Arable crops 3. Meats 4. Dairy 5. Uncertainties 6. Statistical annex 7. Methodology This publication presents the short term outlook for the arable crop,
THE AGRICULTURE AND FOOD INDUSTRY IN RUSSIA: 2015 FACTS AND FIGURES
 THE AGRICULTURE AND FOOD INDUSTRY IN RUSSIA: 2015 FACTS AND FIGURES 2016, April. Russian Direct Investment Fund TABLE OF CONTENTS 4 18 32 RUSSIA IN THE GLOBAL AGRICULTURE AND FOOD INDUSTRY THE AGRICULTURE
Livestock products: Domestic and international market a view of 2015
 Livestock products: Domestic and international market a view of 2015 Alina Zharko Association Ukrainian agribusiness club Dairy products Production of milk and dairy products in Ukraine Dairy products
Argentina. Poultry and Products Annual. Argentina Poultry & Products Annual
 THIS REPORT CONTAINS ASSESSMENTS OF COMMODITY AND TRADE ISSUES MADE BY USDA STAFF AND NOT NECESSARILY STATEMENTS OF OFFICIAL U.S. GOVERNMENT POLICY Required Report - public distribution Date: GAIN Report
VA AGRICULTURE & FORESTRY: BUILDING DOMESTIC CAPACITY, EXPORTING TO THE WORLD
 VA AGRICULTURE & FORESTRY: BUILDING DOMESTIC CAPACITY, EXPORTING TO THE WORLD VIRGINIA ASSOCIATION OF COUNTIES 2014 ANNUAL MEETING VIRGINIA ASSISTANT SECRETARY OF AGRICULTURE & FORESTRY CARRIE H. CHENERY
China s Agricultural Development and Implications for California Agriculture
 China s Agricultural Development and Implications for California Agriculture David Roland-Holst Department of Agricultural and Resource Economics College of Natural Resources UC Berkeley dwrh@berkeley.edu
ORGANIC CONSUMERS, MARKETS AND OPPORTUNITIES IN CANADA
 ORGANIC CONSUMERS, MARKETS AND OPPORTUNITIES IN CANADA Presentation to TFO Canada Trade Representative Seminar Nathalie Doré June 4, 2009 Agriculture & Agri-Food Canada Today Organic Production Consumer
A European Food Prices Monitoring Tool
 EUROPEAN COMMISSION EUROSTAT Directorate G: Business Statistics Unit G-6: Price statistics Luxembourg, October 2009 A European Food Prices Monitoring Tool A first design A European Food Prices Monitoring
Canadian Agriculture and International Trade Negotiations. February 5, 2014
 Canadian Agriculture and International Trade Negotiations February 5, 2014 Trade is essential for the agricultural sector Sustained growth of the sector depends on Canada s ability to remain competitive
North Carolina Exports by Quarter (in constant 2Q 2013 dollars)
") P. 1/6 in Billions in Billions 1 North Carolina Trade Report 1, First Half of 2013 Exports from North Carolina play an increasingly important role in the state s economic recovery and job growth. That
P. 1/6 in Billions in Billions 1 North Carolina Trade Report 1, First Half of 2013 Exports from North Carolina play an increasingly important role in the state s economic recovery and job growth. That
Food Industry of the Republic of Kazakhstan
 JSC Rating Agency of the Regional Financial Center of Almaty 136 Dostyk ave., 9 th floor, office 904, 050051 Almaty, The Republic of Kazakhstan Food Industry of the Republic of Kazakhstan Analytical service
ECONOMIC BULLETIN Q2 2017
 November 2017 ECONOMIC BULLETIN Q2 2017 Steady growth in production, sales and exports Food and drink industry Growth in production and sales In Q2 2017, EU food and drink industry production increased
John Deere. Committed to Those Linked to the Land. Market Fundamentals. Deere & Company June/July 2014
 John Deere Committed to Those Linked to the Land Market Fundamentals Deere & Company June/July 2014 Safe Harbor Statement & Disclosures This presentation includes forward-looking comments subject to important
China - Commodities. Dragon shift 4Q2012. When the biggest nation building ends. Institutional Equities
 Institutional Equities Dragon shift 4Q212 When the biggest nation building ends Our previous INCH reports Tiger Tong (65) 6511 6169 Contents Dragon shift... 1 The world s biggest nation building exercise
Agriculture: farm income recovers
 Agriculture: farm income recovers Farm earnings rose substantially last year, breaking a four-year slide. The index of prices received by farmers averaged a record 209 (1967=100). That was 14 percent over
Rice Outlook and Baseline Projections. University of Arkansas Webinar Series February 13, 2015 Nathan Childs, Economic Research Service, USDA
 Rice Outlook and Baseline Projections University of Arkansas Webinar Series February 13, 2015 Nathan Childs, Economic Research Service, USDA THE GLOBAL RICE MARKET PART 1 The 2014/15 Global Rice Market:
The sheep and sheep meat trade market. Second EU Sheep Meat Forum Brussels, February 25, 2016
 The sheep and sheep meat trade market Second EU Sheep Meat Forum Brussels, February 25, 2016 Partnering your agribusiness development Market research 45 years Focused on agribusiness Worldwide coverage
The dynamics of global food and agribusiness
 Welcome to the world of Rabobank! The dynamics of global food and agribusiness Adrie Zwanenberg NUFFIELD Global Head F&A Research 20 February 2006 2 The world of Rabobank Food & agribusiness: a global
IFA Medium-Term Fertilizer Outlook
 IFA Medium-Term Fertilizer Outlook 2015 2019 Olivier Rousseau IFA Secretariat Afcome 2015 Reims, France October 21 st - 23 rd 2015 Outlook for World Agriculture and Fertilizer Demand Economic and policy
Do the BRICs and Emerging Markets Differ in their Agrifood Trade?
 Do the BRICs and Emerging Markets Differ in their Agrifood Trade? Zahoor Haq Post-Doctoral Fellow, Department of Food, Agricultural and Resource Economics, University of Guelph, Canada and Lecturer, WFP
Fresh vs Processed tomato consumption (2)
") Fresh vs Processed tomato consumption (2) The comparative study of consumption according to the fresh or table-tomato and processed categories presented last month has led us to differentiate between five
Fresh vs Processed tomato consumption (2) The comparative study of consumption according to the fresh or table-tomato and processed categories presented last month has led us to differentiate between five
Future perspectives and challenges for European agriculture
 Agriculture and Rural Development Future perspectives and challenges for European agriculture Seminar at PRIMAFF, Tokyo, 2 February 2017 Pierluigi Londero Head of Unit Analysis and outlook DG Agriculture
Market opportunities for Queensland agribusiness from FTAs with China, Japan and South Korea. Queensland Production
 Market opportunities for Queensland agribusiness from FTAs with China, Japan and South Korea Queensland Production Scope Australia recently signed Free Trade Agreements (FTAs) with China (June 2015), Japan
International Grain Price Prospects and Food Security
 USA Ukraine 123 North Post Oak Lane 4A Baseyna Street Suite 410 Mandarin Plaza, 8th floor Houston, Texas, 77024, USA Kyiv, 01004, Ukraine Tel: +1 (713) 621-3111 Tel: +380 (44) 284-1289 www.bleyzerfoundation.org
Indian Soybean meal- Demand /Supply. Pawan Kumar, Consultant, USSEC
 Indian Soybean meal- Demand /Supply Pawan Kumar, Consultant, USSEC USSEC INTRODUCTION We Represent U S farmers U S Industry U S Department of Agriculture We work on finding new applications of soy & Implement
CORN: DECLINING WORLD GRAIN STOCKS OFFERS POTENTIAL FOR HIGHER PRICES
 CORN: DECLINING WORLD GRAIN STOCKS OFFERS POTENTIAL FOR HIGHER PRICES OCTOBER 2000 Darrel Good Summary The 2000 U.S. corn crop is now estimated at 10.192 billion bushels, 755 million (8 percent) larger
Fresh Peaches and Cherries: World Markets and Trade
 United States Department of Agriculture Foreign Agricultural Service Fresh Peaches and Cherries: World Markets and Trade Fresh Peach/Nectarine: 2014/15 Highlights Global production in 2014/15 of peaches/nectarines
I. The world economy and trade in 2013 and early 2014
 WORLD TRADE REPORT I. The world economy and trade in and early Growth in world merchandise trade remained subdued in at. per cent, nearly identical to the previous year s increase of. per cent. The increases
Summer Short-Term Outlook for EU arable crops, dairy and meat markets in 2016 and 2017 HIGHLIGHTS. Contents. 1. Macroeconomic outlook
 Summer 2016 Fotolia Contents 1. Macroeconomic outlook 2. Arable crops 3. Dairy 4. Meat 5. Statistical annex 6. Methodology This publication presents the short term outlook for the arable crops, meat and
The World Cotton Situation * Terry Townsend, Executive Director Armelle Gruere, Statistician. Projections to 2020
 INTERNATIONAL COTTON ADVISORY COMMITTEE 1629 K Street NW, Suite 72, Washington, DC 26 USA Telephone (22) 463-666 Fax (22) 463-695 e-mail secretariat@icac.org The World Cotton Situation * Terry Townsend,
PRICE AND QUALITY COMPETITION STRATEGIES OF POLISH AGRI-FOOD PRODUCTS EXPORTERS
 PRICE AND QUALITY COMPETITION STRATEGIES OF POLISH AGRI-FOOD PRODUCTS EXPORTERS Łukasz Ambroziak Abstract The aim of the paper is to present changes in competitive position of Polish agri-food exports
The European chemical industry Facts & Figures 2013
 The European chemical industry Facts & Figures 2013 Overview Chemical Industry Profile World chemicals sales: geographic breakdown 6 World chemicals sales by region 8 Chemicals sales by country: top 30
Climate Change, trade and production of energy-supply goods: The need for levelling the playing field Veena Jha
 Climate Change, trade and production of energy-supply goods: The need for levelling the playing field Veena Jha Presentation at the WTO workshop on environmental goods and services. This presentation is
Beef - UK Cattle prices continue to strengthen Young bulls proving to be adaptable
 JULY 2015 JUNE 2017 Beef - UK Cattle prices continue to strengthen The cattle trade continued its bullish feel recorded through April. The GB all prime average moved up almost 3p on the previous month
Background on U.S. Agricultural Policy: Food Security Objectives and Trade Implications
 Background on U.S. Agricultural Policy: Food Security Objectives and Trade Implications Workshop Post Bali Agricultural and Trade Policy Options: Focus on China 23 October 2014 jason.hafemeister@fas.usda.gov
Export performance after depreciation
 Export performance after depreciation By Leo Bonato, Sean Comber and John McDermott, Economics Department Many commentators have been disappointed by the recent performance of the export sector. The New
Estonia FooD and FooD safety
 Estonia FOOD AND FOOD SAFETY Cuisine is an important part of national culture. Every country has its own distinct cuisine, national dishes and food items. Throughout history, traditional Estonian food
In 2013, global production
 48 th Census of World Casting Production Steady Growth in Global Output Worldwide casting production continued to grow in 2013, up more than 3.4 million metric tons, an increase of 3.4% in comparison to
Iowa Farm Outlook. More Beef Expansion Ahead. March 2018 Ames, Iowa Econ. Info. 2095
 Iowa Farm Outlook 0BDepartment of Economics March 2018 Ames, Iowa Econ. Info. 2095 More Beef Expansion Ahead The numbers in USDA s recently released annual Cattle inventory report confirm that beef herd
INFORMATION NOTE, MAY
 INFORMATION NOTE, MAY 217 How do Trade Distortions Affect Markets for Farm Goods? ICTSD.ORG Key findings Five sectors capture around 75 percent of the total absolute value of single commodity support:
The Australian Food Industry. An Introduction
 The Australian Food Industry An Introduction content: The Australian Food Industry has developed in response to changes in our physical, social, technological, economic and political environment. This
Organic Agriculture in Moldova An Opportunity for Greening the Economy
 Organic Agriculture in Moldova An Opportunity for Greening the Economy wwww.green-economies-eap.org Organic Agriculture in Moldova: An Opportunity for Greening the Economy Activities of the agricultural
IMPACT OF DROUGHT ON CROP PRODUCTION AND THE FOOD VALUE CHAIN
 IMPACT OF DROUGHT ON CROP PRODUCTION AND THE FOOD VALUE CHAIN July 2016 BRANCH: POLICY, PLANNING AND MONITORING AND EVALUATION TABLE OF CONTENTS TOPIC Page 1. INTRODUCTION 1 2. MAIZE 1 3. WHEAT 7 4. OTHER
1 Although the relative export price on a contract currency basis should normally be used, the dollar-based
 Part II Strengthening Japan s competitiveness by taking advantage of its robustness Chapter 1 Analysis: Japan s competitive advantage in cross-border activities Section 1 Competitiveness in exports 1.
A lost opportunity? Ian Sheldon Department of Agricultural, Environmental and Development Economics
 Failure in the global trade talks: A lost opportunity? Ian Sheldon Department of Agricultural, Environmental and Development Economics Presentation prepared for LEAD - Class XI Walnut Creek, OH, In the
Spring Short-term outlook for EU agricultural markets in 2018 and 2019 HIGHLIGHTS. Contents. 1. Macro-economic outlook. 2.
 Spring 218 Contents 1. Macro-economic outlook 2. Arable crops 3. Olive oil 4. Dairy 5. Meat 6. Statistical annex 7. Methodology This report presents the outlook for 218-219 for arable crops and meat and
SOUTH AMERICAN SOYBEAN CROP ESTIMATE INCREASED
 April 14, 2000 Ames, Iowa Econ. Info. 1787 SOUTH AMERICAN SOYBEAN CROP ESTIMATE INCREASED USDA s World Agricultural Outlook Board raised its estimate of combined Brazilian and Argentine soybean production
Trade Impacts of Common Agricultural Policy
 Trade Impacts of Common Agricultural Policy Alan Matthews, Luca Salvatici, and Margherita Scoppola Selected Paper prepared for presentation at the International Agricultural Trade Research Consortium s
OUTLOOK FOR US AGRICULTURE
 Agricultural Outlook Forum 216 OUTLOOK FOR US AGRICULTURE Robert Johansson Chief Economist 25 February 216 Fig 2 Main themes for 216 1. The macroeconomy is weighing on trade, but there are reasons for
Statistics Overview. Vancouver Fraser Port Authority
 Statistics Overview Vancouver Fraser Port Authority 2017 Table of contents Overview 1 Foreign vessel traffic 2 Cargo summary by sector 2 Bulk sector 3 Container units and TEUs 4 Container sector 5 Breakbulk
Iowa Farm Outlook. May 2015 Ames, Iowa Econ. Info Several Factors Supporting, Pressuring Fed Cattle Prices
 Iowa Farm Outlook 0BDepartment of Economics May 2015 Ames, Iowa Econ. Info. 2061 Several Factors Supporting, Pressuring Fed Cattle Prices All market classes of beef cattle are at record high levels for
April 9, Dear Subscriber:
 April 9, 2014 Dear Subscriber: We will be adding material to this shell letter after the report is released on April 9, 2014 at 11:00 a.m CST. Be sure to click back on the link often for the latest information.
9.1 billion René van Sloten Executive Director Industrial Policy
 EU28 Cefic Number of companies Turnover 28,329 507 billion Capital spending Direct employees National contact 21.7 billion 1,140,000 R&D investment 9.1 billion René van Sloten Executive Director Industrial
Can you Forecast a Commodity? Nick Peksa Reading 07 th December 2010
 Can you Forecast a Commodity? Nick Peksa Reading 07 th December 2010 Mintec Limited MINTEC LTD was founded in 1982 and provides Commodity Information, Training and Support Services to major companies across