SMAPVEX12 Database Report
|
|
|
- Gabriella Fowler
- 6 years ago
- Views:
Transcription

1 SMAPVEX12 Database Report December 18, 2012 Heather McNairn 1*, Tom J. Jackson 2, Grant Wiseman 3, Stephane Bélair 4, Aaron Berg 5, Paul Bullock 6, Andreas Colliander 7, Michael H. Cosh 2, Seung-Bum Kim 7, Ramata Magagi 8, Mahta Moghaddam 9 1 Agriculture and Agri- Food Canada, Science and Technology Branch, Ottawa, ON K1A 0C6, CANADA 2 USDA-ARS Hydrology and Remote Sensing Lab, Beltsville, MD 20705, USA 3 Agriculture and Agri- Food Canada, Science and Technology Branch, Winnipeg, MB R3C 3G7, CANADA 4 Environment Canada, Meteorological Research Branch, Dorval, QC H9P 1J3, CANADA 5 University of Guelph, Department of Geography, Guelph, ON N1G 2W1, CANADA 6 University of Manitoba, Department of Soil Science, Winnipeg, MB R3T 2N2, CANADA 7 Jet Propulsion Laboratory, California Institute of Technology, Pasadena, CA 91109, USA 8 Université de Sherbrooke, Département de géomatique appliquée, Sherbrooke, QC J1K 2R1, CANADA 9 University of Michigan, Electrical Engineering and Computer Science Department, Ann Arbor, MI , USA *corresponding author: Agriculture and Agri- Food Canada, Science and Technology Branch, Ottawa, ON K1A 0C6, CANADA heather.mcnairn@agr.gc.ca
2 2
3 Table of Contents 1. Study Area Agriculture Forestry Permanent in situ soil moisture network Temporary soil moisture network Collection of Soil and Vegetation Data Agriculture Cropland Soil Moisture and Temperature Surface Roughness Cropland Vegetation Vegetative Structure Forested Sites Soil Moisture Surface Roughness Forest Vegetation Airborne Imagery Passive Active L-band Sensor (PALS) Data Collection UAVSAR on NASA G-III Satellite Imagery Appendix A. Calendar of all data collected during SMAPVEX Appendix B. SMAPVEX12 participants
4 Table of Figures Figure 1. Location of the SMAPVEX12 study area (red) with major towns (green stars) and highways (black)... 6 Figure 2. Soil texture map of the SMAPVEX12 study area... 7 Figure 3. Fifty-five agricultural fields (red), labelled 11 to 125, used during the SMAPVEX12 campaign... 8 Figure 4. Sixteen sampling points (red) used in each of the 55 agricultural fields (orange), during the SMAPVEX12 campaign Figure 5. Spacing between soil moisture sampling points... 9 Figure 6. Forestry sampling sites (red) used during the SMAPVEX12 campaign Figure 7. Location of Manitoba in situ soil moisture sensors within the Canadian portion of the Red River watershed Figure 8. Location of the AAFC Manitoba in situ soil moisture network (red star) Figure 9. Schematic of probe location within each soil pit for AAFC in situ monitoring sites Figure 10. Site installation of AAFC in situ soil moisture sites Figure 11. Spatial location of weather stations; MAFRI & MWS (red), Environment Canada (purple) and WeatherFarm (blue) Figure 12. USDA soil moisture station in a soybean field Figure 13. Configuration for a USDA CR206 datalogger with Hydra probe Figure 14. Hand held Stevens Hydra probe with PDA Figure 15. Location of replicate soil moisture measurements at each site Figure 16. Soil core sample Figure 17. Temperature at 5 and 10 cm (left) and at the surface (right) Figure 18. An example of the placement of the profilometer Figure 19. Measurement of surface roughness using the pin profiler Figure 20. Biomass measurements (left) and drying trailer (right) Figure 21. Fisheye photo for Field 34 (June 16, soybeans) Figure 22. Location of the 14 points for crop scan measurements and LAI photos Figure 23. Canola field 124 on June 7 (left) and June 16 (right), Figure 24. Schematic representation of the forestry soil moisture transects Figure 25. Measurement of surface roughness using the pin profiler over the forested sites F1 (left) and F2 (right) Figure 26. Example of tree flagging Figure 27. Measurement of fractional ground cover and understory height within a quadrat Figure 28. Trunk height and diameter measurements on an aspen Figure 29. FieldFox with dielectric probe and drill bit hole to facilitate full probe contact Figure 30. DHC-6 Twin Otter International (left) and NASA Gulfstream III (right) Figure 31. Low altitude PALS flight lines (red) and high altitude lines (yellow) Figure 32. The PALS radiometer data in H polarization for June 12 (left) and July 3 (right) Figure 33. SMAPVEX12 UAVSAR Coverage Boxes Figure 34. A UAVSAR Imagery acquired near Carman (Manitoba) on July 17th, Figure 35. Imagery acquisition coverage for RapidEye and SPOT-4/5 sensors Figure 36. Coverage for RADARSAT-2 imagery Figure 37. TerraSAR-X coverage in ascending (left) and descending (right) modes
5 List of Tables Table 1. Location of AAFC permanent and MAFRI temporary in situ stations Table 2. Field and crop type for each USDA soil moisture temporary station Table 3. Dates for soil moisture, vegetation and surface roughness data collection Table 4. Field number and crop type of vegetation structure sample fields Table 5. Imagery acquisition dates for the PALS and UAVSAR instruments during SMAPVEX Table 6. Description of PALS Table 7. Geometric features of PALS data acquisitions Table 8. Description of the UAVSAR Table 9. Imagery acquisition dates for RapidEye and SPOT-4/5 sensors Table 10. Imagery acquisition dates for RADARSAT-2 imagery during SMAPVEX Table 11. Imagery acquisition dates for TerraSAR-X imagery


6 1. Study Area The study area for the SMAPVEX12 campaign is located in south central Manitoba, Canada centered on the town of Elm Creek (98 o 0 23 W, 49 o N) (Figure 1). The site is 12.8 km wide by 70 km long and was selected for a variety of reasons. The soil texture varies greatly across the site with heavy clays in the east, which sharply transition to loamy fine sands in the west over a distance of a few kilometers (Figure 2). This abrupt change in soil texture provides a large range of soil moisture levels within a small spatial footprint. Agriculture and Agri-Food Canada (AAFC) has a permanent in situ soil moisture station network in the area, and the data from this network was available to SMAPVEX12 participants. AAFC has conducted numerous remote sensing research studies in this area and thus has developed a working relationship with many of the producers in this region. The selected area covers a range of annual and perennial crops typical of the region and of interest to the SMAPVEX12 team. In addition, the study area contains some wetland and forest land cover. Figure 1. Location of the SMAPVEX12 study area (red) with major towns (green stars) and highways (black) 6
.")
7 Figure 2. Soil texture map of the SMAPVEX12 study area 1.1 Agriculture In 2011, the dominant annual crops in the area included cereals (32.2% of area), canola (13.2%), corn (7.0%) and soybeans (6.7%). Approximately 16.4% of the study area was occupied by perennial cover (grassland and pasture). For the purposes of SMAPVEX12, fifty-five agricultural fields were selected with the following crop type distribution: 15 soybean, 1 bean, 6 canola, 10 corn, 14 spring wheat, two winter wheat, 1 forage and 6 pasture (Figure 3). Due to market and environmental conditions early in the season, in 2012 greater acreages of beans were planted than typical of this region. Consequently a large number of soybean fields were selected for the SMAPVEX12 campaign. 7

8 Figure 3. Fifty-five agricultural fields (red), labelled 11 to 125, used during the SMAPVEX12 campaign Soil moisture varies significantly across the landscape. In order to capture soil moisture conditions representative of each of the SMAPVEX12 fields, multiple sampling was required. Thus for each field, soil moisture was measured at sixteen sampling points, with three replicate measurements at each of these sample points. For ease of access and navigation, these 16 sample points were arranged in two transects of 8 points running parallel to crop row direction (Figure 4). The location of each sample point was pre-loaded into handheld GPS devices so that crews could easily navigate to each point. For the most part, the positioning of the transects meant that moisture conditions were measured along the full extent of the field. Transects were also positioned to avoid edge effects were soil and vegetation conditions may not be typical of the field due to management practices (Figure 5). 8
 used in each of the 55 agricultural fields (orange), during the SMAPVEX12 campaign.")

, Bur Oak (Quercus macrocarpa), and Balsam Poplar")
9 Figure 4. Sixteen sampling points (red) used in each of the 55 agricultural fields (orange), during the SMAPVEX12 campaign. Figure 5. Spacing between soil moisture sampling points 1.2 Forestry The forestry team utilized 4 sampling sites within the SMAPVEX12 study area, each with a varying degree of tree cover (Figure 6). Main tree species included Trempling Aspen (Populus tremuloides), Bur Oak (Quercus macrocarpa), and Balsam Poplar (Populus balsamifera) on soil textures ranging from clay to loamy fine sand. During SMAPVEX12 planning, five sites were selected. However after visiting site F4, the forest team decided to drop this sample site as the forest cover was too sparse and land cover too varied. 9


10 Figure 6. Forestry sampling sites (red) used during the SMAPVEX12 campaign 1.3 Permanent in situ soil moisture network Diverse soil moisture networks are present in the agricultural regions of southern Manitoba, operated by the University of Manitoba, AAFC, and Manitoba Agriculture, Food and Rural Initiatives (MAFRI). The AAFC network covers a small area in and around the Brunkild sub-watershed, whereas the University of Manitoba sites are dispersed across a larger area (Figure 7). Figure 7. Location of Manitoba in situ soil moisture sensors within the Canadian portion of the Red River watershed 10


11 In 2011, AAFC installed an in situ soil moisture monitoring network in and around the Brunkild watershed. The network was established to provide a direct source of near-real time information on soil moisture conditions in an agriculturally risk-prone watershed, and to provide a data set that can be used holistically with remotely-sensed and modelled data products for the calibration and validation of these products. The network was designed based on geostatistical principles to capture the maximum soil variability within the Red River watershed. The soils and landscape particular for this region led to the location of the sensors along a gradient in soil texture classes (Figure 8). The network consists of nine monitoring stations, distributed to capture this variance in soil classes and thus soil moisture. At each station three Stevens Hydra probes have been placed at each of four depths 5, 20, 50 and 100 cm. At the surface, three probes have been placed vertically to capture the 0-6 cm integrated soil moisture, in addition to the three probes buried horizontally at 5 cm. This yields in total, 15 soil moisture measurements per station. Each probe records soil moisture percentage (using Stephen s default dielectric conversion model), soil temperature in Celsius and real soil dielectric permittivity. Each station is also equipped with a tipping bucket rain gauge (Campbell Scientific 700). Data are logged using an Adcon A755 telemetry unit which transmits measurements to a base station in Ottawa, Ontario at 30 minute intervals. Measurements are collected on a 30 minute time scale for all variables. Figure 8. Location of the AAFC Manitoba in situ soil moisture network (red star) Figure 9. Schematic of probe location within each soil pit for AAFC in situ monitoring sites 11


12 Figure 10. Site installation of AAFC in situ soil moisture sites All AAFC soil moisture stations are located within or on the edge of cultivated agricultural fields, with the station set up to capture data year round, without removal of equipment to accommodate land management activities. During installation, soil cores were collected at the location of each probe. Soil cores were preserved for soil moisture dry down calculations and soil texture and bulk density analysis. The location of these AAFC permanent stations, relative to the SMAPVEX12 fields, is provided in Table 1. For two of the nine AAFC stations, landowner permission was not granted for the SMAPVEX experiment. Thus only seven of the nine stations are situated within a SMAPVEX12 field, although data from all nine stations was collected during the campaign. In addition to these permanent stations, four MAFRI stations were installed for the duration of the field campaign. These temporary MAFRI stations had sensors installed at the same depths as the AAFC permanent station, but with only one probe installed per depth. Table 1. Location of AAFC permanent and MAFRI temporary in situ stations AAFC/MAFRI In- Situ Station SMAPVEX12 Field AAFC-1 92 AAFC-2 93 AAFC-3 73 AAFC-4 65 AAFC-5 24 AAFC-7 44 AAFC-9 32 MAFRI-1 11 MAFRI-2 22 MAFRI-3 85 MAFRI-4 F3 12
.")
13 Also, several meteorological stations are located within the agricultural regions of Manitoba, established through provincial government agencies, such as MAFRI and Manitoba Water Stewardship, the University of Manitoba, federal government agencies, such as AAFC and Environment Canada, and private companies such as WeatherFarm, WeatherBug and Weather Innovations Inc. (Figure 11). Most stations record typical meteorological variables including air temperature, total precipitation, wind speed and relative humidity, with some providing additional data, such as net radiation, snow accumulation and soil temperature. Data from Environment Canada can be downloaded station by station from their website ( Data from AAFC networks are distributed internally within AAFC. Current conditions data from MAFRI stations can be displayed on the MAFRI website ( Note that many stations are shared between the University of Manitoba, MAFRI, AAFC and EC. Private weather networks are available through a subscription service. Figure 11. Spatial location of weather stations; MAFRI & MWS (red), Environment Canada (purple) and WeatherFarm (blue) 1.4 Temporary soil moisture network The U.S. Department of Agriculture provided forty soil moisture sensors which were installed in SMAPVEX12 fields for the duration of the experiment (Table 2). 13

14 Table 2. Field and crop type for each USDA soil moisture temporary station Field Crop USDA Station Field Crop USDA Station 112 Soybeans Canola Winter Wheat 2 85 Wheat Soybeans Soybeans Corn 4 51 Soybeans Corn 5 63 Soybeans Soybeans 6 61 Canola Soybeans 7 64 Soybeans Oats 8 74 Wheat Soybeans 9 74 Soybeans 28 F2 Forested Canola Wheat Wheat Corn Corn Canola Soybeans Corn Soybeans Corn Wheat Pasture Pasture Canola Wheat Soybeans Canola 37 F4 Forested Soybeans 38 F1 Forested Wheat Corn Wheat 40 These stations consisted of a Stevens Hydra soil moisture sensor, a data logger, and a solar panel for continued operation. Stations were removed from SMAPVEX fields prior to harvest in early August for winter wheat fields, late August for soybean, spring wheat, oats, canola forage and pasture fields and mid-september for corn fields. Data were downloaded from data loggers a day after removal from the field. Source: Mike Cosh, 2012 Figure 12. USDA soil moisture station in a soybean field 14
15 The USDA temporary soil moisture stations were placed a quarter of the way along the row, facing upslope if a slope was present. The center of the probe was installed horizontally at a 5 cm depth. These parameters yield soil moisture readings at a depth of approximately 3-7 cm. Placement ensured that there were no obstructions above the sensor, other than natural vegetation. Thus no antennas, solar panels or enclosures were within 1 meter of the surface (Figure 13). Source: Michael Cosh, 2012 Figure 13. Configuration for a USDA CR206 datalogger with Hydra probe The sensor recorded soil moisture and soil temperature measurements. Several factors potentially influence the accuracy of the readings, with the most significant factor being the installation itself. Soil disturbance associated with the installation can either increase or decrease soil infiltration, affecting the representativeness of the moisture reading; however, this degree of variation typically does not represent significant alteration to recorded data values. Battery voltage is a second factor which can affect the accuracy of the sensors, but this was not found to be an issue during the course of the SMAPVEX12 campaign. While one or two of the sites were periodically disturbed by cattle, usually only the post and datalogger were displaced, while the sensor was left undisturbed. 2. Collection of Soil and Vegetation Data A critical pre-launch activity for the SMAP mission is to acquire and process surface validation data to calibrate, test, and improve models and algorithms for SMAP soil moisture retrieval. To assist with this objective, soil and vegetation variables known to influence microwave emissions and scattering were targeted for measurement. These variables included soil moisture, surface and sub-surface temperature, surface roughness, vegetation biomass and water content, and vegetation structure. Soil and vegetation data were collected by field crews on the 55 cropland fields and 4 forest sites beginning on June 7 th and ending on July 19 th, Crews were provided two days of training prior to the commencement of the experiment. Sampling days were dedicated to either soil moisture or vegetation/surface roughness depending on whether aircraft flights took place (Table 3). During flight days, crews measured soil moisture and surface/sub-surface temperature on the cropland and forest sites. During non-flight days crews measured surface roughness and vegetation parameters such as biomass, reflectance and Leaf Area Index. The crop structure team operated independently, collecting data during flight and non-flight days. Down days were due to rain events or were used to give crews a 15
16 rest. On soil moisture days, crews were deployed to the field at approximately 6:30 AM to allow for collection of soil moisture measurements coincident with flight overpasses. Table 3. Dates for soil moisture, vegetation and surface roughness data collection. Soil Moisture Vegetation Roughness June, 7 June, 11 June, 10 June, 12 June, 13 June, 11 June, 15 June, 16 June, 12 June, 17 June, 18 June, 13 June, 22 June, 21 June, 15 June, 23 June, 24 June, 16 June, 25 June, 28 June, 17 June, 27 June, 30 June, 18 June, 29 July, 7 June, 19 July, 3 July, 9 June, 21 July, 5 July, 16 June, 24 July, 8 July, 18 June, 30 July, 10 July, 7 July, 13 July, 14 July, 17 July, 19 The soil and vegetation sampling approaches deviated for the agriculture cropland and forest sites, due to the inherent differences in the characteristics of these landscapes, accepted measurement strategies for forests and crops, and the ease with which the sites could be accessed. 2.1 Agriculture Cropland Soil Moisture and Temperature During SMAPVEX12 soil measurements were collected in each of the 55 cropland fields, coincident in time to flight overpasses. A crew of two was tasked to measure soil moisture, surface and sub-surface soil temperature and surface vegetation temperature. Each crew was assigned four to five fields, typically arriving at their first field around 7:30 AM and finishing their last field around noon. Crews were equipped with hand held soil moisture probes. Most crews were provided with Stevens Hydra probes connected to a PDA. These probes are based on coaxial impedance dielectric reflectrometry and use an oscillator to generate an electromagnetic signal at 50 MHz that is propagated through three metal tines into the soil. The part of the signal that is reflected back to the unit is measured in volts and is used to numerically solve Maxwell s equations, to calculate the impedance and the real and imaginary dielectric permittivities. The probes were inserted vertically into the soil, which provided dielectric and temperature measurements integrated over the top 6 cm of soil. Although readings were recorded digitally, crews were also asked to record soil moisture values on their field sheets. At the end of each day, data from the PDAs and data loggers were downloaded and quality checked. Field sheets were scanned. 16


17 Figure 14. Hand held Stevens Hydra probe with PDA Each cropland field had 16 sample points as shown in Figure 5. At each sample point, crews were instructed to collect three replicate soil moisture measurements. Replication was important to capture spatial variability created by soil properties or management practices. Tillage and planting activities can create macro structures, affecting surface soil moisture. If crews observed obvious soil structure, they were instructed to distribute the three replicate measurements according to this structure with the 1st reading between the crop plants at the top of a ridge, the 2nd reading in the middle of a ridge and the 3rd reading at the bottom of a ridge (Figure 15). In each position, the probe was to be inserted vertical to the surface and flush to the soil. If crews did not observe discernible structure, measurements were to be taken diagonally across rows, with the first reading close to the crop row. Crews noted on sampling sheets whether structure was present. Over the course of SMAPVEX12, more than 44,000 hand held soil moisture measurements were recorded. Sample 1 Sample 2 Sample 3 Figure 15. Location of replicate soil moisture measurements at each site For the most part, field crews were successful in collecting data on all their assigned fields. However, on any given day some crews encountered circumstances preventing access to fields. This included poor road conditions, or aerial spraying of crops. Site specific calibration of measurements from the hand held probes is necessary. To assist with this calibration, during flight days crews were instructed to collect one bulk density core per field. The 17


18 location of the one bulk density site was moved each flight day such that by the end of the campaign, one sample had been collected at each sample point within each field. This strategy yielded more than 850 cores during the course of SMAPVEX12. The dimensions of the soil core were approximately 4.6 cm in height and 4.7 cm in diameter with a core volume of 80 cm 3. When the crew arrived at the designated bulk density site for that particular sampling day, they took their three standard probe readings. As well, the crew collected a soil core and three additional probe readings. These three additional readings were located in close proximity to the location of the soil core extraction, and were recorded separately on the field sheets. Crews were careful to collect an undisturbed soil sample. These samples (soil and core) were placed in a soil tin with a lid, with the tin then being placed in a re-sealable plastic bag to minimize moisture loss. Soil cores were transported back to Winnipeg for weighing and drying. The entire sample (soil, core, tin and bag) was weighed. The tin was then removed from the plastic bag and placed in a soil drying oven. The samples were oven dried for 24 hours at 105 o C. Following drying, the entire sample (soil, core, tin) was then re-weighed. Figure 16. Soil core sample Surface and sub-surface temperatures were also measured during flight days. Temperatures were recorded at four sites in each field (sites 1, 8, 9 and 16). Sub-surface soil temperatures were measured using a simple digital pocket thermometer (Figure 17). The digital thermometer was inserted to two depths, 5 cm and 10 cm. In addition, surface soil and vegetation temperatures were measured at these same four sites. In this case a thermal infrared thermometer was used (Figure 17). Crews recorded the temperature for sunlit vegetation and sunlit soil, as well as for shaded vegetation and shaded soil. During cloud cover it was not possible to acquire sunlit readings and thus not all sites have all four readings. All temperature measurements were recorded on the field sheets. 18


19 Figure 17. Temperature at 5 and 10 cm (left) and at the surface (right) Surface Roughness Macro and micro surface roughness are known to effect microwave emission and scattering. For agriculture fields, this roughness is primarily due to land management activities, modified over time by the effects of erosion by water and wind. Although the effects of land management on roughness can vary due to soil characteristics large roughness variations across a field are small. Consequently roughness was measured at only two sites in each field. In addition, the SMAPVEX12 campaign began after seeding and further effects due to management activity were not expected. As well, canopy closure reduced the influence of erosion forces. Thus roughness was measured only once. Roughness crews visited fields early in the campaign. For corn, bean and canola fields the presence of vegetation at the beginning of SMAPVEX12 was low, facilitating the collection of roughness photos. Roughness measurements were also collected over each forest site. Information on surface roughness was gathered with a portable pin profilometer (Figure 21) that uses surface displacement and post-processing techniques to obtain root mean square roughness (rms) and roughness correlation length (l). The pin boards are custom built, using metal pins with tips coated in red material, a wooden board, a set of legs to support the board and a mechanism to release pins for surface displacement. A metal bar is mounted on the board to hold a standard digital camera to take a picture of the roughness profile once it is in place. The board is one metre in length and the distance between the camera and the profiler is ~ 118 cm. Before taking the photo, if vegetation obstructed the view of the board the vegetation was flattened. As well, a bubble level on the pin profiler was used to level the board. For each field, roughness measurements were collected at two sites. To adequately measure the correlation length, roughness measurements must be taken over long profiles (typically several metres). To achieve a longer 3-metre profile, once one profilometer measurement was taken, the instrument was moved such that the end of the first measurement became the start of the second measurement. This was repeated a second time to achieve a 3-metre profile comprised of three 1-metre profiles. The photographs of the three separate profiles were joined into a single profile using a matlab application, post data collection, to provide the two roughness parameters per site. For each site, the board was placed parallel to the look direction of the SAR instruments (RADARSAT-2 (descending), UAVSAR and 19
 were taken.")

20 PALS flights) (Figure 21). The look direction is the direction perpendicular to the orbital track or flight line. For RADARSAT-2 this is perpendicular to the descending orbital track. For the UAVSAR and PALS this is perpendicular to the flight track. For each site a total of 9 photos (3 adjacent photos x 3 look directions) were taken. This led to 18 photos (3 adjacent photos x 2 sites x 3 look directions) for each field. Direction of UAVSAR flight or orbital path SAR instrument look direction Pin profiler alignment Camera point direction Figure 18. An example of the placement of the profilometer Figure 19. Measurement of surface roughness using the pin profiler Cropland Vegetation Prior to the commencement of SMAPVEX12, fields were visited to determine planting density, row spacing and row direction. The density of plants was determined by counting the number of emergent plants in a row, along a fixed distance (10 metres or 1 metre, depending on the crop type and planting density). This was replicated for 10 rows. Row spacing was determined by measuring the distance 20
21 between rows, for the 10 rows used to determine plant density. Finally, the direction of planting was recorded using a compass. During SMAPVEX12, non-flight days were dedicated to collecting vegetation data. The goal of the experimental plan was to measure vegetation conditions once per week for each field. This strategy was a compromise between capturing the changes in crop growth and available resources. By and large for the vast majority of fields this time table was achieved. However, field access due to impassible roads or aerial spraying did influence this schedule. Vegetation measurements were collected at three of the 16 soil moisture sample points. Sites 2, 11 and 14 were selected as this distribution was expected to capture variance in vegetation conditions across each field, and also provided ease of navigation within the field. At each of these three sites, measurements of crop height and stem diameter were made. In addition biomass samples were collected and photos to measure Leaf Area Index (LAI) were taken. When clear sky conditions permitted, crop reflectance was measured at site 2. Restriction of reflectance measurements to one site was a result of the limitation in the memory capacity of the Crop Scan instrument. Due to different planting approaches of various crops, and the accumulation of crop biomass, the strategy to acquire vegetation measurements varied depending on crop type. For wheat, forage and pasture crops crews collected biomass, height and stem diameter measurements within a 0.5 m x 0.5 metre biomass square. All other crops have wide row and plant spacing and thus these measurements were taken along two adjacent plant rows. Crop height and stem diameter can vary significantly along and between rows and thus multiple measurements are required. For all crops, 10 height and diameter measurements were taken using a tape measure (height) or caliper (stem diameters). For wheat, forage and pasture 10 plants were randomly selected within the biomass square for measurement. For corn, beans and canola five consecutive plants were measured in one row, with five more measured in the adjacent row. The height was measured to the top of the upper most part of the canopy, whether leaf or fruit. Leaves were left in their natural orientation, and not extended, for this measurement. The diameter was measured half way up the crop (at mid-level). Heights were recorded on field sheets. Vegetation biomass and water content were determined via destructive sampling. One biomass sample was collected at each of the three measurement sites (2, 11 and 14). For wheat, forage and pasture fields a 0.5 m x 0.5 metre square was placed over the canopy. All above ground biomass was collected by cutting all vegetation at the soil level. For beans, corn and canola crops, five plants along two rows (10 plants in total) were collected. Knowledge of the density of the crop permits scaling of these measurements to a unit area (m 2 ). Dead plant matter (residue) was not included in the sampling. Following cutting, biomass samples were placed first in a paper bag, and then a plastic bag to minimize water loss prior to weighing the wet sample. Vegetation will degrade rapidly (within a few hours) and thus weighing of the wet sample must be completed quickly. During most vegetation sampling days, the lab crew set up a temporary weighing station located on site in Elm Creek. When convenient to do so, crews periodically brought their vegetation samples to this temporary station for weighing. More than 900 biomass samples were collected during SMAPVEX12. Wet weights were taken with the paper and plastic bags (size of bags used and average bag weight was recorded). Following wet weighing, the plastic bags were removed and samples were placed in drying facilities at temperatures of approximately 30 o C. Initially a drying trailer was set up. However as the volume of biomass accumulated during the campaign, a larger capacity facility was required. 21

 had been removed by air-drying.")
22 Consequently samples were then placed in the University of Manitoba Department of Soil Science drying room. Most samples were left in the drying room from several days to a week. As lab crew had to enter these drying facilities health and safety standards dictated a lower drying temperature. To determine whether all plant water content was removed during the drying process, selected sub-samples of air-dry vegetation, for each crop, were placed in a drying oven at 60 o C for 48 hours. This exercise determined that the air-dry to oven-dry conversion was remarkably consistent for wheat, beans, canola and forage. Almost all water (~95%) had been removed by air-drying. Based on oven-dry results a conversion factor of 94.57% was applied to dry biomass and vegetation water content calculations for these crops. The results of the air-dry to oven-dry analysis were not consistent for corn. Thus the University of Manitoba undertook an experiment to grow a number of corn plants and oven dry these samples to determine percent vegetation water content. For this experiment, corn seeds were planted in 30 pots in a growing chamber on September 14, Three seeds were sown in each pot and of those 90 seeds, 76 germinated. Beginning October 3 rd, plants were harvested, weighed and then oven dried at 60 o C for 48 hours. Results of this experiment are pending. The SMAPVEX experimental plan called for the determination of vegetation water content as a function of plant organ. Thus for the sample collected from site 2, the lab crew segmented this sample by plant organs (heads, leaves, stalks, seeds/pods, tassels) prior to weighing the wet sample. Due to level of effort, the wheat samples were only segmented into heads and leaves/stems. The proportion of biomass in the wheat stalk is considered small relative to that of the leaves and heads. For each of the three biomass samples, the lab crew also determined and recorded plant phenology. Phenology was determined using the BBCH scale. Figure 20. Biomass measurements (left) and drying trailer (right) Leaf Area Index (LAI) was captured using hemispherical digital photos (Figure 19). In each field, seven photos were taken along two transects (14 photos in total) at each of the three sites (2, 11, 14). Along 22
 or 50 cm below the lowest leaf of the canopy (when")
23 each transect, each photo was taken approximately five metres apart (Figure 20). For row crops (corn, canola and beans), photos were taken in the middle of the row. The fisheye camera lens was positioned at nadir, at a minimum of 50 cm above the highest point of the canopy (when photos were taken downward) or 50 cm below the lowest leaf of the canopy (when photos were taken upward). A bubble level positioned on the extension arm was used to ensure that the camera was level prior to taking the downward facing photos. In the case of upward photos, the camera was placed on the ground, pointed upward. Near the end of the SMAPVEX12 campaign crews were unable to position the camera above the canopy of some canola fields and yet lower leaves obstructed the camera view. For these fields no photos were taken. Photos were taken with the crew facing the sun to avoid shadows in the photos. These photos are post-processed to estimates of LAI. Over 12,000 photos (0.5 TB) were taken during the 6 week campaign. Figure 21. Fisheye photo for Field 34 (June 16, soybeans) Figure 22. Location of the 14 points for crop scan measurements and LAI photos. Above canopy crop reflectance was recorded using the Crop Scan instrument. The Crop Scan is a multispectral radiometer operating in 22 channels, ranging from 440 nm to 1700 nm. The radiometer has both upward and downward sensors to capture incoming solar radiation to the sensor and energy reflected from the canopy. Crop Scan data were collected at the same location of each LAI photo; seven measurements in two transects (Figure 20) Vegetative Structure Measurements of the crop structure characteristics and attributes during the vegetation growth phases were an important part of the data collection, in particular to support forward modeling of radar scatter. 23


24 Seventeen of the 55 fields were strategically selected for vegetation structure measurement. The crop type breakdown was as follows: one forage, one winter-wheat, three corn, three bean, three pasture, three spring-wheat, and three canola fields. Crop attributes measured included plant height, stem width, stalk height, stalk angle, number of leaves, leaf length, leaf width, leaf thickness, leaf angle, number of plants per square meter, row orientation and row width. These vegetation attributes were measured on the bottom, middle and top of one plant at two sampling locations in 17 fields (Table 4) and revisited 5-6 times over the 6 week campaign. Figure 23 shows the structural change/growth of canola plants (Field 124) within a span of 9 days. Table 4. Field number and crop type of vegetation structure sample fields. Field Crop Field Crop 13 Pasture 81 Wheat 22 Pasture 83 Corn 23 Pasture 93 Corn 24 Corn 121 Forage 34 Soybeans 122 Canola 41 Winter Wheat 123 Soybeans 43 Oats 124 Canola 64 Soybeans 125 Canola 65 Wheat Figure 23. Canola field 124 on June 7 (left) and June 16 (right), Forested Sites Data collected over the four SMAPVEX12 forest sites will be used primarily to enhance and develop radar forest scattering models and to test the current radar-based soil moisture retrieval algorithm, both of which are essential to successful SMAP post-launch validation. This work and the experience gained during SMAPVEX12 are expected to provide synergies between SMAP and the AirMOSS EV-1 mission. 24
25 2.2.1 Soil Moisture A spatial and temporal soil moisture sampling strategy was designed, specific for the forest sites. Each of the four sites was diverse in terms of landscape and land cover. At the beginning of the campaign each site was visited and its heterogeneity investigated. The observation area for both soil moisture and vegetation sampling within each site consisted of two orthogonal transects within a circle of 100 m radius (Figure 24). Figure 24. Schematic representation of the forestry soil moisture transects This observation area was carefully selected to represent the heterogeneity of each site. At three sites, F1, F2 and F4, a temporary soil moisture sensor profile had previously been installed. However due to heterogeneity in the land cover of F4, this forest site was not sampled during the six week SMAPVEX12 campaign. After determining the center point, transects were laid in north/south and east/west directions. There were nine soil moisture sampling points within each observation area, including the center point and two points at 50 m and 100 m in each cardinal direction (Figure 24). The location of some of the sampling points was adjusted if they fell into areas of standing water or marsh. For example, in F3, the southern transect had to be modified to avoid marshlands. To allow for frequent revisiting of the soil moisture sampling points, the nine soil moisture sampling points per site were clearly flagged at the beginning of the campaign and their respective locations were confirmed with visualization in Google Earth and GPS coordinates were recorded. The parameters of interest related to soil and soil moisture included: 1. Soil moisture and dielectric constant (using Steven s Hydra probes) 2. Soil organic depth 3. Soil temperature at 0 cm, 5 cm and 10 cm depths. 4. Soil bulk density samples to characterize soil composition (i.e. % sand, clay, and silt) Surface Roughness During SMAPVEX12, surface roughness was measured over the forested sites F1, F2, F3, and F5 located along the flight line LL4. The measurements were made at two locations over sites F1, F2, F3 and at one location over site F5 in the look directions of RADARSAT-2 (descending mode), UAVSAR, and PALS. 25
 and roughness correlation length (l) were also silmilar to what was described in section 2.1.")

26 Information on surface roughness was gathered with the same portable pin profilometer that was used over the agricultural fields (Figure 25). Picture collection and post-processing techniques to obtain root mean square roughness (rms) and roughness correlation length (l) were also silmilar to what was described in section for the agricultural fields. Due to shadow, poor quality pictures were collected over some sites. Despite a second revisit, these conditions led to no data over these sites in some directions, and for the second site of F5. Figure 25. Measurement of surface roughness using the pin profiler over the forested sites F1 (left) and F2 (right) Forest Vegetation SMAPVEX12 forest vegetation sampling was divided into three parts: (1) spatial sampling, (2) destructive sampling and (3) dielectric constant measurements. The spatial sampling took place June 7 to June 28 and the destructive sampling and dielectric measurements occurred June 29 to July 17. Spatial sampling involved recording and flagging every tree with a diameter at breast height (DBH) of more than 1 inch (2.54 cm) within +/- 1 meter of the transect line. This was done for both transects within an observation area, as shown in Figure 24. For each tree, the following parameters were measured: a) DBH in inches; b) Height in meters; and c) Species The DBH was measured with a DBH tape at breast height. The height was recorded with a hypsometer. While standing more than 10 meters away from the tree, two measurements were taken with the hypsometer: distance to base of tree and distance to top of tree. The hypsometer then displays the total height. This is a standard technique to measure tree heights, but posed a challenge in denser forests such as F2, F3 and F5 since there was a dense understory preventing line of sight measurements. The tree species was recorded by consulting a standard tree field guide, in this case Trees in Canada by John L. Farrar. An example of flagged trees in F3 can be seen in Figure


27 Figure 26. Example of tree flagging Each tree within +/- 1m of the transect was marked and recorded with its number, DBH value, height and species. The spatial sampling measurements allowed better understanding of the denser forest sites covered in this campaign. Measurements such as forest density, tree height, DBH, tree species, as well as detailed information about branches and understory, are essential to successfully parameterize radar backscattering models. At every 10 meters along the transect, the GPS coordinates and more detailed parameters were recorded: a) Trunk height in meters; b) Number of primary branches; c) Angle of primary branches; d) Fractional ground cover in percent; and e) Understory height in meters. These measurements were generally taken on the tree at the 10 m point closest to the transect line. Trunk height was recorded with the hypsometer or a yard stick. The number and angle of primary branches were recorded based on visual inspection. The fractional ground cover and understory height were measured by laying down a quadrat in a representative area close to the 10m point and recording the values based on visual inspection or by using a yard stick for the height. A range of encountered fractional ground covers and understory heights can be seen in Figure
 Trunk diameter at each 30 cm interval; b) Wafer of approximately 3 cm thickness for gravimetric")
 Note on leaf clumping At the time of destructive sampling, the spatial information was not processed.")
28 Figure 27. Measurement of fractional ground cover and understory height within a quadrat Destructive sampling involves harvesting an average tree for intensive destructive measurements. One average tree per field was felled using a chainsaw and the following parameters were measured: a) Trunk diameter at each 30 cm interval; b) Wafer of approximately 3 cm thickness for gravimetric measurements at each 30 cm interval; c) Primary branch angles; d) Number of branches (primary, secondary) and leaf count; e) All branch lengths, diameters, and when possible, dielectric constant; f) 3-4 samples of branches for gravimetric measurements; and g) Note on leaf clumping At the time of destructive sampling, the spatial information was not processed. The average tree was selected based on visual inspection of diameter and height compared to other trees in the forest. Along with the spatial sampling information, these parameters are essential in the electromagnetic modeling of forests. Trunks and branches are modeled as cylinders with the same properties (diameters, length, dielectric, branch angle, etc.) as the average tree in the site. The measurements above provide the distributions needed to do such modeling. Figure 28 shows a felled aspen s trunk height and diameter being measure starting from the DBH location. 28
.")


29 Figure 28. Trunk height and diameter measurements on an aspen. Dielectric measurement of tree trunks, branches and leaves were taken using an Agilent field portable network analyzer (FieldFox N9923A). The FieldFox uses a custom made semi-rigid openended coaxial line to measure the reflection coefficient of the sample under test. Further analysis is then required to determine the sample s dielectric constant from the measured reflection coefficients. In Figure 29 the FieldFox with the coaxial probe attached can be seen. A laptop is used to control and automate the measurement process. The measured dielectric constant values can be directly used as input parameters in the electromagnetic forward scattering models. To probe deeper into the tree, a ¾ drill bit was used to drill into the tree. The coaxial probe was then placed in full contact with the trunk. The measurement frequency ranges from 400 MHz to 2 GHz, which covers both P-band and L-band and is applicable to both the SMAP and AirMOSS missions. Figure 29. FieldFox with dielectric probe and drill bit hole to facilitate full probe contact 29
 carried the Passive Active L-band Sensor (PALS) sensor. The G-III (Figure 30) transported the Uninhabited Aerial Vehicle Synthetic Aperture Radar (UAVSAR).")

30 3. Airborne Imagery Several times per week NASA flew the DHC-6 Twin Otter International (TOI) and a NASA Gulfstream III (G-III) carrying instruments similar to the SMAP satellite. The Twin Otter (Figure 30) carried the Passive Active L-band Sensor (PALS) sensor. The G-III (Figure 30) transported the Uninhabited Aerial Vehicle Synthetic Aperture Radar (UAVSAR). The goal was to attempt to fly these aircraft two to three times per week, through the six week campaign. Go and no-go flight decisions were based primarily on readiness of the aircraft, weather conditions and surface conditions. If the aircraft were ready and weather conditions favourable, flights were a go if soil moisture conditions on the ground provided sufficiently different conditions relative to recent conditions. Thus the intent was to capture a wide range of soil conditions, in particular those that follow rain events and subsequent dry down. Figure 30. DHC-6 Twin Otter International (left) and NASA Gulfstream III (right) Table 5 lists the dates the PALS and UAVSAR successfully acquired data. Every effort was made to coordinate the flight dates of both instruments in order to provide complementary passive and active data. 30
31 Table 5. Imagery acquisition dates for the PALS and UAVSAR instruments during SMAPVEX12 PALS Acquisition UAVSAR Acquisition June, 7 June, 17 June, 12 June, 19 June, 15 June, 22 June, 17 June, 23 June, 22 June, 25 June, 23 June, 27 June, 25 June, 29 June, 27 July, 3 June, 29 July, 5 July, 3 July, 8 July, 5 July, 10 July, 8 July, 13 July, 10 July, 14 July, 13 July, 17 July, 14 July, 17 July, Passive Active L-band Sensor (PALS) Data Collection The Passive/Active L-band Sensor (PALS) provides radiometer products, vertically and horizontally polarized brightness temperatures, and radar products, normalized radar backscatter cross-section for V- transmit/v-receive, V-transmit/H-receive, H-transmit/H-receive, and H-transmit/V-receive. In addition, it can also provide the polarimetric third Stokes parameter measurement for the radiometer and the complex correlation between any two of the polarized radar echoes (VV, HH, HV and VH). Table 6 provides the key characteristics of PALS. Table 6. Description of PALS. Instrument Passive/Active L-band Sensor (PALS) Owner Jet Propulsion Laboratory (USA) Platform Twin Otter Passive Frequencies GHz Polarizations V, H, +45, -45 polarizations Spatial Resolution 20 degrees (3 db beamwidth in Deg.) Active Frequencies 1.26 GHz Polarizations VV, HH, VH, HV Spatial 20 degrees Resolution Scan Type Fixed Antenna Type Microstrip planar antenna with >30 db polarization isolation POC/Website Simon.Yueh@jpl.nasa.gov 31
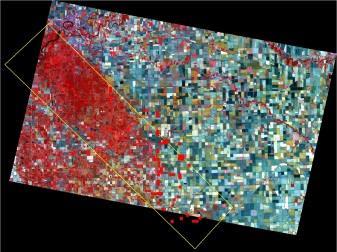
32 The planar antenna consists of 16 stacked-patch microstrip elements arranged in a four by- four array configurations. Each stacked-patch element uses a honeycomb structure with extremely low dielectric loss at L-band to support the ground plane and radiating patches. The measured antenna pattern shows better than 33 db polarization isolation, far exceeding the need for the polarimetric measurement capability. PALS was mounted at a 40 degree incidence angle looking to the rear of the aircraft. The 3dB spatial resolution of the instrument was ~ 0.35*altitude above ground cross-track. PALS acquired data at two elevations during SMAPVEX12 (Low and High). The lowest elevation that PALS can operate at is determined by the minimum distance for radar data acquisition, which is 1067 m (3500 feet) above the ground surface. Based on a nominal elevation in this region of 305 m (1000 feet), this translates to a flight altitude of 1372 m (4500 feet). The highest flight altitude for SMAPVEX12 was determined by the maximum altitude for not requiring oxygen use by the flight crew; 2896 m (9500 feet). The spatial resolutions at these two flight altitudes are summarized in Table 7. Table 7. Geometric features of PALS data acquisitions. Target Altitude (m) Nominal Ground Elevation (m) MSL (m) Cross Track Resolution (m) Along Track Resolution (m) Footprint Offset Along Track (m) The PALS/TOI flight lines were designed to satisfy the major objectives of SMAPVEX12. Low altitude lines provided high spatial resolution data for fields/sites with homogeneous vegetation conditions. Many sampling sites were located directly on these lines. Since the nominal field size in the region is 800 m by 800 m, flying these at the lowest possible altitude should provide the data necessary for algorithm development and validation. Four lines were flown at low altitude, two covering annual cropland, one pasture land and a forth over the forest sites (red lines in Figure 31). High altitude lines mapped the larger region and provide data for simulating SMAP combined algorithms (yellow lines in Figure 31). A total of eight lines were required to cover the entire SMAPVEX12 site (~12.8 by 70 km). Lines were spaced ~ 1.6 km apart. 32
 on June 12th, 2012 over the study site. The average moisture according to field data was approximately 35%.")
 and July 3")
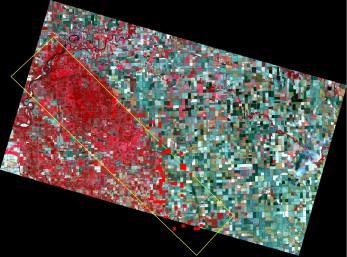
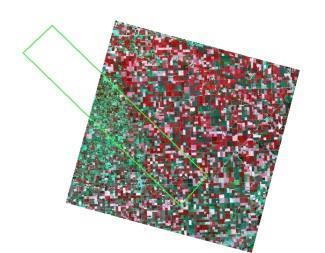
33 Figure 31. Low altitude PALS flight lines (red) and high altitude lines (yellow) Preliminary data generated by the PALS radiometer are provided below. In these two examples, the PALS sensor detects very wet soil conditions (green-blue) on June 12th, 2012 over the study site. The average moisture according to field data was approximately 35%. On July 3 rd, 21 days later and after 12 continuous days without rain high temperatures, data from PALS captures extremely dry soil conditions (orange-red). Figure 32. The PALS radiometer data in H polarization for June 12 (left) and July 3 (right). 3.2 UAVSAR on NASA G-III The Uninhabited Aerial Vehicle Synthetic Aperture Radar (UAVSAR) is an aircraft based fully polarimetric L-band radar that is also capable of interferometry. It is currently implemented on a NASA Gulfstream-III aircraft ( Details on the UAVSAR are listed in table 8. 33
 NASA/JPL/Dryden (USA) Gulfstream III;")
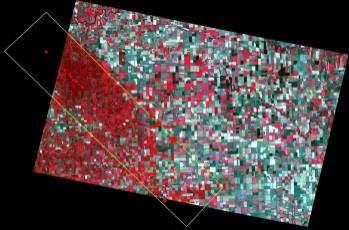
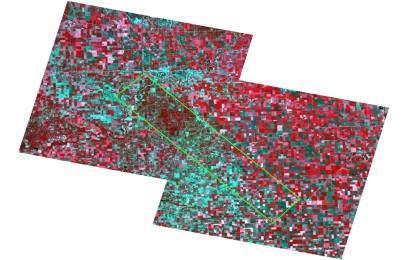
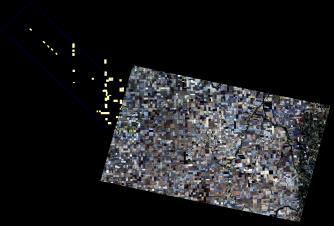
34 Table 8. Description of the UAVSAR. Instrument Owner Platform Frequencies Polarizations Spatial Resolution Scan Type Antenna Type Uninhabited Aerial Vehicle Synthetic Aperture Radar (UAVSAR) NASA/JPL/Dryden (USA) Gulfstream III; operating altitude up to 13 km L-band (1.26 GHz) HH, HV, VH, VV 80 MHz Bandwidth, 1.66 m range x.8 m azimuth SLC 3 m multi-looked (6 looks) SAR with Electronically scanned active array, range swath ~20 km looking left of track between 25 and 65 degrees. Phased Array For SMAPVEX12, the nominal flight altitude was 13 km and the aircraft speed was 220 m/s. UAVSAR looks to the left of flight direction and collects data over a swath between 25 and 65 degrees, which is a nominal swath of 21 km. The most relevant portion of the data swath for SMAP, which has an incidence angle of 40 degrees, will be data collected between ~35 and 45 degrees, which is a narrower swath of ~3.8 km. In order to provide coverage of the study domain, four flight lines were needed (Figure 33). In addition to these lines, two additional lines were flown to complement the low altitude PALS coverage. The coverages were oriented to provide data with the same azimuth angle as PALS. Figure 33. SMAPVEX12 UAVSAR Coverage Boxes The UAVSAR instrument acquired imagery 14 times on the dates during SMAPVEX12. An image from early in the campaign is provided in Figure

35 Figure 34. A UAVSAR Imagery acquired near Carman (Manitoba) on July 17th, 2012 Derived from Pauli composite (R: double bounce (Shh-Svv); G: volume scattering (2*Shv); B: single bounce (Shh+Svv) 4. Satellite Imagery In addition to airborne acquisitions, optical and SAR satellites were also programmed for the duration of SMAPVEX12. These included acquisitions of RapidEye and SPOT-4/5 (Tables 9 and Figure 35). Table 9. Imagery acquisition dates for RapidEye and SPOT-4/5 sensors RapidEye SPOT-4/5 May, 14 July, 21 June, 23 May, 20 July, 27 June, 28 June, 4 August, 5 July, 5 June, 12 August, 19 July, 14 June, 23 August, 24 June, 26 August, 29 June, 28 September, 9 July, 5 September, 14 July, 14 September, 23 July, 20 September, 26 35


36 June, 28 August, 19 June, 26 August, 5 September, 26 June, 23 July, 27 September, 23 June, 12 July, 21 September, 14 July, 14 June, 4 July, 20 September, 9 July, 5 May, 20 July, 14 August, 29 June, 28 May, 14 July, 5 August, 24 June, 23 RapidEye SPOT-4/5 Figure 35. Imagery acquisition coverage for RapidEye and SPOT-4/5 sensors 36
.")


37 FQW-3 FQW-10 S-3 FQW-2 FQW-8 FQW-6 A total of 29 RADARSAT-2 images were acquired under the Government of Canada RADARSAT-2 data allocation. This included 22 Fine Quad-Polarization and 7 Standard images with HH, HV polarization (Table 10 and Figure 36). The QP mode provided data of the full scattering matrix, but with its limited 50 km swath, only the south eastern annual cropland was covered. The Dual-polarization Standard mode, however, covers the entire SMAPVEX12 site. Table 10. Imagery acquisition dates for RADARSAT-2 imagery during SMAPVEX12 RADARSAT-2 Imagery Acquisition April, 16 Fine-Quad Pol. Wide-2 June, 13 Fine-Quad Pol. Wide-10 April, 18 Fine-Quad Pol. Wide-3 June, 19 Standard Beam-3 April, 25 Fine-Quad Pol. Wide-8 June, 20 Fine-Quad Pol. Wide-6 April, 26 Fine-Quad Pol. Wide-10 June, 27 Fine-Quad Pol. Wide-2 May, 03 Fine-Quad Pol. Wide-6 June, 29 Fine-Quad Pol. Wide-3 May, 10 Fine-Quad Pol. Wide-2 June, 30 Standard Beam-3 May, 12 Fine-Quad Pol. Wide-3 July, 06 Fine-Quad Pol. Wide-8 May, 13 Standard Beam-3 July, 07 Fine-Quad Pol. Wide-10 May, 20 Fine-Quad Pol. Wide-10 July, 13 Standard Beam-3 May, 26 Standard Beam-3 July, 14 Fine-Quad Pol. Wide-6 May, 27 Fine-Quad Pol. Wide-6 July, 21 Fine-Quad Pol. Wide-2 June, 03 Fine-Quad Pol. Wide-2 July, 23 Fine-Quad Pol. Wide-3 June, 05 Fine-Quad Pol. Wide-3 July, 24 Standard Beam-3 June, 06 Standard Beam-3 July, 31 Fine-Quad Pol. Wide-10 June, 12 Fine-Quad Pol. Wide-8 Figure 36. Coverage for RADARSAT-2 imagery. 37

38 The SMAPVEX12 team programmed 21 TerraSAR-X images for the 2012 growing season (May to September) through a proposal to the German Space Agency (DLR) (Table 11 and Figure 37). Table 11. Imagery acquisition dates for TerraSAR-X imagery. TerraSAR-X Imagery Aacuisitions Ascending Pass Cycle Descending Pass Cycle May, 07 Stripmap/StripFar-006R May, 08 Stripmap/ StripNear-005R May, 18 Stripmap/StripFar-006R May, 19 Stripmap/ StripNear-005R May, 29 Stripmap/StripFar-006R May, 30 Stripmap/ StripNear-005R June, 09 Stripmap/StripFar-006R June, 10 Stripmap/ StripNear-005R June, 20 Stripmap/StripFar-006R June, 21 Stripmap/ StripNear-005R July, 23 Stripmap/StripFar-006R July, 02 Stripmap/ StripNear-005R August, 03 Stripmap/StripFar-006R July, 13 Stripmap/ StripNear-005R September, 27 Stripmap/StripFar-006R July, 24 Stripmap/ StripNear-005R August, 04 August, 15 August, 26 September, 06 September, 17 Stripmap/ StripNear-005R Stripmap/ StripNear-005R Stripmap/ StripNear-005R Stripmap/ StripNear-005R Stripmap/ StripNear-005R Figure 37. TerraSAR-X coverage in ascending (left) and descending (right) modes. 38
Monitoring Crop Leaf Area Index (LAI) and Biomass Using Synthetic Aperture Radar (SAR)
 and Biomass Using Synthetic Aperture Radar (SAR)") Monitoring Crop Leaf Area Index (LAI) and Biomass Using Synthetic Aperture Radar (SAR) Mehdi Hosseini, Heather McNairn, Andrew Davidson, Laura Dingle-Robertson *Agriculture and Agri-Food Canada JECAM SAR
Monitoring Crop Leaf Area Index (LAI) and Biomass Using Synthetic Aperture Radar (SAR) Mehdi Hosseini, Heather McNairn, Andrew Davidson, Laura Dingle-Robertson *Agriculture and Agri-Food Canada JECAM SAR
Experimental Plan. May 22, University of Michigan, Electrical Engineering and Computer Science Department, Ann Arbor, MI , USA
 Experimental Plan May 22, 2012 Heather McNairn 1*, Tom J. Jackson 2, Grant Wiseman 3, Stephane Bélair 4, Aaron Berg 5, Paul Bullock 6, Andreas Colliander 7, Michael H. Cosh 2, Seung-Bum Kim 7, Ramata Magagi
Joint Experiment for Crop Assessment and Monitoring GEOGLAM Implementation Meeting Washington D.C. February 21, 2013
 Joint Experiment for Crop Assessment and Monitoring GEOGLAM Implementation Meeting Washington D.C. February 21, 2013 Ian Jarvis JECAM Sub-Task Lead Earth Observation Service, Agriculture and Agri-Food
The NISAR Mission. Paul Siqueira Emerging Technologies and Methods in Earth Observation for Agriculture Monitoring College Park, 2018
 The NISAR Mission Paul Siqueira Emerging Technologies and Methods in Earth Observation for Agriculture Monitoring College Park, 2018 Flyer A one-page paper-flyer is available with more information NISAR
Integration of Land Surface Simulation, Remote Sensing and Field Studies in the Prairies
 Integration of Land Surface Simulation, Remote Sensing and Field Studies in the Prairies Brenda Toth, Al Pietroniro Hydrometeorology and Arctic Lab MSC Environment Canada Garth van der Kamp, Raoul Granger
JECAM and the Manitoba Super Site
 JECAM and the Manitoba Super Site GEO-DRI Drought Monitoring Workshop May 10 & 11, 2010 Grant Wiseman, M.Sc. AAFC, AESB, Winnipeg, Canada grant.wiseman@agr.gc.ca Joint Experiments on Crop Assessment and
JECAM SAR cross sites experiments
 JECAM SAR cross sites experiments H. McNairn, I. Jarvis, A.Davidson, P. Defourny, G. Chomé, F. Waldner Agriculture and Agri-food Canada UCLouvain-Geomatics, Belgium and the JECAM SAR researchers and/or
3/1/18 USING RADAR FOR WETLAND MAPPING IMPORTANCE OF SOIL MOISTURE TRADITIONAL METHODS TO MEASURE SOIL MOISTURE. Feel method Electrical resistance
 3/1/18 USING RADAR FOR WETLAND MAPPING SOIL MOISTURE AND WETLAND CLASSIFICATION Slides modified from a presentation by Charlotte Gabrielsen for this class. Southeast Arizona: Winter wet period From C.
The NASA Soil Moisture Active Passive (SMAP) mission: Overview
 mission: Overview") The NASA Soil Moisture Active Passive (SMAP) mission: Overview The MIT Faculty has made this article openly available. Please share how this access benefits you. Your story matters. Citation As Published
The NASA Soil Moisture Active Passive (SMAP) mission: Overview The MIT Faculty has made this article openly available. Please share how this access benefits you. Your story matters. Citation As Published
Remote Sensing of Mangrove Structure and Biomass
 Remote Sensing of Mangrove Structure and Biomass Temilola Fatoyinbo 1, Marc Simard 2 1 NASA Goddard Space Flight Center, Greenbelt, MD USA 2 NASA Jet Propulsion Laboratory, Pasadena, CA USA Introdution
The Biomass mission How it works, what it measures? Thuy Le Toan, CESBIO, Toulouse, France & The Biomass Mission Advisory Group
 The Biomass mission How it works, what it measures? Thuy Le Toan, CESBIO, Toulouse, France & The Biomass Mission Advisory Group Why Synthetic Aperture Radars to observe the world forests? Transmit and
Soil moisture observations and remote sensing at Brightwater Creek, Scotty Creek and Trail Valley Creek
 Soil moisture observations and remote sensing at Brightwater Creek, Scotty Creek and Trail Valley Creek Aaron Berg, Tracy Rowlandson, Travis Burns, Rachel Humphrey, Rebecca Warren, Allan Merchant, Matthew
the wheat fields is small, and as for fields of puddling and leveling in winter and other fields in similar, the difference is small. It is conclude t
 OBSERVATION OF JAPANESE PADDY RICE FIELDS USING MULTI TEMPORAL AND POLARIMETRIC PALSAR DATA PI No.365 Naoki ISHITSUKA 1, Genya SAITO 2, Fan YANG 3, Chinatsu YONEZAWA 4 and Shigeo OGAWA 5 1 National Institute
Equipment. Methods. 6. Pre-treatment monitoring will take place during the growing season.
 Vegetation and Fuel Monitoring Protocols for the Long Island Pine Barrens Fire Management Demonstration Site Project Adapted from the UMass Project Managing Fuels in Northeastern Barrens Plot Selection,
I. SOIL MOISTURE, CROP AND VEGETATION STUDY USING AIRSAR DATA
 I. SOIL MOISTURE, CROP AND VEGETATION STUDY USING AIRSAR DATA Dr. Flaviana Hilario (1) and Dr. Juliet Mangera (2) (1) PAGASA (Weather Bureau), ATB 1424 Quezon Ave, Quezon City, Philippines, 1100, Philippines
Soil Moisture Mapping
 Soil Moisture Mapping with UAS an Advanced UAS for Environmental Monitoring info@blackswifttech.com Figure 1: The Black Swift Technologies S2TM and its soil moisture monitoring payload. Introduction ter
FOREST PARAMETER EXTRACTION USING TERRESTRIAL LASER SCANNING
 FOREST PARAMETER EXTRACTION USING TERRESTRIAL LASER SCANNING P.J.Watt *, D.N.M. Donoghue and R.W. Dunford Department of Geography, University of Durham, Durham, DH1 3LE, United Kingdom *Corresponding author:
HIGH RESOLUTION AIRBORNE SOIL MOISTURE MAPPING
 HIGH RESOLUTION AIRBORNE SOIL MOISTURE MAPPING Jeffrey Walker 1, Rocco Panciera 1 and Ed Kim 2 1. Department of Civil and Environmental Engineering, University of Melbourne 2. Hydrospheric and Biospheric
Science I EARTH EXPLORER 7 USER CONSULTATION MEETING. An Earth Explorer to observe forest biomass
 Science I EARTH EXPLORER 7 USER CONSULTATION MEETING An Earth Explorer to observe forest biomass Primary Mission Objectives 1. Reducing the major uncertainties in carbon fluxes linked to Land Use Change,
Foresters utilize a variety of specialized tools to accomplish the following tasks:
 Forestry Tools Foresters utilize a variety of specialized tools to accomplish the following tasks: Measure trees Conduct forest inventory Mark trees Measure logs Plant trees Navigation and orientation
Automated weighing and moisture sensor system to assess the hygrothermal response of wood sheathing and combined membrane-sheathing wall components
 Automated weighing and moisture sensor system to assess the hygrothermal response of wood sheathing and combined membrane-sheathing wall components Maref, W.; Lacasse, M.A.; Booth, D.; Nicholls, M.; O'Connor,
Integration of SAR multi-frequency and optical data for the retrieval of soil moisture and vegetation water content
 Integration of SAR multi-frequency and optical data for the retrieval of soil moisture and vegetation water content A. Padovano 1,2, F. Greifeneder 1, R. Colombo 2, G. Cuozzo 1, C. Notarnicola 1 1 - Eurac
Using Imagery and LiDAR for cost effective mapping and analysis for timber and biomass inventories
 Using Imagery and LiDAR for cost effective mapping and analysis for timber and biomass inventories Mark Meade: CTO Photo Science Mark Milligan: President LandMark Systems May 2011 Presentation Outline
Protocol for Pre-Installation field Measurements for Prospective Living Snow Fence Sites in New York State
 Research Project C-06-09 Designing, Developing and Implementing a Living Snow Fence Program for New York State Task 3-A1 & 3-A2 Protocol for Pre-Installation field Measurements for Prospective Living Snow
Performance Evaluation Performance (PEP) Preliminary Results Report 3 & 5 July 2017
 Preliminary Results Report 3 & 5 July 2017") Performance Evaluation Performance (PEP) Report 3 & 5 July 217 Solar Cooker: CooKit Manufacturer: Solar Cookers International Cookware: Granite Ware Greenhouse material: Plastic Bag (oven bag) Standard
Performance Evaluation Performance (PEP) Report 3 & 5 July 217 Solar Cooker: CooKit Manufacturer: Solar Cookers International Cookware: Granite Ware Greenhouse material: Plastic Bag (oven bag) Standard
Prairie Hydrological Model Study Progress Report, April 2008
 Prairie Hydrological Model Study Progress Report, April 2008 Centre for Hydrology Report No. 3. J. Pomeroy, C. Westbrook, X. Fang, A. Minke, X. Guo, Centre for Hydrology University of Saskatchewan 117
5.5 Improving Water Use Efficiency of Irrigated Crops in the North China Plain Measurements and Modelling
 183 5.5 Improving Water Use Efficiency of Irrigated Crops in the North China Plain Measurements and Modelling H.X. Wang, L. Zhang, W.R. Dawes, C.M. Liu Abstract High crop productivity in the North China
Taikichiro Mori Memorial Research Grants Graduate Student Researcher Development Grant Report
 Taikichiro Mori Memorial Research Grants Graduate Student Researcher Development Grant Report February 2016 Research Project: Detection and delineation of water bodies using Synthetic Aperture Radar data
GLASI GLASI. Priority Subwatershed Project. Great Lakes Agricultural Stewardship Initiative
 GLASI GLASI Great Lakes Agricultural Stewardship Initiative Priority Subwatershed Project Wigle Creek Priority Subwatershed Project Essex Region Conservation Authority Up to $75,000 per eligible farm business
Distributed Mapping of SNTHERM-Modelled Snow Properties for Monitoring Seasonal Freeze/Thaw Dynamics
 58th EASTERN SNOW CONFERENCE Ottawa, Ontario, Canada, 2001 Distributed Mapping of SNTHERM-Modelled Snow Properties for Monitoring Seasonal Freeze/Thaw Dynamics JANET P. HARDY 1, KYLE MCDONALD 2, ROBERT
Soil Moisture Validation in the U.S.
 Soil Moisture Validation in the U.S. T. J. Jackson, R. Bindlish, I. Mladenova, and M. Cosh USDA ARS Hydrology and Remote Sensing Lab January 16, 2014 Outline Project Overview GCOM-W AMSR2 Brightness Temperature
PACRIM-2 Clear-fell Mapping Studies in New Zealand
 PACRIM-2 Clear-fell Mapping Studies in New Zealand D. Pairman, S.J. McNeill, D. McNab* and S.E. Belliss Landcare Research PO Box 69, Lincoln 8152, New Zealand. *Fletcher Challenge Forests. Email: pairmand@landcareresearch.co.nz
Daigo, M; Kajiwara, K; Honda, Y
 Nara Women's University Digital I Title Author(s) Citation An improved tree-height measurement production in a larch forest on Mt. Thanyapraneedkul, Juthasinee; Ikega Daigo, M; Kajiwara, K; Honda, Y J.Thanyapraneedkul
MANAGEMENT OF MULCH TILLAGE SYSTEMS ON CLAY SOILS
 MANAGEMENT OF MULCH TILLAGE SYSTEMS ON CLAY SOILS Final Report on SWEEP-TED Project SSC No. XSE90-00213-(303) Contract No. 01686-0-0254/01-XSE Prepared by: G.A. Stewart and T.J. Vyn Crop Science Department
Canopy Structure, and Leaf area, are fundamental features of the landscape. We can t really understand the plant-atmosphere interactions without
 Canopy Structure, and Leaf area, are fundamental features of the landscape. We can t really understand the plant-atmosphere interactions without knowing how much vegetation is on the surface. 1 Plants
PROGRESS WITH MEASURING AND UTILIZING CROP EVAPOTRANSPIRATION (ETc) IN WALNUT
 IN WALNUT") PROGRESS WITH MEASURING AND UTILIZING CROP EVAPOTRANSPIRATION (ETc) IN WALNUT Allan Fulton, Cayle Little, Richard Snyder, Richard Buchner, Bruce Lampinen, and Sam Metcalf ABSTRACT Since 1982 when the California
PROGRESS WITH MEASURING AND UTILIZING CROP EVAPOTRANSPIRATION (ETc) IN WALNUT Allan Fulton, Cayle Little, Richard Snyder, Richard Buchner, Bruce Lampinen, and Sam Metcalf ABSTRACT Since 1982 when the California
BAEN 673 / February 18, 2016 Hydrologic Processes
 BAEN 673 / February 18, 2016 Hydrologic Processes Assignment: HW#7 Next class lecture in AEPM 104 Today s topics SWAT exercise #2 The SWAT model review paper Hydrologic processes The Hydrologic Processes
Wood Storage Best Practices in Fairbanks, Alaska
 Wood Storage Best Practices in Fairbanks, Alaska June 27, 2011 A project report prepared by CCHRC for: Sierra Research CCHRC Web Site: http:// P.O. Box 82489, Fairbanks, AK 99708 Phone: (907)457-3454 Fax:
The Texas Soil Observation Network one year in
 The Texas Soil Observation Network one year in Todd Caldwell 1 Michael Young 1, Bridget Scanlon 1, Liang Yang 1, Chelsea Halley 1 Andreas Colliander 2, Narendra Das 2, Sidharth Misra 2, Simon Yueh 2 Michael
RADAR for Biomass Mapping
 RADAR for Biomass Mapping Josef Kellndorfer Wayne Walker, Katie Kirsch, Greg Fiske The Woods Hole Research Center GOFC-GOLD Biomass Workshop Missoula, 15-June-2009 Outline Some Radar principles Measurements
Lesson 2 - Stationary Sensors (Part 2)
") Lesson 2 - Stationary Sensors (Part 2) Water pressure, hydraulics, and other water storages (soil, snow ) The meteorology sensors (precipitation) are important because they tell us how much water our climate
Lesson 2 - Stationary Sensors (Part 2) Water pressure, hydraulics, and other water storages (soil, snow ) The meteorology sensors (precipitation) are important because they tell us how much water our climate
Mapping Habitat for the Ivory Billed Woodpecker and the California Spotted Owl : A Multisensor Fusion Approach
 Mapping Habitat for the Ivory Billed Woodpecker and the California Spotted Owl : A Multisensor Fusion Approach A. Swatantran 1, R. Dubayah 1, M. Hofton 1, J. B. Blair 2, A. Keister 3 B. Uihlein 3, P. Hyde
The BIOMASS Mission. Klaus Scipal 24/01/2019. ESA UNCLASSIFIED - For Official Use
 The BIOMASS Mission Klaus Scipal 24/01/2019 ESA UNCLASSIFIED - For Official Use The BIOMASS Mission 1. ESA s 7 th Earth Explorer Mission 2. An interferometric, polarimetric P-band SAR 3. To be deployed
Executive Summary. FIA-FSP Project Number: Project Title: Project Purpose: Management Implications:
 Executive Summary FIA-FSP Project Number: Project Title: Project Purpose: Management Implications: Y081171 Equivalent clear cut area thresholds in large-scale disturbed forests The purpose of this project
BelSAR : an Airborne Campaign for L-Band Full-Polarimetric and Interferometric Bistatic SAR Measurements over Belgium
 BelSAR : an Airborne Campaign for L-Band Full-Polarimetric and Interferometric Bistatic SAR Measurements over Belgium ESA Contract No. 4000117154/16/NL/FF/mc Anne Orban and Christian Barbier, Signal Processing
ESTIMATION OF THE RICE YIELD IN THE MEKONG DELTA USING SAR DUAL POLARISATION DATA
 ESTIMATION OF THE RICE YIELD IN THE MEKONG DELTA USING SAR DUAL POLARISATION DATA Nguyen Lam-Dao *a, Phung Hoang-Phi a, Juliane Huth b and Phung Cao-Van c a GIS and Remote Sensing Research Center, HCMC
The Art of Timber Cruising Part II Fixed-Area Plots
 The Art of Timber Cruising Part II Fixed-Area Plots In this second article on timber cruising, we will be looking at a simple method of preparing a basic description of the forest compartments in your
Wetland Vegetation Monitoring Protocol
 Wetland Vegetation Monitoring Protocol Terrestrial Long-term Fixed Plot Monitoring Program Regional Watershed Monitoring and Reporting November 2011 Report prepared by: Natasha Gonsalves, Environmental
Video 1. From any other page, click the button above to return to this Contents page
 FIREFIGHTER SAFETY SERIES FIRE BEHAVIOR IN THE WILDLAND/URBAN INTERFACE Sponsored by Wildland/Urban Interface Working Team USDA Forest Service US Department of the Interior Bureau of Indian Affairs Bureau
2011 GIS Symposium 1
 2011 GIS Symposium 1 What is Thermal Imaging? Infrared radiation is perceived as heat Heat is a qualitative measure of temperature Heat is the transfer of energy Energy can be quantitatively i measured
Earth Observation for Sustainable Development of Forests (EOSD) - A National Project
 - A National Project") Earth Observation for Sustainable Development of Forests (EOSD) - A National Project D. G. Goodenough 1,5, A. S. Bhogal 1, A. Dyk 1, R. Fournier 2, R. J. Hall 3, J. Iisaka 1, D. Leckie 1, J. E. Luther
Earth Observation for Sustainable Development of Forests (EOSD) - A National Project D. G. Goodenough 1,5, A. S. Bhogal 1, A. Dyk 1, R. Fournier 2, R. J. Hall 3, J. Iisaka 1, D. Leckie 1, J. E. Luther
Tree Trails 1-3. Tree Measurement
 TREE TRAILS Tree Trails 1-3 SECONDARY Tree Measurement Tree measurement is fundamental to the practice of forestry. Foresters count trees and measure trees. With just a few basic measurements, we can assign
CROP SPECIES RECOGNITION AND DISCRIMINATION PADDY-RICE-GROWING- FIELDS FROM REAPED-FIELDS BY THE RADAR VEGETATION INDEX (RVI) OF ALOS-2/PALSAR2
 OF ALOS-2/PALSAR2") CROP SPECIES RECOGNITION AND DISCRIMINATION PADDY-RICE-GROWING- FIELDS FROM REAPED-FIELDS BY THE RADAR VEGETATION INDEX (RVI) OF ALOS-2/PALSAR2 Y. Yamada a a Institute for Rural Engineering, National Agriculture
CROP SPECIES RECOGNITION AND DISCRIMINATION PADDY-RICE-GROWING- FIELDS FROM REAPED-FIELDS BY THE RADAR VEGETATION INDEX (RVI) OF ALOS-2/PALSAR2 Y. Yamada a a Institute for Rural Engineering, National Agriculture
In-Situ soil moisture and its relation to remotely sensed retrievals
 In-Situ soil moisture and its relation to remotely sensed retrievals Heye Bogena, Carsten Montzka and Harry Vereecken Agrosphere Institute, Forschungszentrum Jülich Soil moisture Soil moisture is: A key
Providing crop information using RADARSAT-1 and satellite optical imagery
 PREPRINT/PRÉTIRAGE Providing crop information using RADARSAT-1 and satellite optical imagery H. McNairn 1, J. Ellis 2, J.J. van der Sanden 1, T. Hirose 2 and R.J. Brown 1 1 Canada Centre for Remote Sensing
EVALUATING WATER REQUIREMENTS OF DEVELOPING WALNUT ORCHARDS IN THE SACRAMENTO VALLEY
 EVALUATING WATER REQUIREMENTS OF DEVELOPING WALNUT ORCHARDS IN THE SACRAMENTO VALLEY Allan Fulton ABSTRACT Most of the research on irrigation of walnuts has primarily focused on plant water relations and
Research and Applications using Realtime Direct Broadcast Imagery, Weather Radar, and LiDAR in Disaster Response and Preparedness
 Research and Applications using Realtime Direct Broadcast Imagery, Weather Radar, and LiDAR in Disaster Response and Preparedness Richard P. Watson, Ph.D. University of New Mexico Earth Data Analysis Center
JECAM Synthetic Aperture Radar (SAR) Cross Site Experiments. JECAM Meeting, October 2016, Ukraine
 Cross Site Experiments. JECAM Meeting, October 2016, Ukraine") JECAM Synthetic Aperture Radar (SAR) Cross Site Experiments JECAM Meeting, October 2016, Ukraine Recent (2016) Developments Preliminary roadmap for the JECAM SAR cross sites experiments presented at 2015
JECAM Synthetic Aperture Radar (SAR) Cross Site Experiments JECAM Meeting, October 2016, Ukraine Recent (2016) Developments Preliminary roadmap for the JECAM SAR cross sites experiments presented at 2015
Nancy L. Young, Forester USAID/USDA Natural Resources Conservation Service
 Forest Management Nancy L. Young, Forester USAID/USDA Natural Resources Conservation Service Material translated by: Mohammadullah Karimi, Training & Liaison Officer Afghan Conservation Corps Managing
Water Use and Yield Response of Potatoes
 172 Water Use and Yield Response of Potatoes Carl Shaykewich, Department of Soil Science, University of Manitoba, Winnipeg, MB R3T 2N2 shaykew@ms.umanitoba.ca Richard Raddatz, Meteorological Service, Environment
JECAM SAR Inter-Comparison Experiment
 JECAM SAR Inter-Comparison Experiment Crop Type Identification & Mapping Laura Dingle Robertson, Andrew Davidson, Heather McNairn, Mehdi Hosseini, Scott Mitchell, & Michael H. Cosh February 15, 2018 Agenda
Soil Respiration and Carbon Sequestration of an Oakgrass Savanna in California: Roles of temperature, soil moisture, rain events and photosynthesis
 001-006 Mission Kearney Foundation of Soil Science: Soil Carbon and California's Terrestrial Ecosystems Final Report: 000, 1/1/003-1/31/00 Soil Respiration and Carbon Sequestration of an Oakgrass Savanna
Development of a Multiscale Monitoring and Health Assessment Framework for Effective Management of Levees and Flood-Control Infrastructure Systems
 Development of a Multiscale Monitoring and Health Assessment Framework for Effective Management of Levees and Flood-Control Infrastructure Systems M. Zeghal, T. Abdoun and B. Yazıcı Rensselaer Polytechnic
Department of Environmental Sciences, Nanjing Institute of Meteorology, Nanjing , China
 Evaluation of Remote Sensing Approaches to Monitor Crop Conditions under Specific Input Levels and Cropping Diversity X. Guo 1, Y. Zheng 1,4, O. Olfert 2, S. Brandt 3, A.G. Thomas 2, R.M. Weiss 2, L. Sproule
Artificial Intelligence applied for electrical grid inspection using drones
 Artificial Intelligence applied for electrical grid inspection using drones 11/08/2018-10.22 am Asset management Grid reliability & efficiency Network management Software Drones are being used for overhead
SAR forest canopy penetration depth as an indicator for forest health monitoring based on leaf area index (LAI)
") SAR forest canopy penetration depth as an indicator for forest health monitoring based on leaf area index (LAI) Svein Solberg 1, Dan Johan Weydahl 2, Erik Næsset 3 1 Norwegian Forest and Landscape Institute,
SAR forest canopy penetration depth as an indicator for forest health monitoring based on leaf area index (LAI) Svein Solberg 1, Dan Johan Weydahl 2, Erik Næsset 3 1 Norwegian Forest and Landscape Institute,
Turbidity-controlled suspended sediment sampling
 Summer 1996 Turbidity-controlled suspended sediment sampling Jack Lewis and Rand Eads Pacific Southwest Research Station, USDA-Forest Service, Arcata, California For estimating suspended sediment concentration
Recent cal/val activities at the REMEDHUS network (Spain)
") Centro Hispano Luso de Investigaciones Agrarias University of Salamanca (Spain) Water Resources Research Group (www.usal.es/hidrus) Recent cal/val activities at the REMEDHUS network (Spain) José Martínez-Fernández
Centro Hispano Luso de Investigaciones Agrarias University of Salamanca (Spain) Water Resources Research Group (www.usal.es/hidrus) Recent cal/val activities at the REMEDHUS network (Spain) José Martínez-Fernández
Woodland owners routinely want to measure property acreage,
 Archival copy. For current version, see: https://catalog.extension.oregonstate.edu/ec119 Tools for Measuring Your Forest EC 119 Revised November 014 Steve Bowers, Tristan Huff Woodland owners routinely
K&C Phase 4 Status report. Retrieval of forest biomass and biomass change with spaceborne SAR
 K&C Phase 4 Status report Retrieval of forest biomass and biomass change with spaceborne SAR Johan Fransson 1, Jonas Fridman 1, Ivan Huuva 1 Håkan Olsson 1, Henrik Persson 1, Jörgen Wallerman 1, Maurizio
K&C Phase 4 Status report. Retrieval of forest biomass and biomass change with spaceborne SAR
 K&C Phase 4 Status report Retrieval of forest biomass and biomass change with spaceborne SAR Johan Fransson 1, Jonas Fridman 1, Ivan Huuva, Håkan Olsson 1, Henrik J. Persson 1, Jörgen Wallerman 1, Maurizio
Soil Water Monitoring Using Wireless Sensor Network
 Soil Water Monitoring Using Wireless Sensor Network Ruixiu Sui USDA-ARS Crop Production Systems Research Unit Stoneville, Mississippi Mississippi Water Resources Conference Jackson, MS April 7-8, 2015
A Tool To DeTerMIne CroWn AnD PloT CAnoPy TrAnSPArenCy For ForeST InvenTory AnD AnAlySIS PHASe 3 PloTS USInG DIGITAl PHoToGrAPHS
 2010 Joint Meeting of the Forest Inventory and Analysis (FIA) Symposium and the Southern Mensurationists A Tool To DeTerMIne CroWn AnD PloT CAnoPy TrAnSPArenCy For ForeST InvenTory AnD AnAlySIS PHASe 3
Performance Evaluation Performance (PEP) Preliminary Results Report 31 July 2017
 Preliminary Results Report 31 July 2017") Performance Evaluation Performance (PEP) Report 31 July 217 Solar Cooker: Sport with Reflector Manufacturer: Solavore Cookware: Granite Ware Greenhouse material: None Standard Cooking Power: 5.5 Watts
Performance Evaluation Performance (PEP) Report 31 July 217 Solar Cooker: Sport with Reflector Manufacturer: Solavore Cookware: Granite Ware Greenhouse material: None Standard Cooking Power: 5.5 Watts
SOIL MOISTURE SENSING FROM LOCAL TO GLOBAL
 Lublin, 10/05/2018 SOIL MOISTURE SENSING FROM LOCAL TO GLOBAL Mateusz Łukowski, Radosław Szlązak, Łukasz Gluba, Bogusław Usowicz, Jan Słominski, Jerzy Usowicz, Helena Łoś, Kamil Szewczak Why soil moisture
2015 Wisconsin Envirothon KEY Forestry Exam
 2015 Wisconsin Envirothon KEY Forestry Exam Answers that are correct but differ strongly from answer key must be initialized by Station Captain as an approved answer prior to delivery to score stewards.
II. Presentation of the Project
 I. Introduction The Royal Canadian Mounted Police started using Unmanned Aerial Vehicles to help with their work on collision and crime scene investigations. It allows the investigations to be conducted
Section 12. Crowns: Measurements and Sampling
 Section 12. Crowns: Measurements and Sampling 3.0 Phase 3 Field Guide - Crowns: Measurements and Sampling 12.1 OVERVIEW...2 12.2 CROWN DEFINITIONS...2 12.3 CROWN DENSITY-FOLIAGE TRANSPARENCY CARD...5 12.4
Role of Remote Sensing in Flood Management
 Role of Remote Sensing in Flood Management Presented by: Victor Veiga (M.Sc Candidate) Supervisors: Dr. Quazi Hassan 1, and Dr. Jianxun He 2 1 Department of Geomatics Engineering, University of Calgary
AGRICULTURAL PERFORMANCE MONITORING WITH POLARIMETRIC SAR AND OPTICAL IMAGERY
 AGRICULTURAL PERFORMANCE MONITORING WITH POLARIMETRIC SAR AND OPTICAL IMAGERY Tishampati Dhar [1][2], Doug Gray [1], Carl Menges [2] [1] Dept of Electrical and Electronic Engineering, University of Adelaide,
Performance Evaluation Performance (PEP) Preliminary Results Report 26 & 30 July 2017
 Preliminary Results Report 26 & 30 July 2017") Performance Evaluation Performance (PEP) Report 26 & 3 July 217 Solar Cooker: ASSC 2. Manufacturer: All Seasons Solar Cooker (ASSC) Cookware: Granite Ware Greenhouse material: Pyrex Standard Cooking Power:
Performance Evaluation Performance (PEP) Report 26 & 3 July 217 Solar Cooker: ASSC 2. Manufacturer: All Seasons Solar Cooker (ASSC) Cookware: Granite Ware Greenhouse material: Pyrex Standard Cooking Power:
JECAM SAR Inter-Comparison Experiment. Applying Operational SAR and Optical Classification Methodologies to Multiple
 SAR Inter-Comparison Experiment Component 1: Crop Type Identification & Mapping Activity 1: Regions Applying Operational SAR and Optical Classification Methodologies to Multiple 1a. Applying Agriculture
SAR sensors are imagined oil spill based on Bragg scattering theory. Bragg scattering is a
 We thank the reviewer for the many useful comments. They have been incorporated into the revised draft, and we detail here how we have done so. SAR sensors are imagined oil spill based on Bragg scattering
Performance Evaluation Process (PEP) Preliminary Results Report 9, 10 & 11 April 2017
 Preliminary Results Report 9, 10 & 11 April 2017") Performance Evaluation Process (PEP) Report 9, 1 & 11 April 217 Solar Cooker: CooKit Manufacturer: Solar Cookers International Cookware: Granite Ware Greenhouse material: Pyrex Standard Cooking Power:
Performance Evaluation Process (PEP) Report 9, 1 & 11 April 217 Solar Cooker: CooKit Manufacturer: Solar Cookers International Cookware: Granite Ware Greenhouse material: Pyrex Standard Cooking Power:
BelSAR : an Airborne Campaign for L-Band Full-Polarimetric and Interferometric Bistatic SAR Measurements over Belgium
 BelSAR : an Airborne Campaign for L-Band Full-Polarimetric and Interferometric Bistatic SAR Measurements over Belgium ESA Contract No. 4000117154/16/NL/FF/mc Anne Orban and Christian Barbier, Signal Processing
Farming with Crop Residues
 Farming with Crop Residues February 1992 How to use the photos Use these photographs of residue amounts to get a good picture in your mind of what the various percentages of ground cover might look like
Chapter 2 Timber Cruising
 Chapter 2 Timber Cruising Timber cruising is a procedure for determining the gross and net volume and value (timber quality) for a tract of timber. Cruising involves measuring tree diameter and height
The November 1 map is used by SAFRR to identify moisture concerns for the coming growing season and develop policy to address these concerns.
 Stubble Subsoil Moisture A Crop Planning Tool Ken Panchuk PAg. Provincial Soils Specialist Crop Development Branch Saskatchewan Agriculture, Food and Rural Revitalization Soils and Crops Workshop February
Forest Change Caused by Wind, Water, Ice, Fire, Insects/Disease & Harvesting
 Forest Change Caused by Wind, Water, Ice, Fire, Insects/Disease & Harvesting Why use remote sensing for mapping forest changes? Synoptic view of damage on a forest landscape or regional level. Can stop
Soil conditions and tree growth on rehabilitated and degraded sites: stewardship of British Columbia s forest soils.
 Soil conditions and tree growth on rehabilitated and degraded sites: stewardship of British Columbia s forest soils. Annual technical report- executive summary Project Y062250 Project Start date: April
Strip Cat. Strip Tillage Brochure
 Strip Cat Strip Tillage Brochure Strip Cat Strip Cat is a Strip Till tillage system that conforms to No Till guidelines while producing a seedbed similar to Conventional Tillage. Strip Till systems are
Rangeland and Oak Relationships 1
 Rangeland and Oak Relationships 1 Dick R. McCleery 2 Abstract: Hardwood rangelands are becoming an endangered resource on the Central Coast of California. Straightforward inventory processes and management
Appendix A (Project Specifications) Patton Mill Fuel Break Project
 Patton Mill Fuel Break Project") Appendix A (Project Specifications) Patton Mill Fuel Break Project I. Proposed Actions: A. Construct a Fuel Break (approximately 5 miles, about 120 acres): The fuel break is located along a segment of
Appendix A (Project Specifications) Patton Mill Fuel Break Project I. Proposed Actions: A. Construct a Fuel Break (approximately 5 miles, about 120 acres): The fuel break is located along a segment of
Performance Evaluation Performance (PEP) Preliminary Results Report 31 July 2017
 Preliminary Results Report 31 July 2017") Performance Evaluation Performance (PEP) Report 31 July 217 Solar Cooker: SK-14 Manufacturer: Muni Seva Ashram Cookware: Granite Ware Greenhouse material: None Standard Cooking Power: 347 Watts SCI Test
Performance Evaluation Performance (PEP) Report 31 July 217 Solar Cooker: SK-14 Manufacturer: Muni Seva Ashram Cookware: Granite Ware Greenhouse material: None Standard Cooking Power: 347 Watts SCI Test
Airborne Laser Scanning (ALS) for forestry applications
 for forestry applications") Airborne Laser Scanning (ALS) for forestry applications International School on Lidar Technology 2008 IIT Kanpur, India Norbert Pfeifer + I.P.F.-Team http://www.ipf.tuwien.ac.at/ Christian Doppler Laboratory
Airborne Laser Scanning (ALS) for forestry applications International School on Lidar Technology 2008 IIT Kanpur, India Norbert Pfeifer + I.P.F.-Team http://www.ipf.tuwien.ac.at/ Christian Doppler Laboratory
Advanced EO system for the Japanese Small Satellite ASNARO
 PSD-ASNR-P-CMTO-ZE-0050-10 SCC11-IV-4 Advanced EO system for the Japanese Small Satellite ASNARO Shuhei Hikosaka, Tetsuo Fukunaga PASCO CORPORATION Toshiaki Ogawa NEC CORPORATION Shoichiro Mihara Institute
UAS In Agriculture A USDA NIFA Perspective; Appropriate Science, Possibilities, and Current Limitations
 UAS In Agriculture A USDA NIFA Perspective; Appropriate Science, Possibilities, and Current Limitations Steven J. Thomson, Ph.D National Program Leader Background Faculty member at Virginia Tech for seven
Guide to Forest Aesthetics in Montana
 Guide to Forest Aesthetics in Montana Actively managing forests to insure their health and value often requires activities such as road building and commercial logging. In some situations, such activities
PERFORMANCE OF AN IN-KILN MOISTURE METER - PRELIMINARY RESULTS -
 PERFORMANCE OF AN IN-KILN MOISTURE METER - PRELIMINARY RESULTS - Tom A. Breiner and Stephen L. Quarles University of California Forest Products Laboratory Richmond, California INTRODUCTION In-kiln measurement
11. Precision Agriculture
 Precision agriculture for crop production can be defined as a management system that: is information- and technology-based is site-specific uses one or more of the following sources of data for optimum