Updated Ambient Concentrations of Toxic Chemicals in San Francisco Bay Sediments
|
|
|
- Moses Lawson
- 6 years ago
- Views:
Transcription
1 CLEAN WATER / RMP NUMBER 749 JULY 2015 Updated Ambient Concentrations of Toxic Chemicals in San Francisco Bay Sediments July 2015 By: Don Yee, Philip Trowbridge and Jennifer Sun SAN FRANCISCO ESTUARY INSTITUTE 4911 Central Avenue, Richmond, CA p: (SFEI) f:
2 THIS REPORT SHOULD BE CITED AS: Yee, D., Trowbridge, P., and Sun, J Updated Ambient Concentrations of Toxic Chemicals in San Francisco Bay Sediments. San Francisco Estuary Institute, Richmond, CA. Contribution # 749. This work was supported by the Regional Monitoring Program for Water Quality in San Francisco Bay


3 Updated ambient concentrations of toxic chemicals in San Francisco Bay sediments July 24, 2015 Don Yee, Phil Trowbridge, and Jennifer Sun San Francisco Estuary Institute 4911 Central Avenue Richmond, CA
4 Introduction Regulation of dredging and dredged material disposal or reuse under the San Francisco Bay Long Term Management Strategy for Dredging (LTMS) involves, in part, evaluation of sediment chemistry characteristics. For dredged material in California, for most chemicals, there are no numeric sediment quality standards or objectives that define chemical suitability for disposal or reuse at particular placement sites. 1 Consequently, to evaluate potential pollution problems and regulate dredging, the San Francisco Bay Regional Water Quality Control Board (Regional Board) compares contaminant concentrations in Bay-dredged sediments to: (1) published contaminant screening values and other guidelines; (2) contaminant concentrations at reference sites; and (3) where available and appropriate, ambient sediment contaminant concentrations for the Bay as a whole. The first estimates of ambient sediment contaminant concentrations were made in 1998 by the Regional Board (SFBRWQCB, 1998). Since then, the ambient sediment concentrations have been updated in 2011, 2012, 2013, and 2014 for a only a small subset of high priority contaminants (mercury, polycyclic aromatic hydrocarbons [PAHs] and polychlorinated biphenyls [PCBs]). The calculations were not published in report but rather were posted on the website of the Regional Monitoring Program (RMP) for Water Quality in San Francisco Bay 2. The purpose of this memo is to update the ambient sediment contaminant concentrations for all contaminants routinely monitored by the RMP, including nearly all contaminants with 1998 ambient sediment contaminant concentrations, using the most recent RMP sediment data (through 2012). In this report, the term ambient sediment contaminant concentration refers to a reference ambient condition for regulatory use that is different from the Bay-wide average sediment concentrations reported by the San Francisco Estuary Institute (SFEI) in the RMP Pulse of the Estuary reports. The term refers to the upper limits of typical sediment concentrations, not average values. The 1998 Ambient Sediment Values The Regional Board established the first set of ambient sediment contaminant concentrations in 1998 to fulfill a need for reference concentrations of toxic chemicals in Bay sediments that staff could use to evaluate potential pollution problems (SFBRWQCB, 1998). Since San Francisco Bay sediments are not totally free of anthropogenic and naturally occurring pollutants, the Regional Board defined ambient sediment concentrations as the typical range of 1 Pursuant to the Water Quality Control Plan for Enclosed Bays and Estuaries - Part 1 Sediment Quality, California s Sediment Quality Objectives (SQOs) do not apply to dredged material suitability determinations. However, strict sediment chemistry limits may be established for individual contaminants or locations under Bay-wide TMDLs, sitespecific remediation decisions, etc. 2 The results of the ambient sediment concentration calculations calculated since 2011 can be found on the RMP website: 2
5 concentrations one would expect to find in sediment in the less polluted, or cleaner, portions of the Bay. Contaminant concentrations above the threshold were considered elevated relative to the ambient population of sediment data. The Regional Board derived the 1998 ambient concentrations using RMP and Bay Protection and Toxic Cleanup Program fixed-station data collected from , setting the thresholds at the 95% upper tolerance limit of the 85 th percentile concentrations (SFBRWQCB, 1998). Updated Ambient Sediment Values The original ambient sediment values from the 1998 analysis are now fairly old and are based on a relatively small data set compared to the amount of currently available sediment chemistry data from the RMP. In 2011, the LTMS agencies agreed upon a statistically robust definition of ambient Bay sediment contaminant concentrations that is relevant for dredged material regulatory use, while remaining based on data collected routinely by the RMP. Ambient sediment concentrations were defined as: the 90% upper confidence limit of the 90th percentile concentrations using the most recent 10 years of data from the RMP s randomized Bay-wide sediment sampling stations, after removal of statistical outliers due to highly contaminated samples (USACE/USEPA, 2011). In 2011, SFEI and the LTMS agencies updated the ambient values for a small subset of sediment contaminants that are subject to total maximum daily load (TMDL) limits for in-bay dredged material disposal (mercury and total PCBs) and/or bioaccumulation testing thresholds (mercury, total PCBs, total PAHs, total DDTs, total chlordane, dieldrin, and dioxins/furans). In subsequent years, the ambient values for mercury, total PCBs, and total PAHs have been updated with newer data and the latest results have been published on the RMP website 2. This memo contains the latest update to the ambient sediment contaminant concentrations for not just the contaminants associated with TMDLs or bioaccumulation testing but also another 91 contaminants that have been routinely monitored in Bay sediments by the RMP. The ambient contaminant concentrations were calculated using the methodology outlined in USACE/USEPA (2011) using valid data from the most recent 10 years of the RMP s randomized Bay-wide sediment sampling. For metals and other inorganic contaminants, data from 10 rounds of sediment sampling between 2003 and 2012 were used in the analysis. The analysis of organic contaminants was based on 8 rounds of sediment sampling from 2002, 2003, and Data for organic contaminants includes data collected and analyzed by the RMP during and Organic contaminant data collected and analyzed by the RMP in the period have been excluded from the calculation due to an laboratory analytical artifact discovered in 2013 that resulted in underestimates of concentrations by 40% to 400% for a subset of samples later selected for reanalysis. Performance on quality control samples conducted with the initial analyses were within typical method acceptance limits (e.g., for EPA 1668 for PCBs). However, the QC samples were less impacted by the artifact (incomplete extraction due to moisture) for various reasons; certified reference materials typically are distributed pre-dried and homogenized, and matrix spikes 3
6 For dioxins/furans, the analysis is based on data from because these contaminants were only measured as an RMP special study for this period. Data from historical fixed sampling stations that are not part of the RMP randomized sampling design were excluded. Outliers were removed to exclude any highly contaminated samples using an updated methodology described in Appendix A 4. The RMP field sampling methodology includes visual selection of fine-grained sediments, and thus the ambient concentrations are representative of sediments with greater than 40% fines, which is typical of most sediments dredged in the Bay. Table 1 compares the Bay s updated ambient sediment contaminant concentrations ( data) to the original values from the SFBRWQCB (1998) report ( data). Histograms illustrating the outliers and the ambient values for each of the contaminants are displayed in Appendix B. Ambient sediment concentrations ( ) calculated as the 99th percentile 90% UTL are listed in Appendix C. Discussion The updated ambient sediment concentrations are generally lower than the values from the SFBRWQCB (1998) report but the changes vary by the type of contaminant. For metals, the updated ambient concentrations are % lower than the SFBRWQCB (1998) values. The updated ambient concentrations for individual pesticides are 33-94% lower than the previous values. Total PCB concentrations (total of 40 congeners) are 15% lower. The one exception to this pattern is PAHs. Changes in the ambient concentrations of individual PAHs are mixed, but ambient concentrations of total PAHs (total of 25 contaminants listed in Table 1) are 34% higher than the values in the SFBRWQCB (1998) report. This analysis of change was not possible for a number of contaminants because ambient concentrations were not calculated in The observed changes in the ambient sediment contaminant concentrations between this memo and the SFBRWQCB (1998) report likely have many explanations. First, the sampling design has changed from a fixed-station design in to a randomized design in Second, the algorithm used to calculate the ambient concentrations has changed and an automated method for identifying and excluding outliers has been added. Finally, the changes may reflect actual trends in the environment such as a spike of PAH concentrations in the Bay following the Cosco Busan oil spill in 2007 (SFEI, 2013). Ambient sediment concentrations can be used by the LTMS agencies in a variety of ways, including as a basis for considering updates to guidelines for beneficial reuse of dredged material at wetland restoration project sites near the margins of the Bay. However, it is important to note are typically added only shortly before analysis and thus not deeply embedded in the matrix where moisture would more impact extraction. Exclusion of this data has only had a moderate impact on the estimate of the 2014 ambient concentrations (based on and data, a 90th percentile 90% UTL of 18.3 ug/kg dw for total PCBs shown in Table 1) compared to the 2013 ambient values (based on data, a 90th percentile 90% UTL of 17.4 ug/kg dw). 4 The description provided in Appendix A is also available at the following link: 4
7 that even if contaminant concentrations in a dredged material project are below the upper bound calculations of ambient sediment concentrations, this alone does not indicate that the dredged material is suitable for placement at any particular site. Ambient levels may be higher than environmentally desirable for some placement sites, while at other sites ambient concentrations may be far below levels of concern that need to be regulated. Ambient concentrations by themselves are not sediment screening values, and should not be used to make regulatory decisions. However, understanding how potential regulatory goals or limits under consideration may relate to existing Bay ambient sediment concentrations can be important in informing regulatory decisions that are both effective and feasible to implement. Recommendations The methodology for calculating ambient sediment contaminant concentrations calls for using the most recent 10 years of data (USACE/USEPA, 2011). However, starting in 2014, the RMP reduced the frequency of open Bay sediment sampling to once every 4 years. The result is that a 10-year time window will only include 3 sampling rounds with the new RMP sampling schedule. The calculated ambient concentrations will be based on less data and might be less stable. For comparison, the values in this report are based on 8-10 rounds of sediment sampling. To address this potential problem, the LTMS agencies may wish to consider a change to the calculation methodology. At a minimum, it is recommended that the time window for data be increased to 13 years, which would allow for 4 sets of data in each calculation. Another option is to specify a minimum number of data sets and an upper limit time window required in order to run the calculation of an ambient sediment concentration for a particular contaminant (e.g., 4 datasets less than 15 years old). The latter approach would be helpful for determining which contaminants will have enough data to calculate updated values since the target parameters for RMP sampling sometimes change. Further, the frequency of updates to the ambient sediment contaminant concentrations should match the frequency of RMP open Bay sediment sampling. It is recommended that the ambient sediment contaminant concentrations for mercury, PCBs, and PAHs be recalculated after each new round of RMP sediment sampling. For the longer list of contaminants, updates should occur after every other sampling round or every 8 years. References San Francisco Bay Regional Water Quality Control Board Staff Report: Ambient Concentrations of Toxic Chemicals in San Francisco Bay Sediments. San Francisco Bay Regional Water Quality Control Board, Oakland, CA. 5
8 San Francisco Estuary Institute The Pulse of the Bay: Contaminants of Emerging Concern. SFEI Contribution 701. San Francisco Estuary Institute, Richmond, CA. U.S. Army Corps of Engineers and U.S. Environmental Protection Agency, Region Memo to Robert S. Hoffmann, National Marine Fisheries Service, Long Beach, CA. AL% pdf 6
9 Table 1. Ambient contaminant concentrations in San Francisco Bay area sediments. Contaminant Ambient Sediment Values from SFBRWQCB (1998) 2 (85th Percentile 95% UTL 4 ) Updated Ambient Sediment Values from this report 3 (90th Percentile 90% UTL 4 ) METALS (mg/kw dw) Arsenic Cadmium Chromium NA Copper Lead Mercury Nickel Selenium Silver Zinc PESTICIDES (ug/kg dw) , Aldrin NA 0.03 Total Chlordane Dieldrin Endrin NA 0.01 Total DDT (total of 6 isomers) DDD(o,p') NA 0.51 DDD(p,p') NA 1.98 DDE(o,p') NA 0.11 DDE(p,p') NA 1.98 DDT(o,p') NA 0.04 DDT(p,p') NA 0.27 Total HCH Hexachlorobenzene PAH (ug/kg dw) , Total PAH Total HPAH Total LPAH Acenaphthene Acenaphthylene Anthracene Benz(a)anthracene
10 Contaminant Ambient Sediment Values from SFBRWQCB (1998) 2 (85th Percentile 95% UTL 4 ) Updated Ambient Sediment Values from this report 3 (90th Percentile 90% UTL 4 ) Benzo(a)pyrene Benzo(b)fluoranthene Benzo(e)pyrene Benzo(g,h,i)perylene Benzo(k)fluoranthene Biphenyl Chrysene Dibenz(a,h)anthracene Dibenzothiophene NA 16.3 Dimethylnaphthalene, 2, Fluoranthene Fluorene Indeno(1,2,3-c,d)pyrene Methylnaphthalene, Methylnaphthalene, Methylphenanthrene, Naphthalene Perylene Phenanthrene Pyrene Trimethylnaphthalene, 2,3, PCB (ug/kg dw) , Total PCB (sum of 40 congeners) PCB 8 NA 0.14 PCB 18 NA 0.07 PCB 28 NA 0.28 PCB 31 NA 0.13 PCB 33 NA 0.08 PCB 44 NA 0.33 PCB 49 NA 0.25 PCB 52 NA 0.39 PCB 56 NA 0.14 PCB 60 NA 0.07 PCB 66 NA 0.48 PCB 70 NA
11 Contaminant Ambient Sediment Values from SFBRWQCB (1998) 2 (85th Percentile 95% UTL 4 ) Updated Ambient Sediment Values from this report 3 (90th Percentile 90% UTL 4 ) PCB 87 NA 0.46 PCB 95 NA 0.60 PCB 99 NA 0.65 PCB 101 NA 1.15 PCB 105 NA 0.36 PCB 110 NA 1.04 PCB 118 NA 0.98 PCB 128 NA 0.28 PCB 132 NA 0.37 PCB 138 NA 1.83 PCB 141 NA 0.20 PCB 149 NA 1.25 PCB 151 NA 0.56 PCB 153 NA 1.74 PCB 156 NA 0.16 PCB 158 NA 0.15 PCB 170 NA 0.47 PCB 174 NA 0.49 PCB 177 NA 0.36 PCB 180 NA 1.02 PCB 183 NA 0.37 PCB 187 NA 0.87 PCB 194 NA 0.33 PCB 195 NA 0.11 PCB 201 NA 0.05 PCB 203 NA 0.17 PBDE (ug/kg dw) , Total PBDE NA 5.47 DIOXIN (ng TEQ/kg dw) Sum of Dioxins TEQ NA 1.83 Sum of Furans TEQ NA RMP stopped monitoring chromium in NA = Data Not Available 3 The time period over which data was used to calculate the 2014 ambient sediment values are shown in the contaminant category titles. 4 UTL = upper tolerance limit 9
12 Appendix A Updated Outlier Detection Method Summary The report from USACE/USEPA (2011) contained an automated outlier detection method (see Attachment 3 of that report). This appendix describes the modifications that have been made to methodology from USACE/USEPA (2011) to make the statistical methods more robust. Background Using the original coding of the R script for identifying outliers, the addition of RMP PCB data from 2011 to the previous data set ( ) resulted in a statistical artifact that caused a large percentage of the data (~11%) to be regarded as outliers; previous years analyses considered most of these same points not outliers (1% or less of the data were outliers). This issue arose due to a randomly occurring tight cluster of values in one portion of the distribution. The original outlier function used a moderately small percentage of the total data set (2.5%, with a minimum of 12 values) to determine a local average difference expected between points. This very tight cluster of values resulted in a gap to the next higher value (between 15.9 and 16.7 ppb) that had previously been considered unremarkable (<10x the local average difference) to be labeled as the gap to a set of outliers when the 2011 data were included. Modifications to the Outlier Detection Method in USACE/USEPA (2011) To prevent future flagging of such chance statistical anomalies as outlier gaps, the following modifications to the outlier auto-detection function have been made: 1. A larger percentage of the nearest lower values (5% of the total data) are used to calculate a local average difference. Increasing from 2.5 % to 5% of the population decreases the influence of any small cluster of tightly spaced points (the anomaly seen in the data set). However, in the upper tail of the data distribution where we usually expect sparser spacing, using a larger percentage of the population decreases the apparent local difference by averaging in some more tightly spaced points in the main body of the distribution, potentially flagging more gaps. This change stabilizes the local average difference, decreasing the probability of finding gaps in the main body of the distribution, but increasing the likelihood in sparse areas of the upper tail. 2. Any outlier has to be at least 25% greater than the mean of its nearest lower neighbors (a running average 10% of the total data) to be considered meaningful. In many laboratory chemical analyses, a 25% difference in replicate measurements is acceptable, so the difference between a possible outlier and its nearest lower neighbors should be at least as large to account for measurement uncertainty. The difference to a running average of nearest lower neighbors rather than a single nearest lower neighbor is used, as otherwise a few values between low and high 10
13 concentration groups could bridge apparent gaps, causing no outliers to be found. The use of 10% of the data for the running average further ensures that a small set of sparse values cannot bridge the zone between low and high concentration groups. 3. Since our concern is about high outlier values, any outlier has to occur above the upper quartile value. This avoids a case where a minority of very low values (e.g., clean sites near Golden Gate) would create an apparent gap to the main population of results, causing all of the latter to be called outliers. Using the upper quartile as the threshold, a bimodal distribution, in which a slight majority of the data is in the lower group, would still result in the upper portion labeled as outliers. Imposing all three of the modifications described above makes the detection of outlier groups more stable and resistant to chance anomalies in the data distribution. The current data set now includes 10 years of data, and future calculations using the USAOC/USEPA ambient sediment calculation method will only include the most recent 10 years of data. Existing outlier groups are therefore unlikely to change just by the filling in of gaps using new data with similar concentration distributions; only larger and real shifts in distribution (e.g., 5% or more of the total data bridging the gaps) will cause appreciable shifts in the subset of points being identified as outliers. 11
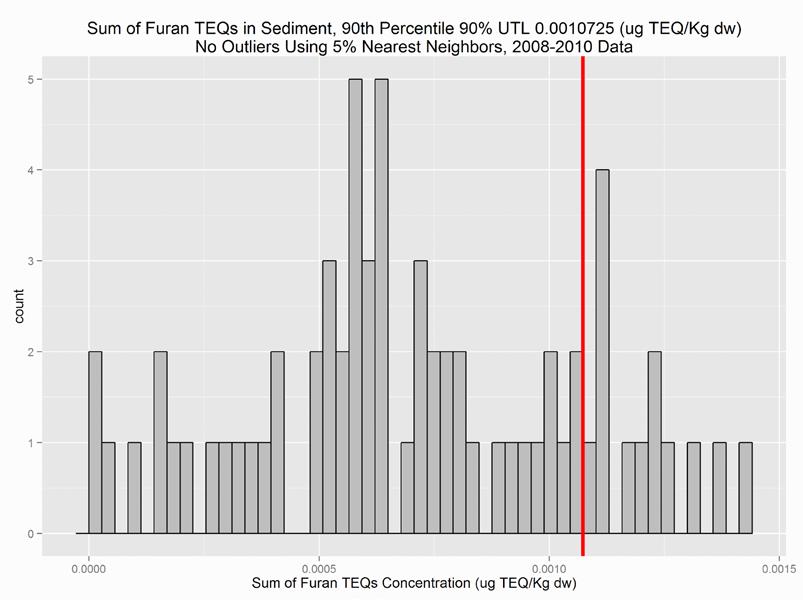
14 Appendix B Histograms of RMP Sediment Data The RMP sediment data used to update the ambient sediment contaminant concentrations are shown on the following histogram plots. On each plot, the histogram shows the distribution of all RMP sediment data from randomized stations, the red line indicates the 90% upper tolerance limit of the 90th percentile concentration, and the title contains the concentration above which results were considered outliers. The years of data used in the analysis are also listed in the title to each plot. 12

15 Trace Metals 13

16 14


17 15


18 16
19 17
20 Pesticides 18
21 19
22 20

23 21
24 22
25 23
26 24
27 PAHs 25

28 26
29 27
30 28
31 29
32 30
33 31
34 32
35 33
36 34

37 35
38 36
39 37
40 38
41 39
42 PCBs 40
43 41

44 42
45 43
46 44
47 45
48 46
49 47
50 48
51 49
52 50
53 51
54 52
55 53
56 54
57 55
58 56
59 57
60 58
61 59
62 60
63 PBDEs 61

64 Dioxin TEQs 62
65 Appendix C Table of ambient sediment values using data, calculated as the 99th percentile 90% UTL Contaminant Updated Ambient Sediment Values from this report 1 (99th Percentile 90% UTL 2 ) METALS (mg/kw dw) Arsenic 19 Cadmium 0.48 Copper 71.2 Lead 33.2 Mercury 0.47 Nickel 118 Selenium 0.49 Silver Zinc PESTICIDES (ug/kg dw) , Aldrin 0.06 Total Chlordane 0.60 Dieldrin 0.20 Endrin 0.02 Total DDT (total of 6 isomers) 6.29 DDD(o,p') 0.74 DDD(p,p') 2.74 DDE(o,p') 0.22 DDE(p,p') 2.92 DDT(o,p') 0.06 DDT(p,p') 0.60 Total HCH 0.12 Hexachlorobenzene 0.42 PAH (ug/kg dw) , Total PAH 9100 Total HPAH 5830 Total LPAH 946 Acenaphthene 20.3 Acenaphthylene 52.2 Anthracene
66 Contaminant Updated Ambient Sediment Values from this report 1 (99th Percentile 90% UTL 2 ) Benz(a)anthracene 253 Benzo(a)pyrene 1230 Benzo(b)fluoranthene 280 Benzo(e)pyrene 473 Benzo(g,h,i)perylene 654 Benzo(k)fluoranthene 455 Biphenyl 17.1 Chrysene 486 Dibenz(a,h)anthracene 106 Dibenzothiophene 28.7 Dimethylnaphthalene, 2, Fluoranthene 792 Fluorene 58 Indeno(1,2,3-c,d)pyrene 491 Methylnaphthalene, Methylnaphthalene, Methylphenanthrene, Naphthalene 70.6 Perylene 319 Phenanthrene 258 Pyrene 1120 Trimethylnaphthalene, 2,3,5-9.8 PCB (ug/kg dw) , Total PCB (sum of 40 congeners) 29.6 PCB PCB PCB PCB PCB PCB PCB PCB PCB PCB PCB
67 Contaminant Updated Ambient Sediment Values from this report 1 (99th Percentile 90% UTL 2 ) PCB PCB PCB PCB PCB PCB PCB PCB PCB PCB PCB PCB PCB PCB PCB PCB PCB PCB PCB PCB PCB PCB PCB PCB PCB PCB PCB PBDE (ug/kg dw) , Total PBDE 21.4 DIOXIN (ng TEQ/kg dw) Sum of Dioxins TEQ 2.69 Sum of Furans TEQ The time period over which data was used to calculate the ambient sediment values are shown in the contaminant category titles. 2 UTL = upper tolerance limit 65
TECHNICAL MEMORANDUM
 Date: February 26, 2016 TECHNICAL MEMORANDUM To: From: Re: Brian Ross, USEPA Region 9, Dredging & Sediment Management Team Beth Christian, San Francisco Bay Regional Water Quality Control Board Don Yee
California Regional Water Quality Control Board San Francisco Bay Region
 California Regional Water Quality Control Board San Francisco Bay Region Linda S. Adams Secretary for Environmental Protection 1515 Clay Street, Suite 1400, Oakland, California 94612 (510) 622-2300 Fax
Beneficial Reuse of Dredged Materials: Sediment Screening and Testing Guidelines
 Draft Staff Report Beneficial Reuse of Dredged Materials: Sediment Screening and Testing Guidelines May 2000 For Planning Purposes Only This document is for planning uses and the determination of general
Performed Environmental
 Monitoring of Waterborne Indicator Bacteria, Sediments and Nutrients within the San Lorenzo River and Branciforte Creek Performed by the City of Santa Cruz Environmental Laboratory & Environmental Compliance
EXPORT SOIL-MATERIAL QUALITY REQUIREMENTS
 EXPORT SOIL-MATERIAL QUALITY REQUIREMENTS GENERAL Industrial operations have been conducted on Port of Long Beach property since the 1930s. Though it is unlikely that hazardous substances will be encountered
SURPLUS SOIL-MATERIAL REUSE REQUIREMENTS
 SURPLUS SOIL-MATERIAL REUSE REQUIREMENTS GENERAL Surplus soil-materials generated from most, if not all, Long Beach Harbor Department projects are unlikely to meet established Port Export Soil-material
Organic Contaminants in Sentinel Shellfish
 Organic Contaminants in Sentinel Shellfish 2006 Data October 2009 TR 2009/114 Auckland Regional Council Technical Report No.114 October 2009 ISSN 1179-0504 (Print) ISSN 1179-0512 (Online) ISBN 978-1-877540-29-5
Public Notice. Monitoring the US West Coast: An Assessment of California s Estuaries and the Pacific Ocean Year 2002 Pilot Wetland Assessment
 Public Notice Monitoring the US West Coast: An Assessment of California s Estuaries and the Pacific Ocean Year 2002 Pilot Wetland Assessment San Francisco Bay Intensification Project San Francisco Estuary
Submittal Guidelines for Imported Soil. Soil Review & Acceptance Process
 The following guidelines are provided as a prescriptive step process to ensure the contractual and regulatory requirements for Baylands Soil Processing are met and the appropriate quality control documentation
Southern California Dredged Material Management Team (SC-DMMT) July 22, 2009 Meeting Notes
 July 22, 2009 Meeting Notes") Southern California Dredged Material Management Team (SC-DMMT) July 22, 2009 Meeting Notes I. Participating Agencies /Attendees: a. Jorine Campopiano (EPA) b. Jack Gregg (CCC) c. Mike Lyons (RWQCB - Region
Southern California Dredged Material Management Team (SC-DMMT) July 22, 2009 Meeting Notes I. Participating Agencies /Attendees: a. Jorine Campopiano (EPA) b. Jack Gregg (CCC) c. Mike Lyons (RWQCB - Region
EXPLORING RELATIONSHIPS IN A SEDIMENT-TISSUE BIOACCUMULATION DATABASE
 EXPLORING RELATIONSHIPS IN A SEDIMENT-TISSUE BIOACCUMULATION DATABASE T.J. Fredette 1, O. Guza 2, C.N. Farris 3, L.F. Lefkovitz 4, and S.J.Naber 5 ABSTRACT Testing of sediments proposed for dredging and
On March 6, 2014, 17 shallow soil samples were collected along the proposed trail alignment according to
 LAKE EWAUNA TRAIL LEVEL 2 FIELD SAMPLING ASSESSMENT the proposed alignment (Figure 1). The trail will also include the installation of a geothermal snow melt system, allowing for year round use of the
Urban Area Polycyclic Aromatic Hydrocarbons Study Tiered Approach to Corrective Action Objectives
 Urban Area Polycyclic Aromatic Hydrocarbons Study Tiered Approach to Corrective Action Objectives Two background studies were recently completed investigating certain polycyclic aromatic hydrocarbon (PAHs)
SAUGERTIES HARBOR, NY ESOPUS CREEK, NEW YORK FEDERAL NAVIGATION PROJECT MAINTENANCE DREDGING
 Public Notice In replying refer to: Public Notice No. SH-AFO-15 Published: March 23, 2015 Expires: April 21, 2015 New York District Albany Field Office 1 Bond Street Troy, N.Y. 12180 ATTN: CENAN-OP-A SAUGERTIES
Table 2. Washington United Terminal Project dredging characterization SAP Breakdown.
 CENWS-OD-TS-DMMO MEMORANDUM FOR: RECORD October 3, 2008 SUBJECT: DETERMINATION ON THE SUITABILITY OF PROPOSED MAINTENANCE DREDGED MATERIAL FROM PORT OF TACOMA WASHINGTON UNITED TERMINAL PROJECT HIGH SPOT
Ontario Soil Standards (other than sediment) II (mg/kg) Potable Ground Water Non-Potable Ground Water. Industrial/ Commercial
 II (mg/kg) Potable Ground Water Non-Potable Ground Water. Industrial/ Commercial") T3 Table 3 Soil quality benchmarks I Substance Ontario Soil Standards (other than sediment) II (mg/kg) Potable Ground Water Non-Potable Ground Water Canadian Environmental Quality Criteria and Guidelines
T3 Table 3 Soil quality benchmarks I Substance Ontario Soil Standards (other than sediment) II (mg/kg) Potable Ground Water Non-Potable Ground Water Canadian Environmental Quality Criteria and Guidelines
Petcoke-Coal Test. David L. MacIntosh, Sc.D., C.I.H., Chief Science Officer. January 13, 2014
 Petcoke-Coal Test Results David L. MacIntosh, Sc.D., C.I.H., Chief Science Officer January 13, 2014 Findings No evidence of petcoke or coal on surfaces or in soil of East Side and South Deering neighborhoods
TETRA TECH EM INC. March 18, Lynn Nakashima Project Manager Department of Toxic Substances Control 700 Heinz Avenue Berkeley, CA 94710
 TETRA TECH EM INC. March 18, 2008 Lynn Nakashima Project Manager Department of Toxic Substances Control 700 Heinz Avenue Berkeley, CA 94710 Subject: Sampling Results for Surface Soil in the Pampas Grass
Brent D. Mawdsley, B.Sc. ASL Analytical Service Laboratories Ltd Triumph St., Vancouver, BC V5L 1K5
 SPECIALIZED TESTING REQUIREMENTS TO MEET THE BC CONTAMINATED SITES REGULATION Brent D. Mawdsley, B.Sc. ASL Analytical Service Laboratories Ltd. 1988 Triumph St., Vancouver, BC V5L 1K5 ABSTRACT British
International Atomic Energy Agency. Department of Nuclear Sciences and Applications. IAEA Environment Laboratories
 International Atomic Energy Agency Department of Nuclear Sciences and Applications IAEA Environment Laboratories Vienna International Centre, P.O. Box 100, 1400 Vienna, Austria REFERENCE SHEET REFERENCE
APPENDIX M. HHERA Chemical Analysis Data Baseline Soil and Vegetation Samples
 Hangingstone Expansion Project Supplemental Submission Part 4 - Appendices Appendix M: HHERA Chemical Analysis Data Baseline Soil and Vegetation Samples February 2011 APPENDIX M HHERA Chemical Analysis
WASTE ACCEPTANCE CRITERIA AND DEVELOPMENT OF SOIL TRIGGER VALUES FOR EPA-LICENSED SOIL RECOVERY FACILITIES
 WASTE ACCEPTANCE CRITERIA AND DEVELOPMENT OF SOIL TRIGGER VALUES FOR EPA-LICENSED SOIL RECOVERY FACILITIES 1. Introduction This guidance document applies to soil recovery facilities which exceed the operational
VALIDATION OF A TWO-PHASE BIOASSAY FOR RISK ASSESSMENT OF CONTAMINATED SOILS
 1 VALIDATION OF A TWO-PHASE BIOASSAY FOR RISK ASSESSMENT OF CONTAMINATED SOILS By: Mariella Siña Supervisors: Staffan Lundstedt Umeå university Torbjörn Johnson Pelagia miljökonsult AB 2 Aim Evaluate a
HUMAN HEALTH RISK ASSESSMENT GUIDANCE FOR DREDGING AND DISPOSAL AT SEA OF MARINE AND ESTUARINE SEDIMENTS
 HUMAN HEALTH RISK ASSESSMENT GUIDANCE FOR DREDGING AND DISPOSAL AT SEA OF MARINE AND ESTUARINE SEDIMENTS Background and Objectives Human health risk assessment Chemical Risk Biological Risk Centre d'études
Shellfish Tissue Monitoring in Piscataqua Region Estuaries 2012
 University of New Hampshire University of New Hampshire Scholars' Repository PREP Reports & Publications Institute for the Study of Earth, Oceans, and Space (EOS) 9-24-2013 Shellfish Tissue Monitoring
What are the levels of toxic chemicals in the sediments of Casco Bay?
 4 What are the levels of toxic chemicals in the sediments of? Healthy bottom communities have a diverse assemblage of organisms. This healthy shallow water soft bottom benthic community includes eelgrass
TETRA TECH EM INC. February 13, 2008
 TETRA TECH EM INC. February 13, 2008 Greg Haet EH&S Associate Director, Environmental Protection Office of Environment, Health & Safety University of California, Berkeley University Hall, 3rd Floor #1150
ONGOING INPUTS OF PERSISTENT ORGANIC POLLUTANTS TO THE ANACOSTIA RIVER
 ONGOING INPUTS OF PERSISTENT ORGANIC POLLUTANTS TO THE ANACOSTIA RIVER Nathalie Lombard, Mandar Bokare, Varapapa Thodpanich, Sam Magee, Upal Ghosh Department of Chemical, Biochemical, and Environmental
Southern California Dredged Material Management Team (SC-DMMT) December 10, 2008 Meeting Minutes
 December 10, 2008 Meeting Minutes") Southern California Dredged Material Management Team (SC-DMMT) December 10, 2008 Meeting Minutes I. Participating Agencies: a. Allan Ota EPA b. Mike Lyons LARWQCB c. Bill Paznokas DFG (San Diego) d. Jack
Southern California Dredged Material Management Team (SC-DMMT) December 10, 2008 Meeting Minutes I. Participating Agencies: a. Allan Ota EPA b. Mike Lyons LARWQCB c. Bill Paznokas DFG (San Diego) d. Jack
APPENDIX 19A-10. Biological Uptake Factors
 APPENDIX 19A-10 Biological Uptake Factors Table of Contents 1.0 EXPOSURE ASSESSMENT... 3 1.1 Biological Uptake Factors... 3 1.1.1 Soil to Terrestrial Invertebrates UP SI... 4 1.1.1.1 Organics... 4 1.1.1.2
MEMORANDUM FOR: RECORD May 17, 2013
 CENWS-OD-TS-DMMO MEMORANDUM FOR: RECORD May 17, 2013 SUBJECT: SCREENING LEVEL EVALUATION OF SURFACE SEDIMENTS WITHIN THE KENMORE NAVIGATION CHANNEL AND SURROUNDING AREAS IN VICINITY IN KENMORE, WASHINGTON
Qualitycheck Proficiency Testing Schemes Independent external evaluation of the analytical competence of testing laboratories. Application Form
 Qualitycheck Proficiency Testing Schemes Independent external evaluation of the analytical competence of testing laboratories - 2019 Customize your participation, and only pay for what you need! The laboratory
Table 1 Ken Malloy Harbor Regional Park - Previous Sampling Results
 TABLES Table 1 Ken Malloy Harbor Regional Park - Previous Sampling Results Soluble Threshold Total Threshold Sample Location, I.D., and Sample Depth (ft bgs) Limit Concentration Limit Concentration FWM-01
Benchmarking Compost Quality in Ontario: Analytical Data and Findings 2011
 Benchmarking Compost Quality in Ontario: Analytical Data and Findings 2011 by Cecily Flemming, Ministry of the Environment and Climate Change, and Dr. Lambert Otten, Professor Emeritus, University of Guelph
Scope of Work for Water Sampling
 Scope of Work for Water Sampling From: Meghan Betcher, Environmental Scientist Downstream Strategies, LLC 100 Railroad Ave. 304-445-7200 mbetcher@downstreamstrategies.com Date: June 26, 2017 Downstream
Part 1: Property Ownership, Property Information and Owner s Certifications
 Part 1: Property Ownership, Property Information and Owner s Certifications Information about the owner who is submitting or authorizing the submission of the record of site condition Owner name Owner
Masse Environmental Consultants Ltd 1
 Masse Environmental Consultants Ltd. 812 Vernon St. Nelson, BC, V1L 4G4 Tel.: 250-352-1147 Fax: 250-352-0422 www.masseenvironmental.com Fred Bullen May 5, 2017 Western Pacific Marine Ltd. 7721 Upper Balfour
Summary and Evaluation of Bioaccumulation Tests for Total Mercury Conducted by San Francisco Bay Dredging Projects
 for Total Mercury Conducted by San Francisco Bay Dredging Projects Prepared in Support of Modifying the June 9, 2011 Programmatic Essential Fish Habitat (EFH) Consultation Agreement For San Francisco Bay
NELAC PT for Accreditation Fields of Proficiency Testing with PTRLs Solid and Chemical Materials Effective January 3, 2012
 Trace Metals mg/kg mg/kg SOLIDS 1000 Aluminum 1000 to 25000 Study Mean 0.1082 753.6118 100 SOLIDS 1005 Antimony 80 to 300 Study Mean 0.4385 8.1700 8.0 SOLIDS 1010 Arsenic 40 to 400 Study Mean 0.0915 1.0653
Appendix D - Geotechnical Report
 Appendix D - Geotechnical Report CHUNG AND VANDER DOELEN ATTN: ERIC CHUNG 311 VICTORIA ST. N. KITCHENER ON N2H 5E1 Date Received: Report Date: Version: 18-AUG-15 25-AUG-15 :35
New 13 C PACs. (Polycyclic Aromatic Compounds) Cambridge Isotope Laboratories, Inc. isotope.com ENVIRONMENTAL CONTAMINANT STANDARDS
 Cambridge Isotope Laboratories, Inc. isotope.com ENVIRONMENTAL CONTAMINANT STANDARDS") Cambridge Isotope Laboratories, Inc. isotope.com New 13 C PACs (Polycyclic Aromatic Compounds) Benzo[j]fluoranthene CLM-9590-1.2 Benzo[c]fluorene CLM-9363-1.2 The advantages of 13 C-labeled over deuterated
Cambridge Isotope Laboratories, Inc. isotope.com New 13 C PACs (Polycyclic Aromatic Compounds) Benzo[j]fluoranthene CLM-9590-1.2 Benzo[c]fluorene CLM-9363-1.2 The advantages of 13 C-labeled over deuterated
Sediment Sampling and Analysis Plan Appendix
 Sediment Sampling and Analysis Plan Appendix Guidance on the Development of Sediment Sampling and Analysis Plans Meeting the Requirements of the Sediment Management Standards (Chapter 173-204 WAC) Ecology
Phase II Environmental Site Assessment (ESA) Update. Bernard Benoit Project Management (BBPM) 2212 Gladwin Crescent, Unit B4 Ottawa, Ontario K1B 5N1
 Update. Bernard Benoit Project Management (BBPM) 2212 Gladwin Crescent, Unit B4 Ottawa, Ontario K1B 5N1") Phase II Environmental Site Assessment (ESA) Update 2720 Richmond Road Bernard Benoit Project Management (BBPM) 2212 Gladwin Crescent, Unit B4 K1B 5N1 Centre Multiservices Francophone de l Ouest d Ottawa
Phase II Environmental Site Assessment (ESA) Update 2720 Richmond Road Bernard Benoit Project Management (BBPM) 2212 Gladwin Crescent, Unit B4 K1B 5N1 Centre Multiservices Francophone de l Ouest d Ottawa
WASTE CHARACTERIZATION: IN-SITU SOIL LOCATED AT ISRA OUTFALL 009 PLANNED EXCAVATION B1-1D
 B1-1D WASTE CHARACTERIZATION: IN-SITU SOIL LOCATED AT ISRA OUTFALL 009 PLANNED EXCAVATION B1-1D Introduction This report presents supporting detailed information for the April 27, 2010 in-situ characterization
DEPARTMENT OF ENVIRONMENTAL QUALITY
 DEPARTMENT OF ENVIRONMENTAL QUALITY DIVISION 246 OREGON STATE AIR TOXICS PROGRAM 340-246-0090 Ambient Benchmarks for Air Toxics (1) Purpose. Ambient benchmarks are concentrations of air toxics that serve
Waste Classification Assessment Report for Soils. C Spencer Ltd. Energy Works Dalton Street Hull
 1 Waste Classification Assessment Report for Soils C Spencer Ltd Energy Works Dalton Street Hull 2 Report Reference: 65445 Date of Report: 23.06.2017 Client: Site Address: C Spencer Ltd Energy Works Dalton
PAH Analysis in Drinking Water using Disk SPE Automated with the SPE-DEX 5000
 PAH Analysis in Drinking Water using Disk SPE Automated with the SPE-DEX 5000 Alicia Cannon, Horizon Technology, Salem, NH USA Key Words PAH, Polycyclic aromatic hydrocarbons, USEPA 550.1 Introduction
Toledo Botanical Gardens Hill Ditch Stream Restoration and Dam Removal Project Sediment Feasibility Study
 1800 Indian Wood Circle * Maumee, Ohio 43537 P: 419-891-2222 * F: 419-891-1595 * www.manniksmithgroup.com March 7, 2012 Ms. Jessica Hickey Davey Resource Group A Division of the Davey Tree Expert Company
PROFICIENCY TESTING PROGRAMS SOILS & INPUTS
 PROFICIENCY TESTING PROGRAMS SOILS & INPUTS A15 15a 24 A38a A38b 45 Soils Fresh soils Mineral fertilizers Activated sludge, sediments, Soil: Physico-chemistry Activated sludge, sediments, Soil: Micropollutants
1.0 CONTINUOUS PARAMETERS
 Stantec Consulting Ltd. 3W-675 Cochrane Drive, Markham ON L3R B8 October 2, 218 File: 1695528 Attention: Ms. Emilee O Leary, Regional Environmental Assessment Coordinator Ministry of the Environment, Conservation
Determination of chemical contaminants in marine fish by GCMS/MS using QuEChERS as an extraction method
 PO-CON1550E Determination of chemical contaminants in marine fish by GCMS/MS using QuEChERS as an extraction method ASMS 2015 TP 338 Ankush Bhone, Durvesh Sawant, Dheeraj Handique, Prashant Hase, Sanket
Air Quality Assessment
 Air Quality Assessment Greg Crooks, P.Eng. Joint Waste Management Group (JWMG) - May 26, 2009 AIR QUALITY ASSESSMENT Methodology The Air Quality Assessment completed as part of the Environmental Assessment
APPENDIX B SUPPLEMENTAL SAMPLING (SEDIMENT CORES)
") APPENDIX B SUPPLEMENTAL SAMPLING (SEDIMENT CORES) March 2017 1776663-7045 Table 1 Summary of Sediment Analytical Results - Polycyclic Aromatic Hydrocarbons IOCO Former Refinery and Active Distribution
APPENDIX B SUPPLEMENTAL SAMPLING (SEDIMENT CORES) March 2017 1776663-7045 Table 1 Summary of Sediment Analytical Results - Polycyclic Aromatic Hydrocarbons IOCO Former Refinery and Active Distribution
Figure 1A: (EXAMPLE) Dredging Footprint with Sampling Locations Private Dredging Application Length to be dredged
 Dredging Footprint with Sampling Locations Private Dredging Application Length to be dredged") Figure 1A: (EXAMPLE) Dredging Footprint with Sampling Locations Private Dredging Application 2015 Length to be dredged Figure 1B: (EXAMPLE) Dredging Footprint with Sampling Locations Private Dredging Application
Figure 1A: (EXAMPLE) Dredging Footprint with Sampling Locations Private Dredging Application 2015 Length to be dredged Figure 1B: (EXAMPLE) Dredging Footprint with Sampling Locations Private Dredging Application
To: Ken Kerns and Janet Dalgleish, University of Minnesota From: Jim Eidem and Kristen Schimpke Subject: Oiled Roads Investigation Summary, Delisted U
 Technical Memorandum To: Ken Kerns and Janet Dalgleish, University of Minnesota From: Jim Eidem and Kristen Schimpke Subject: Oiled Roads Investigation Summary Delisted UMRRC Superfund Site Date: December
SAN FRANCISCO BAY SPORT FISH MONITORING, 2009 AND BEYOND
 SAN FRANCISCO BAY SPORT FISH MONITORING, 2009 AND BEYOND Background: Objectives Produce the information needed for updating human health advisories and conducting human health risk assessments Measure
June 2017 Port of Stockton Maintenance Dredging Sediment Characterization. Notice of Intent. Prepared for the Port of Stockton
 June 2017 Port of Stockton 2017-2021 Maintenance Dredging Sediment Characterization Notice of Intent Prepared for the Port of Stockton June 2017 Port of Stockton 2017-2021 Maintenance Dredging Sediment
NELAC PT for Accreditation Fields of Proficiency Testing with PTRLs Solid and Chemical Materials Effective: July 24, 2017
 Trace Metals mg/kg mg/kg SOLIDS 1000 Aluminum 2500 to 25000 Study Mean 0.1307 293.1966 250 SOLIDS 1005 Antimony 80 to 300 Study Mean 0.4385 8.1700 8.0 SOLIDS 1010 Arsenic 40 to 400 Study Mean ± 30% SOLIDS
Introduction to Persistent organic pollutants: general environmental problems, regulations, toxic effects and environmental levels
 Analysis, fate and risks of organic contaminants in river basins under water scarcity Valencia, 7-8 February 2011 Introduction to Persistent organic pollutants: general environmental problems, regulations,
Development and evaluation of sediment quality guidelines for Florida coastal waters
 Ecotoxicology 5, 253-278 (1996) Development and evaluation of sediment quality guidelines for Florida coastal waters DONALD D. MACDONALD *l, R. SCOTT CARR 2, FRED D. CALDER 3, EDWARD R. LONG 4 and CHRISTOPHER
CLEAN WATER Clean Water PT Scheme Schedule Clean Water PT Scheme Schedule. Schedule subject to change see ERA s website at
 For International purchase only: Synthetic drinking water matrices with low concentrations of analytes for testing water supply, drinking water, or ground water. Standards are designed to meet the requirements
GUIDELINES FOR THE PROTECTION AND MANAGEMENT OF AQUATIC SEDIMENT QUALITY IN ONTARIO
 GUIDELINES FOR THE PROTECTION AND MANAGEMENT OF AQUATIC SEDIMENT QUALITY IN ONTARIO AUGUST 1993 Ministry of Environment and Energy ISBN 0-7778-9248-7 GUIDELINES FOR THE PROTECTION AND MANAGEMENT OF AQUATIC
January US Army Corps of Engineers Savannah District South Atlantic Division
 ENVIRONMENTAL IMPACT STATEMENT APPENDIX M: Sediment Quality Evaluation SAVANNAH HARBOR EXPANSION PROJECT Chatham County, Georgia and Jasper County, South Carolina January 2012 US Army Corps of Engineers
Cadmium B ug/l HRL Chromium B ug/l MCL 100
 Appendix 4, Table A4-1 Inorganics/Metals Arsenic 7440-38-2 6010B ug/l 25 4.41 10 MCL 2 Barium 7440-39-3 6010B ug/l 10 1.04 2000 HRL Use Tier 2 5 (or hardnessspecific value if lower) Cadmium 7440-43-9 6010B
Preface. Historically, two Ministry of the Environment documents addressed the assessment and management of sediment:
 Preface Historically, two Ministry of the Environment documents addressed the assessment and management of sediment: MOE 1993 Guidelines for the Protection and Management of Aquatic Sediment Quality in
ENVIRONMENTAL ASSESSMENT FINDINGS AND CONCLUSIONS WEBER SIGN SERVICE, INC. th 730 EAST 8 STREET MICHIGAN CITY, INDIANA 46360
 ENVIRONMENTAL ASSESSMENT FINDINGS AND CONCLUSIONS WEBER SIGN SERVICE, INC. th 730 EAST 8 STREET MICHIGAN CITY, INDIANA 46360 Prepared for: THE MICHIGAN CITY REDEVELOPMENT COMMISSION 100 EAST MICHIGAN BOULEVARD
Special request, Advice May Review of environmental assessment criteria or equivalents
 1.5.5.3 Special request, Advice May 2012 ECOREGION SUBJECT General advice Review of environmental assessment criteria or equivalents Advice summary ICES agrees that a pragmatic way forward is needed in
MONTHLY UPDATE REPORT - PRIMROSE SOUTH W4M SEPTEMBER 22 TO OCTOBER 19, 2015
 MONTHLY UPDATE REPORT - PRIMROSE SOUTH 09-21-067-04 W4M SEPTEMBER 22 TO OCTOBER 19, 2015 1 Introduction The Canadian Natural Resources Limited Primrose South in situ oil sands project is located in the
TECHNICAL MEMORANDUM
 Hope Taylor, Ph.D. Larry Walker Associates 707 4th Street, Suite 200 Davis, CA 95616 530.753.6400 hopet@lwa.com Andrew Kong Laboratory Data Consultants, Inc. (LDC) 7750 El Camino Real, Suite 2L Carlsbad,
Tennessee Cleanup Standards for Hydrocarbon Contaminated Groundwater
 Tennessee Cleanup Standards f Hydrocarbon Contaminated Groundwater Product (Residential) 0.001 mg/l 0.005 mg/l 0.072 mg/l Toluene 0.001 mg/l 1.0 mg/l 4.31 mg/l Gasoline Ethylbenzene 0.002 mg/l 0.7 mg/l
Analysis of organic contaminants in marine environment: development of automated systems for sampling and Stir Bar Sorptive Extraction
 Analysis of organic contaminants in marine environment: development of automated systems for sampling and Stir Bar Sorptive Extraction Julien Guyomarch, Anne-Laure Corre, Agathe Laes-Huon, Christian Podeur
Compilation and Assessment of Lab Samples from EGCS Washwater Discharge on Carnival ships. February 2019
 Compilation and Assessment of Lab Samples from EGCS Washwater Discharge on Carnival ships February 2019 2 EXECUTIVE SUMMARY Background to the work In 2016 Carnival Corporation collected an initial set
Texas Commission on Environmental Quality
 Texas Commission on Environmental Quality INTEROFFICE MEMORANDUM To: Michele Blair Aquatic Scientist for Water Quality Monitoring and Assessment Section, Office of Compliance and Enforcement Date: From:
APPENDIX B. Soil Sample Certificate of Analysis
 APPENDIX B Soil Sample Certificate of Analysis 5 SHOREHAM DR DOWNSVIEW, ON M3N1S4 SOIL ANALYSIS REVIEWED BY: Mike Muneswar, BSc (Chem), Senior Inorganic Analyst TRACE ORGANICS REVIEWED BY: Jacky Takeuchi,
Automated Solid Phase Extraction of PAH Compounds Utilizing the SPE-DEX 5000
 Automated Solid Phase Extraction of PAH Compounds Utilizing the SPE-DEX 5000 Melissa Lever, Horizon Technology, Inc., Salem, NH USA Key Words PAH, polycyclic aromatic hydrocarbons, EPA 870, water extraction,
Hamilton Works. Toxic Substance Reduction Plan Summary. Sulphuric Acid Zinc Mercury Benzene.
 Hamilton Works Toxic Substance Reduction Plan Summary Name of Substance CAS # of Substance Sulphuric Acid 7664-93-9 Zinc 7440-66-6 Mercury 7439-97-6 Benzene 71-43-2 Toluene 108-88-3 Xylene 1330-20-7 7H-dibenzo(c,g)carbazole
Table B1: Analytical Results for Nutrients in Surface Water
 Table B1: Analytical Results for Nutrients in Surface Water Sample ID 1 2 Physical Tests Colour, True (Colour Units) 15 (4) units absolute, or 5 units above background (30-day average)
PAHs in Surface Water by PDA and Fluorescence Detection
 A P P L I C AT I O N N O T E Liquid Chromatography Authors: Catharine Layton Wilhad M. Reuter PerkinElmer, Inc. Shelton, CT PAHs in Surface Water by PDA and Fluorescence Detection Introduction Heightened
ENVIRONMENTAL AND ECOLOGICAL CHEMISTRY Vol. II - Persistent Organic Wastes - Jean D. MacRae, Therese desjardins Anderson
 PERSISTENT ORGANIC WASTES Jean D. MacRae and Therese University of Maine, Orono, Maine, USA Keywords: Organic waste, persistent organic pollutant, halogenated organic compound, pesticides, PAH, PCBs, dibenzodioxin,
310 CMR: DEPARTMENT OF ENVIRONMENTAL PROTECTION
 40.0530: continued (3) An RP, PRP or Other Person may downgrade a Tier I disposal site classification if upon re-evaluation of the disposal site pursuant to the Tier I Criteria at 310 CMR 40.0520(2) the
Table A1 Summary statistics for hourly NO 2 concentrations in Ireland in 2016
 Table A1 Summary statistics for hourly NO 2 concentrations in Ireland in 2016 Kilkitt Castlebar Enniscorthy Emo Court Portlaoise Kilkenny Seville Lodge South Link Road Swords Blanchardstown Ballyfermot
Brandon Generating Station Licence Review Air Quality Impact Assessment
 Figure 5.1 Locations of Maximum Predicted Point of Impingement (POI) Pollutant Concentrations Due to Unit #5 and Fugitive Dust Emissions 38106-20 June 2006 68 SENES Consultants Limited Predicted incremental
Drinking Water Quality and Compliance SaskWater Codette Lake Potable Water Supply System 2017 Notification to Consumers
 Drinking Water Quality and Compliance SaskWater Codette Lake Potable Water Supply System 2017 Notification to Consumers The Water Security Agency (WSA) requires that, at least once each year, waterworks
SCOPE OF ACCREDITATION TO ISO/IEC 17025:2005
 SCOPE OF ACCREDITATION TO ISO/IEC 17025:2005 PACE ANALYTICAL SERVICES, LLC MOBILE LAB SERVICES 1 2525 Advance Rd. Madison, WI 53718 Pat Letterer Phone: 608 221 8700 ENVIRONMENTAL Valid To: March 31, 2020
TEKLAB, INC ANALYTICAL QC SUMMARY REPORT. TestCode: SV_8310S_W. CLIENT: Kelron Environmental Work Order: Project: CHMGP/
 TEKLAB, INC CLIENT: Kelron Environmental Date: 16-Jun-5 Sample ID: MB-25734 MBLK SeqNo: 12673 Acenaphthene ND.1.3 Acenaphthylene ND.5.15 Anthracene ND.1.3 Benzo(a)anthracene ND.3.9 Benzo(a)pyrene ND.4.12
Applicant: JOOLZ Date: Jan 30, 2015 NIEUWE HERENGRACHT 51-53, AMSTERDAM, THE NETHERLANS
 Applicant: JOOLZ Date: Jan 30, 2015 NIEUWE HERENGRACHT 51-53, AMSTERDAM, THE NETHERLANS Attn: THEO SZARAFINSKI This is to supersede Report No. SZHH00933753 dated Jan 28, 2015 Sample Description: One (1)
How much toxic contamination is in shellfish tissue and how has it changed over time?
 PREP Environmental Data Report, December 17 Indicator: in the Great Bay and Hampton-Seabrook Estuaries Question How much toxic contamination is in shellfish tissue and how has it changed over time? Short
Aromatic amines and carcinogens acc. to COE Resolution ResAP(2008)1: Part 1a, Part 1b
1: Part 1a, Part 1b") Krackser Straße 12 33659 Germany [Arrival date CTL] [Test] Aromatic amines and carcinogens acc. to COE Resolution ResAP(2008)1: Part 1a, Part 1b Part 1a Investigationn of aromatic amines with carcinogenic,
Krackser Straße 12 33659 Germany [Arrival date CTL] [Test] Aromatic amines and carcinogens acc. to COE Resolution ResAP(2008)1: Part 1a, Part 1b Part 1a Investigationn of aromatic amines with carcinogenic,
Re: Amendment to Certificate of Property Use No JWJJC (CPU) West Don Lands Group 1, Toronto (Property) for Property Specific Standards (PSS)
 West Don Lands Group 1, Toronto (Property) for Property Specific Standards (PSS)") Ministry of the Environment and Climate Change Central Region Office 5775 Yonge Street 8 th Floor North York ON M2M 4J1 Tel.: 416 326-6700 Fax: 416-325-6346 Ministère de l Environnement et de l Action
Ministry of the Environment and Climate Change Central Region Office 5775 Yonge Street 8 th Floor North York ON M2M 4J1 Tel.: 416 326-6700 Fax: 416-325-6346 Ministère de l Environnement et de l Action
Passive Membrane Samplers:
 Passive Membrane Samplers: An effective and cost-saving method to assess low level PAH water contamination Ekati Diamond Mine Stephanie Nabess M.Sc. R.P.Bio. (Stantec) Heather Lord Ph.D. (Maxxam Analytics)
Hamilton Works 2017 Annual Toxic Substances Reduction Report (O. Reg. 455/09)
") Hamilton Works 2017 Annual Toxic Substances Reduction Report (O. Reg. 455/09) Issued June 1, 2018 Basic Facility Information Section 1 Facility Information Owner Stelco Inc. Facility name Hamilton Works
Hamilton Works 2017 Annual Toxic Substances Reduction Report (O. Reg. 455/09) Issued June 1, 2018 Basic Facility Information Section 1 Facility Information Owner Stelco Inc. Facility name Hamilton Works
CITY OF SANTA CRUZ WASTEWATER TREATMENT FACILITY
 CITY OF SANTA CRUZ WASTEWATER TREATMENT FACILITY 2011 Wastewater Treatment Facility ANNUAL REPORT CITY OF SANTA CRUZ POTW ANNUAL REPORT 2011 CONTENTS Section I Section II Section III Section IV Section
TECHNICAL MEMORANDUM
 NEWTON GEO-HYDROLOGY CONSULTING SERVICES P.O. BOX 0 SANTA BARBARA, CALIFORNIA 0 TECHNICAL MEMORANDUM TO: FROM: Citizens For Responsible Oil And Gas (CFROG) Brad Newton, Ph.D., P.G. 0 0 0 RE: Summary Review
Toxic Contaminants in the Surficial Sediments of the Fore River, Maine. Natural Resource Damage Assessment Trustees Casco Bay Estuary Partnership
 Toxic Contaminants in the Surficial Sediments of the Fore River, Maine Natural Resource Damage Assessment Trustees Casco Bay Estuary Partnership Sediment Contaminants Serious threat to estuarine ecosystems
ASBG s Comparison of Queensland vs NSW and Victoria s Hazardous Waste Classifications
 ASBG s Comparison of Queensland vs NSW and Victoria s Hazardous Waste Classifications Note the Queensland limits set their levy rates of $35/t, $50/t and $150/t on wastes. Unlike NSW and Victorian limits
Sampling Results for Western Transition Area Surface Soil Samples University of California, Berkeley, Richmond Field Station, Richmond, California
 TETRA TECH EM INC. February 13, 2008 Greg Haet EH&S Associate Director, Environmental Protection Office of Environment, Health & Safety University of California, Berkeley University Hall, 3rd Floor #1150