VA s James River Chlorophyll Study
|
|
|
- Chad Bennett
- 6 years ago
- Views:
Transcription

1 VA s James River Chlorophyll Study In Response To Chesapeake Bay TMDL STAC Sept 11, 2012
 TP = 2.35 mpy (2003 cap loads = 3.")
2 Issued December 29, 2010 Set Jurisdictional Allocations VA TN= millions lbs/yr (mpy) TP= mpy Sediments = 2,578.9 mpy James River Watershed (Appendix O) TN= mpy (2003 cap loads = 26.4 mpy) TP = 2.35 mpy (2003 cap loads = 3.41 mpy) Appendix X Staged Implementation Watershed Implementation Plan I Study Plan for review and update of James River Site-specific Numeric Chlorophyll-a Water Quality Criteria (Appendix 2) 2
3 Set nutrient load caps for all Bay river basins TMDL set cap much lower for James River basin than EPA approved with chlorophyll standard in 2005 (Appendix O & X) Impact estimated to add $1-2 billion to nutrient reduction costs VA conclusion: let s make sure first 3
 Develop a site specific James River water quality")


4 Revisit the James River TMDL allocations (Appendix O & X, Bay TMDL) Develop a site specific James River water quality model Re-assess attainability of chl-a criteria Review and confirm/adjust James River chl-a standard (Appendix 2, WIP I) Scientific Advisory Panel to make recommendations Conduct scientific study to review basis for setting chlorophyll standard 4

5 Background Basis for Chlorophyll a Criteria Summary of 2005 process Chesapeake Bay TMDL Process Impact of EPA s TMDL Allocations VA WIP/Bay TMDL Process Issues Critical Conditions Assessment Process Modeling James River Study Modeling & Monitoring Schedule 2
6 Existing Before 2005 Designated Uses - 9 VAC balanced, indigenous population of aquatic life... General Criteria - 9 VAC undesirable or nuisance aquatic plant life... Nutrient Enriched Waters - 9 VAC undesirable growths of aquatic plant life in surface waters... Adopted in 2005 for All Bay Waters Narrative chlorophyll a criterion - 9 VAC concentrations of chlorophyll-a shall not exceed levels undesirable unsuitable ecologically undesirable water conditions


7 Tidal James River is eutrophic Annual algal blooms High and increasing levels of undesirable algae Unbalanced community composition Listed as impaired under CWA 303 Dissolved oxygen or water clarity criteria not driving nutrient reductions

8 Alternative Loading Scenarios Levels of chlorophyll-a Attainability Environmental Benefits Modeling issues Not sensitive to small loading changes Calibrated seasonal averages over broad spatial and temporal domains James River chlorophyll calibration highly variable
9 10/15 15/23 15/22 12/10
10 Background Chesapeake Bay TMDL Process Impact of EPA s TMDL Allocations VA WIP/Bay TMDL Process Issues Critical Conditions Assessment Process Modeling JR Modeling & Monitoring Schedule 2
11 VA Phase I WIP November 2010 Describe d VA concerns with allocations Outlined need for study of existing chlorophyll criteria and review of modeling framework Presented staged implementation approach for point source discharges in James Basin EPA Agreed with approach Included Staged Implementation in Appendix X of Chesapeake Bay TMDL December 2010 Tacit recognition that VA is reviewing chlorophyll criteria 11

12 Based on possible updates to the model and on jurisdictions WIPs, EPA will consider revising the Chesapeake Bay TMDL, if appropriate, in 2012 and EPA will also consider revising the TMDL based on other new or additional information provided by the jurisdictions. All revision requests from jurisdictions should be coordinated with EPA to fit within EPA s planned revision time frame. 12
13 Staged Implementation VA Phase I WIP outlines nutrient reduction actions to achieve TMDL Implementation 60% reduction target by 2017 VA Phase III WIP with additional reductions scheduled after 2017 Scientific Study with Standards Review Conduct 3-4 year scientific study to review basis for setting chlorophyll standard & make recommendations Revise standard/tmdl by 2017, as appropriate 13
14 Background Chesapeake Bay TMDL Process Issues Critical Conditions Assessment Process Modeling James River Study Modeling & Monitoring Schedule 2
15 Critical Period The WQGIT agreed that the critical period should be representative of an approximate 10- year return period. This was defined as the average period of time expected to elapse between occurrences of events at a certain site. For DO, the critical period was Because the James River did not exhibit a correlation between high flow and chlorophyll-a violations, a critical period was not selected 15
 CFD criteria assessment since no biologically based reference curve not available (USEPA 2007) 10 percent default reference curve Seasonal")

16 Assessment (TMDL Section 3.3.3) CFD criteria assessment since no biologically based reference curve not available (USEPA 2007) 10 percent default reference curve Seasonal means of observed data; data transformed and then interpolated spatially within designated use area for each cruise. The interpolated value of each cell averaged in time across the entire season and then the spatial violation rate calculated as the fraction of interpolator cells failing the designated use (USEPA 2010) Chlorophyll assessment was based on attainment over the time series (Appendix O) 16
17 0% Percent of Time CFD-Based Attainment Assessment CFD Curve Area of Criteria Exceedence 0 60% Percent of Space Area of Allowable Criteria 100% Exceedence Temporal Probability 90% 80% 70% 50% 40% 30% CFD Evaluation CFD Evaluation Curve Theoretical Evaluation Curve 20% 10%

18 Statistics Mean difference Absolute mean different Relative difference Time comparison Longitudinal comparison
19 Comparison of calibration to DO and Chlorophyll-a Parameter Mainstem Bay Dissolved Oxygen (Level II) James River Chlorophyll-a Mean difference 0.3 mg/l ug/l Absolute mean difference 0.94 mg/l 7.24 ug/l Relative difference 19% 62% Source: Cerco and others, 2010

20 1994 Normal 1996 Normal but very wet Aug 1999 Dry but wet Aug
21 Background Chesapeake Bay TMDL Process James River Study Schedule 2
22 Clifton Bell (VAMWA) Brian Benham (VT) Claire Buchanan (ICPRB) Paul Bukaveckas (VCU) Greg Garman (VCU) Eileen Hoffmann (ODU) Will Hunley (VAMWA) Rebecca LePrell (VDH) Winston Lung (UVA) Harry Marshall (ODU) Ken Moore (VIMS) Margie Mulholland (ODU) Kim Reese (VIMS) Peter Tango (USGS) Harry Wang (VIMS) Guide and assist the Commonwealth in determining the approach, scope, design, and performance of a study to be performed over the next 3-5 years. 22
?")

23 Assessment of the modeling framework for linking CHLa in the estuary with nutrient loads to the estuary. What changes can be incorporated to the model for better fit with observed CHLa (hydrodynamics, grazing, etc.)? How do these changes affect attainability (nutrient load-chla relationship)? Evaluating existing numeric CHLa criteria for the James. Are these scientifically defensible? What are the approaches that may be used to develop CHLa criteria? What do we mean by scientifically defensible?
24 Revisit the James River TMDL allocations (Appendix O & X, Bay TMDL) Develop a site specific James River water quality model Re-assess attainability of chl-a criteria Review and confirm/adjust James River chl-a standard (Appendix 2, WIP I) Conduct scientific study to review basis for setting chlorophyll standard Scientific Advisory Panel to make recommendations 24
25 Revisit the James River TMDL allocations (Appendix O & X, Bay TMDL) Develop a site specific James River water quality model Re-assess attainability of chl-a criteria Review and confirm/adjust James River chl-a standard Scientific panel to make recommendations Conduct scientific study to review basis for setting chlorophyll standard 25
 Fisheries scientist Harry Wang Hydrodynamic & Pollutant modeling Jian Shen Hydrodynamic, Water Quality, and Pollutant modeling Bo Hung Hydrodynamic & Water")

26 CEC Dave Jasinski (Project Administrator) Data management & analysis. VIMS Roger Mann (Project Manager) Fisheries scientist Harry Wang Hydrodynamic & Pollutant modeling Jian Shen Hydrodynamic, Water Quality, and Pollutant modeling Bo Hung Hydrodynamic & Water Quality modeling Mac Sisson GIS & Numerical modeling Tetra Tech Andrew Parker Hydrologic, Hydrodynamic, & Water Quality modeling Peter von Lowe Point & Non Point source pollution assessment John Hamrick EFDC Modeling John Riverson Watershed modeling Sen Bai Watershed & EFDC modeling ODU Margaret Mulholland HAB expert UNC Hans Paerl HAB/Plankton expert HDR HydroQual James Fitzpatrick Water Quality Modeling Andrew Thuman Water Quality Modeling Thomas Gallagher Water Quality Modeling VCU Paula Buckaveckas Plankton Dynamics

27 Estimates of nutrient loading and flow will be made based on a number of sources USGS gage stations, water quality stations, 5.3 watershed model Use tools such as Hydrocal to assess nutrient and flow budgets

28 Reassess USEPA analysis using information gathered from Subtask 2.1 Expand analysis to include seasonally-averaged Qs and temperatures Look at drought/wet periods to see if they can explain the occurrence of HABs
29 Site specific curves to be developed for fresh water to polyhaline regions of James River Estuary Unlike DO end-points, chl-a may be a challenge, but species diversity and/or likelihood of HAB bloom may be considered Conduct a Cumulative Frequency Distribution (CFD)-based assessment method Season specific due to changes in C:Chl ratio Figure 7. Likelihood of the presence of Microcystis as a function of total chlorophyll-a Figure 8. Chlorophyll-a to carbon ratio as a function of light
30 Subtask 3.1 Watershed/Loading Model Subtask 3.2 Hydrodynamic and Water Quality Models Subtask 3.3 Phytoplankton/HAB Model Subtask Probabilistic Empirical Model Subtask 3.5 Predictive Accuracy 30
 Benefits include previous application to criteria development,")
31 Develop high resolution watershed model Provide BCs for river models (flow and nutrient/ sediment loads) Better represent local conditions Mesh with existing Chesapeake Bay Watershed Model Anticipate using EPA s LSPC Loading Simulation Program- C++ Based on HSPF model algorithms (consistent with EPA Chesapeake Bay Watershed Model) Benefits include previous application to criteria development, efficiency when running scenarios, streamlined model output, and seamless integration with river models


32 Review Chesapeake CH3D and CE- QUAL-ICM models Limitations imposed by grid resolution, processes and parameterization Importance of top-down control of phytoplankton Ongoing improvements to sediment-nutrient flux model Dual water quality model approach (EFDC/RCA)
33 Review existing CE-QUAL-ICM algal growth model and model coefficients Look to develop James River HABs model using guidance from Drs. Mulholland, Bukaveckas and Paerl Will considerer freshwater and marine (C. polykrikoides) HABs

34 Revisit the James River TMDL allocations (Appendix O & X, Bay TMDL) Develop a site specific James River water quality model Re-assess attainability of chl-a criteria Review and confirm/adjust James River chl-a standard Scientific panel to make recommendations Conduct scientific study to review basis for setting chlorophyll standard 34


35 Algal Bloom Characterization Fixed stations Continuous monitoring Data flow ID and numeration Nutrient limitation & regeneration Designated Use Impairments Bioassays Microcystins Literature review Model Development All above SONE 35


36 ODU Margaret Mulholland HAB & nutrient regeneration Harry Marshall Phytoplankton & HAB IDs VCU Paul Buckaveckas Nutrient Dynamics VIMS Ken Moore Biological data and dataflow Kim Reece & Wolf Vogelbein HAB /genetics, aquatic toxicology and bioassays Iris Anderson Nutrient regeneration and SONE HRSD Dataflow Continuous monitoring City of Richmond 36
37

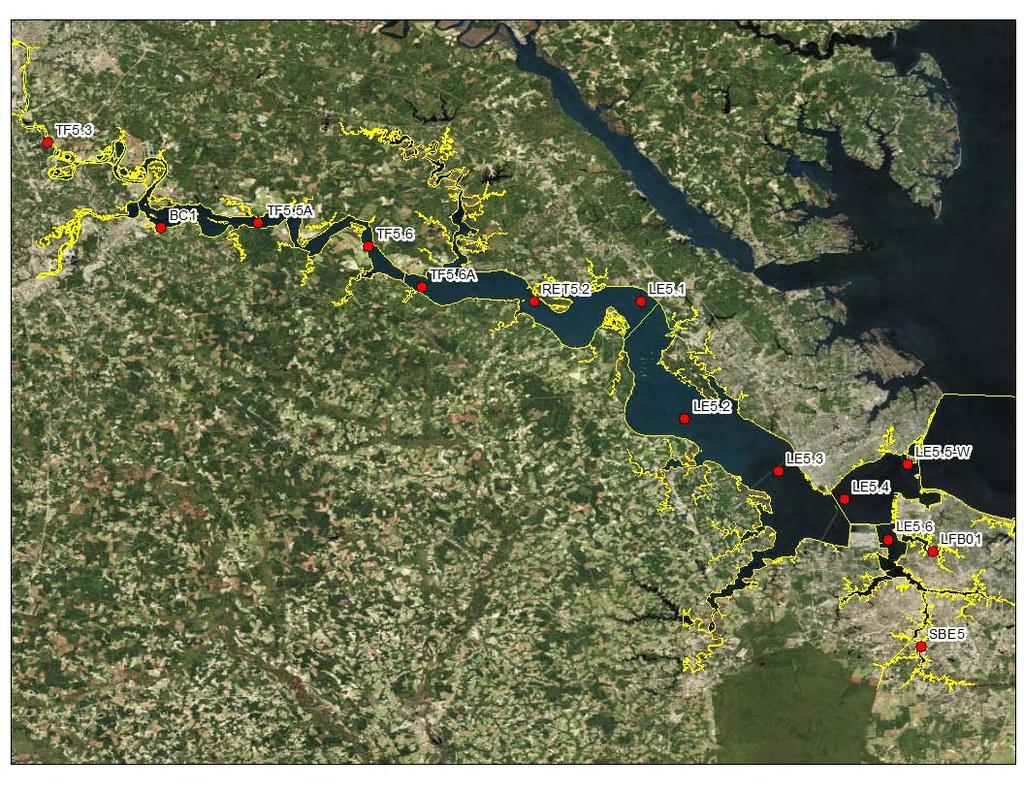
38 Weekly fixed-station monitoring of water quality, CHLa, nutrients and microcystin. Continuous monitoring at VCU Rice Center for water quality, CHLa and phycocyanin. Sampling locations for VCU-City of Richmond James River Monitoring Program.
.")

39 Typical Dataflow cruise track illustrated for the for the oligohaline segment (top left). ConMon station locations (bottom left). Real time ConMon station at James River Country Club & 2 in Lafayette.


40 2009 Bloom duration Jun 27 Aug 26


41 Major Objectives: 1. Identify phytoplankton species composition and abundance contributing to chlorophyll concentrations in the James, Elizabeth, and Lafayette rivers. 2. Monitor the status of HAB taxa throughout the study period when ever present, and not just during blooms development. 3. Identify river locations containing specific algal concentrations related to high chlorophyll levels and bloom development.
42 chlorophyll (ug/l) James mesohaline James polyhaline Elizabeth Lafayette Heterocapsa triquetra in JMSMH Akashiwo sanguinea in upper Lafayette Cochlodinium polykrikoides in JMSPH Cochlodinium polykrikoides in Elizabeth Cochlodinium polykrikoides in upper Lafayette Cochlodinium polykrikoides in JMSMH week number February March April May June July August 2012
43 Abundance JMSMH JMSPH ER/LAF 55% 8% 37% 40% 8% 52% 43% 8% 49% Diatoms Dinoflagellates Other Diatoms: 46% Dinoflagellates: 46% Other: 8% Biomass JMSMH JMSPH 2% ER/LAF 1% 69% 8% 23% 82% 16% 77% 22% Diatoms Dinoflagellates Other Diatoms: 21% Dinoflagellates: 76% Other: 4%


44 Characterizing algal blooms Weekly monitoring of CHLa, nutrients, and phytoplankton. Algal Bioassay Experiments Grazer Effects Monthly fish gut contents Rangia Grazing Experiments Microcystin Monitoring Weekly water Monthly sediments & biota
, and Microcystin production. Results used to model nutrient utilization = f(wrt). Nutrient Effect Size 0.4 0.3 0.2 0.1 0.0-0.1-0.")
45 Light vs. Nutrient Limitation N vs. P, NO 3 vs. NH 4 vs. DON Monthly experiments (June Oct) using water collected at Rice Pier & JMS75. Response variables: algal growth rates (CHLa, POC), and Microcystin production. Results used to model nutrient utilization = f(wrt). Nutrient Effect Size Response to N Addition Response to P Addition Freshwater Turnover Time (Days)


.")
46 Year 1 Objective: Who are the important consumers of suspended and sedimented CHLa in the tidal freshwater James River? Prior work showed that zooplankton grazing rates were low.* Measuring filtration rates by wedge clams (abundance data available from CBP benthic surveys). Measuring CHLa in gut contents of benthic- and pelagicfeeding fish. *Bukaveckas et al. (2011) Estuaries & Coasts
; analyses include liver 10% and muscle.")
47 Monthly monitoring (June-Oct) of 100% Microcystin accumulation in target 90% species that are important 80% components of the food web: 70% Macroinvertebrates: Rangia, blue 60% crabs. 50% Fish: Atlantic menhaden, gizzard 40% shad, juvenile and adult catfish. 30% 10 individuals per group per month 20% (as available); analyses include liver 10% and muscle. 0% MC in Fish Liver (% of individuals) 24-May Jun Jul-12 Blue Catfish (0-15 cm) Blue Catfish (15-30 cm)
48 10-May 31-May 21-Jun 12-Jul 2-Aug 23-Aug 13-Sep CHLa (ug/l) CHLa Microcystin Microcystin (ug/l) Contact standard Drinking standard 10-May 9-Jun 9-Jul 8-Aug 7-Sep CHLa and cyanotoxins in the James River (JMS 75) during 2011.
49 Monthly monitoring (June-Oct) of 100% Microcystin accumulation in target 90% species that are important 80% components of the food web: 70% Macroinvertebrates: Rangia, blue 60% crabs. 50% Fish: Atlantic menhaden, gizzard 40% shad, juvenile and adult catfish. 30% 10 individuals per group per month 20% (as available); analyses include liver 10% and muscle. 0% MC in Fish Liver (% of individuals) 24-May Jun Jul-12 Blue Catfish (0-15 cm) Blue Catfish (15-30 cm)


 Establish cultures PCR assays:")


50 Sample processing in Reece Lab? Bloom/species composition 3 um filtration Visual diagnosis via light microscopy?? DNA extraction Bioassay (2.1) Establish cultures PCR assays: C. polykrikoides, K. veneficum, P. piscicida, P. shumwayae, Luciella spp., A. monilatum. Prorocentrum spp., Raphidophytes Clone cultures Quantify cells/ml via Real-Time PCR
51 Bioassay Results % MORTALITY (mean) A. salina /C. polykrikoides Lafayette Rr - Haven Ck Bloom Event E July 27.5K/mL and 2.75K/mL (1:10 dilution) Control FED Control UNFED Sample,27.5k/mL, FED Sample,27.5k/mL, UNFED Sample,2.75k/mL,FED Sample,2.75k / ml, UNFED TIME (hours) CHLa 422 ug/l
52 To identify bloom triggers - at relevant timescales for bloom initiation HRSD CMAP platform has been successful for Cochlodinium Sample before, during, and after a bloom to better understand bloom initiation with respect to nutrient uptake dynamics and ambient nutrient concentrations on short timescales To identify triggers and controls on bloom formation
53 Chlorophytes Euglenoids Cyanobacteria Cryptophytes Diatoms Dinoflagellates Meteorological forcing /15 08/20 08/25 08/30 09/04 09/09 09/14 09/19 09/24 09/29 10/ Urea NH + 4 NO - 3 NO /15 08/20 08/25 08/30 09/04 09/09 09/14 09/19 09/24 09/29 10/04

54 Nutrient mapping NO3, NO2, NH4, urea, TDN, TDP, DIP Diagnostic pigments paired with chl and taxonomic identifications-develop functional groups for modeling Continuous monitoring in Lafayette at fixed sites near mouth and up river Nutrient mapping HRSD Relate to local and regional meteorology Storm sampling Lafayette Continuous monitoring coupled with dataflow

 Sediment characteristics: grain size, bulk")
55 Perform measurements of sediment : water and water column nutrient fluxes, metabolic rates and sediment characteristics at six sites along the James River during August 2012 and March/April The following data will be used to calibrate the James River water quality model: Sediment : water fluxes of DIN, DIC, DIP, DON, DOC, SiO 2. Metabolic rates (gross primary production, respiration, net community production, sediment oxygen demand) Sediment characteristics: grain size, bulk density, organic content, benthic chlorophyll a, extractable nutrients (DIN, DIP), organic carbon, total nitrogen, total phosphorus.
 and to leverage data collections by Paul Bukaveckas,")

56 Six sites were selected based on modeling requirements (consulted with Jian Shen, Jim Fitzpatrick) and to leverage data collections by Paul Bukaveckas, Ken Moore, and Kim Reece in the James River and Margie Mulholland in the Lafayette River. 3 sites at 2m water depth MSL 3 sites at 1 m water depth MSL
 were collected at 3 randomly selected stations, along with water, from each site.")

.")
57 Sediment cores (13.3 cm i.d x 40 cm tall) were collected at 3 randomly selected stations, along with water, from each site. Cores were returned to VIMS and incubated uncapped overnight in site-specific bottom water at in-situ temperature in environmental chamber. Next morning metabolism and nutrient flux experiments were initiated at in situ light levels after capping the sediment+water and water column only cores (n=3 each). Water samples for DIC, DIN, DIP, DON, DOC, SIO 2 were collected at dawn, mid-day, dusk, and the following dawn. Cores were instrumented with Hach DO sensors for continuous measurements of DO.


58 Sediment collected concurrently with the flux sediment cores were analyzed for: Bulk density, organic content, grain size, organic C content, TN, TP, DIP in the 0 1 cm and 1 5 cm sediment depth horizons. Benthic chl a and phaeophytin was measured in the 0 1 cm sediment depth horizon. The water column was characterized at the time flux cores were taken by: YSI 6600 profiles (temperature, salinity, turbidity, in vivo chl a, and DO) Grab samples for concentrations of DIN, DIP, DON, DOC, silicate, extractable chl a, phaeophytin LiCor for photosynthetically active radiation (PAR) and light attenuation.
 Dissolved Oxygen: Site 2 (Tar Bay; 2 m water depth) Sediment + Water Water Column only Dark 0 4 8 12 16 20 24 Elapsed Time (hours) For Tar Bay 1 m water depth cores:")
59 Dissolved oxygen (mg L -1 ) Dissolved oxygen (mg L -1 ) Dissolved Oxygen: Site 1 (Tar Bay, 1 m water depth) Sediment + Water Water Column only Light Dark Elapsed Time (hours) Dissolved Oxygen: Site 2 (Tar Bay; 2 m water depth) Sediment + Water Water Column only Dark Elapsed Time (hours) For Tar Bay 1 m water depth cores: In the light (at in-situ level level): DO increased in the water column, but remained relatively constant in the sediment+water cores In the dark: DO decreased at a faster rate in the sediment+water cores than in the water column cores. For Tar Bay 2 m water depth cores: Cores kept in the dark throughout 24 hours to match in-situ level level DO decreased at a faster rate in the sediment+water cores than in the water and 1 m cores.
60 Background Chesapeake Bay TMDL Process JR Modeling & Monitoring Schedule 2
 2017 Regulatory Review (if necessary) Complete WIP III http://www.deq.virginia.gov/wqs/rule.")
61 2011 Workplan Developed Notice of Intended Regulatory Action (NOIRA) 2012 Workplan Implementation Monitoring and Modeling 2015 Panel Recommendations and Assessment Review 2016 Develop Regulatory Proposal (DEQ, if warranted) 2017 Regulatory Review (if necessary) Complete WIP III
")

62 Arthur Butt PhD VA DEQ (804)

63 Ches. Bay and Tidal Tributaries: Numeric Chlorophyll criteria only apply to the James River Criteria were met in: Upper & Lower James during the spring season Middle James during the summer season
64 Scientific study to review basis for setting final nutrient allocations VCU contracted to assist in managing study and Science Advisory Panel Completed detailed monitoring & modeling work plan James River Study Modeling contract (awarded 3/12) Re-assess chlorophyll attainability Monitoring contracts (awarded 5/12 focus on algal bloom characteristics and linking blooms to designated uses Initiate Rulemaking process NOIRA issued; Regulatory Advisory Panel (TBD) 64
 40 35 30 25 20 15 10 10 15 20 25 30 35 40 45 50 TN (million")
65 60 Chlorophyll-a Achievement Based on 10_year CFD Summer Low er Tidal Fresh James River JMSTF1 20 ug/l 25 mg/l Chl-a (ug/l) TN (million pounds)

66 For this scenario, the James River Basin allocation is 25.5 mpy TN and 2.5 mpy TP. Failure to attain WQS is shown in red text as percent nonattainment. 66

67 Environmental must have numerical criteria; prefer the originally proposed criteria or close to the original criteria; no more delays. Citizens reflect environmental comments. Regulated concerns with scientific basis of criteria particularly in lower James; prefers upward adjustments of criteria; cost too high; benefits not clear or measurable.
, Diversity Indices Undesirable")

68 Balance = Phytoplankton Index of Biotic Integrity (IBI), Diversity Indices Undesirable or nuisance aquatic plant life... = HAB, food quality issues Natural characteristics Attainability
69 Scientific study to review basis for setting final nutrient allocations VCU contracted to assist in managing study and Science Advisory Panel Completed detailed monitoring & modeling work plan James River Study Modeling contract (awarded 3/12) Re-assess chlorophyll attainability Monitoring contracts (awarded 5/12) focus on algal bloom characteristics and linking blooms to designated uses Initiate Rulemaking process NOIRA issued; Regulatory Advisory Panel (TBD) 69
70 Set numerical criteria in the tidal James River. Setting chlorophyll criteria is not as quantitatively precise as the dissolved oxygen or water quality recommendations. Attainability can be used to focus in on a criterion value that will remain protective of designated uses based on the available scientific findings
71 Third largest tributary to Chesapeake Bay Virginia s largest river Over 10,000 square miles (about 25% of the state) Home to 1/3 of all Virginians (2.5 million with half living in the lower section) Land-use 71% forest 16% agriculture 5% urban 8% other 71
72 Land-use* 31% forest 54% urban/suburban/mixed open 12% agriculture 3% other Water residence time 36 days high flow 74 days low flow * (James River Tributary Strategy, 2005) 72

73 Parameter Model Efficiency R 2 Flow Total N conc Total P conc
74 Tidal Freshwater James River calibration Station TF5.5 Chlorophyll-a
75 Lower James River calibration Station LE5.3 Chlorophyll-a

76 1994 Wet early Spr Dry late Spr 1996 Normal 1999 Dry

77 Upper James Estuary (VCU, ODU) Expanded monitoring of CHLa & phytoplankton. Algal bioassay & grazing experiments Monitoring Microcystin in water, sediments, biota. Lower James Estuary (VIMS, ODU, HRSD) Expanded dataflow cruises including oligohaline Continuous monitoring of CHLa & nutrients Dinoflagellate toxicity tests
James River CHLa Study 2014 Review WQGIT. October 8, 2014
 James River CHLa Study 2014 Review WQGIT October 8, 2014 James River Watershed Virginia s largest river 3rd largest tributary to Chesapeake Bay Over 10,000 square miles (about 25% of VA) Home to 1/3 of
Chlorophyll-based Water Quality Criteria for Protecting Aquatic Life Designated Uses
 Chlorophyll-based Water Quality Criteria for Protecting Aquatic Life Designated Uses Paul Bukaveckas Virginia Commonwealth University pabukaveckas@vcu.edu Eutrophication: A Long-standing Water Quality
Nutrients & Algal Blooms Developing water quality standards for the James River.
 Nutrients & Algal Blooms Developing water quality standards for the James River. Dr. Paul A. Bukaveckas and Dr. Joseph Wood Department of Biology Center for Environmental Studies http://wp.vcu.edu/jamesriver/
James River Alternatives Analysis June 23, 2005
 James River Alternatives Analysis June 23, 2005 Prepared by: Virginia Department of Environmental Quality in cooperation with the U.S. EPA Chesapeake Bay Program Office [ THIS PAGE INTENTIONALLY LEFT BLANK
Total Maximum Daily Load Development for Unnamed Tributary to Pitts Creek. Public Meeting March 26, Why Are We Here
 Total Maximum Daily Load Development for Unnamed Tributary to Pitts Creek Public Meeting March, Why Are We Here. Learn about water quality of the stream. Discuss the Total Maximum Daily Load (TMDL) development.
Assessment Protocol for Numeric James River Chlorophyll-a Criteria: Issues and Options
 Assessment Protocol for Numeric James River Chlorophyll-a Criteria: Issues and Options Tish Robertson VA Department of Environmental Quality Criteria Assessment Protocol Workgroup August 9 th, 2016 Richmond
A restoration goal for Chesapeake Bay phytoplankton communities. Executive Summary
 A restoration goal for Chesapeake Bay phytoplankton communities Executive Summary A Phytoplankton Index of Biotic Integrity (PIBI) has been developed for Chesapeake Bay. 1 It is currently used to analyze
Big Bend Model. Wayne Magley Watershed Evaluation and TMDL Section FDEP. March 7, 2016
 Big Bend Model Wayne Magley Watershed Evaluation and TMDL Section FDEP March 7, 2016 BACKGROUND As outlined in the EPA November 30, 2012 document Methods and Approaches for Deriving Numeric Criteria for
5.0 PHYTOPLANKTON PHYSIOLOGY. Luke Twomey Christopher P. Buzzelli Hans W. Paerl. 5.1 Introduction
 5. PHYTOPLANKTON PHYSIOLOGY Luke Twomey Christopher P. Buzzelli Hans W. Paerl 5.1 Introduction Phytoplankon production is the primary source of organic carbon in the water column of the NRE (Matson and
Biological Reference Curves for Assessing the James River Chlorophyll a Criteria
 Biological Reference Curves for Assessing the James River Chlorophyll a Criteria Final Report September 8, 2014 Prepared by Claire Buchanan, PhD Interstate Commission on the Potomac River Basin for Chesapeake
Finalizing the Chesapeake Bay Health Index (BHI)
") Finalizing the Chesapeake Bay Health Index (BHI) Part 1: Water Quality Index Part 2: Biotic Index Bill Dennison Ben Longstaff, Michael Williams, Claire Buchanan, Roberto Llansó, and Peter Bergstrom On
Finalizing the Chesapeake Bay Health Index (BHI) Part 1: Water Quality Index Part 2: Biotic Index Bill Dennison Ben Longstaff, Michael Williams, Claire Buchanan, Roberto Llansó, and Peter Bergstrom On
Nutrient Sources, Fate, Transport, and Effects Study of Galveston Bay, Texas Rachel Windham,
 Nutrient Sources, Fate, Transport, and Effects Study of Galveston Bay, Texas Rachel Windham, Department of Marine Biology Texas A&M University at Galveston 2 Acknowledgements: Dr. Antonietta Quigg Members
Decision Rationale. Total Maximum Daily Load for Phosphorus for the Sassafras River, Cecil and Kent Counties, Maryland 4/1/2002
 Decision Rationale I. Introduction Total Maximum Daily Load for Phosphorus for the Sassafras River, Cecil and Kent Counties, Maryland 4/1/2002 The Clean Water Act (CWA) requires a Total Maximum Daily Load
MODELING NUTRIENT LOADING AND EUTROPHICATION RESPONSE TO SUPPORT THE ELKHORN SLOUGH NUTRIENT TOTAL MAXIMUM DAILY LOAD
 MODELING NUTRIENT LOADING AND EUTROPHICATION RESPONSE TO SUPPORT THE ELKHORN SLOUGH NUTRIENT TOTAL MAXIMUM DAILY LOAD Martha Sutula Southern California Coastal Water Research Project Workshop on The Science
OLD DOMINION UNIVERSITY. Old Dominion University, Norfolk, Virginia Virginia Department of Environmental Quality Richmond, Virginia 23230
 OLD DOMINION UNIVERSITY 1 Department of Biological Sciences Old Dominion University, Norfolk, Virginia 23529 2 Department of Chemistry and Biochemistry Old Dominion University, Norfolk, Virginia 23529
Upper Mississippi River Lake Pepin Modeling Lake Pepin Municipal Sector Meeting August 6, 2008
 Upper Mississippi River Lake Pepin Modeling Lake Pepin Municipal Sector Meeting August 6, 2008 Lake Pepin Photo by Guy Schmickle Overview Fundamentals Why model? What is a model? Model Development How
Chesapeake Bay Water Quality Criteria and their Assessment:
 Chesapeake Bay Water Quality Criteria and their Assessment: The Monitoring and Assessment Framework Supporting the Chesapeake Bay TMDL Peter Tango, USGS@CBPO ELPR Symposium William and Mary School of Law
Chesapeake Bay Program Partnership s Scientific, Technical Assessment and Reporting (STAR) Team Briefing and Options Paper:
 Team Briefing and Options Paper:") Chesapeake Bay Program Partnership s Scientific, Technical Assessment and Reporting (STAR) Team Briefing and Options Paper: Addressing CBP Partnership s and Non-tidal Monitoring Network s 2013 Funding
Chesapeake Bay Program Partnership s Scientific, Technical Assessment and Reporting (STAR) Team Briefing and Options Paper: Addressing CBP Partnership s and Non-tidal Monitoring Network s 2013 Funding
Rationale Supporting Application of a Reference Curve for Assessment of the Chesapeake Bay Deep Channel Dissolved Oxygen Criterion
 Rationale Supporting Application of a Reference Curve for Assessment of the Chesapeake Bay Deep Channel Dissolved Oxygen Criterion Briefing Document for the CBP Scientific and Technical Advisory Committee
Modeling Eutrophication Processes in the Delaware Estuary to Link Watershed Efforts to Control Nutrient Impacts
 Modeling Eutrophication Processes in the Delaware Estuary to Link Watershed Efforts to Control Nutrient Impacts Delaware Watershed Research Conference Philadelphia, PA November 8, 2017 Principal Investigators:
Content Overview of the next Chesapeake Bay Ambient Water Quality Criteria Technical Addendum
 Content Overview of the next Chesapeake Bay Ambient Water Quality Criteria Technical Addendum Peter Tango USGS@CBPO February 12, 2016 STAC Criteria Addendum Review Panel The Water Quality Standards Framework
OLD DOMINION UNIVERSITY. Old Dominion University, Norfolk, Virginia Virginia Department of Environmental Quality Richmond, Virginia 23230
 OLD DOMINION UNIVERSITY 1 Department of Biological Sciences Old Dominion University, Norfolk, Virginia 23529 2 Department of Chemistry and Biochemistry Old Dominion University, Norfolk, Virginia 23529
Nitrogen Cycling, Primary Production, and Water Quality in the New River Estuary. Defense Coastal/Estuarine Research Program (DCERP)
") Nitrogen Cycling, Primary Production, and Water Quality in the New River Estuary Defense Coastal/Estuarine Research Program (DCERP) Introduction: A key theme of the ongoing DCERP program is monitoring
Nitrogen Cycling, Primary Production, and Water Quality in the New River Estuary Defense Coastal/Estuarine Research Program (DCERP) Introduction: A key theme of the ongoing DCERP program is monitoring
From Programmatic Goals to Criteria for Phytoplankton Chlorophyll a
 From Programmatic Goals to Criteria for Phytoplankton Chlorophyll a A report prepared by Claire Buchanan, PhD Interstate Commission on the Potomac River Basin February 26, 2016 ICPRB Report 16-1 (Minor
James River Watershed Model Development of Hydrodynamic Model
 James River Watershed Model Development of Hydrodynamic Model Modeling Report February 2016 Prepared for: Virginia Department of Environmental Quality 629 East Main Street Richmond, VA 23219 Prepared by:
Planning Targets. For WQGIT Review Draft November 7, 2017
 Chesapeake Bay Program Partnership Development and Review of the Draft Phase III WIP Planning Targets On December 19-20, 2017, the Water Quality Goal Implementation Team (WQGIT) will be seeking the approval
Tina Laidlaw US EPA 1
 Tina Laidlaw US EPA 1 Many states have developed approaches for listing waterbodies for nutrient-related impairments based on the narrative standard Existing state approaches are similar to CO s proposal
The Chesapeake Bay TMDL
 The Chesapeake Bay TMDL Introduction to a Pollution Diet for 17 Million Chesapeake Bay Watershed Residents Rich Batiuk Associate Director for Science U.S. EPA Region 3 Chesapeake Bay Program Office March
Full Title of Priority: Enhanced Analysis and Explanation of Water-Quality Data for the TMDL Mid-Point Assessment
 MIDPOINT ASSESSMENT PRIORITY WORK PLAN: MEASURE AND EXPLAIN WATER-QUALITY CHANGES LEAD: SCIENTIFIC, TECHNICAL ANALYSIS, AND REPORT (STAR) TEAM 2016-17 EXPECTATIONS Full Title of Priority: Enhanced Analysis
BIO-POLLUTION: HARMFUL ALGAL BLOOMS IN VIRGINIA WATERS
 BIO-POLLUTION: HARMFUL ALGAL BLOOMS IN VIRGINIA WATERS Harold G. Marshall Department of Biological Sciences Old Dominion University Norfolk, Virginia General Definitions Pollution: The presence in the
Narrative Water Quality Objective
 Narrative Water Quality Objective Waste discharges shall not contribute to excessive algal growth in inland surface receiving waters. (Basin Plan, 1995, pg. 4-5) Excessive is not defined No numeric standard
Dog River Watershed Management Plan
 Dog River Watershed Management Plan Preliminary Water Quality Data Analysis Doug Robison, PWS ESA is where solutions and service meet. Water Quality - Regulatory Primer Designated Use Categories Swimming
PRINCIPAL FINDINGS Magnitude, Duration and Composition of Algal Blooms
 Executive Summary First Year Findings from the James River Chlorophyll-a Study Prepared for the DEQ Science Advisory Panel By Dr. Paul A. Bukaveckas, Virginia Commonwealth University (July 15, 2013) INTRODUCTION
Jordan River TMDL Update
 Jordan River TMDL Update 2010 Watershed Symposium August 4 th, 2010 Hilary N. Arens Utah Division of Water Quality Jordan River TMDL Outline What is a TMDL and what is the Jordan impaired for? Evaluation
St. Lucie Estuary: Analysis of Annual Cycles and Integrated Water Column Productivity
 St. Lucie Estuary: Analysis of Annual Cycles and Integrated Water Column Productivity Tom Gallo, Malcolm Pirnie Inc. Clifton Bell, Malcolm Pirnie Inc. Peter Doering, South Florida Water Management District
Watershed and Water Quality Modeling to Support TMDL Determinations Lake Oologah
 Watershed and Water Quality Modeling to Support TMDL Determinations Lake Oologah 26 th Annual Conference Oklahoma Clean Lakes and Watersheds Association (OCLWA) April 5-6, 2017 Stillwater, Oklahoma Lake
The Chesapeake Bay Blueprint:
 PHASE II The Chesapeake Bay Blueprint: THE BEST HOPE FOR RESTORING CLEAN WATER THIS NATION HAS EVER SEEN Peter McGowan/U.S. Fish and Wildlife Service Strategic Plan 2016-2020 The Chesapeake Bay Foundation
Thresholds in Recovery of Eutrophic Bay Sub-Systems: Five Case-Studies
 Thresholds in Recovery of Eutrophic Bay Sub-Systems: Five Case-Studies W. Michael Kemp, Walter Boynton, and Denise Breitburg University of Maryland CES & SERC (Collaborators: J. Testa, Y. Lee, J. Hagy,
Chemical and Physical Analysis of the Cape Fear Estuary
 The Cape Fear River Chemical and Physical Analysis of the Cape Fear Estuary The Cape Fear River (CFR), the most industrialized of all North Carolina s rivers, winds for over miles through the heart of
Pacific Coastal Ecology Branch Physical and Water Quality Data
 Pacific Coastal Ecology Branch Physical and Water Quality Data Data Contributors: Cheryl A. Brown, Peter Eldridge, Robert Ozretich, Anne Sigleo & David Specht CRUISES CTD profiles using (SBE 19 SEACAT)
Details of DO Criteria. Peter Tango EPA Chesapeake Bay Program Office March 16, 2011
 Details of DO Criteria Peter Tango USGS@ EPA Chesapeake Bay Program Office March 16, 2011 Umbrella Criteria Action Team Walter Boynton Jeni Keisman Tish Robertson Elgin Perry Claire Buchanan Matt Hall
Chesapeake Bay Water Quality Restoration:
 Chesapeake Bay Water Quality Restoration: The Transition to a Regulatory Approach Building on Decades of Cooperative Partnership Rich Batiuk Assoc. Director for Science Chesapeake Bay Program Office U.S.
The Virginia Harmful Algal Bloom Task Force. Surveillance and Response to Protect Public Health
 The Virginia Harmful Algal Bloom Task Force Surveillance and Response to Protect Public Health Margaret Smigo Waterborne Hazards Control Program Office of Epidemiology - Division of Environmental Epidemiology
Evaluation of Water Quality in. Sylvia Heaton Water Bureau, MDNRE
 Evaluation of Water Quality in Ford and Belleville Lakes Sylvia Heaton Water Bureau, MDNRE Objectives of 2010 TMDL Reevaluation Evaluate nutrient (total phosphorus) levels in Ford and Belleville Lakes
Table of Contents. Table of Figures
 Appendix A: Modeling Report Little Manatee WBID: 1790 Nutrients and Dissolved Oxygen September 30, 2009 Table of Contents 1. WATERSHED DESCRIPTION... 1 2. TMDL TARGETS... 2 3. MODELING APPROACH... 2 3.1.
2009/2010 Water Column Overview, Red Tide Update, and Bay Eutrophication Model 2010 Results. OMSAP Meeting June 30, 2011.
 29/21 Water Column Overview, Red Tide Update, and Bay Eutrophication Model 21 Results OMSAP Meeting June 3, 211 Scott Libby Contributions from D. Anderson, D. Borkman, C.S. Chen, R. Geyer, and C. Oviatt
Drones: A New Tool for Water Monitoring
 Drones: A New Tool for Water Monitoring Donglai Gong Carl Friedrichs, Ryan Carnegie Outline What are the goals of water monitoring (from marine scientist s perspective)? Healthy ecosystem? Fisheries /
Climate Change, Marsh Erosion and the Chesapeake Bay TMDL
 Climate Change, Marsh Erosion and the Chesapeake Bay TMDL Rising sea level in Chesapeake Bay is inexorable. One environmental effect associated with sea level rise is marsh erosion. Marsh erosion can impact
Phosphorus Goal Setting Process Questions and Answers 2010
 Lake Winnipesaukee Watershed Management Plan Phase I: Meredith, Paugus, Saunders Bays 1. What is phosphorus? Phosphorus (P) is a naturally occurring element and a major nutrient required for biological
Understanding the Effect of the Conowingo Dam and Reservoir on Bay Water Quality
 Understanding the Effect of the Conowingo Dam and Reservoir on Bay Water Quality Background The Susquehanna River has a major influence on Chesapeake Bay Water Quality. The Susquehanna watershed is 43%
EPA s Proposed Water Quality Standards for Florida s Lakes and Flowing Waters Establishing Numeric Nutrient Criteria January 14, 2010
 EPA s Proposed Water Quality Standards for Florida s Lakes and Flowing Waters Establishing Numeric Nutrient Criteria January 14, 2010 Erik Silldorff, DRBC NJ Water Monitoring Council Meeting Feb 3, 2010
Chesapeake Bay Program Indicator Analysis and Methods Document Water Quality Standards Achievement Updated 12/20/2017
 Chesapeake Bay Program Indicator Analysis and Methods Document Water Quality Standards Achievement Updated 12/20/2017 Indicator Title: Water Quality Standards Achievement Relevant Outcome(s): Water Quality
Estimated Influence of 2050 Climate Change on Chesapeake Bay Water Quality Standards.
 Estimated Influence of 2050 Climate Change on Chesapeake Bay Water Quality Standards. Water Quality Goal Implementation Team Meeting NCTC Shepherdstown, WV December 14, 2015 Lewis Linker 1, Gopal Bhatt
E3 Model Scenario Purpose and Definitions
 E3 Model Scenario Purpose and Definitions Gary Shenk (USGS) Jeff Sweeney (EPA) Chesapeake Bay Program Office Water Quality GIT Meeting August 14, 2017 Documentation of E3 and Planning Targets Chesapeake
Chesapeake Bay Program Indicator Analysis and Methods Document Water Quality Standards Achievement Updated 10/9/2018
 Chesapeake Bay Program Indicator Analysis and Methods Document Water Quality Standards Achievement Updated 10/9/2018 Indicator Title: Water Quality Standards Achievement Relevant Outcome(s): Water Quality
Triblet Characteristics & Responses
 Triblet Characteristics & Responses K.G. Sellner 1, W.R. Boynton 2, J. Testa 2, T. Rosen 3, R.J. Orth 4, D. Dauer 5, and J. Uphoff 6 1 Center for Coastal & Watershed Studies, Hood College 2 UMCES-CBL 3
Hypoxia in the Gulf of Mexico: Benefits and Challenges of Using Multiple Models to Inform Management Decisions
 Hypoxia in the Gulf of Mexico: Benefits and Challenges of Using Multiple Models to Inform Management Decisions Multiple Models for Management (M3.2) in the Chesapeake Bay February 25, 2013 Annapolis MD
2012 Nutrient Regulations Update
 2012 Nutrient Regulations Update OWEA Government Affairs Workshop March 1, 2012 Guy Jamesson, PE, BCEE Malcolm Pirnie, The Water Division of ARCADIS Imagine the result Agenda Nutrient impacts Nutrient
Nutrients. Water Quality Planning Branch Water Division Arkansas Department of Environmental Quality
 Nutrients Water Quality Planning Branch Water Division Arkansas Department of Environmental Quality Water Quality & Biological Data Water Quality Standards & Criteria Assessment Permit Limitations Impairment
Otter Creek Watershed TMDL Project. Stakeholder Meeting June 6, 2013
 Otter Creek Watershed TMDL Project Stakeholder Meeting June 6, 2013 1 Meeting Purpose Meet with watershed & technical advisory group members and watershed landowners to provide basic Otter Creek TMDL project
CBP Climate Resiliency Workgroup. June 20, 2016
 2017 Midpoint Assessment Management Needs: Estimated Influence of 2025 and 2050 Sea Level Rise and Tidal Marsh Loss on Chesapeake Bay Water Quality Standards CBP Climate Resiliency Workgroup June 20, 2016
Technical Tasks to Support Revision of the TMDL 1) Update lake models to account for slow decay rate for phosphorus (Anderson) 2) Update Lake
 Update lake models to account for slow decay rate for phosphorus (Anderson) 2) Update Lake") Technical Tasks to Support Revision of the TMDL 1) Update lake models to account for slow decay rate for phosphorus (Anderson) 2) Update Lake Elsinore model to include interaction between zooplankton and
Technical Tasks to Support Revision of the TMDL 1) Update lake models to account for slow decay rate for phosphorus (Anderson) 2) Update Lake Elsinore model to include interaction between zooplankton and
2014 Chesapeake Bay Watershed Agreement:
 2014 Chesapeake Bay Watershed Agreement: Management Strategy for the 2017 WIP Outcome, 2025 WIP Outcome, and Water Quality Standards Attainment & Monitoring Outcome Introduction Draft February 9, 2015
Upper Mississippi River Lake Pepin Water Quality Model July INTRODUCTION
 1. INTRODUCTION This report describes the development, calibration/confirmation, and application of a linked hydrodynamic-sediment transport-water quality model for the Upper Mississippi River from Lock
Watershed - Lake Model to Support TMDL Determinations for Lake Thunderbird
 Watershed - Lake Model to Support TMDL Determinations for Lake Thunderbird 18 th Annual EPA Region 6 Stormwater Conference Workshop 5: TMDLs and You October 3, 2016 Oklahoma City, OK Lake Thunderbird Watershed-Lake
COG Region s Potomac Water Quality & Wastewater Treatment Fact Sheet (current draft, as of 7/28/09)
") COG Region s Potomac Water Quality & Wastewater Treatment Fact Sheet (current draft, as of 7/28/9) Background: Current Fact Sheet was prepared several years ago to summarize trends for certain water quality
COG Region s Potomac Water Quality & Wastewater Treatment Fact Sheet (current draft, as of 7/28/9) Background: Current Fact Sheet was prepared several years ago to summarize trends for certain water quality
Florida Department of Environmental Protection Numeric Nutrient Criteria: Current Status
 Florida Department of Environmental Protection Numeric Nutrient Criteria: Current Status Russ Frydenborg, Drew Bartlett, Daryll Joyner, Ken Weaver Division of Assessment and Restoration Support Nutrient
Full Title of Priority: Enhanced Analysis and Explanation of Water-Quality Data for the TMDL Mid-Point Assessment
 MIDPOINT ASSESSMENT PRIORITY WORK PLAN: ASSESS AND EXPLAIN WATER-QUALITY CHANGES LEAD: SCIENTIFIC, TECHNICAL ANALYSIS, AND REPORT (STAR) TEAM Full Title of Priority: Enhanced Analysis and Explanation of
Feedback mechanisms between cyanobacterial blooms, transient hypoxia and benthic phosphorus regeneration in shallow coastal environments
 Low oxygen environments in marine, estuarine and fresh waters 46th International Liege colloquium 5-9 May 214 Feedback mechanisms between cyanobacterial blooms, transient hypoxia and benthic phosphorus
ARKANSAS NUTRIENT CRITERIA DEVELOPMENT. EPA Region 6 Nutrient RTAG Dallas, Texas April 14, 2015
 ARKANSAS NUTRIENT CRITERIA DEVELOPMENT EPA Region 6 Nutrient RTAG Dallas, Texas April 14, 2015 CRITERIA DEVELOPMENT MILESTONES Assessment Methodology Beaver Lake Wadeable Streams Nutrient Trading-Act 335
Nutrient Response to Sewage Abatement in Hong Kong
 Nutrient Response to Sewage Abatement in Hong Kong Prof. Paul J. Harrison Atmospheric, Marine & Coastal Environment Program Institute for the Environment HK University of Science & Technology Outline Background
Watershed, Hydrodynamic, Water Quality and Sediment Flux Modeling to Support TMDL Determinations, Lake Thunderbird
 Watershed, Hydrodynamic, Water Quality and Sediment Flux Modeling to Support TMDL Determinations, Lake Thunderbird 24 th Annual Conference Oklahoma Clean Lakes and Watersheds Association (OCLWA) April
MARYLAND ASSOCIATION OF MUNICIPAL WASTEWATER AGENCIES, INC. VIRGINIA ASSOCIATION OF MUNICIPAL WASTEWATER AGENCIES, INC. M E M O R A N D U M
 MARYLAND ASSOCIATION OF MUNICIPAL WASTEWATER AGENCIES, INC. VIRGINIA ASSOCIATION OF MUNICIPAL WASTEWATER AGENCIES, INC. M E M O R A N D U M TO: FROM: CC: CBP Water Quality Steering Committee Representatives
Dead-Zones and Coastal Eutrophication: Case- Study of Chesapeake Bay W. M. Kemp University of Maryland CES Horn Point Laboratory Cambridge, MD
 Dead-Zones and Coastal Eutrophication: Case- Study of Chesapeake Bay W. M. Kemp University of Maryland CES Horn Point Laboratory Cambridge, MD Presentation to COSEE Trends Orientation at UMCES HPL 4 August
UCMR4 Cyanotoxins. What Will You Do If You Find Them? Keith W. Cartnick AWWA PA Annual Conference 2019
 UCMR4 Cyanotoxins What Will You Do If You Find Them? Keith W. Cartnick keith.cartnick@mottmac.com AWWA PA Annual Conference 2019 What are algae? Most are microscopic, photosynthetic organisms More of an
Some Context behind the Implementation of Numeric Nutrient Criteria or Why do we have these Water Quality Regulations?
 Some Context behind the Implementation of Numeric Nutrient Criteria or Why do we have these Water Quality Regulations? Mark W. Clark and Thomas Obreza Soil and Water Science Department University of Florida,
Toward a Great Lakes Watershed Ecological Sustainability Strategy (GLWESS): Modeling Workshop. Lansing, MI May 3, 2012
: Modeling Workshop. Lansing, MI May 3, 2012") Toward a Great Lakes Watershed Ecological Sustainability Strategy (GLWESS): Modeling Workshop Lansing, MI May 3, 2012 Presentation Outline Overview of ecological concerns General modeling overview How
Toward a Great Lakes Watershed Ecological Sustainability Strategy (GLWESS): Modeling Workshop Lansing, MI May 3, 2012 Presentation Outline Overview of ecological concerns General modeling overview How
Retrospective analysis of hydrologic impacts in the Chesapeake Bay watershed
 Retrospective analysis of hydrologic impacts in the Chesapeake Bay watershed Harsh Beria1,3, Rob Burgholzer2, Venkat Sridhar3 Indian Institute of Technology Kharagpur, India & Summer intern Virginia Department
Relationships between Residence Time and Cyanobacterial Blooms in a Nutrient-Rich River System
 Relationships between Residence Time and Cyanobacterial Blooms in a Nutrient-Rich River System Michael F. Coveney, John C. Hendrickson, Erich R. Marzolf, Rolland S. Fulton, Jian J. Di, Clifford P. Neubauer,
Chesapeake Bay Program Partnership s Investment in the Chesapeake Monitoring Cooperative: What s Different This Time Around
 Chesapeake Bay Program Partnership s Investment in the Chesapeake Monitoring Cooperative: What s Different This Time Around Rich Batiuk Associate Director for Science, Analysis and Implementation Chesapeake
H1: Watershed land use and stream bank morphology determine sediment load and P- N speciation sensitive to timing, frequency, and intensity of rain-sn
 Question 1: What is the relative importance of endogenous inlake processes (e.g. internal loading, ice cover, hydrodynamics) versus exogenous to-lake processes (e.g. land use change, snow/rain timing,
Lower Cape Fear River Basin Cape Fear DO Issues
 Lower Cape Fear River Basin Cape Fear DO Issues by Jim Bowen, Assoc. Professor Civil Engr. Dept., UNC Charlotte Cape Fear Basin TMDL Conference Raleigh, NC September 9, 2003 Outline of Talk 1. Water Quality
Philadelphia Water Department 9/24/13
 Philadelphia Water Department 9/24/13 Need for PWD to develop water quality models of Delaware and tidal Schuylkill Rivers Overview of data collection and modeling efforts Hydrodynamics and water quality
Chesapeake Bay Program Models:
 Chesapeake Bay Program Models: A Guide to Better Understanding Modeling and Decision Support Tool Forum Penn State Harrisburg August 1, 2011 1 Mark Dubin Agricultural Technical Coordinator University of
Understanding the Influence of the Conowingo Reservoir Infill on Expectations for States Nutrient and Sediment Pollutant Load Reductions
 Understanding the Influence of the Conowingo Reservoir Infill on Expectations for States Nutrient and Sediment Pollutant Load Reductions Presented to the Water Quality Goal Implementation Team October
Results of Latest Phase 6 Conowingo Analysis
 Results of Latest Phase 6 Conowingo Analysis STAC Quarterly Meeting September 13, 2017 Lew Linker, Gopal Bhatt, and the CBP Modeling Team Chesapeake Bay Program Science, Restoration, Partnership 1 Overview
Qian Zhang (UMCES / CBPO) Joel Blomquist (USGS / ITAT)
 Joel Blomquist (USGS / ITAT)") CBP STAC Water Clarity Workshop Solomons, MD, 02/06/2017 Long-term Riverine Inputs from Major Tributaries to Chesapeake Bay Relevant to Water Clarity Qian Zhang (UMCES / CBPO) Joel Blomquist (USGS / ITAT)
CBP STAC Water Clarity Workshop Solomons, MD, 02/06/2017 Long-term Riverine Inputs from Major Tributaries to Chesapeake Bay Relevant to Water Clarity Qian Zhang (UMCES / CBPO) Joel Blomquist (USGS / ITAT)
Annual Report on Clam Bay Numeric Nutrient Concentration (NNC) Criteria
 Criteria") March 7, 2018 Tim Hall, Turrell, Hall and Associates, Inc. David Tomasko, Ph.D. Emily Keenan, M.S. Annual Report on Clam Bay Numeric Nutrient Concentration (NNC) Criteria Executive Summary Water quality
March 7, 2018 Tim Hall, Turrell, Hall and Associates, Inc. David Tomasko, Ph.D. Emily Keenan, M.S. Annual Report on Clam Bay Numeric Nutrient Concentration (NNC) Criteria Executive Summary Water quality
Colorado River Environmental Models
 Colorado River Environmental Models Presented to Mid-Central Water Quality Advisory Committee by Dean Thomas, P.E. LCRA Water Quality Protection January 20, 2015 Presentation Overview What is CREMS? A
INTERMEDIATE WATER QUALITY ASSESSMENT REPORT FOR THE CONFEDERATED TRIBES OF COOS, LOWER UMPQUA AND SIUSLAW INDIANS
 INTERMEDIATE WATER QUALITY ASSESSMENT REPORT FOR THE CONFEDERATED TRIBES OF COOS, LOWER UMPQUA AND SIUSLAW INDIANS Date issued: March 2016 Time period this report covers: October 2015 September 2016 Tribal
Integrating Air and Water Environmental Management in the Chesapeake Bay Program: An Encouraging Tale
 Integrating Air and Water Environmental Management in the Chesapeake Bay Program: An Encouraging Tale SERC Lecture Series August 15, 2017 Lewis C. Linker 1, Gary W. Shenk 1, Jesse Bash, & Ping Wang 3 1U.S.
The Continued Evolution of Our Chesapeake Bay and Basin Long-term Water Quality Monitoring Program: Growing with Partnerships
 The Continued Evolution of Our Chesapeake Bay and Basin Long-term Water Quality Monitoring Program: Growing with Partnerships Peter J. Tango Chesapeake Bay Monitoring Coordinator USGS@CBPO Chesapeake Bay
Meredith Howard Karen McLaughlin Nikolay Nezlin
 Meredith Howard Karen McLaughlin Nikolay Nezlin SCCWRP Objectives For Diversion Determine the fate of effluent nitrogen How quickly is effluent nitrogen consumed or transformed? Is effluent nitrogen being
Nutrient Limits: What to Expect. Water Division Arkansas Department of Environmental Quality
 Nutrient Limits: What to Expect Water Division Arkansas Department of Environmental Quality wentz@adeq.state.ar.us bailey@adeq.state.ar.us Timeline of Nutrient Criteria Development 1998 EPA published the
A Vision for the 2025 Chesapeake Bay Program Models
 A Vision for the 2025 Chesapeake Bay Program Models STAC Workshop: Chesapeake Bay Program Modeling in 2025 and Beyond January 17, 2018 Lew Linker and the CBP Modeling Team linker.lewis@epa.gov Chesapeake
Water Quality Standards Attainment
 2017 WIP, 2025 WIP and Water Quality Standards Attainment Management Strategy 2015 2025, v.1 I. Introduction For the past 30 years, the Chesapeake Bay Program (CBP) partnership 1 has been committed to
Younjoo Lee and Walter Boynton. Horn Point Laboratory and Chesapeake Biological Laboratory University of Maryland Center for Environmental Science
 Younjoo Lee and Walter Boynton Horn Point Laboratory and Chesapeake Biological Laboratory University of Maryland Center for Environmental Science 1 Data and Method Summer Hypoxia Dissolve Oxygen Patterns
Michael Suplee, Ph.D. Montana Dept. of Environmental Quality. Prepared For: Flathead Lake Watershed Advisory Group Meeting June 17, 2013
 Michael Suplee, Ph.D. Montana Dept. of Environmental Quality Prepared For: Flathead Lake Watershed Advisory Group Meeting June 17, 2013 Review of events leading to the lake targets proposed in late 1990s
Causes and Consequences of Algal Blooms in the Tidal Fresh James River
 Virginia Commonwealth University VCU Scholars Compass Theses and Dissertations Graduate School 2014 Causes and Consequences of Algal Blooms in the Tidal Fresh James River Joseph Wood Virginia Commonwealth
Southern California Bight 2008 Regional Monitoring Program: Volume VIII. Estuarine Eutrophication
 Technical Report 0711 Southern California Bight 2008 Regional Monitoring Program: Volume VIII. Estuarine Eutrophication K. McLaughlin 1, M. Sutula 1, L. Busse 2, S. Anderson 3, J. Crooks 4, R. Dagit 5,