Collecting Small Watershed Runoff and Water Quality Data. Daren Harmel
|
|
|
- Tracy Briggs
- 6 years ago
- Views:
Transcription


1 Collecting Small Watershed Runoff and Water Quality Data Daren Harmel


2 Objectives Small watershed data collection Provide How To overview for managers Present How To details for technical staff Discuss balance between project resources, monitoring goals, and data uncertainty


3 Small Watershed Data Collection Prior to this research, little published guidance was available to support design and operation of small watershed data collection. Costs and difficulties often under-estimated Projects characterized by inconsistent methods, missing data values, short-term data sets.
4 Small Watershed Data Collection Developed and published practical how to guidance Small watersheds (including edge-of-field ) Automated storm sampling Q measurement - USGS, ARS For example: Harmel, R.D., K.W. King, and R.M. Slade Automated storm water sampling on small watersheds. Appl. Eng. Agric. 19(6): Harmel, R.D., K.W. King, B.E. Haggard, D.G. Wren, and J.M. Sheridan Practical guidance for discharge and water quality data collection on small watersheds. Trans. ASABE 49(4): Harmel, R.D., R.M. Slade, and R.L. Haney Impact of sampling techniques on measured storm water quality data for small streams. J. Environ. Qual. 39: Manual grab sampling - USGS


5
 lab analysis Constrained by QA/QC Storm sampling safety, timing Problems")
6 Difficulties in Storm Sampling Requires substantial resource commitment equipment purchase and maintenance automated samplers needed personnel (travel, work hours) lab analysis Constrained by QA/QC Storm sampling safety, timing Problems will occur


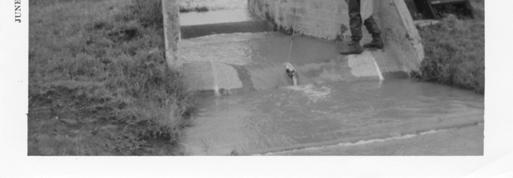
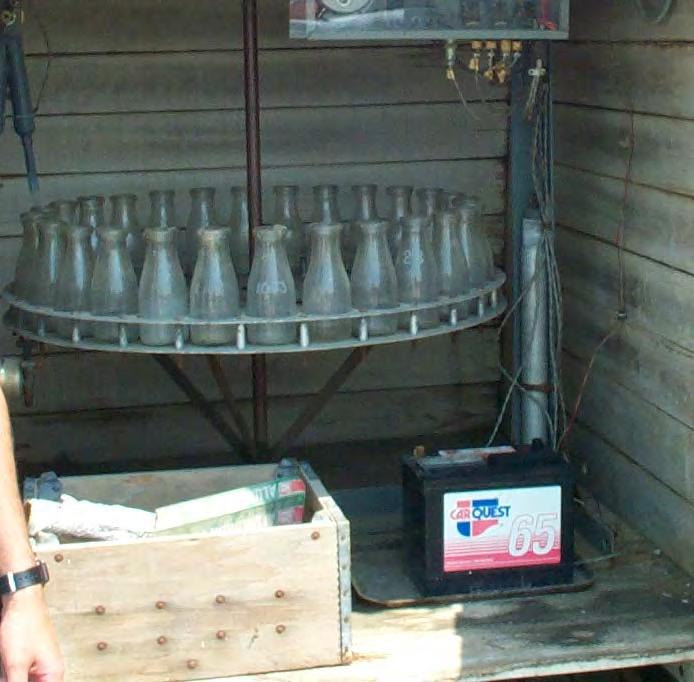
7 Difficulties in Storm Sampling


8 Difficulties in Storm Sampling lightning 8 in of rain following seeding/mulching
9 Designing Sampling Projects Project Objective: Achieve sampling goal(s) within financial, personnel, time, and watershed constraints Products: 1) Water quality data 2) Measurement uncertainty Sampling Components: 1) Automated vs Manual sampling 2) Q measurement 3) Enable level 4) Sampling interval 5) Discrete vs Composite samples

10 Sampling Components: Manual vs. Automated Automated sampling necessary in most projects Most samplers have: stage recorder/flow meter sample collection pump & bottle(s) programmable operation/memory Must commit to regular maintenance limit malfunctions prevent data loss

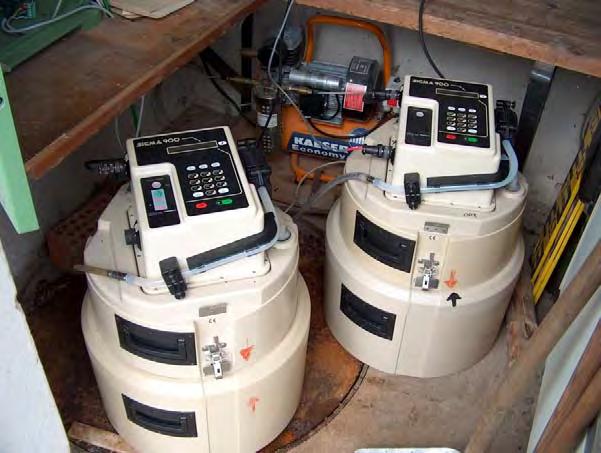


11 stage/flow recorder intake bottle(s)

 measure stage - preferably in")

12 Sampling Components: Q Measurement For continuous discharge measurement: Option #1 - establish stage-discharge relationship (rating curve) measure stage - preferably in stilling well determine Q with stage-discharge relationship Option #2 use in-stream area-velocity sensor
13 Sampling Components: Q Measurement 3 flow (cfs) Stage Discharge Curve stage-discharge relationship water level (ft)


14 Sampling Components: Q Measurement Developing a stage-discharge relationship in a natural channel requires substantial time and effort periodic adjustment


15 Sampling Components: Q Measurement Flow control (hydraulic) structure highly recommended Precalibrated flow control structure eliminates need to develop stage-discharge relationship provides consistent, accurate Q measurement for load and EMC determination Stilling Well
16 Sampling Components: Enable Level High Minimum Flow Threshold Enable Level increases error, even if consider Q and estimate concentration outside sampling period 96 relative elevation (ft) high enable level low enable level distance (ft)


17 Sampling Components: Enable Level Low Minimum Flow Threshold Enable Level reduces error, especially if consider Q and estimate concentration outside sampling period 96 relative elevation (ft) high enable level low enable level distance (ft)
18 Sampling Components: Sampling Interval Time-Interval Sampling Advantages simple, reliable Disadvantages difficult to choose interval Q needed to calculate load Low interval recommended flow (m 3 /s) 3 flow time-interval sample (10 min) time (min) time interval composite samples per bottle (min) discrete no no no no 10 no no no no 15 no no no yes 30 no no yes no 60 no yes no no 120 yes no no no 180 no no no no
19 Sampling Components: Sampling Interval Flow-Interval Sampling Advantages produces EMC easy to choose interval uniform sampling for various watershed sizes Disadvantages must accurately measure Q mm interval recommended flow (m 3 /s) 3 flow flow-interval sample (2.5 mm) time (min)


20 Sampling Components: Discrete vs Composite Discrete Sampling collection of 1 sample per bottle difficult to sample complete storms of various duration complete information on within-storm concentrations (if can sample complete event)

21 Sampling Components: Discrete vs Composite Composite Sampling collection of 2+ samples per bottle little or no increase in error reduced information on within-storm concentrations
22 Designing Sampling Projects Project Objective: Achieve sampling goal(s) within financial, personnel, time, and watershed constraints Products: 1) Water quality data 2) Measurement uncertainty Sampling Components: 1) Automated vs Manual sampling 2) Q measurement 3) Enable level 4) Sampling interval 5) Discrete vs Composite samples
23 Designing Sampling Projects Alternative Cost Uncertainty Recommend Raise enable level save $ increase No Increase sampling interval save $ increase No Composite samples save $ ~ no increase Yes Flow-interval, composite sampling with single bottle Decrease # sites save $$$ small increase Yes Decrease # storms save $$ large increase No, no!
24 Conclusions In small watershed runoff and water quality data collection, it is important to understand that successful projects achieve a difficult balance between project goal(s), data quality, sampling components collection of high quality data requires a great deal of time, $$, commitment all measured data are uncertain uncertainty increases dramatically without dedicated QA/QC QA/QC should include uncertainty estimation and reporting to increase value of data.
25 Understanding and Reducing Uncertainty in Hydrology and Water Quality Data Daren Harmel
26 Objectives Present background information on uncertainty in flow and water quality data Briefly describe the Data Uncertainty Estimation Tool for Hydrology and Water Quality (DUET- H/WQ) Discuss DUET results and personal experience related to uncertainty in small watershed sampling Should it not be required that every (field and modeling study) attempt to evaluate the uncertainty in the results? Beven (2006)

 analysis had been conducted on measured")
27 Uncertainty in H/WQ Data Why is data uncertainty typically ignored?? Until recently An adequate understanding of H/WQ measurement uncertainty had not been established. No complete uncertainty (error propagation) analysis had been conducted on measured H/WQ data. No easy-to-use tool was available to assist with uncertainty estimation in H/WQ.


28 Sources of Uncertainty discharge measurement - individual Q s, stage-discharge relation, channel conditions sample collection - EWI vs. grab vs. automated, sampling frequency, location in x-section, discrete vs. composite sample preservation/storage - pre-processing, preservation, storage duration and conditions laboratory analysis - reagents, standards, method, instrument, best fit curve data processing and management - mistakes, missing data The use of uncertainty estimation (should be) routine in hydrological and hydraulic science. Pappenberger, Beven (2006)


29 Uncertainty in H/WQ Data Developed uncertainty estimation framework (2006) focused on Q, TSS, N, and P data for small watersheds listed published uncertainty estimates in 4 categories discharge, sample collection, preservation/storage, analysis analyzed data quality scenarios (best, typical, worst) compared uncertainty introduced by each procedural category calculated cumulative uncertainty in resulting data
 added data processing and management procedural")
30 Uncertainty in H/WQ Data Enhanced uncertainty estimation framework to make more user-friendly (2009) added data processing and management procedural category

31


32

33

34 Uncertainty in H/WQ Data
35 Uncertainty in H/WQ Data

36 Uncertainty in H/WQ Data
37 Uncertainty in H/WQ Data
38 Conclusions Uncertainty is almost always ignored in spite of: numerous pleas for uncertainty analysis fact that all measurements are inherently uncertain. Uncertainty is rarely estimated and included in: Research and monitoring Data reporting Regulation and policy Model evaluation However, the ramifications of decisions based on these data are too great to continue to ignore uncertainty!!!

39 Conclusions
 770-6521 daren.")

40 Any Questions?? Daren Harmel (254) Includes uncertainty-related pubs (7) and sampling methods-related pubs (10)
Monitoring, Modeling and Decision-Making
 Monitoring, Modeling and Decision-Making Daren Harmel USDA-ARS, Temple, TX Grassland, Soil and Water Laboratory, Temple, TX Objectives for Today Small watershed monitoring Provide How To overview for managers
Considering Measurement Uncertainty in H/WQ Model Evaluation
 Considering Measurement Uncertainty in H/WQ Model Evaluation Daren Harmel USDA-ARS, Temple, TX Patti Haan-Smith Texas A&M Univ., College Station, TX Measurement Uncertainty in H/WQ Modeling Should it not
Environmental Modelling & Software
 Environmental Modelling & Software 24 (2009) 832 842 Contents lists available at ScienceDirect Environmental Modelling & Software journal homepage: www.elsevier.com/locate/envsoft Estimating storm discharge
Arkansas Water Resources Center
 Arkansas Water Resources Center ILLINOIS RIVER 21 POLLUTANT LOADS AT ARKANSAS HIGHWAY 59 BRIDGE Submitted to the Arkansas Soil and Water Conservation Commission By Marc A. Nelson, Arkansas Water Resources
Fall Line Input Monitoring on the Potomac River at Chain Bridge
 Fall Line Input Monitoring on the Potomac River at Chain Bridge 1983-2007 Metropolitan Washington Council of Governments and Occoquan Watershed Monitoring Laboratory Regional Monitoring Subcommittee Meeting
Arkansas Water Resources Center
 Arkansas Water Resources Center WATER QUALITY SAMPLING, ANALYSIS AND ANNUAL LOAD DETERMINATIONS FOR TSS, NITROGEN AND PHOSPHORUS IN THE BAYOU BARTHOLOMEW AT GARRETT BRIDGE, AR AND NEAR PORTLAND, AR Submitted
Arkansas Water Resources Center
 Arkansas Water Resources Center WATER QUALITY SAMPLING, ANALYSIS AND ANNUAL LOAD DETERMINATIONS FOR TSS, NITROGEN AND PHOSPHORUS AT THE WYMAN BRIDGE ON THE WHITE RIVER Submitted to the Arkansas Soil and
Arkansas Water Resources Center
 Arkansas Water Resources Center ILLINOIS RIVER 23 POLLUTANT LOADS AT ARKANSAS HIGHWAY 59 BRIDGE Submitted to the Arkansas Soil and Water Conservation Commission and the Arkansas-Oklahoma Arkansas River
Arkansas Water Resources Center
 Arkansas Water Resources Center 2003 POLLUTANT LOADS KINGS RIVER NEAR BERRYVILLE, ARKANSAS Submitted to the Arkansas Soil and Water Conservation Commission By Marc A. Nelson, Ph.D., P.E. and L. Wade Cash,
ENGN.4010 ENGINEERING CAPSTONE DESIGN Watershed Analysis. CiA
 RATIONAL METHOD Q CiA Where: Q = Maximum Rate of Runoff (cfs) C = Runoff Coefficient i = Average Rainfall Intensity (in/hr) A = Drainage Area (in acres) RATIONAL METHOD Assumptions and Limitations: Watershed
2. Potential Extreme Peak Discharge in Texas
 2. Potential Extreme Peak Discharge in Texas This part of the work is focused on using GIS to apply the latest USGS peak discharge equations to create a 500m grid that stores the potential peak discharge
Surface Water Sampling
 Surface Water Sampling Steve Howatt Who are we? CRO based out of Prince Edward Island, CANADA We have two research farms: New Glasgow, Prince Edward Island serving Zone 1 (1A) St Marc-sur-Richelieu, Quebec
Monitoring and Data Collection
 Setting the Course for Improved Water Quality Monitoring and Data Collection A TMDL training program for local government leaders and other water resource managers Session 8 wq-iw3-58 Your project to date
Clean Water Legacy Project Final Report
 Clean Water Legacy Project Final Report Project Title: Evaluation of alternative surfacewater monitoring protocols for use in agriculture TMDL load allocation and BMP evaluation. Submission Date: August
Effectiveness Study Dana Morton & Greg McGrath. Upper Deer Creek Regional Stormwater Facility. Features
 Upper Deer Creek Regional Stormwater Facility Effectiveness Study 2006-2010 Dana Morton & Greg McGrath Features Retrofit treatment for 516 acres of tributary area Untreated downtown industrial/residential
July 2009 WATER QUALITY SAMPLING, ANALYSIS AND ANNUAL LOAD DETERMINATIONS FOR NUTRIENTS AND SOLIDS ON
 July 2009 WATER QUALITY SAMPLING, ANALYSIS AND ANNUAL LOAD DETERMINATIONS FOR NUTRIENTS AND SOLIDS ON THE BALLARD CREEK, 2008 LESLIE B. MASSEY, WADE CASH, AND BRIAN E. HAGGARD Submitted to Arkansas Natural
Arkansas Water Resources Center
 Arkansas Water Resources Center 2004 POLLUTANT LOADS KINGS RIVER NEAR BERRYVILLE, ARKANSAS Submitted to the Arkansas Soil and Water Conservation Commission By Marc A. Nelson, Ph.D., P.E. L. Wade Cash,
University of Arkansas, Fayetteville. Marc Nelson. L. Wade Cash. Keith Trost. Jennifer Purtle
 University of Arkansas, Fayetteville ScholarWorks@UARK Technical Reports Arkansas Water Resources Center 6-1-2005 Water Quality Sampling, Analysis and Annual Load Determinations for Nutrients and Sediment
IPP Sampler Flow Pacing. Presented By Darrell Kuta Teledyne-Isco
 IPP Sampler Flow Pacing Presented By Darrell Kuta Teledyne-Isco Agenda Applications / Purpose Components of Samplers Flow Monitoring Technologies Sampling Methods The most important rule of collecting
Stormwater: Too Simple?
 Stormwater: Too Simple? Getting Closer to Advertised Level of Service Brandon Klenzendorf, Ph.D., P.E. 13 December 2017 - CWEA Fall Seminar Introduction Traditional approaches to solving stormwater problems
Operation and Maintenance of the Teledyne ISCO 6712 Portable Sampler and Water Quality Monitoring Station
 Ozarks Environmental and Water Resources Institute (OEWRI) Missouri State University (MSU) Standard Operating Procedures for: Operation and Maintenance of the Teledyne ISCO 6712 Portable Sampler and Water
Arkansas Water Resources Center
 Arkansas Water Resources Center WATER QUALITY SAMPLING, ANALYSIS AND ANNUAL LOAD DETERMINATIONS FOR TSS, NITROGEN AND PHOSPHORUS AT THE WASHINGTON COUNTY ROAD 195 BRIDGE ON THE WEST FORK OF THE WHITE RIVER
Application of the SWAT Hydrologic Model for Urban Stormwater Management
 UT Arlington, June 5 th, 2015 Application of the SWAT Hydrologic Model for Urban Stormwater Management Jaehak Jeong, PhD, PE Assistant Professor Texas A&M AgriLife Research Texas A&M University Roger Glick,
July 2009 WATER QUALITY SAMPLING, ANALYSIS AND ANNUAL LOAD DETERMINATIONS FOR THE ILLINOIS RIVER AT ARKANSAS HIGHWAY 59 BRIDGE, 2008
 July 29 WATER QUALITY SAMPLING, ANALYSIS AND ANNUAL LOAD DETERMINATIONS FOR THE ILLINOIS RIVER AT ARKANSAS HIGHWAY 59 BRIDGE, 28 LESLIE B. MASSEY, WADE CASH, AND BRIAN E. HAGGARD Submitted to Arkansas
Arkansas Water Resources Center
 Arkansas Water Resources Center WATER SAMPLING, ANALYSIS AND ANNUAL LOAD DETERMINATIONS FOR TSS, NITROGEN AND PHOSPHORUS AT THE L ANGUILLE RIVER NEAR PALESTINE Submitted to the Arkansas Soil and Water
SOUTHEAST TEXAS CONTINUING EDUCATION
 EXAM No. 118 FLOOD - RUNOFF ANALYSIS 1. Information gained from flood - runoff analysis includes which one: A. Stage, discharge, volume. B. Measure depth, volume. C. Velocity, depth, storm occurrence.
CE 2031 WATER RESOURCES ENGINEERING L T P C
 CE 2031 WATER RESOURCES ENGINEERING L T P C 3 0 0 3 QUESTION BANK PART - A UNIT I GENERAL 1. Write short notes on Water Resources Survey. 2. How do you calculate Average Annual Runoff depth? 3. Write short
SURFACE-RUNOFF CHARACTERISTICS UNDER SIMULATED RAINFALL CONDITIONS ABSTRACT
 Progress. Agric. 24(1 & 2): 219 227, 2013 ISSN 1017-8139 SURFACE-RUNOFF CHARACTERISTICS UNDER SIMULATED RAINFALL CONDITIONS P. Das 1, K. Mahmud 2* and S. Karmaker 1 Department of Irrigation and Water Management,
Estimating Future Floods to Manage Flood Risk
 Estimating Future Floods to Manage Flood Risk Michael Anderson California State Climatologist Extreme Precipitation Symposium 2012 Talk Overview Statistics Physics Climate Change Flood Management and the
Engineering Hydrology. Class 16: Direct Runoff (DRO) and Unit Hydrographs
 and Unit Hydrographs") Engineering Hydrology Class 16: and s Topics and Goals: 1. Calculate volume of DRO from a hydrograph; 2. Complete all steps to develop a. Class 14: s? HG? Develop Ocean Class 14: s? HG? Develop Timing
Engineering Hydrology Class 16: and s Topics and Goals: 1. Calculate volume of DRO from a hydrograph; 2. Complete all steps to develop a. Class 14: s? HG? Develop Ocean Class 14: s? HG? Develop Timing
THE WATER IS RISING SCALABLE, RELIABLE, AND RELEVANT INFORMATION SUPPORTING FIRST RESPONDERS. May 3, 2017
 THE WATER IS RISING SCALABLE, RELIABLE, AND RELEVANT INFORMATION SUPPORTING FIRST RESPONDERS May 3, 2017 Association of State Floodplain Managers 2017 Conference Jim Keith, PE, CFM Walter P Moore Andy
Urban Hydrology Characteristics and their Influence on Urban Stream Restoration Technology. Presented by:
 Urban Hydrology Characteristics and their Influence on Urban Stream Restoration Technology Presented by: Michael Clar Ecosite, Inc. James Gracie Brightwater, Inc. BACKGROUND Many streams in urban areas
Introduction, HYDROGRAPHS
 HYDROGRAPHS Sequence of lecture Introduction Types of Hydrograph Components of Hydrograph Effective Rainfall Basin Lag or Time Lag Parts of Hydrograph Hydrograph Analysis Factors Affecting Hydrograph Shape
CVEN 339 Summer 2009 Final Exam. 120 minutes allowed. 36 Students. No curve applied to grades. Median 70.6 Mean 68.7 Std. Dev High 88 Low 24.
 CVEN 339 Final Exam 120 minutes allowed 36 Students No curve applied to grades Median 70.6 Mean 68.7 Std. Dev. 13.7 High 88 Low 24.5 Name: CVEN 339 Water Resources Engineering Summer Semester 2009 Dr.
Improvement of model evaluation by incorporating prediction and measurement uncertainty
 Improvement of model evaluation by incorporating prediction and measurement uncertainty Reporter : Li Shuang School of Environment, BNU Date : July 27, 2016 2016 International Soil and Water Assessment
Drainage Analysis. Appendix E
 Drainage Analysis Appendix E The existing and proposed storm drainage systems have been modeled with Bentley CivilStorm V8 computer modeling software. The peak stormwater discharge was determined for
BMP Design Aids. w w w. t r a n s p o r t a t i o n. o h i o. g o v. Equations / Programs
 BMP Design Aids 1 Equations / Programs Outlet Discharge Equations Hydrograph and Pond Routing Programs USGS StreamStats 2 Ohio Department of Transportation 1 Training Intent Introduction and overview of
Turbidity-controlled suspended sediment sampling
 Summer 1996 Turbidity-controlled suspended sediment sampling Jack Lewis and Rand Eads Pacific Southwest Research Station, USDA-Forest Service, Arcata, California For estimating suspended sediment concentration
SECTION IV WATERSHED TECHNICAL ANALYSIS
 A. Watershed Modeling SECTION IV WATERSHED TECHNICAL ANALYSIS An initial step in the preparation of this stormwater management plan was the selection of a stormwater simulation model to be utilized. It
Pat Conrad, Joe Pallardy, Kristine Maurer Water Quality Monitoring Summary Report
 technical memo Project Name 2017 Water Quality Monitoring Date 4/9/2018 To / Contact info From / Contact info Regarding Kayla Bergman: Squaw Creek WMA Pat Conrad, Joe Pallardy, Kristine Maurer 2017 Water
This section describes the field and laboratory methods used to implement the Monitoring Program.
 3.0 METHODS This section describes the field and laboratory methods used to implement the 2014-2015 Monitoring Program. In accordance with the 2012 Permit, the core monitoring program was conducted in
L-THIA Online and LID in a watershed investigation
 L-THIA Online and LID in a watershed investigation Larry Theller Agricultural and Biological Engineering, Purdue University Great Lakes Sedimentation Workshop Ann Arbor Mi. L-THIA On-line watershed delineation
HYDROLOGIC CONSIDERATIONS. 22 nd Annual Nonpoint Source Pollution Conference Saratoga Springs, NY
 LOW IMPACT DEVELOPMENT HYDROLOGIC CONSIDERATIONS 22 nd Annual Nonpoint Source Pollution Conference Saratoga Springs, NY May 18, 2011 PRESENTATION AGENDA Introduction Definitions Discuss Impacts to Hydrologic
11/13/2014. Summary. WSDOT s municipal permit (2009 and 2014) WSDOT s BMP design. How we are monitoring. Lessons learned
 WSDOT s BMP design. How we are monitoring. Lessons learned") Designing and Implementing a Stormwater Monitoring Program Washington State Municipal Stormwater Conference Roads and Highways Program November 2014 Summary WSDOT s municipal permit (2009 and 2014) WSDOT
Designing and Implementing a Stormwater Monitoring Program Washington State Municipal Stormwater Conference Roads and Highways Program November 2014 Summary WSDOT s municipal permit (2009 and 2014) WSDOT
11/13/2014. Designing and Implementing a Stormwater Monitoring Program
 Designing and Implementing a Stormwater Monitoring Program Washington State Municipal Stormwater Conference Roads and Highways Program November 2014 1 Summary WSDOT s municipal permit (2009 and 2014) WSDOT
Context for Central Sands Water Use Trends and Impacts
 Context for Central Sands Water Use Trends and Impacts Wisconsin Food, Land, and Water meeting Wisconsin Rapids, WI November 10, 2016 Kenneth R. Bradbury Wisconsin Geological and Natural History Survey,
SECTIONTHREE. Methods 3.1 PRECIPITATION AND FLOW MEASUREMENT 3.2 STORMWATER SAMPLING Precipitation Monitoring. 3.1.
 1. Section 1 ONE This section describes the field and laboratory methods used to conduct the Monitoring Program, which includes precipitation and flow monitoring, stormwater sampling, laboratory analyses,
EXHIBIT B PLANT OPERATION AND RESOURCES UTILIZATION
 EXHIBIT B PLANT OPERATION AND RESOURCES UTILIZATION TABLE OF CONTENTS PAGE LIST OF FIGURES... i 1.0 PLANT OPERATION AND RESOURCES UTILIZATION... 1 1.1 PLANT OPERATION... 1 1.1.1 Adverse Flow... 1 1.1.2
Introduction to Hydrology, Part 2. Notes, Handouts
 Introduction to Hydrology, Part 2 Notes, Handouts Precipitation Much of hydrology deals with precipitation How much? How frequently/infrequently? What form? How quickly? Seasonal variation? Drought frequency?
Table ES1. Review of Pebble Limited Partnership s (PLP s) Environmental Baseline Document (EBD): Hydrologic characterization
 Environmental Baseline Document (EBD): Hydrologic characterization") Executive Summary Table ES1. Review of Pebble Limited Partnership s (PLP s) Environmental Baseline Document (EBD): Hydrologic characterization Basic issue Does PLP have sufficient hydrologic data and an
Executive Summary Table ES1. Review of Pebble Limited Partnership s (PLP s) Environmental Baseline Document (EBD): Hydrologic characterization Basic issue Does PLP have sufficient hydrologic data and an
CLIMATE, HYDROLOGY, & HYDRAULIC CAPACITY, NEW YORK
 CLIMATE, HYDROLOGY, & HYDRAULIC CAPACITY, NEW YORK Todd Walter Biological & Environmental Engineering NYS Water Resources Institute Cornell University LAKE PLACID SEPTEMBER 13, 2016 1 Evolving Project
U. S. FOREST SERVICE RESEARCH NOTE NE-29
 U. S. FOREST SERVICE RESEARCH NOTE NE-29 1965 ACCURACY IN STREAMFLOW MEASUREMENTS ON THE FERNOW EXPERIMENTAL FOREST Measurement of streamflow from small watersheds on the Fernow Experimental Forest at
MONITORING THE SUSTAINABLE MANAGEMENT OF NUTRIENTS ON C&H FARM IN BIG CREEK WATERSHED
 Big Creek Research & Extension Team Quarterly Report Big Creek Research and Extension Team University of Arkansas System Division of Agriculture Quarterly Report July 1 to September 30, 2017 MOITORIG THE
Forests and Water in the Sierra Nevada. Roger Bales, Sierra Nevada Research Institute, UC Merced
 Forests and Water in the Sierra Nevada Roger Bales, Sierra Nevada Research Institute, UC Merced Some motivating points Water is the highest-value ecosystem service associated with Sierra Nevada conifer
Lake Wallenpaupack Watershed Assessment Project
 Submitted to: Pennsylvania Growing Greener Grants Center Submitted by: Lake Wallenpaupack Watershed Management District HC 1 Box 15D Paupack, PA 18451 Table of Contents Title Page Executive Summary...
Effect of forest management on water yields & other ecosystem services in Sierra Nevada forests UCB/UC Merced/UCANR project
 Effect of forest management on water yields & other ecosystem services in Sierra Nevada forests UCB/UC Merced/UCANR project Some motivating points Water is the highest-value ecosystem service associated
Runoff Hydrographs. The Unit Hydrograph Approach
 Runoff Hydrographs The Unit Hydrograph Approach Announcements HW#6 assigned Storm Water Hydrographs Graphically represent runoff rates vs. time Peak runoff rates Volume of runoff Measured hydrographs are
INFLOW DESIGN FLOOD CONTROL SYSTEM PLAN 40 C.F.R. PART PLANT DANIEL ASH POND B MISSISSIPPI POWER COMPANY
 INFLOW DESIGN FLOOD CONTROL SYSTEM PLAN 40 C.F.R. PART 257.82 PLANT DANIEL ASH POND B MISSISSIPPI POWER COMPANY EPA s Disposal of Coal Combustion Residuals from Electric Utilities Final Rule (40 C.F.R.
Subwatershed Prioritization of the Lake Wister Watershed Using Baseflow Water Quality Monitoring Data
 Subwatershed Prioritization of the Lake Wister Watershed Using Baseflow Water Quality Monitoring Data Bradley J. Austin, Brina Smith, and Brian E. Haggard Eutrophication Process by which excess nutrients
WEPP Simulated Tillage Effects on Runoff and Sediment Losses in a Corn-Soybean Rotation
 This paper was peer-reviewed for scientific content. Pages 877-881. In: D.E. Stott, R.H. Mohtar and G.C. Steinhardt (eds). 2001. Sustaining the Global Farm. Selected papers from the 10th International
Calibration of Hydrologic Design Inputs for a Small Urban Watershed
 Research Project Proposal for Johnson County Stormwater Management Program and City of Overland Park, Kansas Calibration of Hydrologic Design Inputs for a Small Urban Watershed Bruce M. McEnroe & C. Bryan
Are You Ready for Risk and Uncertainty Analysis?
 Are You Ready for Risk and Uncertainty Analysis? Presented to: Illinois Association for Floodplain And Stormwater Management Presented by: David T. Williams, Ph.D., P.E., P.H., CFM. D.WRE Senior Technical
Monitoring Stormwater Best Management Practices: Why Is It Important and What To Monitor
 Monitoring Stormwater Best Management Practices: Why Is It Important and What To Monitor Scott D. Struck, Ph.D. US EPA, Urban Watershed Management Branch New Jersey Water Monitoring Workshop 4/20/2006
Water Budget III: Stream Flow P = Q + ET + G + ΔS
 Water Budget III: Stream Flow P = Q + ET + G + ΔS Why Measure Streamflow? Water supply planning How much water can we take out (without harming ecosystems we want to protect) Flood protection How much
MVP 17.3 WATER BAR END TREATMENT SIZING AND DETAILS 1/22/18
 MVP 17.3 WATER BAR END TREATMENT SIZING AND DETAILS 1/22/18 The purpose of this detail is to document the methodology developed to size the length of the water bar end treatments to ensure flow leaving
Dissolved Oxygen Alteration Method for Fractured Bedrock Wellbore Characterization
 Dissolved Oxygen Alteration Method for Fractured Bedrock Wellbore Characterization Gary Robbins and Sarah Vitale Dept. of Natural Resources and the Environment Center for Integrative Geoscience University
Water Budget III: Stream Flow P = Q + ET + G + ΔS
 Water Budget III: Stream Flow P = Q + ET + G + ΔS Why Measure Streamflow? Water supply planning How much water can we take out (without harming ecosystems we want to protect) Flood protection How much
2015 Annual Report on Performance of Iowa CREP Wetlands: Monitoring and Evaluation of Wetland Performance
 Annual Report 2015 Annual Report on Performance of Iowa CREP Wetlands: Monitoring and Evaluation of Wetland Performance William Crumpton Professor Greg Stenback Associate Scientist January 1, 2015 December
Water Budget III: Stream Flow P = Q + ET + G + ΔS
 Water Budget III: Stream Flow P = Q + ET + G + ΔS Why Measure Streamflow? Water supply planning How much water can we take out (without harming ecosystems we want to protect) Flood protection How much
A Hydrologic Study of the. Ryerson Creek Watershed
 A Hydrologic Study of the Ryerson Creek Watershed Dave Fongers Hydrologic Studies Unit Land and Water Management Division Michigan Department of Environmental Quality May 8, 2002 Table of Contents Summary...2
Water Budget III: Stream Flow P = Q + ET + G + ΔS
 Water Budget III: Stream Flow P = Q + ET + G + ΔS Why Measure Streamflow? Water supply planning How much water can we take out (without harming ecosystems we want to protect) Flood protection How much
HYDROLOGIC & HYDRAULIC ASPECTS of the Walnut Street Bridge over the Schuylkill River Philadelphia, PA
 HYDROLOGIC & HYDRAULIC ASPECTS of the Walnut Street Bridge over the Schuylkill River Philadelphia, PA J. Richard Weggel CAEE201 Lectures 30 April & 2 May 2007 HYDROLOGY (Natural Science) Study of the waters
Reservoir on the Rio Boba
 Reservoir on the Rio Boba Michael J. Burns II Guillermo Bustamante J. James Peterson Executive Summary The National Institute of Water Resources in the Dominican Republic (INDRHI) plans to construct a
INFLOW DESIGN FLOOD CONTROL SYSTEM PLAN PLANT GREENE COUNTY ASH POND ALABMA POWER COMPANY
 INFLOW DESIGN FLOOD CONTROL SYSTEM PLAN PLANT GREENE COUNTY ASH POND ALABMA POWER COMPANY Section 257.82 of EPA s regulations requires the owner or operator of an existing or new CCR surface impoundment
Sharing Loading Estimation Experiences Workshop January 20, 2015 Ausable Bayfield Conservation Authority
 Sharing Loading Estimation Experiences Workshop January 20, 2015 Ausable Bayfield Conservation Authority 1 Total Phosphorus concentrations have decreased in all the Great Lakes over time, but water quality
Real-time Water Quality Monitoring
 Real-time Water Quality Monitoring Amanjot Singh, Ph.D., P. Eng. Water Quality Engineer Credit Valley Conservation Authority November 14, 212 Focus Current sampling methods their objectives and limitations
CLIMATE, HYDROLOGY, AND HYDRAULIC CAPACITY, NEW YORK
 January 6, 2016 CLIMATE, HYDROLOGY, AND HYDRAULIC CAPACITY, NEW YORK Todd Walter Josh Thiel Biological & Environmental Engineering NYS Water Resources Institute Cornell University New York State Dept.
Assessing the impact of projected climate changes on small coastal basins of the Western US
 Assessing the impact of projected climate changes on small coastal basins of the Western US William Burke Dr. Darren Ficklin Dept. of Geography, Indiana University Introduction How will climate change
The Importance of Laboratory Support in the Implementation of Water Safety Plans. Mark Rodgers
 The Importance of Laboratory Support in the Implementation of Water Safety Plans Mark Rodgers Water Supply and Water Resources Division National Risk Management Research Laboratory Office of Research and
Stormwater Monitoring Challenges and Trip-ups
 ASCE Oregon EWRG Stormwater Monitoring Challenges and Trip-ups in search of the elusive EMC January 25, 2017 Presented by Curtis Nickerson Bryan Berkompas It s a challenge! Targeting an ephemeral event
Storm Sewer Design. Bob Pitt University of Alabama and Shirley Clark Penn State Harrisburg
 Storm Sewer Design Bob Pitt University of Alabama and Shirley Clark Penn State Harrisburg Major floods are dramatic and water flow routes must be recognized when minor drainage systems fail. These types
Water Resources Management Plan
 P L Y M O U T H M I N N E S O T A Appendix D: The developed a to analyze and minimize the impact of existing and future development on the City s natural resources. It is important to the City to have
Chesapeake Bay STAC November 15 th, Marcus F. Aguilar, Ph.D. Research Scientist Virginia Tech Department of Civil and Environmental Engineering
 Chesapeake Bay STAC November 15 th, 2017 Marcus F. Aguilar, Ph.D. Research Scientist Virginia Tech Department of Civil and Environmental Engineering I. Background II. Methods III. Results IV. Conclusion/
HELENA INDUSTRIES INC. NPDES ISSUES STORMWATER CORRECTIVE ACTION PLAN
 HELENA INDUSTRIES INC. NPDES ISSUES STORMWATER CORRECTIVE ACTION PLAN JULY 28, 2014 HELENA INDUSTRIES INC NPDES ISSUES STORMWATER CORRECTIVE ACTION PLAN Prepared for Helena Industries Inc. 101 Martin Luther
What is runoff? Runoff. Runoff is often defined as the portion of rainfall, that runs over and under the soil surface toward the stream
 What is runoff? Runoff Runoff is often defined as the portion of rainfall, that runs over and under the soil surface toward the stream 1 COMPONENTS OF Runoff or STREAM FLOW 2 Cont. The types of runoff
Regulation 85. Navigating Regulation 85 Part II Lab Methods and Data Submission
 Regulation 85 Navigating Regulation 85 Part II Lab Methods and Data Submission Presented By: Colorado Water Quality Monitoring Council (CWQMC) and Colorado Monitoring Framework (CMF) rk (CMF) Presenters
Culvert Sizing procedures for the 100-Year Peak Flow
 CULVERT SIZING PROCEDURES FOR THE 100-YEAR PEAK FLOW 343 APPENDIX A: Culvert Sizing procedures for the 100-Year Peak Flow A. INTRODUCTION Several methods have been developed for estimating the peak flood
INFLOW DESIGN FLOOD CONTROL SYSTEM PLAN PLANT GASTON GYPSUM POND ALABAMA POWER COMPANY
 INFLOW DESIGN FLOOD CONTROL SYSTEM PLAN PLANT GASTON GYPSUM POND ALABAMA POWER COMPANY Section 257.82 of EPA s regulations requires the owner or operator of an existing or new CCR surface impoundment or
Continuous Surrogate Monitoring for Pollutant Load Estimation in Urban Water Systems
 Continuous Surrogate Monitoring for Pollutant Load Estimation in Urban Water Systems Anthony A. Melcher Jeffery S. Horsburgh, Bryce A. Mihalevich Civil and Environmental Engineering, Utah State University,
SUMMARY REPORT. Brik Zivkovich, M.S., EIT Graduate Engineering Intern, Master Planning Program
 SUMMARY REPORT BY: Holly Piza, P.E. Project Manager, Master Planning Program Brik Zivkovich, M.S., EIT Graduate Engineering Intern, Master Planning Program SUBJECT: Water quality summary report of the
1. Overview 2 2. Definitions 2 3. Laboratory Testing Criteria 2. A. Laboratory Qualifications 2. B. Analysis of TSS Samples 2. C.
 New Jersey Department of Environmental Protection Laboratory Protocol to Assess Total Suspended Solids Removal by a Hydrodynamic Sedimentation Manufactured Treatment Device January 25, 2013 Contents 1.
4/28/17. Size of Floods - Hydrograph Depicts flood data from gaging station; Hydrographs usually show Q vs. time
 GEOL 118 Final Exam Format similar to exams 1 and 2 Covers Lectures #27 40 (Global Climate Change I - Meteorite Impacts III) #35 Floods - II (Size, Prediction, Urbanization, Mitigation) 8:00, Thursday,
EDF HYDRO-MONITORING NETWORK
 Belle photo ici EDF HYDRO-MONITORING NETWORK How and Why EDF measure rivers discharge? Alexandre Hauet IAHR WMO IAHS Training Course on Stream Gauging Lyon -- September 2-4, 2018 EDF : ELECTRICITY OF FRANCE
River Processes River action (fluvial)
") River action (fluvial) is probably the single most important geomorphic agent and their influence in geomorphology can hardly be overestimated. 1 To understand the complexity associated with river flow
River action (fluvial) is probably the single most important geomorphic agent and their influence in geomorphology can hardly be overestimated. 1 To understand the complexity associated with river flow
STORMWATER RUNOFF AND WATER QUALITY IMPACT REVIEW
 SUBCHAPTER 8 STORMWATER RUNOFF AND WATER QUALITY IMPACT REVIEW 7:45-8.1 Purpose and scope of review Except for those projects expressly exempted by this chapter or waived by the Commission, the Commission
Towards effective monitoring of urban stormwater for better design and management
 Estonian Journal of Earth Sciences, 2016, 65, 3, 176 199 doi: 10.3176/earth.2016.12 Towards effective monitoring of urban stormwater for better design and management Bharat Maharjan, Karin Pachel and Enn
Monitoring of water levels and flood discharge
 Monitoring of water levels and flood discharge Changes Workshop TS-02 & 11 th edition International Summer School Environmental Hazards & Sustainable Development in Mountain Regions Thom Bogaard Delft
Sustainable Stormwater Management: Validating Water Quality and Quantity
 Sustainable Stormwater Management: Validating Water Quality and Quantity Progress Report from University of Virginia November 12, 2008 UVA Undergraduate Student Participants Andrew T. Smith Civil & Environmental
Overview of NRCS (SCS) TR-20 By Dr. R.M. Ragan
 TR-20 By Dr. R.M. Ragan") Overview of NRCS (SCS) TR-20 By Dr. R.M. Ragan TR-20 is a computer program for the simulation of runoff occurring from a single storm event. The program develops flood hydrographs from runoff and routes
Overview of NRCS (SCS) TR-20 By Dr. R.M. Ragan TR-20 is a computer program for the simulation of runoff occurring from a single storm event. The program develops flood hydrographs from runoff and routes
Are Concentration-Discharge Relations Influenced by Water Sample Collection Methods?
 University of Arkansas, Fayetteville ScholarWorks@UARK Theses and Dissertations 12-2014 Are Concentration-Discharge Relations Influenced by Water Sample Collection Methods? William Welch University of