Atmospheric Nitrogen Measurements with a focus on a possible NOx/SOx secondary standard. NADP Conference October 21, 2010 Rich Scheffe, U.S.
|
|
|
- Angelica Jackson
- 6 years ago
- Views:
Transcription
1 Atmospheric Nitrogen Measurements with a focus on a possible NOx/SOx secondary standard NADP Conference October 21, 2010 Rich Scheffe, U.S. EPA OAQPS
2 Acknowledge Adam Reff Jason Lynch Tara Greaver Nealson Watkins Rob Pinder Robin Dennis Bryan Hubbell Norm Possiel Carey Jang Joe Sickles Kristen Foley Donna Schwede Gary Lear Jason O Brien Joe Tikvart Nealson Watkins Eric Edgerton John Walker Joe Sickles Ken Pickering Jeff Brook
3 Why Nitrogen?
 Challenges for Air Policy Developing Multiple pollutant integrated management strategies Assessing and Protecting Ecosystem Health Multiple spatial scales of interest")
4 Emerging (?) Challenges for Air Policy Developing Multiple pollutant integrated management strategies Assessing and Protecting Ecosystem Health Multiple spatial scales of interest Intercontinental and Cross-Border Transport Maintaining AQM System Efficiency in the face of Changing Climate Ongoing Assessments and feedbacks of program progress (accountability)
5 Key atmospheric pollutants and subsequent deposition are interwoven through many of these chemical processes, linking human and ecosystem health Climate influences Primary Sources Climate influences SVOC VOC (HAPs) CO NO SO 2 Hg HAP metals gases OH RO 2 HO 2 O3 hν OH O3 hν NO 2 OH NH 3 HNO 3 OH, O3 OH Hg o,hg 2 H 2 SO 4 particles Organic PM Nitrate PM Sulfate PM One atmosphere treatment is important for Climate-AQ assessments Meteorology and climate affect these reactions which are dependent on temperature, light and moisture. Chemical Deposition
2SO4 [or NH4NO3] Fine PM (Nitrate, Sulfate, Organic PM) Visibilit y.")
6 Rekindled appreciation for oxidation processes. OH Role in Linking Pollutants Formation : One- Atmosphere VOC + OH --- > Orgainic PM PM2.5 SOx [or NOx] + NH3 + OH ---> (NH4)2SO4 [or NH4NO3] Fine PM (Nitrate, Sulfate, Organic PM) Visibilit y. OH Ozon e NOx + VOC + OH + hv ---> O3 Water Qualit y NOx + SOx + OH (Lake Acidification, Eutrophication) Air Toxics Acid Rain SO2 + OH ---> OH <---> Air Toxics (POPs, Hg, etc.) H2SO4 NO2 + OH ---> HNO3 C. Jang
7 Rekindled appreciation for Nitrogen N Role in Linking Pollutants Formation : One-Atmosphere Nighttime N2O5 Chemistry VOC + OH --- > Orgainic PM PM2.5 SOx [or NOx] + NH3 + OH ---> (NH4)2SO4 [or NH4NO3] O3 HONO HOOH hv hv hv O 1 D H O 2 PAN N2O5 NO3 O 3 P HNO3 hv NH4NO3 NO NO2 Fine PM (Nitrate, Sulfate, Organic PM) Visibilit y N Ozon e NOx + VOC + OH + hv ---> O3 VOC OH CO NH3 SOx H2SO4 FP org aer Water Qualit y NOx + SOx + OH (Lake Acidification, Eutrophication) Air Toxics Acid Rain SO2 + OH ---> OH <---> Air Toxics (POPs, Hg, etc.) H2SO4 NO2 + OH ---> HNO3 Source Secondary Sink Radical Pool HO2 ; RO2 Carbonyls hv SOx Clouds/Aqueous C. Jang
8 O3 inhalation - Human health Primary NAAQS Secondary NAAQS PM2.5, PM10 inhalation - Human health NO2 inhalation - Human health 1 hr = 100 ppb O3 deposition vegetation health NO2 deposition - vegetation health Visibility degradation* Regional Haze Rule N Future Secondary NAAQS? Ecosystem impact through Deposition Aquatic acidification Ecosystem impact through Deposition Nutrient enrichment Ecosystem impact through Deposition Terrestrial acidification Emissions based Rules (MACT, etc.) Emerging rules/programs? CAA Title 4 Acid rain Air toxics inhalation - Human health Direct or through transformations Climate moderating N 2 O
9 Million Tons National NO x and SO 2 Power Plant Emissions: Historic and Projected with CAIR 20 SO 2 (Our national emission strategy) NO x Projected, w/ CAIR 5 Not counting mobile source emissions 0 Source: EPA
10 Atmospheric nitrogen species of interest significance for mass budget Reactive oxidized species (NOy) NO, NO 2, HNO 3, PAN, p-no 3, HONO, org-n (non PAN) With N 2 O, assumed under the CAA definition of NOx Atmospheric science definitions NOx = NO +NO 2 NOz = NOy - NOx Reduced nitrogen NH 3, NH 4 NHx = NH 3 + NH 4 Nonreactive N 2 O Following are some general patterns regarding the spatial and temporal distribution of NOy species in concentration and deposition
 and")
11 Source; Jason O Brien, Env. Canada Examples of the Relative Abundance of Several NO y Species Measured at Two Rural Southeastern Canadian Sites as a Fraction of the Total Measured NO y Concentration -- Kejimkujik, NS, (top) and Egbert, ON, (bottom) during Although both sites are in rural locations, the Kejimkujik, NS site represents more aged air masses as it)ies considerably further downwind from major sources of NOx relative to the Egbert site. (Source: NARSTO, 2010)


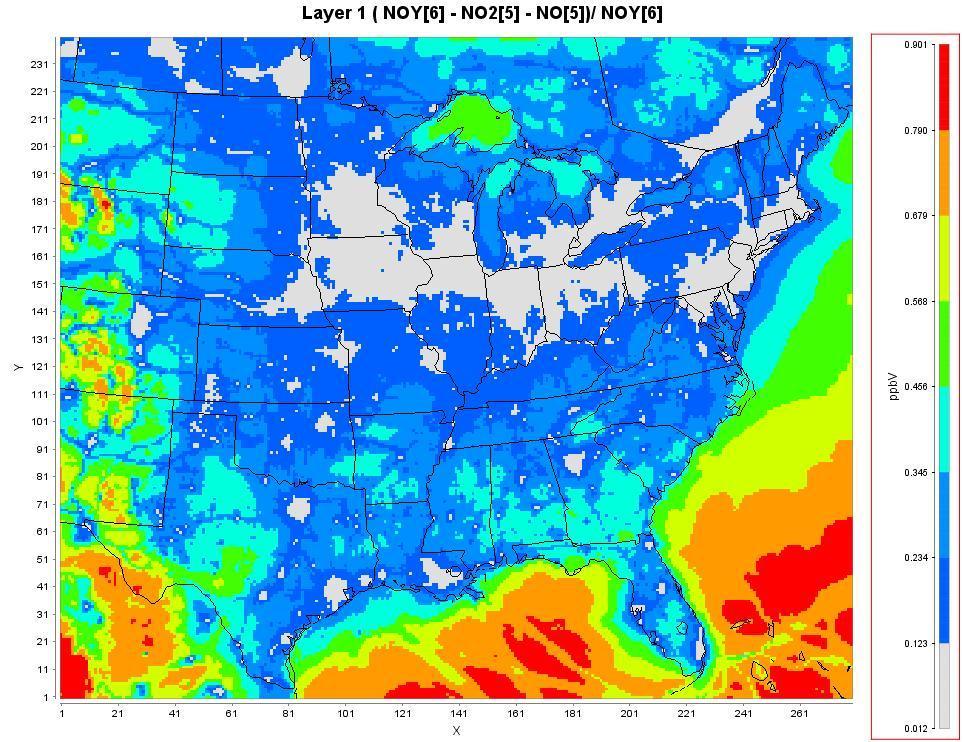
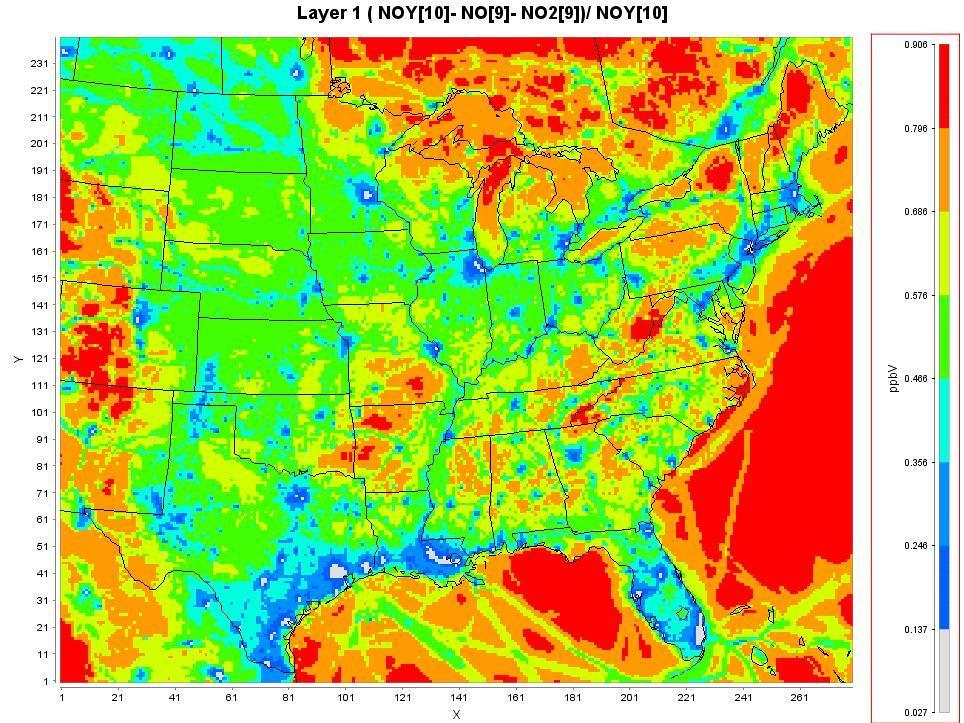
12 Annual, 2005 NOz/NOy Annual, 2005 July, 2005 January, 2005
13 Diurnal profiles of NOz/NOy 8 day sequence starting July 1, 2005 of NOz/NOy ratios in Atlanta. The x-axis is GMT. Atlanta 2008 JST hourly average NOz/NOy :00 2:00 4:00 6:00 8:00 10:00 12:00 14:00 16:00 18:00 20:00 22:00 July January Observed NOz/NOy ratios at the Jefferson Street site in Atlanta, GA (courtesy of Eric Edgerton).
 HNO3 Comparison of NOy species fractions of")
, Shenandoah (right) and Eastern U.")
14 NO2 SO2 (blue) and sulfate concentration (top) And deposition (bottom) HNO3 Comparison of NOy species fractions of concentration (top) and deposition (bottom) based on CMAQ for Adirondacks (left), Shenandoah (right) and Eastern U.S domain (center).
15 Toolbox of Atmospheric Nitrogen Observations (relatively routine) National NAAQS driven networks Visibility network (IMPROVE) SEARCH Dry deposition (CASTNET) Wet deposition (NADP) Satellites IAGOS International Flights Previously MOZAIC and CARIBE
16
17

18 NADP: wet NO3, NH4, org-n?

19 CASTNET: t-no3; NH4

20 NH3 NADP AMoN
21
 24 areas would require 2 monitors (> 2.")
22 Near Road NO 2 Monitors Are Required (1 hr NO 2 NAAQS = 150ppb) in 102 Urban Areas Not shown on map Anchorage, Alaska Honolulu, Hawaii San Juan, Puerto Rico Minimum Near-Road NO 2 Monitoring Requirements 78 areas would require 1 monitor (> 500,000 population) 24 areas would require 2 monitors (> 2.5 million population or road segments with annual average daily traffic counts > 250,000 vehicles) Monitors required no later then January 1, total monitors Approximately 40 additional monitors will be placed in locations to help protect communities that are susceptible and vulnerable to NO2-related health effects
 and IMPROVE")
23 PM 2.5 Chemical Speciation Network (CSN) and IMPROVE (p-no3)

24 National Core (NCore) Network urban (about 63 sites) rural (about 17 sites) May achieve additional rural coverage with National Parks and CASTNET Pollutants Measured - NAAQS multi-pollutant Particles PM continuous mass, filter mass, speciation PM mass Gases O 3 and high sensitivity measurements of CO, SO 2, NO and NO y. Meteorology - basic meteorological parameters Temperature, Wind Speed, Wind Direction, Relative Humidity

25 SouthEastern Aerosol Research and Characterization Study (SEARCH) - only routine U.S. network with continuous NO2, HNO#, NH3 Funded largely by Southern Company Eric Edgetron, PI A bit about satellite data, but first,,,
26 Largest decline in ozone occurs in and downwind of EGU NOx emissions reductions ( ) (analysis constrained by absence ambient NOx data) EGU NOx Tons Reduced Decline Decrease in from 2002 Seasonal to 2004 (Adjusted Data) Average 8-Hour Daily Maximum Ozone Met. Adj. Tons Reduction -33, ,000 28,000-73,000 74, ,000 Decrease in ppb -3 D -5 D < -3-8 D < -5 D < ,000 The major EGU NOx emissions reductions occurs after 2002 (mostly NOx SIP Call) Average rate of decline in ozone between 1997 and 2002 is 1.1%/year. Average rate of decline in ozone between 2002 and 2004 is 3.1%/year.
; right - GOME NO2 trends from 1995 2002 (after Richter, 2005). Clear evidence of reductions in midwest U.S.")
 and Sundays (right) indicating weekend/weekday patterns associated with reduced")
27 Satellites provide best source of ambient NO 2 : Accountability and Trends Figure 20. Left - superimposed Eastern U.S. emission and combined GOME and SCIAMACHY NO trends (Kim et al., 2006); right - GOME NO2 trends from (after Richter, 2005). Clear evidence of reductions in midwest U.S. and European NOx emissions, and increased NOx generated in Eastern Asia. Figure OMI NO2 column images aggregated for all Fridays (left) and Sundays (right) indicating weekend/weekday patterns associated with reduced Sunday emissions (source, Husar).
28 Satellite derived NH 3 Average daytime TES RVMR and CAMNet NH3 by month of year for all months with more than three TES observations. Error bars denote the 95th percentile confidence interval for the mean, Pinder et al., 2011 (Pinder et al., in preparation). See poster
29 Network Strengths and Gaps Spatially rich NO3, NH4 precipitation Highly leveraged rural network of t-no3 and NH4 Many urban based NO and NOx* sites Multiple N-species SEARCH Fledgling NOy with multiple non-n species Emerging NH 3 network through AMoN and possibly NCORE Satellite platforms for NO2 and emerging NH3 delineation Lack of routine true NO 2, except SEARCH Missing N species in rural networks (NO 2, PAN) Lack of temporal resolution in CASTNET No urban (NH3, NO 2, PAN) Limited NH 3 NH 4 only CASTNET No routine vertical profiling (aircraft)
30 CMAQ enhancements (Dennis, Pinder, Schwede, Bash, Walker, Mathur, Foley) PRISM adjustment : leveraging observed precip data Basis for current bias adjustments of wet NO3, NH4 Related to next 2 points Bi-directional NH3 treatment (Dennis et al., 2010) Enhances transport characteristics of NH3 Adds rationale for ambient NH3 monitoring Lightning NOx Evolving Improve wet NO3 performance
31 PRISM adjusted precipitation (Foley and Dennis) Figure 7-9 Unadjusted (left) and PRISM (right) adjusted CMAQ annual wet deposited nitrate (top) and ammonium (bottom) for 2002.

32 Bi-directional flux treatment of ammonia Figure Cumulative regional NH3 budget of advection, wet- and dry deposition, calculated for an expanding box starting at the high-emitting Sampson County NC cell (from Dennis et al, 2010)


33 Bias w/o lightning Bias with lightning Courtesy, Ken Pickering, NASA
34 How does the TBP NOx/SOx secondary standard deals with N? In light of sparse atmospheric observations, while Maintaining commensurability with CAA provisions Must have ambient air indicators Separate non-listed (not to be regulated) NHx from other N species What observations are recommended
35 Policy Assessment conceptual framework linking ecological indicator to NAAQS relevant air indictors to ecosystem indicator, ANC Modifying Factors Modifying Factors ANC level selected based on biological effects Ecosystem Acidification Model that relates ANC to deposition Deposition metrics of N +S Atmospheric Deposition Transferenc e Ratio Concentration of NOy and SOx Air Quality Indicator(s) Transference to ambient conditions, CMAQ CL Starts with critical load modeling: ANC lim * N S ( BC O ANClim ) Q Neco
36 Policy Assessment conceptual framework linking ecological indicator to NAAQS relevant air indictors underlying the form of the standard, AAPI the SSWC model form with NHx separated and allowable NOy and SOx deposition translated to allowable concentrations of NOy and SOx Modifying Factors Modifying Factors ANC level selected based on biological effects Ecosystem Acidification Model that relates ANC to deposition Deposition metrics of N +S Atmospheric Deposition Transference Ratio Concentration of NOy and SOx Air Quality Indicator(s) AAPI 1 Q * BC N / Q L( NHx) T NOy T SOx 0 ECO 1 Q NOy SOx
37 Deriving the AAPI from Critical Load Response Function The suggested acidification model for the catchment scale to express the critical load at a specified ANC is CL ANC lim * N S ( BC O ANClim ) Q Neco [BC] 0 * = the preindustrial concentration of base cations (equ/l) ANC lim = a target ANC level (equ/l) Q= surface water runoff (m/yr) N eco = nitrogen retention and denitrification by the ecosystem Derivation steps: - split out N and S CL deposition - subtract NHx fraction from total N deposition - transfer oxidized N and S deposition to concentrations -Rearrange terms to solve for ANC lim - yields the AAPI (form of the standard)
38 Tradeoff curve for SOx and NOy atmospheric concentrations SOx (µg/m 3 ) 5 ANC=50 & 95% lakes protected ANC=50 & 50% lakes protected Current concentrations NOy DL SOx DL % ECO % ECO S N ox ox 1 T 1 T SOx NOy 0 0 NOy (µg/m 3 ) 5 Deposition values are multiplied by the ratio of concentrations to depositions for NOx and SOx (1/V NOx and 1/V SOx ) to calculate atmospheric concentrations 1/T SOx = (µg/m 3 )/(meq/m 2 yr) 1/T NOx = (µg/m 3 )/(meq/m 2 yr)
39 Monitoring Recommendations Use existing NOy instruments as the FRM ~ 80 instruments deployed (NCore) Similar QC challenges to PM mass Rely on ORD Open inlet for p-so4 (CASTNET FP) Small fraction of ambient PMcoarse is a significant fraction of deposited sulfate Co-locate NH3 and NH4 measurements 2-5 sites nationally with speciated NOy True NO2, HNO3, p-no3 PAN,
Multi-Scale Applications of U.S. EPA s Third-Generation Air Quality Modeling System (Models-3/CMAQ)
") Multi-Scale Applications of U.S. EPA s Third-Generation Air Quality Modeling System (Models-3/CMAQ) Carey Jang, Pat Dolwick, Norm Possiel, Brian Timin, Joe Tikvart U.S. EPA Office of Air Quality Planning
Multi-Scale Applications of U.S. EPA s Third-Generation Air Quality Modeling System (Models-3/CMAQ) Carey Jang, Pat Dolwick, Norm Possiel, Brian Timin, Joe Tikvart U.S. EPA Office of Air Quality Planning
N Emissions, Air Quality & N Deposition: Past Trends and Future Projections
 6/18/2010 N Emissions, Air Quality & N Deposition: Past Trends and Future Projections Robin L. Dennis National Exposure Research Laboratory Atmospheric Modeling and Analysis Division, US EPA Workshop on
Merging space, time, chemistry and environmental media: Monitoring challenges
 Merging space, time, chemistry and environmental media: Monitoring challenges WRAP Monitoring Workshop Chandler, Arizona May 15, 2008 Rich Scheffe, EPA-OAR Acknowledgments Everyone WRAP-RPO s National
Current and estimated future atmospheric nitrogen loads to the Chesapeake Bay Watershed
 Current and estimated future atmospheric nitrogen loads to the Chesapeake Bay Watershed Jesse O. Bash, Kyle Hinson, Patrick Campbell, Norm Possiel, Tanya Spero, Chris Nolte 1 Outline Background of historic
EPA Regional Modeling for National Rules (and Beyond) CAIR/ CAMR / BART
 CAIR/ CAMR / BART") EPA Regional Modeling for National Rules (and Beyond) CAIR/ CAMR / BART 1 Emissions & Modeling Contacts Pat Dolwick Meteorology and Episodic Ozone Modeling Brian Timin Speciated Modeled Attainment Test
EPA Regional Modeling for National Rules (and Beyond) CAIR/ CAMR / BART 1 Emissions & Modeling Contacts Pat Dolwick Meteorology and Episodic Ozone Modeling Brian Timin Speciated Modeled Attainment Test
Earth Science Serving Society: Observations, Health, and Air Quality
 Earth Science Serving Society: Observations, Health, and Air Quality GEO User Interface Committee UIC Meeting: Health Break-out Group August 1-3, 2007 Lawrence Friedl & John Haynes Program Managers Applied
The Next Air Monitoring Strategy: Linking Agencies, Disciplines, Media and Global Communities and the National
 The Next Air Monitoring Strategy: Linking Agencies, Disciplines, Media and Global Communities and the National Academy of Sciences, accountability and the meaning of satellite data to air program management
Human Health and Environmental Effects of the Clear Skies Initiative
 Human Health and Environmental Effects of the Clear Skies Initiative Clear Skies Workshop June 19, 2002 Clear Skies Presentation Overview The importance of PM 2.5 - a multiple pollutant What s new on health
12. Ozone pollution. Daniel J. Jacob, Atmospheric Chemistry, Harvard University, Spring 2017
 12. Ozone pollution Daniel J. Jacob, Atmospheric Chemistry, Harvard University, Spring 2017 The industrial revolution and air pollution Pittsburgh in the 1940s Make great efforts to build China into a
Modeling Atmospheric Nitrogen Deposition: The Current State of the Science and Future Directions
 Modeling Atmospheric Nitrogen Deposition: The Current State of the Science and Future Directions Jesse O. Bash 1, Patrick Campbell 1, Norm Possiel 2, Donna Schwede 1, Ellen Cooter 1, Tanya Spero 1, Chris
The modification of global atmospheric Nitrogen cycling by human activities. David Fowler Centre for Ecology and Hydrology Edinburgh UK
 The modification of global atmospheric Nitrogen cycling by human activities David Fowler Centre for Ecology and Hydrology Edinburgh UK Background The N cycle Global N emissions Oxidised Nitrogen Reduced
Development of a 2007-Based Air Quality Modeling Platform
 Development of a 2007-Based Air Quality Modeling Platform US EPA Office of Air Quality Planning and Standards Heather Simon, Sharon Phillips, Norm Possiel 1 NEI Other EI Data Regulatory Modeling Platform
Particulate Matter Science for Policy Makers: A. Ambient PM 2.5 EXECUTIVE SUMMARY MASS AND COMPOSITION RESPONSES TO CHANGING EMISSIONS
 Particulate Matter Science for Policy Makers: A NARSTO Assessment was commissioned by NARSTO, a cooperative public-private sector organization of Canada, Mexico and the United States. It is a concise and
Satellite Products, the AQAST process, and EPA/OAQPS Air Quality Management Needs
 Satellite Products, the AQAST process, and EPA/OAQPS Air Quality Management Needs Rich Scheffe, Kirk Baker, Carey Jang, Pat Dolwick, James Kelly, Norm Possiel, Venkatesh Rao, Heather Simon (ack: J. Szykman,
Quantifying Emissions of Ammonia For Air Quality Analysis
 Quantifying Emissions of Ammonia For Air Quality Analysis Viney P. Aneja Department of Marine, Earth, and Atmospheric Sciences North Carolina State University Raleigh, NC 27695-8208, U.S.A. 2009 Science
Effects Of Using The CB05 vs. SAPRC99 vs. CB4 Chemical Mechanism On Model Predictions
 Effects Of Using The CB05 vs. SAPRC99 vs. CB4 Chemical Mechanism On Model Predictions Deborah Luecken 1 Sharon Phillips 2, Carey Jang 2, Norman Possiel 2 U.S. EPA, ORD/NERL 1, OAR/OAQPS 2 International
AIR STRATEGY ASSESSMENT PROGRAM: AN INTEGRATED SCREENING TOOL FOR AIR QUALITY PLANNING
 AIR STRATEGY ASSESSMENT PROGRAM: AN INTEGRATED SCREENING TOOL FOR AIR QUALITY PLANNING Darryl A. Weatherhead *, Bryan Hubbell, Dan Loughlin, Sarah Mazur, and David Misenheimer U.S. Environmental Protection
OAQPS Modeling, monitoring, emissions (AQAD) Updates. Rich Scheffe US EPA Office of Air Quality Planning and Standards
 Updates. Rich Scheffe US EPA Office of Air Quality Planning and Standards") OAQPS Modeling, monitoring, emissions (AQAD) Updates Biogenic 2005 Fires EGU NonEGU Onroad Nonpoint Nonroad Rich Scheffe US EPA Office of Air Quality Planning and Standards 1 Example Benefits to EPA headquarters
OAQPS Modeling, monitoring, emissions (AQAD) Updates Biogenic 2005 Fires EGU NonEGU Onroad Nonpoint Nonroad Rich Scheffe US EPA Office of Air Quality Planning and Standards 1 Example Benefits to EPA headquarters
NO2, SO2, PM2.5, Oh my!?! Information Session EPA R/S/L Modelers Workshop May 10, 2010
 NO2, SO2, PM2.5, Oh my!?! Information Session EPA R/S/L Modelers Workshop May 10, 2010 Purpose & Outline Provide background and updates on permit modeling processes and technical aspects related to new
Appendix G. Precursor Demonstration
 Appendix G Precursor Demonstration San Joaquin Valley Air Pollution Control District 2018 PM2.5 SIP Page 1 of 23 Appendix: San Joaquin Valley PM2.5 SIP INTRODUCTION Fine particulate matter (PM2.5) is made
SEARCH & VISTAS Special Studies. RPO National Technical Meeting St. Louis, MO November 5, 2003
 SEARCH & VISTAS Special Studies RPO National Technical Meeting St. Louis, MO November 5, 2003 Outline SEARCH Overview Data Quality for Continuous PM Carbon Collaboration NH 3 Measurements Biomass Emissions
Atmospheric Chemistry Air Pollution
 Atmospheric Chemistry Pontus Roldin Div. Nuclear Physics Dep. Physics Lund University Conflict between positive climate cooling effects and negative human health effects Are there good aerosol particles
Refined Grid CMAQ Modeling of Acidic and Mercury Deposition over Northeastern US
 Refined Grid CMAQ Modeling of Acidic and Mercury Deposition over Northeastern US Leon Sedefian SEDEFIAN Consulting and Michael Ku*, Kevin Civerolo, Winston Hao, Eric Zalewsky New York State Department
Modeling the Clear Skies Act. STAPPA/ALAPCO July 30, 2003
 Modeling the Clear Skies Act STAPPA/ALAPCO July 30, 2003 Topics Overview of analysis and results Years and strategies modeled PM 2.5 and ozone model results Updates and improvements from previous Clear
Model Evaluation and SIP Modeling
 Model Evaluation and SIP Modeling Joseph Cassmassi South Coast Air Quality Management District Satellite and Above-Boundary Layer Observations for Air Quality Management Workshop Boulder, CO May 9, 2011
Technical Document EPA s Draft Report on the Environment Chapter 1 - Cleaner Air 1.2 Acid Deposition 1-25
 Technical Document EPA s Draft Report on the Environment 3 1. Acid Deposition Sulfur dioxide and NO X emissions in the atmosphere react with water, oxygen, and oxidants to form acidic components, also
Evaluation of Options for Addressing Secondary PM 2.5 and Ozone Formation. Bruce Macdonald, PhD Jason Reed, CCM
 Evaluation of Options for Addressing Secondary PM 2.5 and Ozone Formation Bruce Macdonald, PhD Jason Reed, CCM 1 Overview Timeline and reasoning Regulatory drivers in the U.S. Emerging approaches Qualitative
Lab 7 Measurement of Ozone
 Georgia Institute of Technology School of Earth and Atmospheric Sciences EAS 4641 Spring 2007 Lab 7 Measurement of Ozone Purpose of Lab 7: In this lab you will measure the ambient concentration of ozone
BACKGROUND AEROSOL IN THE UNITED STATES: NATURAL SOURCES AND TRANSBOUNDARY POLLUTION. Daniel J. Jacob and Rokjin J. Park
 BACKGROUND AEROSOL IN THE UNITED STATES: NATURAL SOURCES AND TRANSBOUNDARY POLLUTION Daniel J. Jacob and Rokjin J. Park with support from EPRI, EPA/OAQPS How good are the default estimated natural PM concentrations
Final Ozone/PM2.5/Regional Haze Modeling Guidance Summary. AWMA Annual Conference Brian Timin June 28, 2007
 Final Ozone/PM2.5/Regional Haze Modeling Guidance Summary AWMA Annual Conference Brian Timin June 28, 2007 Ozone/PM2.5/Regional Haze Modeling Guidance Guidance on the use of Models and Other Analyses for
Regional Photochemical Modeling - Obstacles and Challenges. Extended Abstract No Prepared By:
 Regional Photochemical Modeling - Obstacles and Challenges Extended Abstract No. 33594 Prepared By: Christine L Haman, PhD Consultant Abhishek S Bhat, PhD Senior Consultant Tiffany L Gardner BREEZE Product
IMPROVE s Evolution. Data Tools Publications Special Studies Education Activities.
 IMPROVE s Evolution Data Tools Publications Special Studies Education Activities http://vista.cira.colostate.edu/improve VIEWS VIEWS To be Archived Datasets to be included IMPROVE aerosol data Forest
O3/PM2.5/Regional Haze Modeling Guidance Summary. Brian Timin EPA/OAQPS Western Met, Emissions, and AQ Modeling Workshop June 22, 2011
 O3/PM2.5/Regional Haze Modeling Guidance Summary Brian Timin EPA/OAQPS Western Met, Emissions, and AQ Modeling Workshop June 22, 2011 1 Ozone/PM2.5/Regional Haze Modeling Guidance Guidance on the use of
Western U.S. Air Quality Issues
 Western U.S. Air Quality Issues Tom Moore Western Regional Air Partnership May 9, 2011 Monitoring Emissions Fire Oil & Gas Example Air Quality Assessments & Modeling Gridded Emissions (maybe) Monitoring
The Community Multi-scale Air Quality (CMAQ) Modeling System:
 Modeling System:") The Community Multi-scale Air Quality (CMAQ) Modeling System: Past, Recent Developments, and New Directions Rohit Mathur Atmospheric Modeling and Analysis Division, U.S. EPA mathur.rohit@epa.gov University
The Community Multi-scale Air Quality (CMAQ) Modeling System: Past, Recent Developments, and New Directions Rohit Mathur Atmospheric Modeling and Analysis Division, U.S. EPA mathur.rohit@epa.gov University
Climate Change and Air Quality in US National Parks: a new project sponsored by NPS
 Climate Change and Air Quality in US National Parks: a new project sponsored by NPS Colette L. Heald & Maria Val Martin Colorado State University NPS Report June 16, 2011 OBJECTIVE: Investigate impact
Clean Air Act of 1970
 Clean Air Act of 1970 Set National Ambient Air Quality Standards (NAAQS), to protect public health and welfare Set New Source Performance Standards (NSPS), that strictly regulated emissions of a new source
Trends in Hourly Ozone and Ozone Health Metrics across the United States and the European Union
 s in Hourly Ozone and Ozone Health Metrics across the United States and the European Union Heather Simon, Allen Lefohn, Chris Malley, Benjamin Wells, Adam Reff, Xiaobin Xu, Li Zhang, Tao Wang, Bryan Hubbell,
The Impact of the Chesapeake Bay Climate and Boundary Layer Dynamics on Air Pollutant Concentrations during Smog Episodes
 The Impact of the Chesapeake Bay Climate and Boundary Layer Dynamics on Air Pollutant Concentrations during Smog Episodes Presentation by: Dan Goldberg, PhD Candidate Co-authors: Chris Loughner, Maria
Preparation of Fine Particulate Emissions Inventories. Lesson 1 Introduction to Fine Particles (PM 2.5 )
") Preparation of Fine Particulate Emissions Inventories Lesson 1 Introduction to Fine Particles (PM 2.5 ) What will We Discuss in Lesson 1? After this lesson, participants will be able to describe: the general
Preparation of Fine Particulate Emissions Inventories Lesson 1 Introduction to Fine Particles (PM 2.5 ) What will We Discuss in Lesson 1? After this lesson, participants will be able to describe: the general
PM2.5 Designations: Evaluating Contribution of Multiple Pollutants Using the Weighted Emissions Score
 PM2.5 Designations: Evaluating Contribution of Multiple Pollutants Using the Weighted Emissions Score Discussion with STAPPA/ALAPCO May 5, 2004 Timeline for PM2.5 Implementation Program Action Date States/Tribes
OPERATIONAL EVALUATION AND MODEL RESPONSE COMPARISON OF CAMX AND CMAQ FOR OZONE AND PM2.5
 OPERATIONAL EVALUATION AND MODEL RESPONSE COMPARISON OF CAMX AND CMAQ FOR OZONE AND PM2.5 Kirk Baker*, Sharon Phillips, Brian Timin U.S. Environmental Protection Agency, Research Triangle Park, NC 1. INTRODUCTION
Public and Environmental Health Concerns
 Oxidizing Capacity and Urban Air Pollution Joel Thornton Associate Professor 506 ATG thornton@atmos.uw.edu Regional and Global Impacts Background Chemistry and Composition Climate Public and Environmental
VISTAS Highlights. November 10, 2005
 VISTAS Highlights November 10, 2005 Demonstrating Reasonable Progress For each VISTAS Class I area: 1. Identify pollutants contributing to PM2.5 and visibility 2. Identify probable source areas using back
Great Smoky Mountains National Park
 National Park Service U.S. Department of the Interior Great Smoky Mountains National Park Acid Deposition Resource Protection Goal at Great Smoky Mountains National Park EPA Region 4 Grants/Planning Meeting,
Applications of Source Contribution and Emissions Sensitivity Modeling to Assess Transport and Background Ozone Attribution
 Applications of Source Contribution and Emissions Sensitivity Modeling to Assess Transport and Background Ozone Attribution April 2014 Kirk Baker, Norm Possiel, Brian Timin, Pat Dolwick 1 Source Sensitivity
The Air We Breathe. A report on Garfield County air quality monitoring results for
 The Air We Breathe A report on Garfield County air quality monitoring results for 2008-2014 Morgan Hill Environmental Health Specialist Garfield County Public Health mhill@garfield-county.com Cassie Archuleta
The amount of fixed nitrogen (N that has chemically combined with other
 Chapter 1: Introduction The cycle of N is unique in that it consists of a massive, well-mixed, and (to most organisms) wholly unavailable pool of nitrogen gas (N 2 ) in the atmosphere; a relatively small
Evaluating the Cross State Transport of Ozone using CAMx & DISCOVER- AQ Maryland Observations
 Evaluating the Cross State Transport of Ozone using CAMx & DISCOVER- AQ Maryland Observations Presentation by: Dan Goldberg Co-authors: Tim Vinciguerra, Linda Hembeck, Sam Carpenter, Tim Canty, Ross Salawitch
Effect of global change on ozone air quality in the United States. Shiliang Wu
 Effect of 2000-2050 global change on ozone air quality in the United States Shiliang Wu School of Engineering and Applied Sciences Harvard University, Cambridge, MA May 23, 2007 work supported by the EPA-STAR
Comparison of photochemical
 Comparison of photochemical modeling for California by U.S. EPA and the California ARB James T. Kelly and Kirk R. Baker Office of Air Quality Planning & Standards, U.S. Environmental Protection Agency
Chapter 10 National Ambient Air Monitoring Programs
 Chapter 10 National Ambient Air Monitoring Programs Introduction Ambient air monitoring systems are a critical part of the nation's air quality management program infrastructure. Environmental management
Overview of the Human Health and Environmental Effects of Power Generation: Focus on Sulfur Dioxide (SO 2 ), Nitrogen Oxides (NO X ) and Mercury (Hg)
, Nitrogen Oxides (NO X ) and Mercury (Hg)") The information presented here reflects EPA's modeling of the Clear Skies Act of 2002. The Agency is in the process of updating this information to reflect modifications included in the Clear Skies Act
The information presented here reflects EPA's modeling of the Clear Skies Act of 2002. The Agency is in the process of updating this information to reflect modifications included in the Clear Skies Act
Environmental Policies. Bruce Rising Siemens Westinghouse
 Environmental Policies Bruce Rising Siemens Westinghouse 12 Mar 2001 Overview Gas turbine technology will continue to be play a critical role in US energy needs. Air quality improvements have been substantial,
Recommendations for Monitoring and Modeling Research for use in Ozone Planning
 Recommendations for Monitoring and Modeling Research for use in Ozone Planning Gail Tonnesen, EPA Region 8 WESTAR Ozone Background and Transport Workgroup call September 24, 2015 O3 trends at high elevation
Kitimat Airshed Emissions Effects Assessment and CALPUFF Modelling
 Kitimat Airshed Emissions Effects Assessment and CALPUFF Modelling EMA of BC - May 2016 Session - Regional Air Topics Anna Henolson Topics to Cover What is Air Dispersion Modelling? Types of Models CALPUFF
Nova Scotia Air Zone Report. Nova Scotia Air Quality Unit, 2015
 Nova Scotia Air Zone Report Nova Scotia Air Quality Unit, 2015 Acronyms AQHI Air Quality Health Index AQMS Air Quality Management System AQU Nova Scotia Environment s Air Quality Unit CAAQS Canadian Ambient
Background Ozone in Surface Air over the United States: Variability, Climate Linkages, and Policy Implications
 Background Ozone in Surface Air over the United States: Variability, Climate Linkages, and Policy Implications Arlene M. Fiore Department of Environmental Sciences Seminar Rutgers University March 4, 2005
PM2.5 Implementation Rule- Modeling Summary. Brian Timin EPA/OAQPS June 20, 2007
 PM2.5 Implementation Rule- Modeling Summary Brian Timin EPA/OAQPS Timin.brian@epa.gov June 20, 2007 Attainment Demonstrations CAA Section 172(c) requires States with a nonattainment area to submit an attainment
Acid Deposition. Brief History Acids and Bases Chemical Processes and Sources Deposition Processes Acid Deposition Distribution Environmental Effects
 Acid Deposition 1 Acid Deposition Brief History Acids and Bases Chemical Processes and Sources Deposition Processes Acid Deposition Distribution Environmental Effects Health Effects Lakes and Forests Abatement
Acid Deposition. Acid Deposition. Early History of Acid Deposition
 Acid Deposition 1 Acid Deposition Brief History Acids and Bases Chemical Processes and Sources Deposition Processes Acid Deposition Distribution Environmental Effects Health Effects Lakes and Forests Abatement
Air Quality Management (AQM) Clean Air Act (History, Objectives, NAAQS) Non-attainment regions
 Clean Air Act (History, Objectives, NAAQS) Non-attainment regions") Air Quality Management (AQM) Clean Air Act (History, Objectives, NAAQS) Non-attainment regions National Ambient Air Quality Standards (NAAQS) The Clean Air Act, which was last amended in 1990, requires
Air Quality Management (AQM) Clean Air Act (History, Objectives, NAAQS) Non-attainment regions National Ambient Air Quality Standards (NAAQS) The Clean Air Act, which was last amended in 1990, requires
The Effects of Hog Waste on the Environment
 The Effects of Hog Waste on the Environment Viney P. Aneja and William Battye Air Quality Research Group Department of Marine, Earth, and Atmospheric Sciences North Carolina State University Raleigh, NC
Presentation by: Dan Goldberg, Ph.D. Candidate
 Evidence Evidence for an for increasing an increase geographic in the photochemical region of influence lifetime on of ozone air in pollution the in eastern the eastern United United States States Presentation
Atmospheric chemistry Ground-level ozone Photochemical smog
 Atmospheric chemistry Ground-level ozone Photochemical smog Eri Swietlici Avd. för Kärnfysi Fysisa institutionen Lunds universitet Ground-level ozone 1 Damage cost of air pollution in Europe (2010) and
Nitrogen Deposition at Rocky Mountain National Park: the RoMANS Study
 Nitrogen Deposition at Rocky Mountain National Park: the RoMANS Study Mike Barna Bill Malm Bret Schichtel Kristi Gebhart Air Resources Division National Park Service National Park Service U.S. Department
PAMS and Enhanced Monitoring Plans- Ambient Air Monitoring in Northeast
 PAMS and Enhanced Monitoring Plans- Ambient Air Monitoring in Northeast Robert Judge Air Monitoring Coordinator EPA- Region 1 HAQAST3- Columbia University November 28, 2017 1 Overview 2015 Final Ozone
Designing a Network Assessment for an Ambient Air Monitoring Program
 This document is intended to help facilitate compiling an assessment of an agency s air quality surveillance system by State and where delegated, local air monitoring programs. The requirement to submit
Nitrogen and Sulfur Deposition Modeling for ROMANS with CAMx
 Nitrogen and Sulfur Deposition Modeling for ROMANS with CAMx Mike Barna 1, Marco Rodriguez 2, Kristi Gebhart 1, John Vimont 1, Bret Schichtel 1 and Bill Malm 1 1 National Park Service - Air Resources Division
Lecture 4 Air Pollution: Particulates METR113/ENVS113 SPRING 2011 MARCH 15, 2011
 Lecture 4 Air Pollution: Particulates METR113/ENVS113 SPRING 2011 MARCH 15, 2011 Reading (Books on Course Reserve) Jacobson, Chapter 5, Chapter 8.1.9 Turco, Chapter 6.5, Chapter 9.4 Web links in following
Final Ozone NAAQS - PAMS and Enhanced Monitoring Plans- Ambient Air Monitoring in NESCAUM
 Final Ozone NAAQS - PAMS and Enhanced Monitoring Plans- Ambient Air Monitoring in NESCAUM Robert Judge Air Monitoring Coordinator EPA- Region 1 Providence, RI December 7, 2016 1 Overview 2015 Final Ozone
Deposition of Reduced Nitrogen (NH x ) in California and Other Western Regions: Prevalence and Ecological Importance
 in California and Other Western Regions: Prevalence and Ecological Importance") Deposition of Reduced Nitrogen (NH x ) in California and Other Western Regions: Prevalence and Ecological Importance M.E. Fenn 1, A. Bytnerowicz 1 and S.B. Weiss 2 1 USDA Forest Service, Forest Fire Laboratory,
Deposition of Reduced Nitrogen (NH x ) in California and Other Western Regions: Prevalence and Ecological Importance M.E. Fenn 1, A. Bytnerowicz 1 and S.B. Weiss 2 1 USDA Forest Service, Forest Fire Laboratory,
Air pollution and atmospheric deposition trends in remote areas of North America
 Air pollution and atmospheric deposition trends in remote areas of North America Andrzej Bytnerowicz USDA Forest Service PSW Research Station Riverside, CA, USA Ozone Criteria pollutant Toxic to humans
AIR QUALITY MONITORING
 AIR QUALITY MONITORING in Protected Areas & Wilderness CSS 496 AIR QUALITY MONITORING Adapted from NPS UCBN Vital Signs Workshop March 9-10, 2004 presentation by: Elizabeth Waddell Air Resources Specialist
PM2.5 NAAQS Implementation & Permitting in Georgia
 PM2.5 NAAQS Implementation & Permitting in Georgia Georgia Environmental Conference Jekyll Island, Georgia August 25, 2016 Brad James, P.E. Overview Current UFP Regulation (as PM 2.5 ) PM 2.5 NAAQS SIP
2011 Acid Deposition Summary
 2011 Acid Deposition Summary New Jersey Department of Environmental Protection NATURE AND SOURCES Atmospheric deposition is a process in which pollutants are deposited on land or water from the air. Deposition
Clean Air Interstate Rule (CAIR)
") Clean Air Interstate Rule (CAIR) Reducing Power Plant Emissions for Cleaner Air, Healthier People, and a Strong America Office of Air and Radiation March 2005 Benefits of the Clean Air Interstate Rule
Clean Air Interstate Rule (CAIR) Reducing Power Plant Emissions for Cleaner Air, Healthier People, and a Strong America Office of Air and Radiation March 2005 Benefits of the Clean Air Interstate Rule
A Comparative Air Quality Modelling Analysis of Options for Management of Waste After Recycling. GVS&DD Board June 12, 2009
 A Comparative Air Quality Modelling Analysis of Options for Management of Waste After Recycling GVS&DD Board June 12, 2009 Air Quality in Metro Vancouver and the FVRD Air quality in the Lower Fraser Valley
Significant Impact Levels (SILs) Guidance: Technical Basis. R. Chris Owen, EPA-OAQPS Tuesday, Nov. 15, 2016
 Guidance: Technical Basis. R. Chris Owen, EPA-OAQPS Tuesday, Nov. 15, 2016") Significant Impact Levels (SILs) Guidance: Technical Basis R. Chris Owen, EPA-OAQPS Tuesday, Nov. 15, 2016 Basis for SILs technical analysis EPA position: insignificant impact = change in air quality that
Significant Impact Levels (SILs) Guidance: Technical Basis R. Chris Owen, EPA-OAQPS Tuesday, Nov. 15, 2016 Basis for SILs technical analysis EPA position: insignificant impact = change in air quality that
Overview of Critical Loads Efforts in the U.S.
 Overview of Critical Loads Efforts in the U.S. NADP Fall 2007 Technical Symposium Richard Haeuber, Ph.D. Office of Air and Radiation, EPA September 12, 2007 Overview CL Refresher What are critical loads?
Linking Ecosystem Indicators to Ecosystem Services
 Linking Ecosystem Indicators to Ecosystem Services Christine Davis* G. Van Houtven, C. Mansfield, M. Cutrofello, and M. O Neil *Health and Environmental Impacts Division, OAQPS U.S. Environmental Protection
Policies for Addressing PM2.5 Precursor Emissions. Rich Damberg EPA Office of Air Quality Planning and Standards June 20, 2007
 Policies for Addressing PM2.5 Precursor Emissions Rich Damberg EPA Office of Air Quality Planning and Standards June 20, 2007 1 Overview Sources of direct PM2.5 and SO2 must be evaluated for control measures
Tiger Team project: Processes contributing to model differences in North American background ozone estimates
 Tiger Team project: Processes contributing to model differences in North American background ozone estimates AQAST PIs: Arlene Fiore (Columbia/LDEO) and Daniel Jacob (Harvard) Co-I: Meiyun Lin (Princeton/GFDL)
ROcky Mountain Atmospheric Nitrogen and Sulfur study (ROMANS)
") ROcky Mountain Atmospheric Nitrogen and Sulfur study (ROMANS) STATEMENT OF THE PROBLEM Rocky Mountain National Park (ROMO) is experiencing a number of deleterious effects due to atmospheric nitrogen and
ROcky Mountain Atmospheric Nitrogen and Sulfur study (ROMANS) STATEMENT OF THE PROBLEM Rocky Mountain National Park (ROMO) is experiencing a number of deleterious effects due to atmospheric nitrogen and
Report to the Canadian Council of Ministers of the Environment: An Update in Support of the Canada-wide Standards for Particulate Matter and Ozone
 Report to the Canadian Council of Ministers of the Environment: An Update in Support of the Canada-wide Standards for Particulate Matter and Ozone Prepared by the Joint Action Implementation Coordinating
1. Lab report from each person, not 1 per group. 2. Progress on Lab 5, particle composition? Lab 5 due April Lab 6 due April 20.
 1. Lab report from each person, not 1 per group. 2. Progress on Lab 5, particle composition? Lab 5 due April 13. 3. Lab 6 due April 20. LAB 6: Ozone/NOx Source of Ozone Volatile Organic Compounds (VOCs)
Appendix: Materials and methods
 Appendix: Materials and methods Atmospheric dispersion modeling for the case studies was carried out using version 7 (June 2015) of the CALPUFF modeling system. CALPUFF is an advanced non-steady-state
Towards Cleaner Air. Scientific Assessment Report 2016: North America
 Towards Cleaner Air Scientific Assessment Report 2016: North America Scientific Assessment Report 2016: North America North America has benefited greatly from the U.S. and Canadian participation in the
 Atmospheric Nitrogen Deposition: An increasingly Important Source of new Nitrogen Supporting Coastal Eutrophication H Paerl 1, D. Whitall 2 and R. Dennis 3 1 UNC-CH CH Institute of Marine Sciences, Morehead
2012 Nitrogen Dioxide Summary
 2012 Nitrogen Dioxide Summary New Jersey Department of Environmental Protection NATURE AND SOURCES Nitrogen Dioxide (NO 2 ) is a reddishbrown, highly reactive gas that is formed in the air through the
An Update on EPA Attainment Modeling Guidance for Ozone/PM2.5/Regional Haze
 An Update on EPA Attainment Modeling Guidance for Ozone/PM2.5/Regional Haze Brian Timin, Pat Dolwick, Norm Possiel, Sharon Phillips and Marc Houyoux EPA/OAQPS 4 th Annual CMAS Model-3 User s Conference
NATURAL AND TRANSBOUNDARY INFLUENCES ON PARTICULATE MATTER IN THE UNITED STATES: IMPLICATIONS FOR THE EPA REGIONAL HAZE RULE. Rokjin J.
 NATURAL AND TRANSBOUNDARY INFLUENCES ON PARTICULATE MATTER IN THE UNITED STATES: IMPLICATIONS FOR THE EPA REGIONAL HAZE RULE Rokjin J. Park ACCESS VII, September 5, 2003 EPA REGIONAL HAZE RULE Federal
Nitrogen Deposition Reduction Plan for Rocky Mountain National Park. Presentation to the Fall 2007 NADP Technical Meeting and Scientific Symposium
 Nitrogen Deposition Reduction Plan for Rocky Mountain National Park Presentation to the Fall 2007 NADP Technical Meeting and Scientific Symposium September 12, 2007 Air Quality Issues at Rocky For Rocky
Chemical mechanisms and kinetics in atmospheric chemistry Lecture 8: Global budgets and emissions inventories
 Chemical mechanisms and kinetics in atmospheric chemistry Lecture 8: Global budgets and emissions inventories Mike Pilling University of Leeds UK Synopsis Global budgets for CH 4, CO, NO x, VOCs (tomorrow
pk g = 1.41 pk 1 = 6.35 pk 2 = ph of pure water? ph of rain
 Acid Rain Acid deposition consists of delivery of acid substances or precursors, principally sulfur and nitrogen oxides, acids, and salts, from the atmosphere to the earth surface (Schwartz 1989) Wet deposition-
Fraser Valley Regional District Highlights of Air Quality and Emissions Trends ( )
") Fraser Valley Regional District Highlights of Air Quality and Emissions Trends (199-213) May 215 Table of Contents List of Figures... 2 Purpose... 3 Summary... 3 Background... 3 Criteria Air Contaminants...
Fraser Valley Regional District Highlights of Air Quality and Emissions Trends (199-213) May 215 Table of Contents List of Figures... 2 Purpose... 3 Summary... 3 Background... 3 Criteria Air Contaminants...
Final Revisions to the Primary National Ambient Air Quality Standard for Nitrogen Dioxide (NO 2 )
") Final Revisions to the Primary National Ambient Air Quality Standard for Nitrogen Dioxide (NO 2 ) General Overview Office of Air and Radiation Office of Air Quality Planning and Standards January 2010
Final Revisions to the Primary National Ambient Air Quality Standard for Nitrogen Dioxide (NO 2 ) General Overview Office of Air and Radiation Office of Air Quality Planning and Standards January 2010
What are Dr. Seuss s favorite air pollutants?
 What are Dr. Seuss s favorite air pollutants? 1 NO x and SO x 2011 The Williams Companies, Inc. All rights reserved. GPA Presentation 1 NO x and Ambient Air Chemistry as it relates to the New NO 2 1-Hour
Dense networks and geostationary satellites: A vision for the future of NO x and air quality observations
 Dense networks and geostationary satellites: A vision for the future of NO x and air quality observations Ronald C. Cohen UC Berkeley $ BAAQMD, NSF, NASA, UC Berkeley, HEI, Koret Foundation A different
Nested Global/Regional Modeling of Background Ozone Over the US
 Nested Global/Regional Modeling of Background Ozone Over the US Chris Emery ENVIRON International Corporation, Novato, CA WESTAR Western Ozone Transport Conference October 10-12, 2012 Template Introduction