Northside ISD 5900 Evers Road San Antonio, Texas 78238
|
|
|
- Emma Foster
- 6 years ago
- Views:
Transcription

 328 2533 TBPE# F 352 JUNE 212 M. Saleem Khan, P.E. Texas Registration #98125")
1 Northside ISD 59 Evers Road San Antonio, Texas Prepared by: Texas Energy Engineering Services, Inc. 131 S. Capital of Texas Highway Capital View Center Suite B 325 Austin, Texas (512) TBPE# F 352 JUNE 212 M. Saleem Khan, P.E. Texas Registration #98125
2 PRELIMINARY ENERGY ASSESSMENT REPORT JUNE 212 NORTHSIDE ISD TABLE OF CONTENTS CONTENTS Page No. TABLE OF CONTENTS... i 1. EXECUTIVE SUMMARY FACILITY DESCRIPTIONS ENERGY CONSUMPTION AND PERFORMANCE ENERGY STAR PORTFOLIO MANAGER ENERGY ACCOUNTING ELECTRICAL DEMAND ANALYSIS ENERGY LEGISLATION OVERVIEW DATA LOGGERS FOR INDOOR CONDITIONS SAMPLE SCREENSHOTS OF ENERGY MANAGEMENT SYSTEM (EMS) RECOMMENDED MAINTENANCE & OPERATION PROCEDURES UTILITY COST REDUCTION MEASURES FACILITY IMPROVEMENT MEASURES ENERGY MANAGEMENT POLICY FUNDING OPTIONS FOR UTILITY REDUCTION MEASURES... 5 APPENDICES APPENDIX A, ENERGY LEGISLATION (SB12, HB3693, AND SB3)... Page A-1 APPENDIX B, SAMPLE UTILITY DATA REPORTING FORM... Page B-1 APPENDIX C, BASE YEAR CONSUMPTION HISTORY... Page C-1 APPENDIX D, ENERGY PERFORMANCE COMPARISON CHARTS... Page D-1 APPENDIX E, TYPICAL EQUIPMENT MAINTENANCE CHECKLISTS... Page E-1 APPENDIX F, LOANSTAR INFORMATION... Page F-1 APPENDIX G, BUILDING COMMISSIONING INFORMATION... Page G-1 APPENDIX H, ENERGY STAR REFERENCE MATERIAL... Page H-1 APPENDIX I, REQUEST FOR ENERGY ASSISTANCE... Page I-1 SCHOOLS/LOCAL GOVERNMENT ENERGY MANAGEMENT PROGRAM PAGE i
3 PRELIMINARY ENERGY ASSESSMENT REPORT JUNE 212 NORTHSIDE ISD SECO - Schools & Local Government Energy Management Program Northside ISD 59 Evers Road San Antonio, TX Contact Person: Allen Goldapp, District Energy Management Coordinator Phone: EXECUTIVE SUMMARY Northside Independent School District, now referred to as the District, requested that Texas Energy Engineering Services, Inc. (TEESI) perform a Preliminary Energy Assessment (PEA) of their facilities. This report documents that analysis. This service is provided at no cost to the District through the Schools Energy Management and Technical Assistance Program as administered by the Texas Comptroller of Public Accounts, State Energy Conservation Office (SECO). This program promotes and encourages an active partnership between SECO and Texas schools for the purpose of planning, funding, and implementing energy saving measures, which will ultimately reduce the District s annual energy costs. The annual cost savings, implementation cost estimate and simple payback for all Utility Cost Reduction Measures (UCRM s) identified in this preliminary analysis are summarized below. Individual UCRM s are summarized in Section 11. of this report. Est. Implementation Cost Estimate: $4,77,9 Est. Annual Energy Saving (MMBTU/Yr): 27,624 Est. Annual Greenhouse Gas Emissions Reduction (Metric Tons CO 2 e/yr): 4,47 Est. Annual Energy Cost Savings: $584,9 Simple Payback (Yrs): 8. This report includes a summary of the facilities surveyed along with energy consumption and costs, opportunities for energy savings, and information regarding energy management and options for funding retrofit projects. A follow-up visit to the District will be scheduled to address any questions pertaining to this report, or any other aspect of this program. SECO is committed to providing whatever assistance the District may require in planning, funding and implementing the recommendations of this report. The District is encouraged to direct any questions or concerns to either of the following contact persons: SECO / Mr. Stephen Ross TEESI / Saleem Khan (512) (512) SCHOOLS/LOCAL GOVERNMENT ENERGY MANAGEMENT PROGRAM PAGE 1
4 PRELIMINARY ENERGY ASSESSMENT REPORT JUNE 212 NORTHSIDE ISD 2. FACILITY DESCRIPTIONS This section provides a brief description of the facilities surveyed. The purpose of the onsite survey was to evaluate the major energy consuming equipment in each facility (i.e. Lighting, HVAC, and Controls Equipment). A description of each facility is provided below. Buildings: Stories: Area (estimated): Bldg. Components: Typical Lighting Fixtures: HVAC: Controls: Buildings: Stories: Area (estimated): Bldg. Components: Typical Lighting Fixtures: HVAC: Controls: Buildings: Stories: Area (estimated): Bldg. Components: Typical Lighting Fixtures: HVAC: Controls: Adams Hill Elementary School Single story 57,155 SF Brick building, built up roof, slab on grade T8 fluorescent fixtures with electronic ballasts High Intensity Discharge (HID) fixtures in gym Air-cooled chilled water system and hot water boiler heating system, packaged rooftop units Typical classroom: Fan powered box with hot water heating coil Energy Management System (EMS) Manufacturer ALC Beard Elementary School Two story 96,98 SF Brick building, built up roof, slab on grade T8 fluorescent fixtures with electronic ballasts High Intensity Discharge (HID) fixtures in gym Air-cooled chilled water system and hot water boiler heating system, packaged rooftop units Typical classroom: Fan powered box with hot water heating coil Energy Management System (EMS) Manufacturer Alerton Cable Elementary School Single story 79,657 SF Brick building, built up roof, slab on grade T8 fluorescent fixtures with electronic ballasts Air-cooled chilled water system and hot water boiler heating system, packaged rooftop units Typical classroom: Single zone chilled water air handling unit Energy Management System (EMS) Manufacturer Alerton SCHOOLS/LOCAL GOVERNMENT ENERGY MANAGEMENT PROGRAM PAGE 2
5 PRELIMINARY ENERGY ASSESSMENT REPORT JUNE 212 NORTHSIDE ISD Buildings: Stories: Area (estimated): Bldg. Components: Typical Lighting Fixtures: HVAC: Controls: Buildings: Stories: Area (estimated): Bldg. Components: Typical Lighting Fixtures: HVAC: Controls: Buildings: Stories: Area (estimated): Bldg. Components: Typical Lighting Fixtures: HVAC: Controls: Buildings: Stories: Area (estimated): Bldg. Components: Typical Lighting Fixtures: HVAC: Controls: Clark High School Two story 382,747 SF Brick building, built up roof, slab on grade T8 fluorescent fixtures with electronic ballasts High Intensity Discharge (HID) fixtures in gym Air-cooled chilled water system and hot water boiler heating system, packaged rooftop units Typical classroom: Single zone chilled water air handling unit with hot water reheat Energy Management System (EMS) Manufacturer ALC Cody Elementary School Single story 85,368 SF Brick building, built up roof, slab on grade T8 fluorescent fixtures with electronic ballasts T12 fluorescent fixtures with magnetic ballasts in gym Air-cooled chilled water system and hot water boiler heating system, packaged rooftop units Typical classroom: Served by multi zone chilled water air handling unit with cold deck/hot deck Energy Management System (EMS) Manufacturer ALC Colonies North Elementary School Single story 78,822 SF Brick building, built up roof, slab on grade T8 fluorescent fixtures with electronic ballasts High Intensity Discharge (HID) fixtures in gym Air-cooled chilled water system and hot water boiler heating system, packaged rooftop units Typical classroom: Single zone chilled water air handling unit with hot water heating coil Energy Management System (EMS) Manufacturer ALC Driggers Elementary School Single story 91,511 SF Brick building, built up roof, slab on grade T8 fluorescent fixtures with electronic ballasts High Intensity Discharge (HID) fixtures in gym Air-cooled chilled water system and hot water boiler heating system, packaged rooftop units Typical classroom: Fan powered box with hot water heating coil Energy Management System (EMS) Manufacturer ALC SCHOOLS/LOCAL GOVERNMENT ENERGY MANAGEMENT PROGRAM PAGE 3
6 PRELIMINARY ENERGY ASSESSMENT REPORT JUNE 212 NORTHSIDE ISD Buildings: Stories: Area (estimated): Bldg. Components: Typical Lighting Fixtures: HVAC: Controls: Buildings: Stories: Area (estimated): Bldg. Components: Typical Lighting Fixtures: HVAC: Controls: Buildings: Stories: Area (estimated): Bldg. Components: Typical Lighting Fixtures: HVAC: Controls: Buildings: Stories: Area (estimated): Bldg. Components: Typical Lighting Fixtures: HVAC: Controls: Fisher Elementary School Single story 15,292 SF Brick building, pitched metal roof, slab on grade T8 fluorescent fixtures with electronic ballasts High Intensity Discharge (HID) fixtures in gym Air-cooled chilled water system and hot water boiler heating system, packaged rooftop units Typical classroom: Fan powered box with hot water heating coil Energy Management System (EMS) Manufacturer Alerton Garcia Middle School Single story 192,725 SF Brick building, built up roof, slab on grade T8 fluorescent fixtures with electronic ballasts High Intensity Discharge (HID) fixtures in gym Air-cooled chilled water system and hot water boiler heating system, packaged rooftop units Typical classroom: Single zone chilled water air handling unit with hot water heating coil Energy Management System (EMS) Manufacturer Alerton Health Careers/Holmgreen High School Two story 168,896 SF Brick building, built up roof, slab on grade T8 fluorescent fixtures with electronic ballasts Water-cooled chilled water system and hot water boiler heating system, packaged rooftop units Typical classroom: Fan powered box with hot water heating coil Energy Management System (EMS) Manufacturer ALC Hull Elementary School Single story 75,75 SF Brick building, built up roof, slab on grade T8 fluorescent fixtures with electronic ballasts High Intensity Discharge (HID) fixtures in gym Air-cooled chilled water system and hot water boiler heating system, packaged rooftop units Typical classroom: Fan powered box with hot water heating coil Energy Management System (EMS) Manufacturer ALC SCHOOLS/LOCAL GOVERNMENT ENERGY MANAGEMENT PROGRAM PAGE 4
7 PRELIMINARY ENERGY ASSESSMENT REPORT JUNE 212 NORTHSIDE ISD Buildings: Stories: Area (estimated): Bldg. Components: Typical Lighting Fixtures: HVAC: Controls: Buildings: Stories: Area (estimated): Bldg. Components: Typical Lighting Fixtures: HVAC: Controls: Buildings: Stories: Area (estimated): Bldg. Components: Typical Lighting Fixtures: HVAC: Controls: Buildings: Stories: Area (estimated): Bldg. Components: Typical Lighting Fixtures: HVAC: Controls: Jay High School Two story 366,8 SF Brick building, built up roof, slab on grade T8 fluorescent fixtures with electronic ballasts High Intensity Discharge (HID) fixtures in gym Air-cooled and water-cooled chilled water systems and hot water boiler heating system, packaged rooftop units Typical classroom: Fan powered box with hot water heating coil Energy Management System (EMS) Manufacturer ALC Jefferson Middle School Two story 196,27 SF Brick building, built up roof, slab on grade T8 fluorescent fixtures with electronic ballasts High Intensity Discharge (HID) fixtures in gym Air-cooled chilled water system and hot water boiler heating system, packaged rooftop units Typical classroom: Fan powered box with hot water heating coil Energy Management System (EMS) Manufacturer Alerton Jones Middle School Single story 159,759 SF Brick building, built up roof, slab on grade T8 fluorescent fixtures with electronic ballasts High Intensity Discharge (HID) fixtures in gym Air-cooled chilled water system and hot water boiler heating system, packaged rooftop units Typical classroom: Fan powered box with hot water heating coil Energy Management System (EMS) Manufacturer Alerton O'Connor High School Two story 369,949 SF Brick building, built up roof, slab on grade T8 fluorescent fixtures with electronic ballasts T5 fluorescent fixtures with electronic ballasts in gym Air-cooled chilled water system and hot water boiler heating system, packaged rooftop units Typical classroom: Fan powered box with hot water heating coil Energy Management System (EMS) Manufacturer ALC SCHOOLS/LOCAL GOVERNMENT ENERGY MANAGEMENT PROGRAM PAGE 5
8 PRELIMINARY ENERGY ASSESSMENT REPORT JUNE 212 NORTHSIDE ISD Buildings: Stories: Area (estimated): Bldg. Components: Typical Lighting Fixtures: HVAC: Controls: Buildings: Stories: Area (estimated): Bldg. Components: Typical Lighting Fixtures: HVAC: Controls: Buildings: Stories: Area (estimated): Bldg. Components: Typical Lighting Fixtures: HVAC: Controls: Buildings: Stories: Area (estimated): Bldg. Components: Typical Lighting Fixtures: HVAC: Controls: Pease Middle School Single story 144,235 SF Brick building, built up roof, slab on grade T8 fluorescent fixtures with electronic ballasts High Intensity Discharge (HID) fixtures in gym Air-cooled and water-cooled chilled water system and hot water boiler heating system, packaged rooftop units Typical classroom: Fan powered box with hot water heating coil Energy Management System (EMS) Manufacturer ALC Ross Middle School Single story 146,521 SF Brick building, built up roof, slab on grade T8 fluorescent fixtures with electronic ballasts High Intensity Discharge (HID) fixtures in gym Air-cooled and water-cooled chilled water system and hot water boiler heating system, packaged rooftop units Typical classroom: Fan powered box with hot water heating coil Energy Management System (EMS) Manufacturer ALC Timberwilde Elementary School Single story 81,482 SF Brick building, built up roof, slab on grade T8 fluorescent fixtures with electronic ballasts T12 fluorescent fixtures with magnetic ballasts in gym Air-cooled chilled water system and hot water boiler heating system, packaged rooftop units Typical classroom: Fan powered box with hot water heating coil Energy Management System (EMS) Manufacturer ALC Valley Hi Elementary School Single story 55,971 SF Brick building, built up roof, slab on grade T8 fluorescent fixtures with electronic ballasts High Intensity Discharge (HID) fixtures in gym Air-cooled chilled water system and hot water boiler heating system, packaged rooftop units Typical classroom: Fan coil unit with hot and chilled water coils Energy Management System (EMS) Manufacturer ALC SCHOOLS/LOCAL GOVERNMENT ENERGY MANAGEMENT PROGRAM PAGE 6
9 PRELIMINARY ENERGY ASSESSMENT REPORT JUNE 212 NORTHSIDE ISD Buildings: Stories: Area (estimated): Bldg. Components: Typical Lighting Fixtures: HVAC: Controls: Warren High School Two story 396,325 SF Brick building, built up roof, slab on grade T8 fluorescent fixtures with electronic ballasts High Intensity Discharge (HID) fixtures in gym Air-cooled chilled water system and hot water boiler heating system, packaged rooftop units Typical classroom: Fan powered box with hot water heating coil Energy Management System (EMS) Manufacturer Alerton SCHOOLS/LOCAL GOVERNMENT ENERGY MANAGEMENT PROGRAM PAGE 7
10 PRELIMINARY ENERGY ASSESSMENT REPORT JUNE 212 NORTHSIDE ISD 3. ENERGY CONSUMPTION AND PERFORMANCE A site survey was conducted at several of the District s facilities. The facilities surveyed comprised a total gross area of approximately 3,331,91 square feet. Annual electric and natural gas invoices for the buildings surveyed were $3,727,241 for the 12- month period ending ober 211. A summary of annual utility costs is provided in Appendix C, Base Year Consumption History. To help the District evaluate the overall energy performance of its facilities TEESI has calculated their Energy Utilization Index (EUI) and Energy Cost Index (ECI). The EUI represents a facility s annual energy usage per square foot; it is measured in thousands of BTUs per square foot per year (kbtu/sf/year). Similarly, ECI is measured as cost per square foot per year ($/SF/Year). The EUI and ECI for selected facilities are listed below: Energy Cost and Consumption Benchmarks Electric Natural Gas Total Total EUI ECI Building kwh/yr MMBTU/Yr kwh/sf $Cost/Yr MCF/Yr MMBTU/Yr MCF/kSF $Cost/Yr $Cost/Yr MMBTU/Yr kbtu/sf/yr $/SF/Yr SF 1 Colonies North Elementary 1,155,72 3, ,99 2,313 2, , ,44 6, ,822 2 Cable Elementary 991,8 3, ,135 1,825 1, ,23 93,338 5, ,657 3 Valley Hi Elementary 75,48 2, ,388 1,54 1, ,497 64,885 3, ,972 4 Hull Elementary 1,11,8 3, ,317 1,196 1, ,396 99,713 5, ,75 5 Cody Elementary 1,154,34 3, ,315 1,36 1, ,62 98,918 5, ,368 6 Timberwilde Elementary 1,87,296 3, ,764 1,16 1, ,793 17,557 4, ,482 7 Beard Elementary 1,338,912 4, ,45 1,475 1, ,325 16,775 6, ,98 8 Fisher Elementary 1,475,2 5, ,659 1,698 1, ,885 13,543 6, ,292 9 Driggers Elementary 1,228,5 4, ,787 1,591 1, ,251 11,38 5, ,511 1 Adams Hill Elementary 836,48 2, , ,743 71,89 3, , Ross Middle School 1,81,944 6, ,88 2,383 2, , ,475 8, , Garcia Middle School 2,289,6 7, ,144 3,491 3, ,47 215,614 11, , Jefferson Middle School 2,214,72 7, ,316 4,788 4, ,74 218,39 12, ,27 14 Jones Middle School 2,2,32 6, ,268 2,55 2, , ,914 9, , Pease Middle School 1,572, 5, ,976 2,491 2, , ,138 7, , O'Connor HS 5,192,996 17, ,86 5,27 5, , ,645 23, , Jay HS 4,615,84 15, ,458 5,838 6, ,78 377,166 21, ,8 18 Warren HS 5,284,168 18, ,76 5,593 5, , ,68 23, , Clark HS 3,793,32 12, ,326 7,835 8, ,116 36,442 21, ,747 2 Health Careers/Holmgreen HS 2,45,52 6, ,387 2,343 2, ,3 165,687 9, ,896 kwh/yr MMBTU/Yr kwh/sf $Cost/Yr MCF/Yr MMBTU/Yr MCF/kSF $Cost/Yr $Cost/Yr MMBTU/Yr kbtu/sf/yr $/SF/Yr SF 41,94,75 143, ,326,752 7,747 58, ,489 3,727,241 21, ,331,91 The EUI and ECI of each facility help the District evaluate its overall energy performance. In addition, the District s EUI s were compared to TEESI s database of Texas schools. Appendix D shows how the EUIs of these facilities compare to those of other schools in Texas. SCHOOLS/LOCAL GOVERNMENT ENERGY MANAGEMENT PROGRAM PAGE 8
11 PRELIMINARY ENERGY ASSESSMENT REPORT JUNE 212 NORTHSIDE ISD The following charts summarize the data presented in the previous table. See Appendix C for further detail. Colonies North Elementary Cable Elementary Valley Hi Elementary Hull Elementary Cody Elementary Timberwilde Elementary Beard Elementary Fisher Elementary Driggers Elementary Adams Hill Elementary Ross Middle School Garcia Middle School Jefferson Middle School Jones Middle School Pease Middle School O'Connor HS Jay HS Warren HS Clark HS Health Careers/Holmgreen HS Facility Energy Performance EUI (kbtu/sf/yr) EUI (kbtu/sf/yr) Electric Gas 8 Facility Cost Performance ECI ($/SF/Yr) Electric Gas Colonies North Elementary Cable Elementary Valley Hi Elementary Hull Elementary Cody Elementary Timberwilde Elementary Beard Elementary Fisher Elementary Driggers Elementary Adams Hill Elementary Ross Middle School Garcia Middle School Jefferson Middle School Jones Middle School Pease Middle School O'Connor HS Jay HS Warren HS Clark HS Health Careers/Holmgreen HS ECI ($/SF/Yr) SCHOOLS/LOCAL GOVERNMENT ENERGY MANAGEMENT PROGRAM PAGE 9
12 PRELIMINARY ENERGY ASSESSMENT REPORT JUNE 212 NORTHSIDE ISD Colonies North Elementary Cable Elementary Valley Hi Elementary Hull Elementary Cody Elementary Timberwilde Elementary Beard Elementary Fisher Elementary Driggers Elementary Adams Hill Elementary Ross Middle School Garcia Middle School Jefferson Middle School Jones Middle School Pease Middle School O'Connor HS Jay HS Warren HS Clark HS Health Careers/Holmgreen HS Facility Annual Electricity Usage (kwh/yr) 1,155,72 991,8 75,48 1,11,8 1,154,34 1,87,296 1,338,912 1,475,2 1,228,5 836,48 1,81,944 2,289,6 2,214,72 2,2,32 1,572, 2,45,52 5,192,996 4,615,84 3,793,32 5,284,168 2,, 4,, 6,, Annual Electric Usage (kwh/yr) Colonies North Elementary Cable Elementary Valley Hi Elementary Hull Elementary Cody Elementary Timberwilde Elementary Beard Elementary Fisher Elementary Driggers Elementary Adams Hill Elementary Ross Middle School Garcia Middle School Jefferson Middle School Jones Middle School Pease Middle School O'Connor HS Jay HS Warren HS Clark HS Health Careers/Holmgreen HS Facility Annual Electricity Costs ($Cost/Yr) $95,99 $8,135 $57,388 $91,317 $89,315 $99,764 $97,45 $118,659 $98,787 $67,148 $142,88 $189,144 $181,316 $156,268 $128,976 $149,387 $413,86 $337,458 $39,326 $423,76 1, 2, 3, 4, Annual Electric Cost ($Cost/Yr) SCHOOLS/LOCAL GOVERNMENT ENERGY MANAGEMENT PROGRAM PAGE 1
13 PRELIMINARY ENERGY ASSESSMENT REPORT JUNE 212 NORTHSIDE ISD Cable Elementary Valley Hi Elementary Hull Elementary Cody Elementary Timberwilde Elementary Beard Elementary Fisher Elementary Driggers Elementary Adams Hill Elementary Ross Middle School Garcia Middle School Jefferson Middle School Jones Middle School Pease Middle School O'Connor HS Jay HS Warren HS Clark HS Health Careers/Holmgreen HS Facility Annual Gas Usage (MCF/Yr) 1,825 1,54 1,196 1,36 1,16 1, ,591 1,698 2,383 3,491 4,788 2,55 2,491 2,343 5,27 5,838 5,593 7,835 2, 4, 6, 8, 1, Annual Gas Usage (MCF/Yr) Colonies North Elementary Cable Elementary Valley Hi Elementary Hull Elementary Cody Elementary Timberwilde Elementary Beard Elementary Fisher Elementary Driggers Elementary Adams Hill Elementary Ross Middle School Garcia Middle School Jefferson Middle School Jones Middle School Pease Middle School O'Connor HS Jay HS Warren HS Clark HS Health Careers/Holmgreen HS Facility Annual Gas Costs ($Cost/Yr) $15,946 $13,23 $7,497 $8,396 $9,62 $7,793 $9,325 $11,885 $11,251 $4,743 $16,595 $26,47 $37,74 $17,646 $17,162 $16,3 $4,785 $39,78 $37,992 $51,116 1, 2, 3, 4, 5, 6, Annual Gas Cost ($Cost/Yr) SCHOOLS/LOCAL GOVERNMENT ENERGY MANAGEMENT PROGRAM PAGE 11
14 PRELIMINARY ENERGY ASSESSMENT REPORT JUNE 212 NORTHSIDE ISD Colonies North Elementary Cable Elementary Valley Hi Elementary Hull Elementary Cody Elementary Timberwilde Elementary Beard Elementary Fisher Elementary Driggers Elementary Adams Hill Elementary Ross Middle School Garcia Middle School Jefferson Middle School Jones Middle School Pease Middle School O'Connor HS Jay HS Warren HS Clark HS Health Careers/Holmgreen HS Facility Electric Performance (kwh/sf) Electric Performance (kwh/sf) Colonies North Elementary Cable Elementary Valley Hi Elementary Hull Elementary Cody Elementary Timberwilde Elementary Beard Elementary Fisher Elementary Driggers Elementary Adams Hill Elementary Ross Middle School Garcia Middle School Jefferson Middle School Jones Middle School Pease Middle School O'Connor HS Jay HS Warren HS Clark HS Health Careers/Holmgreen HS Facility Gas Performance (MCF/kSF) Gas Performance (MCF/kSF) SCHOOLS/LOCAL GOVERNMENT ENERGY MANAGEMENT PROGRAM PAGE 12
15 PRELIMINARY ENERGY ASSESSMENT REPORT JUNE 212 NORTHSIDE ISD The following charts summarize the each campus monthly utility data. See Appendix C for further detail. Electrical Consumption (kwh) 2, 18, 16, 14, 12, 1, 8, 6, 4, 2, Colonies North Elementary Consumption (kwh) $16, $14, $12, $1, $8, $6, $4, $2, $ Natural Gas Consumption (MCF) Colonies North Elementary Consumption (MCF) $4, $3,5 $3, $2,5 $2, $1,5 $1, $5 $ Electrical Consumption (kwh) 18, 16, 14, 12, 1, 8, 6, 4, 2, Cable Elementary Consumption (kwh) $12, $1, $8, $6, $4, $2, $ Natural Gas Consumption (MCF) Cable Elementary Consumption (MCF) $4, $3,5 $3, $2,5 $2, $1,5 $1, $5 $ Electrical Consumption (kwh) 1, 9, 8, 7, 6, 5, 4, 3, 2, 1, Valley Hi Elementary Consumption (kwh) $8, $7, $6, $5, $4, $3, $2, $1, $ Natural Gas Consumption (MCF) Valley Hi Elementary Consumption (MCF) $3, $2,5 $2, $1,5 $1, $5 $ Electrical Consumption (kwh) 16, 14, 12, 1, 8, 6, 4, 2, Hull Elementary Consumption (kwh) $14, $12, $1, $8, $6, $4, $2, $ Natural Gas Consumption (MCF) Hull Elementary Consumption (MCF) $3,5 $3, $2,5 $2, $1,5 $1, $5 $ SCHOOLS/LOCAL GOVERNMENT ENERGY MANAGEMENT PROGRAM PAGE 13
16 PRELIMINARY ENERGY ASSESSMENT REPORT JUNE 212 NORTHSIDE ISD Electrical Consumption (kwh) 14, 12, 1, 8, 6, 4, 2, Cody Elementary Consumption (kwh) $12, $1, $8, $6, $4, $2, $ Natural Gas Consumption (MCF) Cody Elementary Consumption (MCF) $4, $3,5 $3, $2,5 $2, $1,5 $1, $5 $ Electrical Consumption (kwh) 16, 14, 12, 1, 8, 6, 4, 2, Timberwilde Elementary Consumption (kwh) $14, $12, $1, $8, $6, $4, $2, $ Natural Gas Consumption (MCF) Timberwilde Elementary Consumption (MCF) $2,5 $2, $1,5 $1, $5 $ Electrical Consumption (kwh) 18, 16, 14, 12, 1, 8, 6, 4, 2, Beard Elementary Consumption (kwh) $16, $14, $12, $1, $8, $6, $4, $2, $ Natural Gas Consumption (MCF) Beard Elementary Consumption (MCF) $3, $2,5 $2, $1,5 $1, $5 $ Electrical Consumption (kwh) 2, 18, 16, 14, 12, 1, 8, 6, 4, 2, Fisher Elementary Consumption (kwh) $16, $14, $12, $1, $8, $6, $4, $2, $ Natural Gas Consumption (MCF) Fisher Elementary Consumption (MCF) $3,5 $3, $2,5 $2, $1,5 $1, $5 $ SCHOOLS/LOCAL GOVERNMENT ENERGY MANAGEMENT PROGRAM PAGE 14
17 PRELIMINARY ENERGY ASSESSMENT REPORT JUNE 212 NORTHSIDE ISD Electrical Consumption (kwh) 25, 2, 15, 1, 5, Driggers Elementary Consumption (kwh) $16, $14, $12, $1, $8, $6, $4, $2, $ Natural Gas Consumption (MCF) Driggers Elementary Consumption (MCF) $3,5 $3, $2,5 $2, $1,5 $1, $5 $ Electrical Consumption (kwh) 14, 12, 1, 8, 6, 4, 2, Adams Hill Elementary Consumption (kwh) $1, $9, $8, $7, $6, $5, $4, $3, $2, $1, $ Natural Gas Consumption (MCF) Adams Hill Elementary Consumption (MCF) $1,2 $1, $8 $6 $4 $2 $ Electrical Consumption (kwh) 3, 25, 2, 15, 1, 5, Ross Middle School Consumption (kwh) $2, $18, $16, $14, $12, $1, $8, $6, $4, $2, $ Natural Gas Consumption (MCF) Ross Middle School Consumption (MCF) $5, $4,5 $4, $3,5 $3, $2,5 $2, $1,5 $1, $5 $ Electrical Consumption (kwh) 3, 25, 2, 15, 1, 5, Garcia Middle School Consumption (kwh) $25, $2, $15, $1, $5, $ Natural Gas Consumption (MCF) 1, Garcia Middle School Consumption (MCF) $8, $7, $6, $5, $4, $3, $2, $1, $ SCHOOLS/LOCAL GOVERNMENT ENERGY MANAGEMENT PROGRAM PAGE 15
18 PRELIMINARY ENERGY ASSESSMENT REPORT JUNE 212 NORTHSIDE ISD Electrical Consumption (kwh) 35, 3, 25, 2, 15, 1, 5, Jefferson Middle School Consumption (kwh) $25, $2, $15, $1, $5, $ Natural Gas Consumption (MCF) Jefferson Middle School Consumption (MCF) $7, $6, $5, $4, $3, $2, $1, $ Electrical Consumption (kwh) 35, 3, 25, 2, 15, 1, 5, Jones Middle School Consumption (kwh) $25, $2, $15, $1, $5, $ Natural Gas Consumption (MCF) Jones Middle School Consumption (MCF) $5, $4,5 $4, $3,5 $3, $2,5 $2, $1,5 $1, $5 $ Electrical Consumption (kwh) 25, 2, 15, 1, 5, Pease Middle School Consumption (kwh) $16, $14, $12, $1, $8, $6, $4, $2, $ Natural Gas Consumption (MCF) Pease Middle School Consumption (MCF) $6, $5, $4, $3, $2, $1, $ Electrical Consumption (kwh) 9, 8, 7, 6, 5, 4, 3, 2, 1, O'Connor HS Consumption (kwh) $6, $5, $4, $3, $2, $1, $ Natural Gas Consumption (MCF) 1,8 1,6 1,4 1,2 1, O'Connor HS Consumption (MCF) $14, $12, $1, $8, $6, $4, $2, $ SCHOOLS/LOCAL GOVERNMENT ENERGY MANAGEMENT PROGRAM PAGE 16
19 PRELIMINARY ENERGY ASSESSMENT REPORT JUNE 212 NORTHSIDE ISD Electrical Consumption (kwh) 6, 5, 4, 3, 2, 1, Jay HS Consumption (kwh) $45, $4, $35, $3, $25, $2, $15, $1, $5, $ Natural Gas Consumption (MCF) 1,6 1,4 1,2 1, Jay HS Consumption (MCF) $1, $9, $8, $7, $6, $5, $4, $3, $2, $1, $ Electrical Consumption (kwh) 8, 7, 6, 5, 4, 3, 2, 1, Warren HS Consumption (kwh) $6, $5, $4, $3, $2, $1, $ Natural Gas Consumption (MCF) 1,4 1,2 1, Warren HS Consumption (MCF) $9, $8, $7, $6, $5, $4, $3, $2, $1, $ Electrical Consumption (kwh) 5, 45, 4, 35, 3, 25, 2, 15, 1, 5, Clark HS Consumption (kwh) $35, $3, $25, $2, $15, $1, $5, $ Natural Gas Consumption (MCF) 1,8 1,6 1,4 1,2 1, Clark HS Consumption (MCF) $12, $1, $8, $6, $4, $2, $ Electrical Consumption (kwh) 25, 2, 15, 1, 5, Health Careers/Holmgreen HS Consumption (kwh) $18, $16, $14, $12, $1, $8, $6, $4, $2, $ Natural Gas Consumption (MCF) Health Careers/Holmgreen HS Consumption (MCF) $4, $3,5 $3, $2,5 $2, $1,5 $1, $5 $ SCHOOLS/LOCAL GOVERNMENT ENERGY MANAGEMENT PROGRAM PAGE 17
20 PRELIMINARY ENERGY ASSESSMENT REPORT JUNE 212 NORTHSIDE ISD 4. ENERGY STAR PORTFOLIO MANAGER The District s energy baseline can be developed in ENERGY STAR s Portfolio Manager. One of the key reasons for using ENERGY STAR Portfolio Manager is its ability to normalize the District s baseline according to several key factors (i.e. Weather, Square Feet, Hours of Operation, Number of Computers, etc.). It is also a free online resource available to all registered users, and is a user-friendly web-based tool. ENERGY STAR is a joint program of the U.S. Environmental Protection Agency (EPA) and the U.S. Department of Energy (DOE). ENERGY STAR has developed Portfolio Manager, an innovative online energy management tool, designed to help organizations track and assess energy and water consumption of their facilities. Portfolio Manager helps organizations set investment priorities, identify under-performing buildings, verify efficiency improvements, and receive EPA recognition for superior energy performance. Portfolio Manger is an energy performance benchmarking tool. Portfolio Manager rates a building s energy performance on a scale of 1 1 relative to similar buildings nationwide. The rating system is based on a statistically representative model utilizing a national survey conducted by the Department of Energy s Energy Information Administration. This national survey, known as the Commercial Building Energy Consumption Survey (CBECS), is conducted every four years, and gathers data on building characteristics and energy use from thousands of buildings across the United States. A rating of 5 indicates that the building, from an energy consumption standpoint, performs better than 5% of all similar-use buildings nationwide, while a rating of 75 indicates that the building performs better than 75% of all similar-use buildings nationwide. In addition, Portfolio Manager is used to generate a Statement of Energy Performance (SEP) for each building, summarizing key energy information such as site and source energy intensity, greenhouse gas emission, energy reduction targets and energy cost. The Statement of Energy Performance can help in applying for an ENERGY STAR Building label or satisfying LEED for Existing Buildings (LEED-EB) requirements. For example, one of the requirements to receive an ENERGY STAR Building Label is to achieve a minimum CBECS rating of 75. A requirement to receive LEED-EB certification is an ENERGY STAR rating of 69. To develop the District s baseline, 12 months of utility consumption, cost data, and Building Space Use information will be required. The table below is a sample of the Building Space Use data required by Portfolio Manager to generate the Energy Performance Rating. These inputs are critical and can significantly influence how Portfolio Manager computes the ENERGY STAR Rating. Many of these key inputs may vary over time and could influence the rating. If an ENERGY STAR Label is pursued, these key inputs will need to be verified and certified by a Professional Engineer. Verification of this information is required when submitting the Statement of Energy Performance for ENERGY STAR s review. SCHOOLS/LOCAL GOVERNMENT ENERGY MANAGEMENT PROGRAM PAGE 18
21 PRELIMINARY ENERGY ASSESSMENT REPORT JUNE 212 NORTHSIDE ISD ENERGY STAR Portfolio Manager Example Space Use Data Facility Type: K-12 School 12 Months of Electric Gross Floor Area Open Weekends (Y/N) # of PCs # of Walk in refrigerators/freezers units Presence of cooking facilities Percent Cooled Percent Heated Months Open per Year High School (Y/N) Each facility at the District was analyzed through the ENERGY STAR Portfolio Manager. Default values were used for some of the data in the table above, such as number of PCs. It is recommended the District update these to correct values for each facility in order to achieve appropriate ENERGY STAR ratings. The table below summarizes the preliminary results based on some default values. Facility Name Current Rating Total Floor (1 1) Space (Sq. Ft.) Colonies North ES 18 78,822 Cable ES 35 79,657 Valley Hi ES 4 55,972 Hull ES 24 75,75 Cody ES 31 85,368 Timberwilde ES 34 81,482 Beard ES 27 96,98 Fisher ES 25 15,292 Driggers ES 3 91,511 Adams Hill ES 32 57,155 Ross MS ,521 Garcia MS 3 192,725 Jefferson MS 3 196,27 Jones MS 3 159,759 Pease MS ,235 O'Connor HS ,949 Jay HS ,8 Warren HS ,325 Clark HS ,747 Health Careers/Holmgreen HS ,896 SCHOOLS/LOCAL GOVERNMENT ENERGY MANAGEMENT PROGRAM PAGE 19
22 PRELIMINARY ENERGY ASSESSMENT REPORT JUNE 212 NORTHSIDE ISD The target for each of these schools is a rating of 75 to qualify for ENERGY STAR. The following indicates the school s current energy performance ratings, ending in ober 211. ENERGY STAR Portfolio Manager Energy Perfomance Rating and Target 1 9 ENERGY STAR Energy Performance Rating Target ENERGY STAR Rating = Colonies Timberwilde Adams Hill Health Cable ES Valley Hi ES Hull ES Cody ES Beard ES Fisher ES Driggers ES Ross MS Garcia MS Jefferson MS Jones MS Pease MS O'Connor HS Jay HS Warren HS Clark HS North ES ES ES Careers Current Rating ENERGY STAR ratings for Northside ISD A benefit of using ENERGY STAR s Portfolio Manager is its ability to set goals for energy performance. It allows an energy performance target to be set and calculates the estimated savings per year to reach the goal. With a performance target of 75 set, the estimated yearly savings for each of the schools is indicated below. Facility Current ENERGY STAR Rating ENERGY STAR Rating EXISTING RATING Current Utility Cost $/SF/yr Greenhouse Gas Emissions (MtCO 2 e/yr) / (kgco 2 e/ft 2 /yr) Target Utility Cost $/SF/yr ENERGY STAR Rating Target TARGET RATING = 69 Potential Target Savings $/yr Greenhouse Gas Emissions (MtCO2e/yr) / (kgco2e/ft2/yr) Target Utility Cost $/SF/yr ENERGY STAR Rating Target TARGET RATING = 75 Potential Target Savings $/yr Greenhouse Gas Emissions (MtCO2e/yr) / (kgco2e/ft2/yr) Colonies North Elementary 18 $ / 1 $.87 $42, / 6 $.81 $46, / 6 Cable Elementary 35 $ / 8 $.87 $24, / 7 $.81 $29, / 6 Valley Hi Elementary 4 $ / 8 $.84 $14, / 6 $.79 $17, / 6 Hull Elementary 24 $ / 9 $.82 $3, / 6 $.77 $34, / 6 Cody Elementary 31 $ / 9 $.82 $28, / 6 $.77 $33, / 6 Timberwilde Elementary 34 $ / 8 $.9 $26, / 6 $.85 $31, / 6 Beard Elementary 27 $ / 9 $.76 $33, / 6 $.71 $38, / 6 Fisher Elementary 25 $ / 9 $.83 $43, / 6 $.77 $48, / 6 Driggers Elementary 3 $ / 9 $.84 $32, / 6 $.79 $37, / 6 Adams Hill Elementary 32 $ / 9 $.9 $2, / 6 $.84 $23, / 6 Ross Middle School 32 $ / 8 $.78 $45, / 6 $.73 $52, / 5 Garcia Middle School 3 $ / 8 $.79 $64, / 6 $.74 $73, / 5 Jefferson Middle School 3 $ / 8 $.78 $65, / 6 $.73 $75, / 5 Jones Middle School 3 $ / 8 $.76 $52, / 6 $.71 $6, / 5 Pease Middle School 44 $ / 7 $.8 $3, / 6 $.75 $37, / 5 O'Connor HS 71 $ / 9 $ $1.18 $19, / 9 Jay HS 77 $ / 8 $ $ Warren HS 76 $ / 8 $ $ Clark HS 89 $ / 7 $ $ Health Careers/Holmgreen HS 72 $ / 8 $ $.95 $4, / 8 SCHOOLS/LOCAL GOVERNMENT ENERGY MANAGEMENT PROGRAM PAGE 2
23 PRELIMINARY ENERGY ASSESSMENT REPORT JUNE 212 NORTHSIDE ISD 5. ENERGY ACCOUNTING UTILITY PROVIDERS CPS Energy provides electric service to the District. Grey Forest Utilities provides natural gas service to the District. MONITORING AND TRACKING Currently, the District utilizes an energy tracking software. An effective energy tracking system is an essential tool by which an energy management program's activities are monitored. The system should be centralized and available for all engaged staff members to use in verifying progress toward established targets and milestones. The District should continue consolidating the tracking and recording of all the District s utility accounts (i.e., Electricity, Natural Gas, Propane, Water, etc.) into an electronic spreadsheet similar to the chart shown on the following page. Along with total utility costs ($), utility consumption should be recorded as well (i.e., kwh, MCF, gallons, etc.). The District can use this data to track utility consumption patterns and budget utility expenses. Preferably, the District should also consider an electronic database such as ENERGY STAR Portfolio Manager, which will provide a means of storing and tracking utility information. For more information on ENERGY STAR Portfolio Manager, please see Section 4.. Having this historical data improves the District s awareness of their energy performance and will help in tracking their energy reduction goals. The steps below are essential for an effective energy management tracking system: 1. Perform regular updates. An effective system requires current and comprehensive data. Monthly updates should be strongly encouraged. 2. Conduct periodic reviews. Such reviews should focus on progress made, problems encountered, and potential rewards. 3. Identify necessary corrective actions. This step is essential for identifying if a specific activity is not meeting its expected performance and is in need of review. In addition, having this historical utility data would facilitate House and Senate Bill(s) reporting requirements. Please see Section 7. for additional information regarding these requirements. Furthermore, below is a sample format the District can customize to help summarize their overall utility usage and costs. The data presented below is a summation of the data provided by the District. This data below includes only selected utility accounts and is for reference purposes only and does not represent the District s total utility data. See Appendix C for further detail regarding each utility account represented in the table below. SCHOOLS/LOCAL GOVERNMENT ENERGY MANAGEMENT PROGRAM PAGE 21
24 PRELIMINARY ENERGY ASSESSMENT REPORT JUNE 212 NORTHSIDE ISD Northside ISD - Sample Utility Input Form ELECTRICITY NATURAL GAS KWH COST Avg. Rate MCF COST Avg. Rate MONTH $ $/KWH $ $/MCF -1 3,2, ,813 $.775 6,31 $44,25 $ ,482, ,781 $.793 7,316 $5,23 $ ,929,6 226,44 $ ,367 $85,35 $ ,92, ,72 $.82 8,587 $62,5 $ ,322,98 265,44 $.798 4,525 $31,216 $ ,635, ,185 $.859 3,365 $25,596 $ ,41,41 381,316 $.866 2,766 $21,492 $ ,71, ,861 $.84 1,5 $7,94 $ ,675, ,938 $.848 1,25 $7,643 $ ,355, ,44 $.725 2,58 $18,312 $ ,426, ,546 $.729 2,996 $19,72 $ ,58, ,352 $.765 3,993 $26,859 $6.7 Total 41,94,75 $3,326,752 $ ,87 $4,489 $7. Gross Building Area: 3,331,91 SF Electrical Consumption (kwh) Monthly Electrical Consumption (kwh) and Consumption (kwh) 6,, 45, 5,, 4, 35, 4,, 3, 3,, 25, 2, 2,, 15, 1,, 1, 5, Natural Gas Consumption (MCF) 14, 12, 1, 8, 6, 4, 2, Monthly Natural Gas Consumption (MCF) and Consumption (MCF) $9, $8, $7, $6, $5, $4, $3, $2, $1, $ SCHOOLS/LOCAL GOVERNMENT ENERGY MANAGEMENT PROGRAM PAGE 22
25 PRELIMINARY ENERGY ASSESSMENT REPORT JUNE 212 NORTHSIDE ISD 6. ELECTRICAL DEMAND ANALYSIS Demand (kw) charges stem from a facility's peak power draw during a billing period, as opposed to consumption (kwh) charges, which total the energy usage over this period. The campuses analyzed in this report include electric meters that record demand. The campuses analyzed in this report are each billed on one of the following CPS Energy rate types: General Service PL, Large Lighting and Power (LLP), or Extra Large Power. In these rates, each account is billed for each kw used during its 15 minute peak at any time during a given month. In addition, a ratchet clause sets the minimum demand charge for a month during non-summer months as 8% of the maximum demand charge seen during the previous summer month period. Below is a table summarizing the electric utility rate types, average rates and demand charges for each campus. CPS Rate Type General Service PL Large Lighting & Power Facility Average Rate 1 ($/kwh) Colonies North Elementary $.82 Cable Elementary $.81 Valley Hi Elementary $.81 Hull Elementary $.82 Cody Elementary $.77 Timberwilde Elementary $.92 Beard Elementary $.73 Fisher Elementary $.8 Driggers Elementary $.8 Adams Hill Elementary $.8 Ross Middle School $.79 Garcia Middle School $.83 Jefferson Middle School $.82 Jones Middle School $.78 Pease Middle School $.82 O'Connor HS $.8 Jay HS $.73 Warren HS $.8 Health Careers/Holmgreen HS $.73 Extra Large Power Clark HS $ Based on an annual overall usage and cost. Demand Charge ($/kw) $7.4 $7.25 Winter (. - ) $9.25 Summer (. -.) $8.3 Winter (. - ) $1.45 Summer (. -.) The plots on the following page show the metered demand and billed demand over a 12 month period for each campus electric account. Notice periods of low metered demand where billed demand does not decrease. This is due to the demand ratchet. Note also the difference in demand from summer to winter. The demand increases during months of ust and tember, possibly due to pre-year equipment testing. These trends also suggest the District's demand peaks are primarily due to HVAC (cooling) systems. SCHOOLS/LOCAL GOVERNMENT ENERGY MANAGEMENT PROGRAM PAGE 23
26 PRELIMINARY ENERGY ASSESSMENT REPORT JUNE 212 NORTHSIDE ISD Billed demand for is 8% of metered peak demand from 21. Electrical Demand (kw) Colonies North Elementary Metered Demand (kw) Billed Demand (kw) Electrical Demand (kw) Cable Elementary Metered Demand (kw) Billed Demand (kw) Electrical Demand (kw) Valley Hi Elementary Metered Demand (kw) Billed Demand (kw) Electrical Demand (kw) Hull Elementary Metered Demand (kw) Billed Demand (kw) Electrical Demand (kw) Cody Elementary Metered Demand (kw) Billed Demand (kw) Electrical Demand (kw) Timberwilde Elementary Metered Demand (kw) Billed Demand (kw) Electrical Demand (kw) Beard Elementary Metered Demand (kw) Billed Demand (kw) Electrical Demand (kw) Fisher Elementary Metered Demand (kw) Billed Demand (kw) SCHOOLS/LOCAL GOVERNMENT ENERGY MANAGEMENT PROGRAM PAGE 24
27 PRELIMINARY ENERGY ASSESSMENT REPORT JUNE 212 NORTHSIDE ISD Electrical Demand (kw) Driggers Elementary Metered Demand (kw) Billed Demand (kw) Electrical Demand (kw) Adams Hill Elementary Metered Demand (kw) Billed Demand (kw) Electrical Demand (kw) Ross Middle School Metered Demand (kw) Billed Demand (kw) Electrical Demand (kw) 1,4 1,2 1, Garcia Middle School Metered Demand (kw) Billed Demand (kw) Electrical Demand (kw) 1,8 1,6 1,4 1,2 1, Jefferson Middle School Metered Demand (kw) Billed Demand (kw) Electrical Demand (kw) 1,2 1, Jones Middle School Metered Demand (kw) Billed Demand (kw) Electrical Demand (kw) Pease Middle School Metered Demand (kw) Billed Demand (kw) Electrical Demand (kw) 3, 2,5 2, 1,5 1, 5 O'Connor HS Metered Demand (kw) Billed Demand (kw) SCHOOLS/LOCAL GOVERNMENT ENERGY MANAGEMENT PROGRAM PAGE 25
28 PRELIMINARY ENERGY ASSESSMENT REPORT JUNE 212 NORTHSIDE ISD Jay HS Metered Demand (kw) Billed Demand (kw) Warren HS Metered Demand (kw) Billed Demand (kw) Electrical Demand (kw) 1,8 1,6 1,4 1,2 1, , 2,5 2, 1,5 1, 5 Electrical Demand (kw) Clark HS Metered Demand (kw) Billed Demand (kw) Health Careers/Holmgreen HS Metered Demand (kw) Billed Demand (kw) Electrical Demand (kw) 1,8 1,6 1,4 1,2 1, Electrical Demand (kw) The table below summarizes the additional electric utility costs incurred by the District due to the electrical demand ratchet at each school (shown in the charts above) between the billing period of School Annual Ratchet Penalty ($) Colonies North Elementary $1,86 Cable Elementary $2,45 Valley Hi Elementary $2,153 Hull Elementary $7,459 Cody Elementary $2,39 Timberwilde Elementary $3,27 Beard Elementary $3,263 Fisher Elementary $3,515 Driggers Elementary $4,699 Adams Hill Elementary $1,125 Ross Middle School $2,953 Garcia Middle School $8,651 Jefferson Middle School $9,26 Jones Middle School $4,118 Pease Middle School $4,821 O'Connor HS $16,624 Jay HS $1,138 Warren HS $1,49 Clark HS $8,76 Health Careers/Holmgreen HS $551 TOTAL $98,28 SCHOOLS/LOCAL GOVERNMENT ENERGY MANAGEMENT PROGRAM PAGE 26
29 PRELIMINARY ENERGY ASSESSMENT REPORT JUNE 212 NORTHSIDE ISD Some general recommendations for reducing demand costs include: Staggering HVAC equipment start up utilizing control systems. Installing motion sensors for lighting control to prevent unnecessary lighting on at once (see Section 11.) Increasing temperature setpoints in the summer and decreasing them in the winter to reduce unit cycle times and decrease the likelihood of simultaneous operation causing a demand peak. During equipment startup for upcoming school year in the months of ust and tember, be mindful of simultaneous equipment operation as it sets potentially higher demand costs for the following winter. SCHOOLS/LOCAL GOVERNMENT ENERGY MANAGEMENT PROGRAM PAGE 27
30 PRELIMINARY ENERGY ASSESSMENT REPORT JUNE 212 NORTHSIDE ISD 7. ENERGY LEGISLATION OVERVIEW In 27, the 8 th Texas Legislature passed Senate Bill 12 (SB12) which among other things extended the timeline set by Senate Bill 5 (SB5). SB5, commonly referred to as the Texas Emissions Reduction Plan, was adopted in 21 by the 77th Texas Legislature to comply with the federal Clean Air Act standards. Also in 27, the 8 th Texas Legislature passed House Bill 3693 (HB3693) which amended provisions of several codes relating primarily to energy efficiency. In 29, the 81 st Texas Legislature passed Senate Bill 3 (SB3). This bill specifically addressed the requirement for Texas Schools. This bill repealed the requirement in HB3693 that school districts must establish a goal of reducing electric consumption by 5% each year for six years starting Fiscal Year (FY) 27. SB3 instead requires that school districts establish a long-range energy plan to reduce the overall electricity use by 5% beginning FY 28. Besides this change, other requirements set forth in SB12 and HB3693 applicable to schools still apply. Following are key requirements established by the above energy legislation: Establish a Long-Range Energy Plan (SB3) to reduce the District s electric consumption by five percent (5%) beginning with the 28 state fiscal year and to consume electricity in subsequent fiscal years in accordance with the plan. The Long- Range Energy Plan should include strategies in the plan for achieving energy efficiency that result in net savings or that can be achieved without financial cost to the district. The Plan should account for the initial, short-term capital costs and lifetime costs and savings that may occur from implementation of the strategy. Each strategy should be evaluated based on the total net costs and savings that may occur over a seven-year period following implementation of the strategy. Record electric, water, and natural gas utility services (consumption and cost) in an electronic repository. The recorded information shall be on a publicly accessible Internet Web site with an interface designed for ease of navigation if available, or at another publicly accessible location. To help with the utility reporting process, a sample input form can be found in Appendix B of this report. Purchase commercially available light bulbs using the lowest wattages for the required illumination levels. Install energy saving devices in Vending Machines with non-perishable food products. Not required of School Districts, but highly recommended. Summary descriptions of SB12, HB3693, and SB3 are available in Appendix A. SCHOOLS/LOCAL GOVERNMENT ENERGY MANAGEMENT PROGRAM PAGE 28
31 PRELIMINARY ENERGY ASSESSMENT REPORT JUNE 212 NORTHSIDE ISD 8. DATA LOGGERS FOR INDOOR CONDITIONS During the preliminary walkthrough, data-logging equipment was deployed in typical classrooms at Beard Elementary School, Garcia Middle School and Jay High School to take snapshot readings of the indoor conditions. The data-logging equipment recorded the room s indoor temperature, indoor relative humidity and light intensity conditions for a short duration. While this information only provides a brief sample of the indoor conditions, this information is helpful in providing a general understanding of a facility s HVAC and lighting system operations. Below are example charts illustrating the results of the logging data. 1 Monday 3/26/212 Tuesday 3/27/212 Beard Elementary School Classroom D18 Wednesday 3/28/212 Thursday 3/29/212 Friday 3/3/212 Indoor Temperature (F) Indoor Relative Humidity (%RH) Outdoor Temperature (F) Indoor Light Intensity (ftc) Saturday 3/31/ Light Intensity (ftc) : AM 6: AM 12: PM 6: PM 12: AM 6: AM 12: PM 6: PM 12: AM 6: AM 12: PM 6: PM 12: AM 6: AM 12: PM 6: PM 12: AM 6: AM 12: PM 6: PM 12: AM 6: AM 12: PM 6: PM 12: AM Temp, F and %Relative Humidity HVAC systems remained on during school hours, off during nights and weekend. Lights off SCHOOLS/LOCAL GOVERNMENT ENERGY MANAGEMENT PROGRAM PAGE 29
32 PRELIMINARY ENERGY ASSESSMENT REPORT JUNE 212 NORTHSIDE ISD 9 85 Monday 3/26/212 Tuesday 3/27/212 Garcia Middle School Classroom C119 Wednesday 3/28/212 Thursday 3/29/212 Indoor Temperature (F) Indoor Relative Humidity (%RH) Outdoor Temperature (F) Indoor Light Intensity (ftc) 18 Friday 3/3/ Light Intensity (ftc) 4 12: AM 6: AM 12: PM 6: PM 12: AM 6: AM 12: PM 6: PM 12: AM 6: AM 12: PM 6: PM 12: AM 6: AM 12: PM 6: PM 12: AM 6: AM 12: PM 6: PM Temp, F and %Relative Humidity 12: AM Lights remained on until about 9 p.m. each day, remained off at night. 9 8 Monday 3/19/212 Tuesday 3/2/212 Jay High School Classroom B17 Wednesday 3/21/212 Thursday 3/22/212 Indoor Temperature (F) Indoor Relative Humidity (%RH) Outdoor Temperature (F) Indoor Light Intensity (ftc) 14 Friday 3/23/ Lights remained on from 7 p.m.to 1 p.m. on Thursday, 3/22/ Temp, F and %Relative Humidity Light Intensity (ftc) 12: AM 6: AM 12: PM 6: PM 12: AM 6: AM 12: PM 6: PM 12: AM 6: AM 12: PM 6: PM 12: AM 6: AM 12: PM 6: PM 12: AM 6: AM 12: PM 6: PM 12: AM Lights remained constantly on from about 8 a.m.to 7 p.m. each day, remained off at night. SCHOOLS/LOCAL GOVERNMENT ENERGY MANAGEMENT PROGRAM PAGE 3
33 PRELIMINARY ENERGY ASSESSMENT REPORT JUNE 212 NORTHSIDE ISD 9. SAMPLE SCREENSHOTS OF ENERGY MANAGEMENT SYSTEM (EMS) Several images were captured from the facilities Energy Management System (EMS) monitor. Each image is a snapshot of HVAC equipment readings and settings (Temperature Setpoints, Equipment On/Off Status, etc.). Trends are time-stamped snapshots of data accumulated by the EMS over a period of time. Below are example screenshots from the EMS. While this information is only a brief sample of the operating conditions, it helps provide a general understanding of a facility s HVAC system operations. Since the HVAC system is the major energy consumer in most facilities, investigating these systems often reveals energy reduction opportunities. Below are some examples of the information obtained using the EMS. Please note that the following images were obtained during the month of ruary 212. Unit in dehumidification mode, return air humidity is 51.5% (setpoint is 55%). Figure 1: EMS Screenshot of Colonies North Elementary AHU. SCHOOLS/LOCAL GOVERNMENT ENERGY MANAGEMENT PROGRAM PAGE 31

34 PRELIMINARY ENERGY ASSESSMENT REPORT JUNE 212 NORTHSIDE ISD Unit in dehumidification mode, return air humidity is 49%. Figure 2: EMS Screenshot of Pease Middle School. Supply air temperature is 5 o F, setpoint is 55 o F. Figure 3: EMS Screenshot of Pease Middle School. SCHOOLS/LOCAL GOVERNMENT ENERGY MANAGEMENT PROGRAM PAGE 32

35 PRELIMINARY ENERGY ASSESSMENT REPORT JUNE 212 NORTHSIDE ISD Constant static pressure setpoint. Figure 4: EMS Screenshot of O Connor High School. Potentially malfunctioning sensor. Figure 5: EMS Screenshot of Cody Elementary. Cold deck supply air temperature is 47.2 o F, chilled water valve closed. SCHOOLS/LOCAL GOVERNMENT ENERGY MANAGEMENT PROGRAM PAGE 33
36 PRELIMINARY ENERGY ASSESSMENT REPORT JUNE 212 NORTHSIDE ISD Cooling setpoint is 45 o F. Figure 6: EMS Screenshot of Ross Middle School. SCHOOLS/LOCAL GOVERNMENT ENERGY MANAGEMENT PROGRAM PAGE 34
37 PRELIMINARY ENERGY ASSESSMENT REPORT JUNE 212 NORTHSIDE ISD 1. RECOMMENDED MAINTENANCE & OPERATION PROCEDURES Good Maintenance and Operation procedures significantly improve operating economy, equipment life, and occupant comfort. Generally, maintenance and operation procedural improvements can be made with existing staff and budgetary levels. Below are typical maintenance and operation procedures that have energy savings benefits. The District may already be following some of the recommendations noted below. The following maintenance and operation procedures should be encouraged and continued to ensure sustainable energy savings. PUBLICIZE ENERGY CONSERVATION Promote energy awareness at regular staff meetings, on bulletin boards, and through organizational publications. Publicize energy cost reports showing uptrends and downtrends. MANAGE SMALL ELECTRICAL EQUIPMENT LOADS Small electrical equipment loads consists of small appliances/devices such as portable heaters, microwaves, small refrigerators, coffee makers, stereos, cell phone chargers, desk lamps, etc. The District should establish a goal to reduce the number of small appliances and to limit their usage. For example, the use of small space heaters should be discouraged; hence, all space heating should be accomplished by the District s main heating system. In addition, many small devices such as radios, printers, and phone chargers can consume energy while not in use. To limit this stand-by power usage these devices should be unplugged or plugged into a power strip that can act as a central turn off point while not in use. With an effective energy awareness campaign to encourage participation, managing small electrical loads can achieve considerable energy savings. ESTABLISH HVAC UNIT SERVICE SCHEDULES Document schedules and review requirements for replacing filters, cleaning condensers, and cleaning evaporators. Include particulars such as filter sizes, crew scheduling, contract availability if needed, etc. Replace filters with standard efficiency pleated units. Generally, appropriate service frequencies are as follows -- filters: monthly; condensers: annually; evaporators: 5 years. PRE-IDENTIFY PREMIUM EFFICIENCY MOTOR (PEM) REPLACEMENTS Pre-identify supply sources and PEM stock numbers for all HVAC fan and pump motors so that as failures occur, replacement with PEM units can take place on a routine basis. As funding allows, pre-stock PEM replacements according to anticipated demand, i.e., motors in service more than 1 years, motors in stressful service, and at least one motor of each size and type that is in service at numerous locations. IMPROVE CONTROL OF INTERIOR & EXTERIOR LIGHTING Establish procedures to monitor use of lighting at times and places of possible/probable unnecessary use: Offices and classes at lunchtime, maintenance shops, closets, exterior and parking lots during daylight hours, etc. Encouraging staff (i.e. Teacher, Custodial, maintenance, and students) to participate in the District s efforts to limit unnecessary lighting use would help improve this effort. For example, the pictures below provide examples of unnecessary lighting use. SCHOOLS/LOCAL GOVERNMENT ENERGY MANAGEMENT PROGRAM PAGE 35


38 PRELIMINARY ENERGY ASSESSMENT REPORT JUNE 212 NORTHSIDE ISD Example 1 - Gym Lights - The pictures below are of the High Intensity Discharge (HID) Lights in the two gyms at Jones Middle School. During the walkthrough, the lights were on during an unoccupied period. The District should establish a procedure to reduce the time gym lighting is left on during unused periods and consider utilizing natural light from the windows and doors. A good energy awareness campaign, a collective effort, and good communication, will help ensure the success of this no/low cost energy saving strategy. It is important to note that HID fixtures have long re-strike and warm-up times, so the lights should not be switched off for short times and should be switched on several minutes before the needed use. The District should consider replacing the HID fixtures with fluorescent fixtures. The fluorescent fixtures are more efficient, can be easily configured for multiple lighting levels, and are instant-on, allowing for a tighter lighting schedule. Lights can also be grouped for switching manually or automatically according to available daylight. For more information, see Section 11.. Example 2 - Exterior Lights: The pictures below are of exterior lights on during daylight hours. Exterior lighting is typically controlled using light sensing photocells, timeclocks or manual switching. Another option is to use the Energy Management System (EMS) to relays in the lighting circuits. Photocells tend to fail in the On state, so someone should check regularly to see that the lights are not on during the day. Timeclocks are more reliable, and those with astronomical control or that operate in series with photocells also provide dusk-to-dawn operation that is seasonally corrected. Timeclocks also offer the option of turning off the lights in the middle of the night. Manual control is limited to when someone is present and remembers to go to the switch and actuate it. EMS control can use a single light sensor and many schedules to control many lighting groups. It also offers easy means to override normal schedules for special events. The EMS light sensor calibration should be checked periodically, or a second sensor should be used for constant cross-calibration. SCHOOLS/LOCAL GOVERNMENT ENERGY MANAGEMENT PROGRAM PAGE 36


39 PRELIMINARY ENERGY ASSESSMENT REPORT JUNE 212 NORTHSIDE ISD Exterior lights on at Jefferson Middle School Exterior light on at Ross Middle School Example 3 Daylighting: The pictures below are good examples of day-lighting opportunities. The window placement helps bring in sufficient natural light to illuminate the space during school hours. The District should consider reducing the amount of artificial lighting in areas where sufficient natural light is available. Jay High School Girls Gym footcandles with lights on 3 35 footcandles with lights off Anson Jones Middle School Hallway 6 85 footcandles with lights on 5 74 footcandles with lights off SEPARATELY SCHEDULE TEMPERATURE CONTROL AND VENTILATION It is typically necessary to start equipment and establish temperature control an hour or more before occupancy. Except perhaps in very mild weather, however, fresh air intake should not begin until the occupants are due to arrive. Otherwise, fresh air is heated or cooled needlessly. In hot, humid weather, the outside air also raises the indoor humidity at a time when the cooling load is too low to produce sufficient dehumidifying effect from the cooling system. TYPICAL EQUIPMENT MAINTENANCE CHECKLISTS Effective operation and maintenance of equipment is one of the most cost effective ways to achieve reliability, safety, and efficiency. Failing to maintain equipment can cause significant energy waste and severely decrease the life of equipment. Substantial savings can result from good operation and maintenance procedures. In addition, such procedures require little time and cost to implement. Examples of typical maintenance checklists for common equipment SCHOOLS/LOCAL GOVERNMENT ENERGY MANAGEMENT PROGRAM PAGE 37
40 PRELIMINARY ENERGY ASSESSMENT REPORT JUNE 212 NORTHSIDE ISD including are provided in Appendix E. These checklists from the Federal Energy Management Program (FEMP), a branch of the Department of Energy (DOE), are based on industry standards and should supplement, not replace those provided by the manufacturer. CONTROL OUTSIDE AIR INFILTRATION Conduct periodic inspections of door and window weather-stripping, and schedule repairs when needed. Additionally, make sure doors and windows are closed during operation of HVAC systems (heating or cooling). Unintended outside air contributes to higher energy consumption and increases occupant discomfort. REPLACE INCANDESCENT LAMPS WITH COMPACT FLUORESCENTS Replace existing incandescent lamps with compact fluorescent lamps as they burn out. Compact fluorescents use 5 to 75 percent less wattage for the same light output, with ten times the operating life of incandescents. ENERGY STAR POWER MANAGEMENT ENERGY STAR Power Management Program promotes placing monitors and computers (CPU, hard drive, etc.) into a low-power sleep mode after a period of inactivity. The estimated annual savings can range from $25 to $75 per computer. ENERGY STAR recommends setting computers to enter system standby or hibernate after 3 to 6 minutes of inactivity. Simply touching the mouse or keyboard wakes the computer and monitor in seconds. Activating sleep features saves energy, money, and helps protect the environment. INSTALL ENERGY SAVING DEVICES ON VENDING MACHINES Install energy saving devices on vending machines with non-perishable food items to reduce the equipment power usage. These devices shut the vending machines down during unoccupied periods. There are several commercially available devices that can be easily installed on existing vending machines. These devices typical have a motion sensor which powers down the equipment after periods of inactivity. For example if the motion sensor does not sense activity within 15 minutes the device will shutdown the vending machine and turn on once motion is sensed. These devices range in price from $1 to $25 and have a typical annual savings of $2 to $15 per vending machine. SCHOOLS/LOCAL GOVERNMENT ENERGY MANAGEMENT PROGRAM PAGE 38

41 PRELIMINARY ENERGY ASSESSMENT REPORT JUNE 212 NORTHSIDE ISD HAIL GUARDS ON CONDENSING UNITS AND PACKAGED ROOFTOP UNITS When an HVAC unit is replaced the District should ensure the new unit be specified with hail guards. The hail guards protect the condensing unit s heat exchanger coils from hail damage. Damage to the condensing unit heat exchangers reduces the efficiency of the units. If any existing unit(s) have damaged condensing coil fins, the fins should be straightened using a fin comb. The following picture is an example of fin damage on a condensing unit on the roof of Health Careers High School. MAINTAIN INSULATION ON SPLIT DX UNIT REFRIGERANT LINES It is recommended these lines be checked periodically and the insulation be maintained and replaced where necessary to eliminate unnecessary energy losses and condensation damage. The black foam insulation (commercially called elastomeric insulation ) that is commonly used on such lines should not be exposed to sunlight unless coated with a UV barrier and/or covered with an aluminum jacket or aluminized tape made for the purpose. Only the vapor suction line (larger, cold line) needs insulation; the smaller (liquid) line should remain bare. SCHOOLS/LOCAL GOVERNMENT ENERGY MANAGEMENT PROGRAM PAGE 39
42 PRELIMINARY ENERGY ASSESSMENT REPORT JUNE 212 NORTHSIDE ISD 11. UTILITY COST REDUCTION MEASURES Utility Cost Reduction Measures (UCRMs) projects identified during the preliminary analysis are detailed below. Project cost estimates include complete design and construction management services. REPLACE EXISTING T8 FLUORESCENT LAMPS WITH LOWER WATTAGE LAMPS Low-wattage T8 fluorescent lamps are available in 3, 28 and 25-watt versions. The District should consider replacing existing 32-watt T8 Fluorescent lamps with lower wattage lamps in most cases. However, lower wattage T8 lamps produce a little less light, so it is important to verify by calculation beforehand that recommended lighting levels will be maintained. Lighting levels should be measured prior to and after lamp replacement. In addition, compatibility with existing ballasts, local codes and other requirements must be verified prior to retrofitting. Nevertheless, if suitable for the application, switching to lower wattage T8 lamps will have sustainable energy savings with minimal impact. For example, replacing a 32-watt T8 lamp with a 28-watt T8 lamp will reduce energy use by about 12% while dropping the lighting level only about 4%. The estimated costs and savings noted below are based on replacement of existing 32-watt T8 lamps and do not account for ballast replacements (if existing are incompatible) or reduced lamp counts (if existing lighting levels are above recommended levels). Estimates are based on a preliminary walkthrough of the facilities. A detailed lighting analysis will be required to determine exact cost, quantities and configuration to maximize the energy savings and lighting performance. The cost and savings calculations below are based on 48 F28T8, extended life linear fluorescent lamps. Lamp recycling is included in the cost estimates. LOW WATTAGE T8 FLUORESCENT LIGHTING RETROFIT Es timated Annual Savings ($/yr) Estimated Annual MMBTU Savings (MMBTU/yr) Simple Payback (years) Es timated Building Implementation Cost Colonies North Elementary $18,4 $4, Cable Elementary $18,6 $3, Valley Hi Elementary $13,1 $2, Hull Elementary $17,7 $3, Cody Elementary $2, $4, Timberwilde Elementary $19,1 $3, Beard Elementary $22,5 $4, Fisher Elementary $24,6 $4, Driggers Elementary $21,4 $4, Adams Hill Elementary $13,4 $2, Ross Middle School $34,3 $7, Garcia Middle School $45,1 $9, Jefferson Middle School $45,9 $9, Jones Middle School $37,4 $7, Pease Middle School $33,8 $6, O'Connor HS $86,6 $17, Jay HS $85,8 $17, Warren HS $92,7 $18, Clark HS $89,6 $17, Health Careers/Holmgreen HS $39,5 $7, TOTAL $779,5 $157,6 6, SCHOOLS/LOCAL GOVERNMENT ENERGY MANAGEMENT PROGRAM PAGE 4
43 PRELIMINARY ENERGY ASSESSMENT REPORT JUNE 212 NORTHSIDE ISD REPLACE GYMNASIUM HID LIGHTING WITH FLUORESCENT LIGHTING Several gyms in the District utilize High Intensity Discharge (HID) fixtures for light. It is recommended that the District replace the existing HID fixtures with T5HO or T8 fluorescent fixtures suitable for gym applications. Fluorescent fixtures offer improved control, reduced energy consumption and improved lighting levels. Unlike HID fixtures which have long warmup times and even longer re-strike times, fluorescent fixtures can be switched off and on at will. This allows them to operate fewer hours, saving energy and extending lamp life. The cost and savings estimates below are based on preliminary observations and analysis. Note that fixtures selected for unheated spaces or where subject to abuse (like gyms) will require special features. HID TO FLUORESCENT LIGHTING RETROFIT Es timated Annual Savings ($/yr) Estimated Annual MMBTU Savings (MMBTU/yr) Simple Payback (years) Es timated Building Implementation Cost Colonies North Elementary $6,8 $ Valley Hi Elementary $6,8 $ Hull Elementary $6,8 $ Beard Elementary $12,7 $1, Fisher Elementary $1,6 $1, Driggers Elementary $14,8 $1, Adams Hill Elementary $6,8 $ Ross Middle School $2,3 $2, Garcia Middle School $22,4 $2, Jefferson Middle School $25,4 $3, Jones Middle School $15,2 $1, Pease Middle School $17,4 $2, Jay HS $25,4 $2, Warren HS $11, $1, Clark HS $14,4 $1, TOTAL $216,8 $25,2 1, REPLACE HID SITE LIGHTING WITH LOWER ENERGY ALTERNATIVES Northside ISD parking lot and building security lighting is primarily accomplished with High Intensity Discharge (HID) lamps. It is recommended to retrofit these fixtures with lower energy alternatives. Available alternatives include high efficiency, long life induction for parking lot lights and LED fixtures for building security lighting. In addition to operating at lower wattage, these retrofits also have the advantage of shorter strike time, longer lamp life, and better color rending index while still meeting IES foot-candle levels for the areas served. Replacements should be selected to maintain adequate light levels post-retrofit. A detailed lighting analysis will be required to determine exact cost, quantities and configuration to maximize energy savings and lighting performance. The table below shows estimated costs and savings for retrofit. SCHOOLS/LOCAL GOVERNMENT ENERGY MANAGEMENT PROGRAM PAGE 41
44 PRELIMINARY ENERGY ASSESSMENT REPORT JUNE 212 NORTHSIDE ISD OUTDOOR HID SITE LIGHTING RETROFIT Es timated Annual Savings ($/yr) Estimated Annual MMBTU Savings (MMBTU/yr) Simple Payback (years) Es timated Building Implementation Cost Colonies North Elementary $7,7 $ Cable Elementary $13,4 $1, Valley Hi Elementary $1,5 $1, Hull Elementary $14,2 $1, Cody Elementary $13,4 $1, Timberwilde Elementary $7,7 $ Beard Elementary $23,6 $2, Fisher Elementary $15,3 $1, Driggers Elementary $19,4 $1, Adams Hill Elementary $8,5 $ Ross Middle School $17,3 $1, Garcia Middle School $23,6 $2, Jefferson Middle School $18, $1, Jones Middle School $17, $1, Pease Middle School $12,7 $1, O'Connor HS $28,6 $2, Jay HS $18,6 $1, Warren HS $29,9 $2, Clark HS $21,9 $2, Health Careers/Holmgreen HS $2,5 $1, TOTAL $341,8 $33,3 1, INSTALL OCCUPANCY SENSORS FOR INDOOR LIGHTING CONTROL The District should consider installing occupancy sensors to improve control of interior lighting. Occupancy sensors will help ensure lights are only on when the space is occupied. The table below provides estimated costs and energy savings for the installation of these sensors. Please note these estimates are based on a preliminary assessment. Exact sensor locations, technology (Infrared, Ultrasonic, and Dual Technology) and quantity can be determined during a detailed energy assessment or design phase. In general, enclosed areas with intermittent use are typically good candidates for occupancy sensors (e.g. classrooms, offices, break rooms and conference rooms). The costs below reflect ceiling mounted occupancy sensors. SCHOOLS/LOCAL GOVERNMENT ENERGY MANAGEMENT PROGRAM PAGE 42
45 PRELIMINARY ENERGY ASSESSMENT REPORT JUNE 212 NORTHSIDE ISD MOTION SENSOR INSTALLATION Es timated Annual Savings ($/yr) Estimated Annual MMBTU Savings (MMBTU/yr) Simple Payback (years) Es timated Building Implementation Cost Colonies North Elementary $11,5 $1, Cable Elementary $12, $1, Valley Hi Elementary $6,5 $ Hull Elementary $1,5 $1, Cody Elementary $13,3 $1, Timberwilde Elementary $12,8 $1, Beard Elementary $14,8 $2, Fisher Elementary $13,3 $1, Driggers Elementary $9,8 $1, Adams Hill Elementary $7,3 $1, Ross Middle School $11,5 $1, Garcia Middle School $9,3 $1, Jefferson Middle School $16, $2, Jones Middle School $8, $1, Pease Middle School $1,8 $1, O'Connor HS $18,5 $2, Jay HS $19,3 $2, Warren HS $19,5 $2, Clark HS $6,8 $ Health Careers/Holmgreen HS $1, $1, TOTAL $241,5 $34,1 1, INSTALL VFD AT CHILLED WATER PUMP Install Variable Frequency Drives (VFD) and controls on chilled water (CHW) pumps which presently operate at constant volume. The constant flow arrangements will be converted to variable primary flow. The VFD will reduce the energy consumption of the pump by maintaining precise control of CHW requirements to the air handler coils. This ECRM requires installation of appropriate VFD, differential pressure transducer and integration into EMS. For this measure to work effectively, replace all three way controls valves at the air handlers with two way except for one or two valves at each floor to ensure minimum flow through chiller. VFD INSTALLATION AT CHILLED WATER PUMPS Es timated Annual Savings ($/yr) Estimated Annual MMBTU Savings (MMBTU/yr) Simple Payback (years) Es timated Building Implementation Cost Colonies North Elementary $5, $5, Hull Elementary $4, $5, Cody Elementary $15, $2, Timberwilde Elementary $5, $5, Beard Elementary $2, $2, Fisher Elementary $4, $5, Driggers Elementary $4, $5, Ross Middle School $45, $5, Jones Middle School $75, $8, Jay HS $15, $1, Health Careers/Holmgreen HS $1, $1, TOTAL $49, $59,6 2, SCHOOLS/LOCAL GOVERNMENT ENERGY MANAGEMENT PROGRAM PAGE 43
46 PRELIMINARY ENERGY ASSESSMENT REPORT JUNE 212 NORTHSIDE ISD INSTALL VFD AT AIR HANDLING UNITS Install new variable frequency drives (VFD) & associated controls on existing air handler units (AHU) at Jay High School and Clark High School (approx. 17 HP total). The VFDs will provide precise and positive control of airflow rates based on return/supply air temperature. The units will act as a soft start device and help maintain humidity levels when needed, thereby reducing energy consumption and improving comfort. This feature will require custom programming. VFD INSTALLATION AT AIR HANDLING UNITS Es timated Annual Savings ($/yr) Estimated Annual MMBTU Savings (MMBTU/yr) Simple Payback (years) Es timated Building Implementation Cost Jay HS $115, $11, Clark HS $52,5 $4, TOTAL $167,5 $15, INSTALL VFD AT COOLING TOWER FANS Install Variable Frequency Drives (VFD) and controls on chilled water cooling tower fans. For each chiller, cooling tower, outdoor temperature and humidity condition and cooling load, there exists some optimum cooling tower fan speed. Beyond that speed, the fan power increase for each degree of condenser water temperature reduction exceeds the compressor power reduction. Maintaining the ratio of cooling tower fan power to the chiller compressor power at an optimum ratio (which is nearly constant for any given pair of compressors and cooling towers) improves the overall plant efficiency. Smooth control of the tower airflow also stabilizes the chiller control. Estimated cost and savings for the projects are listed below. Estimated cost includes motor replacement (from 2-speed to premium efficiency motor). VFD INSTALLATION AT COOLING TOWER FANS Es timated Annual Savings ($/yr) Estimated Annual MMBTU Savings (MMBTU/yr) Simple Payback (years) Es timated Building Implementation Cost Pease Middle School (2-1 HP CT Fans) $22, $2, Jay HS (2-2 HP CT Fans) $44, $5, Health Careers/Holmgreen HS (2-2 HP CT Fans) $44, $4, TOTAL $11, $12, CHILLER SYSTEM REPLACEMENT The District has several chilled water systems that are nearing the end of their useful life. The District should budget and plan to replace these units with new high efficiency units that will have energy savings and help reduce maintenance costs. The chillers are located at: Cody Elementary: (1) 85-ton air cooled chiller (31 years old) Pease Middle School: (1) 25-ton water cooled chiller (25 years old) Jay High School: (1) 5-ton water cooled chiller (29 years old) Estimated cost and savings for these projects are listed below. The cost includes minor modification (piping, electrical, etc.) and integration of controls. SCHOOLS/LOCAL GOVERNMENT ENERGY MANAGEMENT PROGRAM PAGE 44
47 PRELIMINARY ENERGY ASSESSMENT REPORT JUNE 212 NORTHSIDE ISD CHILLER REPLACEMENT Es timated Annual Savings ($/yr) Estimated Annual MMBTU Savings (MMBTU/yr) Simple Payback (years) Es timated Building Implementation Cost Cody Elementary $85, $3, Pease Middle School $25, $1, Jay HS $5, $22,7 1, TOTAL $835, $36,8 1, COMMISSION (Cx) HVAC SYSTEMS Detailed HVAC & Control system commissioning in an existing building involves analysis of existing systems to ensure compliance with original set-up/design conditions and, where feasible, analyzing the design to adjust operating parameters to enhance comfort and reduce energy consumption. Overall, the goal of commissioning is to deliver a system that operates optimally, meets the needs of the building owner and occupants, and is understood by the facility operators. To reach this goal it is necessary for the commissioning process to provide documentation and verification of the performance of all building equipment and systems. For the process to work successfully it is equally important to have good communications between all participants (owners, operators, and the commissioning agent) and to keep all parties involved and informed of all pertinent decisions. For general information on Commissioning, please refer to Appendix G. HVAC Retro-commissioning (RCx) involves the optimization of an existing building s energy usage through testing and documentation. Typically, this procedure will review and improve a building s energy consumption levels by investigating staff and occupant observations as well as optimizing the building systems to meet or surpass the original design goals. This process is especially appropriate for buildings that have not been commissioned recently. Preliminary examination (utility data review, discussion with staff, EMS review, and walkthrough) of Northside ISD facilities indicate potential for energy cost savings primarily in the HVAC systems operations. The elementary and middle school facilities listed below would greatly benefit by implementing a full scale building Retro-Commissioning (Cx) program, while the high schools would benefit from a small scale Cx program for a short duration. These programs would ensure the optimization of HVAC systems for the building s existing conditions, work to improve the building air quality, increase comfort levels, and resolve any operating problems. The Commissioning program requires collaborative efforts between the commissioning engineers and the facility staff, and is an ongoing process that continues to both commission the building as well as train the facility staff. The cost and savings estimates presented here are for a comprehensive commissioning program. The project implementation duration is typically 1 to 12 months. The following estimates are based on a preliminary walkthrough, available utility data analysis, and discussion with staff. The project, if authorized, would normally be accomplished by an organization/firm with engineers specializing in enhanced commissioning techniques and project implementation. SCHOOLS/LOCAL GOVERNMENT ENERGY MANAGEMENT PROGRAM PAGE 45
48 PRELIMINARY ENERGY ASSESSMENT REPORT JUNE 212 NORTHSIDE ISD The table below summarizes the implementation costs, annual savings, and payback for a comprehensive commissioning program at each campus. Note: The table below includes estimated budget/cost for deferred maintenance items. The deferred maintenance budget is for repair items that the Owner needs to address (such as sensor replacement, damper repair, etc.) that may be identified by the commissioning team. COMMISSIONING (Cx) Es timated Annual Savings ($/yr) Estimated Annual MMBTU Savings (MMBTU/yr) Simple Payback (years) Es timated Building Implementation Cost Colonies North Elementary (Full scale RCx) $43,4 $7, Cable Elementary (Full scale RCx) $43,8 $6, Valley Hi Elementary (Full scale RCx) $3,8 $5, Hull Elementary (Full scale RCx) $41,7 $7, Cody Elementary (Full scale RCx) $47, $6, Timberwilde Elementary (Full scale RCx) $44,8 $6, Beard Elementary (Full scale RCx) $52,9 $8, Fisher Elementary (Full scale RCx) $57,9 $8, Driggers Elementary (Full scale RCx) $5,3 $8, Adams Hill Elementary (Full scale RCx) $31,4 $5, Ross Middle School (Full scale RCx) $8,6 $11, Garcia Middle School (Full scale RCx) $16, $16, Jefferson Middle School (Full scale RCx) $17,8 $16, Jones Middle School (Full scale RCx) $87,9 $14, Pease Middle School (Full scale RCx) $79,3 $13, O'Connor HS (Short term Cx) $92,5 $15, Jay HS (Short term Cx) $91,7 $14, Warren HS (Short term Cx) $99,1 $18, Clark HS (Short term Cx) $95,7 $14, Health Careers/Holmgreen HS (Short term Cx) $42,2 $6, Deferred maintenenace/repair costs $199, TOTAL $1,525,8 $21,2 11, SCHOOLS/LOCAL GOVERNMENT ENERGY MANAGEMENT PROGRAM PAGE 46
49 PRELIMINARY ENERGY ASSESSMENT REPORT JUNE 212 NORTHSIDE ISD The following table summarizes the implementation costs, annual savings and simple payback for the above projects: SUMMARY OF ENERGY COST REDUCTION MEASURES Project Description Es timated Implementation Cost Es timated Annual Savings ($/yr) Estimated Annual MMBTU Savings (MMBTU/yr) Simple Payback (years) LOW WATTAGE T8 FLUORESCENT LIGHTING RETROFIT $779,5 $157,6 6, HID TO FLUORESCENT LIGHTING RETROFIT $216,8 $25,2 1, OUTDOOR HID SITE LIGHTING RETROFIT $341,8 $33,3 1, MOTION SENSOR INSTALLATION $241,5 $34,1 1, VFD INSTALLATION AT CHILLED WATER PUMPS $49, $59,6 2, VFD INSTALLATION AT AIR HANDLING UNITS $167,5 $15, VFD INSTALLATION AT COOLING TOWER FANS $11, $12, CHILLER REPLACEMENT $835, $36,8 1, COMMISSIONING (Cx) $1,525,8 $21,2 11, TOTAL: $4,77,9 $584,9 27, The above projects implementation costs and annual savings are estimated based on a preliminary examination of the facilities. Furthermore, detailed assessment, contingency & any project administration costs and maintenance savings are not included in this preliminary energy assessment. Final costs will be determined from detailed building assessments, engineering calculations, and contractor estimates Project design (drawings and specifications), if authorized, would normally be accomplished by professional engineers. Project acquisition (competitive bidding) would be in accordance with District requirements, and construction management would be provided by the engineering group who prepared the drawings and specifications. SCHOOLS/LOCAL GOVERNMENT ENERGY MANAGEMENT PROGRAM PAGE 47
50 PRELIMINARY ENERGY ASSESSMENT REPORT JUNE 212 NORTHSIDE ISD 12. FACILITY IMPROVEMENT MEASURES This section describes facility improvement measures that have energy savings opportunities but cannot be justified solely based on the potential energy savings. The following are the facility improvement measures recommended for the District. REPLACE HVAC SYSTEMS NEARING END OF USEFUL LIFE The District has several packaged rooftop air-conditioning units nearing the end of their useful life. The average age of these systems is 12 years old. The District should plan to replace these units in the next 3 to 4 years. Replacing these systems with new high efficiency units will have energy savings and help reduce maintenance costs. The HVAC systems nearing the end of their useful life consist of eight (8) packaged rooftop units totaling approximately 115 tons at Cable Elementary School. The table below shows the estimated cost for replacing the units. CAPITAL RETROFIT - HVAC REPLACEMENT Estimated Project Description Implementation Cost Cable Elementary $42,5 TOTAL $42,5 SCHOOLS/LOCAL GOVERNMENT ENERGY MANAGEMENT PROGRAM PAGE 48
51 PRELIMINARY ENERGY ASSESSMENT REPORT JUNE 212 NORTHSIDE ISD 13. ENERGY MANAGEMENT POLICY In order to establish an effective Energy Management Program, the District should have support from top management. An Energy Management Policy adopted by the school board sends a strong signal that energy management is an institutional priority. Northside ISD has an existing Board adopted energy management plan in place. It is recommended that the District periodically review the plan and update as needed to reflect current conditions. Also, following are key items that should be incorporated in the energy management plan: 1. ESTABLISH AN ENERGY MANAGEMENT STEERING COMMITTEE The Energy Management Steering Committee will include representatives from a cross section of the District. The steering committee will serve as a review board to evaluate all energy management recommendations before adoption and implementation. The steering committee will meet quarterly or semiannually to review the District s energy cost and consumption. Regular meetings will ensure the Districts goals are being met prior to the end of the year. 2. PROMOTE ENERGY AWARENESS The energy management steering committee members shall establish a program to publicize the District s energy goals and progress on a quarterly or semiannually basis. For example, student drawn posters of the District s energy savings can be placed in hallways. This will encourage student involvement and act as an educational tool. Continuous promotion of the District s goals will ensure the sustainability of the energy management program and help achieve further energy savings. 3. ESTABLISH A WATER MANAGEMENT PROGRAM Along with saving energy the District should establish a program to reduce water consumption. The following conservation measures should be employed. a. Investigate the use of water conserving faucets, showerheads, and toilets in all new and existing facilities. b. Utilize water-pervious materials such as gravel, crushed stone, open paving blocks or previous paving blocks for walkways and patios to minimize runoff and increase infiltration. c. Employ Xeriscaping, using native plants that are well suited to the local climate, that are drought-tolerant and do not require supplemental irrigation. d. Utilize drip irrigation systems for watering plants in beds and gardens. e. Install controls to prevent irrigation when the soil is wet from rainfall. f. Establish a routine check of water consuming equipment for leaks and repair equipment immediately. SCHOOLS/LOCAL GOVERNMENT ENERGY MANAGEMENT PROGRAM PAGE 49
52 PRELIMINARY ENERGY ASSESSMENT REPORT JUNE 212 NORTHSIDE ISD 14. FUNDING OPTIONS FOR UTILITY REDUCTION MEASURES Institutional organizations have traditionally tapped bond money, maintenance dollars, or federal grants to fund energy-efficient equipment change outs or additions such as energy-efficient lighting systems, high efficiency air conditioning units, and computerized energy management control systems. Today, a broader range of funding options are available. A number of these are listed below. Utility Sponsored Energy Efficiency Incentive Programs Many utilities in Texas offer energy efficiency incentive programs to offset a portion of the upfront cost associated with energy efficiency measures. The program requirements and incentives range from utility to utility. For example, at the time of this report, CPS Energy provides incentives for efficiency measures such as lighting upgrades ($.11/kWh and $231/kW of verifiable energy and demand reductions, respectively) or other custom energy saving applications ($.8 kwh and $2/kW of verifiable energy and demand reductions, respectively). For further information, contact the utility provider to determine what programs are available in your area. Texas LoanSTAR Program The LoanSTAR (Saving Taxes and Resources) Program, which is administered by the State Energy Conservation Office, finances energy-efficient building retrofits at a low interest rate (typically 3 percent). The program s revolving loan mechanism allows borrowers to repay loans through the stream of cost savings realized from the projects. Projects financed by LoanSTAR must have an average simple payback of ten years or less and must be analyzed in an Energy Assessment Report by a Professional Engineer. Upon final loan execution, the School District proceeds to implement funded projects through the traditional bid/specification process. Contact: Eddy Trevino (512/ ). Internal Financing Improvements can be paid for by direct allocations of revenues from an organization s currently available operating or capital funds (bond programs). The use of internal financing normally requires the inclusion and approval of energy-efficiency projects within an organization s annual operating and capital budget-setting process. Often, small projects with high rate of return can be scheduled for implementation during the budget year for which they are approved. Large projects can be scheduled for implementation over the full time period during which the capital budget is in place. Budget constraints, competition among alternative investments, and the need for higher rates of return can significantly limit the number of internally financed energyefficiency improvements. Private Lending Institutions or Leasing Corporations Banks, leasing corporations, and other private lenders have become increasingly interested in the energy efficiency market. The financing vehicle frequently used by these entities is a municipal lease. Structured like a simple loan, a municipal leasing agreement is usually a lease-purchase SCHOOLS/LOCAL GOVERNMENT ENERGY MANAGEMENT PROGRAM PAGE 5
53 PRELIMINARY ENERGY ASSESSMENT REPORT JUNE 212 NORTHSIDE ISD arrangement. Ownership of the financed equipment passes to the School District at the beginning of the lease, and the lessor retains a security interest in the purchase until the loan is paid off. A typical lease covers the total cost of the equipment and may include installation costs. At the end of the contract period the lessee pays a nominal amount, usually a dollar, for title to the equipment. Performance Contracting with an Energy Service Company Through this arrangement, an energy service company (ESCO) uses third party financing to implement a comprehensive package of energy management retrofits for a facility. This turnkey service includes an initial assessment by the contractor to determine the energy-saving potential for a facility, design work for identified projects, purchase and installation of equipment, and overall project management. The ESCO guarantees that the cost savings generated by the projects will, at a minimum, cover the annual payment due to the ESCO over the term of the contract. SCHOOLS/LOCAL GOVERNMENT ENERGY MANAGEMENT PROGRAM PAGE 51
54 APPENDICES
55 APPENDIX A ENERGY LEGISLATION (SB12, HB3693 AND SB3)
56 How to comply with SB12 & HB 3693 What you need to know about Texas Senate Bill 12 The passage of Senate Bill 12 (SB12) by the 8 th Texas Legislature signified the continuance of Senate Bill 5 (SB5), the 77 th Texas Legislature s sweeping approach in 21 to clean air and encourage energy efficiency in Texas. SB12 was enacted on tember 1, 27 and was crafted to continue to assist the state and its political jurisdictions to conform to the standards set forth in the Federal Clean Air Act. The bill contains energy-efficiency strategies intended to decrease energy consumption while improving air quality. All political subdivisions in the 41 non-attainment or near nonattainment counties in Texas are required to: 1) Adopt a goal to reduce electric consumption by 5 percent each year for six years, beginning tember 1, 27* 2) Implement all cost-effective energy-efficiency measures to reduce electric consumption by existing facilities. (Cost effectiveness is interpreted by this legislation to provide a 2 year return on investment.) 3) Report annually to the State Energy Conservation Office (SECO) on the entity s progress, efforts and consumption data. *Note: The recommended baseline data for those reporting entities will consist of the jurisdiction s 26 energy consumption for its facilities and based on the State Fiscal Year (tember 1, 26 to ust 31, 27). What you need to know about Texas House Bill 3693 The passage of House Bill 3693 (HB3693) by the 8th Texas Legislature is intended to provide additional provisions for energyefficiency in Texas. Adopted with an effective date of tember 1, 27, HB 3693 is an additional mechanism by which the state can encourage energy-efficiency through various means for School Districts, State Facilities and Political Jurisdictions in Texas. HB 3693 includes the following state-wide mandates that apply differently according to the nature and origin of the entity: Record, Report and Display Consumption Data All Political Subdivisions, School Districts and State-Funded Institutes of Higher Education, are mandated to record and report the entity s metered resource consumption usage data for electricity, natural gas and water on a publically accessible internet page. Note: The format, content and display of this information are determined by the entity or subdivision providing this information. Energy Efficient Light Bulbs All School Districts and State-Funded Institutes of Higher Education shall purchase and use energy-efficient light bulbs in education and housing facilities. Who must comply? The provisions in this bill will apply to entities including: Cities and Counties; School Districts; Institutes of Higher Education; State Facilities and Buildings. How do you define energy-efficiency measures? Energy-efficiency measures are defined as any facility modifications or changes in operations that reduce energy consumption. Energy-efficiency is a strategy that has the potential to conserve resources, save money** and better the quality of our air. They provide immediate savings and add minimal costs to your project budget. Examples of energy-efficiency measures include: installation of insulation and high-efficiency windows and doors modifications or replacement of HVAC systems, lighting fixtures and electrical systems installation of automatic energy control systems installation of energy recovery systems or renewable energy generation equipment building commissioning development of energy efficient procurement specifications employee awareness campaigns **SECO s Preliminary Energy Assessment (PEA) program is an excellent resource for uncovering those energy-efficiency measures that can benefit your organization. Appendix A-1
57 What counties are affected? All political jurisdictions located in the following Non-attainment and affected counties: Bastrop Bexar Brazoria Caldwell Chambers Collin Comal Dallas Denton El Paso Ellis Fort Bend Galveston Gregg Guadalupe Hardin Harris Harrison Hays Henderson Hood Hunt Jefferson Johnson Kaufman Liberty Montgomery Nueces Orange Parker Rockwall Rusk San Patricio Smith Tarrant Travis Upshur Victoria Waller Williamson Wilson What assistance is available for affected areas? The Texas Energy Partnership is a partner with ENERGY STAR, who partners across the nation with the goal of improving building performance, reducing air emissions through reduced energy demand, and enhancing the quality of life through energy-efficiency and renewable energy technologies. To assist jurisdictions, the Texas Energy Partnership will: Present workshops and training seminars in partnership with private industry on a range of topics that include energy services, financing, building technologies and energy performance rating and benchmarking Prepare information packages containing flyers, documents and national lab reports about energy services, management tools and national, state and industry resources that will help communities throughout the region Launch an electronic newsletter to provide continuous updates and develop additional information packages as needed Please contact Stephen Ross at for more information. SECO Program Contact Information LoanSTAR; Preliminary Energy Assessments: Eddy Trevino Eddy.Trevino@cpa.state.tx.us Schools & Local Govt. Partnership Program: Stephen Ross Stephen.Ross@cpa.state.tx.us Engineering (Codes / Standards): Felix Lopez Felix.Lopez@cpa.state.tx.us Innovative / Renewable Energy: Pamela Groce pam.groce@cpa.state.tx.us Energy / Housing Partnership Programs: Stephen Ross Stephen.Ross@cpa.state.tx.us Alternate Fuels / Transportation: Venita Porter Venita.Porter@cpa.state.tx.us Appendix A-2
58 Appendix A-3


59 Appendix A-4
60 APPENDIX B SAMPLE UTILITY DATA REPORTING FORM
61 Northside ISD - Sample Utility Input Form ELECTRICITY NATURAL GAS KWH COST Avg. Rate MCF COST Avg. Rate MONTH $ $/KWH $ $/MCF -1 3,2, ,813 $.775 6,31 $44,25 $ ,482, ,781 $.793 7,316 $5,23 $ ,929,6 226,44 $ ,367 $85,35 $ ,92, ,72 $.82 8,587 $62,5 $ ,322,98 265,44 $.798 4,525 $31,216 $ ,635, ,185 $.859 3,365 $25,596 $ ,41,41 381,316 $.866 2,766 $21,492 $ ,71, ,861 $.84 1,5 $7,94 $ ,675, ,938 $.848 1,25 $7,643 $ ,355, ,44 $.725 2,58 $18,312 $ ,426, ,546 $.729 2,996 $19,72 $ ,58, ,352 $.765 3,993 $26,859 $6.7 Total 41,94,75 $3,326,752 $ ,87 $4,489 $7. Gross Building Area: 3,331,91 SF Electrical Consumption (kwh) Monthly Electrical Consumption (kwh) and Consumption (kwh) 6,, 45, 4, 5,, 35, 4,, 3, 25, 3,, 2, 2,, 15, 1, 1,, 5, Natural Gas Consumption (MCF) 14, 12, 1, 8, 6, 4, 2, Monthly Natural Gas Consumption (MCF) and Consumption (MCF) $9, $8, $7, $6, $5, $4, $3, $2, $1, $ Appendix B-1
62 APPENDIX C BASE YEAR CONSUMPTION HISTORY
63 Energy Cost and Consumption Benchmarks Electric Natural Gas Total Total EUI ECI Building kwh/yr MMBTU/Yr kwh/sf $Cost/Yr MCF/Yr MMBTU/Yr MCF/kSF $Cost/Yr $Cost/Yr MMBTU/Yr kbtu/sf/yr $/SF/Yr SF 1 Colonies North Elementary 1,155,72 3, ,99 2,313 2, , ,44 6, ,822 2 Cable Elementary 991,8 3, ,135 1,825 1, ,23 93,338 5, ,657 3 Valley Hi Elementary 75,48 2, ,388 1,54 1, ,497 64,885 3, ,972 4 Hull Elementary 1,11,8 3, ,317 1,196 1, ,396 99,713 5, ,75 5 Cody Elementary 1,154,34 3, ,315 1,36 1, ,62 98,918 5, ,368 6 Timberwilde Elementary 1,87,296 3, ,764 1,16 1, ,793 17,557 4, ,482 7 Beard Elementary 1,338,912 4, ,45 1,475 1, ,325 16,775 6, ,98 8 Fisher Elementary 1,475,2 5, ,659 1,698 1, ,885 13,543 6, ,292 9 Driggers Elementary 1,228,5 4, ,787 1,591 1, ,251 11,38 5, ,511 1 Adams Hill Elementary 836,48 2, , ,743 71,89 3, , Ross Middle School 1,81,944 6, ,88 2,383 2, , ,475 8, , Garcia Middle School 2,289,6 7, ,144 3,491 3, ,47 215,614 11, , Jefferson Middle School 2,214,72 7, ,316 4,788 4, ,74 218,39 12, ,27 14 Jones Middle School 2,2,32 6, ,268 2,55 2, , ,914 9, , Pease Middle School 1,572, 5, ,976 2,491 2, , ,138 7, , O'Connor HS 5,192,996 17, ,86 5,27 5, , ,645 23, , Jay HS 4,615,84 15, ,458 5,838 6, ,78 377,166 21, ,8 18 Warren HS 5,284,168 18, ,76 5,593 5, , ,68 23, , Clark HS 3,793,32 12, ,326 7,835 8, ,116 36,442 21, ,747 2 Health Careers/Holmgreen HS 2,45,52 6, ,387 2,343 2, ,3 165,687 9, ,896 kwh/yr MMBTU/Yr kwh/sf $Cost/Yr MCF/Yr MMBTU/Yr MCF/kSF $Cost/Yr $Cost/Yr MMBTU/Yr kbtu/sf/yr $/SF/Yr SF 41,94,75 143, ,326,752 7,747 58, ,489 3,727,241 21, ,331,91 Appendix C-1
64 District: Northside ISD ACCOUNT# Electric Gas BUILDING: Colonies North Elementary FLOOR AREA: 78,822 estimated ELECTRICAL NATURAL GAS / FUEL DEMAND TOTAL ALL CONSUMPTION METERED CHARGED COST OF ELECTRIC CONSUMPTION TOTAL MONTH YEAR KWH KW KW DEMAND ($) COSTS ($) MCF COSTS ($) 21 52, $4, $1, , $5, $2, , $7, $3, , $6, $1, , $8, $1, , $9,61 18 $1, , $9,63 62 $ , $14,315 4 $ , $4, $ , $1, $1, , $8, $1, , $6, $1,229 TOTAL 1,155,72 $95,99 2,312.6 $15,946 Energy Use Index: Annual Total Energy Cost = 111,44 $/year Total site BTU's/Yr Total Area (SF) = 8 kbtu/sf/year Total KWH/yr x.3413 = 3, MMBTU/year Total MCF/yr x 1.3 = 2, MMBTU/year Energy Cost Index: Total Other x =. MMBTU/year Total Energy Cost/Yr Total Area (SF) = 1.41 $/SF/year Total Site MMBTU's/yr = 6,324 MMBTU/year Electric Utility: CPS Gas Utility: CPS/Grey Forest Utilities Appendix C-2
65 District: Northside ISD ACCOUNT# Electric Gas BUILDING: Cable Elementary FLOOR AREA: 79,657 estimated ELECTRICAL NATURAL GAS / FUEL DEMAND TOTAL ALL CONSUMPTION METERED CHARGED COST OF ELECTRIC CONSUMPTION TOTAL MONTH YEAR KWH KW KW DEMAND ($) COSTS ($) MCF COSTS ($) 21 69, 45 $5, $1, ,4 45 $3, $ ,6 45 $5, $3, ,8 45 $6, $2, ,2 45 $6, $1, ,2 483 $7, $ ,4 514 $1, $ ,2 514 $3,814 $ ,4 514 $3,64 $ ,4 522 $11, $ , 541 $8, $ ,2 418 $6,713 9 $855 TOTAL 991,8 $8,135 1,824.6 $13,23 * Natural Gas service not included in this summary. Energy Use Index: Annual Total Energy Cost = 93,338 $/year Total site BTU's/Yr Total Area (SF) = 66 kbtu/sf/year Total KWH/yr x.3413 = 3,385.1 MMBTU/year Total MCF/yr x 1.3 = 1, MMBTU/year Energy Cost Index: Total Other x =. MMBTU/year Total Energy Cost/Yr Total Area (SF) = 1.17 $/SF/year Total Site MMBTU's/yr = 5,264 MMBTU/year Electric Utility: CPS Gas Utility: CPS/Grey Forest Utilities Appendix C-3
66 District: Northside ISD ACCOUNT# Electric Gas BUILDING: Valley Hi Elementary FLOOR AREA: 55,972 estimated ELECTRICAL NATURAL GAS / FUEL DEMAND TOTAL ALL CONSUMPTION METERED CHARGED COST OF ELECTRIC CONSUMPTION TOTAL MONTH YEAR KWH KW KW DEMAND ($) COSTS ($) MCF COSTS ($) 21 46,8 311 $3, $ , $3, $1, ,8 311 $3, $2, ,8 311 $3, $1, , $4, $ , $5,24 45 $ , $7, $ , $4,578 $ , $4,45 $ , $7,15 34 $ , $5,821 4 $ , $4, $35 TOTAL 75,48 $57,388 1,54.2 $7,497 Energy Use Index: Annual Total Energy Cost = 64,885 $/year Total site BTU's/Yr Total Area (SF) = 62 kbtu/sf/year Total KWH/yr x.3413 = 2,47.56 MMBTU/year Total MCF/yr x 1.3 = 1,85.83 MMBTU/year Energy Cost Index: Total Other x =. MMBTU/year Total Energy Cost/Yr Total Area (SF) = 1.16 $/SF/year Total Site MMBTU's/yr = 3,493 MMBTU/year Electric Utility: CPS Gas Utility: CPS/Grey Forest Utilities Appendix C-4
67 District: Northside ISD ACCOUNT# Electric Gas BUILDING: Hull Elementary FLOOR AREA: 75,75 estimated ELECTRICAL NATURAL GAS / FUEL DEMAND TOTAL ALL CONSUMPTION METERED CHARGED COST OF ELECTRIC CONSUMPTION TOTAL MONTH YEAR KWH KW KW DEMAND ($) COSTS ($) MCF COSTS ($) 21 77,6 549 $6, $1, ,6 549 $4, $1, ,6 549 $6, $3, ,6 549 $6, $1, ,2 549 $6, $ ,6 56 $8, $ ,4 531 $12, $ ,8 619 $7, $ ,6 494 $3,795 8 $ , 77 $11, $ ,6 765 $1, $ ,2 566 $7,61 57 $388 TOTAL 1,11,8 $91,317 1,195.6 $8,396 Energy Use Index: Annual Total Energy Cost = 99,713 $/year Total site BTU's/Yr Total Area (SF) = 66 kbtu/sf/year Total KWH/yr x.3413 = 3, MMBTU/year Total MCF/yr x 1.3 = 1, MMBTU/year Energy Cost Index: Total Other x =. MMBTU/year Total Energy Cost/Yr Total Area (SF) = 1.32 $/SF/year Total Site MMBTU's/yr = 5,23 MMBTU/year Electric Utility: CPS Gas Utility: CPS/Grey Forest Utilities Appendix C-5
68 District: Northside ISD ACCOUNT# Electric Gas BUILDING: Cody Elementary FLOOR AREA: 85,368 estimated ELECTRICAL NATURAL GAS / FUEL DEMAND TOTAL ALL CONSUMPTION METERED CHARGED COST OF ELECTRIC CONSUMPTION TOTAL MONTH YEAR KWH KW KW DEMAND ($) COSTS ($) MCF COSTS ($) 21 75, $6,2 177 $1, , $5, $1, , $6, $3, , $5, $ , $6, $ , $9, $ , $9,94 5 $ ,8 376 $7,727 6 $ , $5,382 $ , $9, $ , $8,798 4 $ , $7, $594 TOTAL 1,154, $89,315 1,359.6 $9,62 Energy Use Index: Annual Total Energy Cost = 98,918 $/year Total site BTU's/Yr Total Area (SF) = 63 kbtu/sf/year Total KWH/yr x.3413 = 3, MMBTU/year Total MCF/yr x 1.3 = 1,4.39 MMBTU/year Energy Cost Index: Total Other x =. MMBTU/year Total Energy Cost/Yr Total Area (SF) = 1.16 $/SF/year Total Site MMBTU's/yr = 5,34 MMBTU/year Electric Utility: CPS Gas Utility: CPS/Grey Forest Utilities Appendix C-6
69 District: Northside ISD ACCOUNT# Electric Gas BUILDING: Timberwilde Elementary FLOOR AREA: 81,482 estimated ELECTRICAL NATURAL GAS / FUEL DEMAND TOTAL ALL CONSUMPTION METERED CHARGED COST OF ELECTRIC CONSUMPTION TOTAL MONTH YEAR KWH KW KW DEMAND ($) COSTS ($) MCF COSTS ($) 21 83, $6, $ ,2 551 $5, $ , $5, $1, ,8 551 $7, $1, , $8, $ , $1,78 79 $ , $12, $ , $5, $ , $4,981 5 $ , $11,86 39 $ ,4 622 $1, $ , $9, $581 TOTAL 1,87, $99,764 1,15.6 $7,793 Energy Use Index: Annual Total Energy Cost = 17,557 $/year Total site BTU's/Yr Total Area (SF) = 6 kbtu/sf/year Total KWH/yr x.3413 = 3,71.94 MMBTU/year Total MCF/yr x 1.3 = 1, MMBTU/year Energy Cost Index: Total Other x =. MMBTU/year Total Energy Cost/Yr Total Area (SF) = 1.32 $/SF/year Total Site MMBTU's/yr = 4,85 MMBTU/year Electric Utility: CPS Gas Utility: CPS/Grey Forest Utilities Appendix C-7
70 District: Northside ISD ACCOUNT# Electric Gas BUILDING: Beard Elementary FLOOR AREA: 96,98 estimated ELECTRICAL NATURAL GAS / FUEL DEMAND TOTAL ALL CONSUMPTION METERED CHARGED COST OF ELECTRIC CONSUMPTION TOTAL MONTH YEAR KWH KW KW DEMAND ($) COSTS ($) MCF COSTS ($) 21 97, $7, $ , $5, $1, , $7,37 33 $1, , $8, $2, , $9, $ ,64 59 $1, $ , $13, $ , $6,282 8 $ , $5,9 $ ,56 77 $13, $ , $1,235 5 $ , $9, $56 TOTAL 1,338, $97,45 1,474.7 $9,325 Energy Use Index: Annual Total Energy Cost = 16,775 $/year Total site BTU's/Yr Total Area (SF) = 63 kbtu/sf/year Total KWH/yr x.3413 = 4, MMBTU/year Total MCF/yr x 1.3 = 1, MMBTU/year Energy Cost Index: Total Other x =. MMBTU/year Total Energy Cost/Yr Total Area (SF) = 1.11 $/SF/year Total Site MMBTU's/yr = 6,89 MMBTU/year Electric Utility: CPS Gas Utility: CPS/Grey Forest Utilities Appendix C-8
71 District: Northside ISD ACCOUNT# Electric Gas BUILDING: Fisher Elementary FLOOR AREA: 15,292 estimated ELECTRICAL NATURAL GAS / FUEL DEMAND TOTAL ALL CONSUMPTION METERED CHARGED COST OF ELECTRIC CONSUMPTION TOTAL MONTH YEAR KWH KW KW DEMAND ($) COSTS ($) MCF COSTS ($) 21 99,6 564 $7, $1, , 564 $6, $1, ,4 564 $8,2 47 $3, , 564 $7, $1, ,2 564 $8, $ ,6 592 $1, $ ,2 773 $15,48 18 $ , 53 $1,95 8 $ ,6 466 $5, $ ,6 752 $14, $ ,8 742 $13,72 97 $ ,2 625 $9,91 18 $723 TOTAL 1,475, $118,659 1,697.7 $11,885 Energy Use Index: Annual Total Energy Cost = 13,543 $/year Total site BTU's/Yr Total Area (SF) = 64 kbtu/sf/year Total KWH/yr x.3413 = 5,34.86 MMBTU/year Total MCF/yr x 1.3 = 1, MMBTU/year Energy Cost Index: Total Other x =. MMBTU/year Total Energy Cost/Yr Total Area (SF) = 1.24 $/SF/year Total Site MMBTU's/yr = 6,783 MMBTU/year Electric Utility: CPS Gas Utility: CPS/Grey Forest Utilities Appendix C-9
72 District: Northside ISD ACCOUNT# Electric Gas BUILDING: Driggers Elementary FLOOR AREA: 91,511 estimated ELECTRICAL NATURAL GAS / FUEL DEMAND TOTAL ALL CONSUMPTION METERED CHARGED COST OF ELECTRIC CONSUMPTION TOTAL MONTH YEAR KWH KW KW DEMAND ($) COSTS ($) MCF COSTS ($) 21 76,5 556 $6, $ , $4, $1, ,5 556 $6, $3, , 556 $5,95 24 $1, , 556 $6,9 185 $1, , $8, $1, , $12, $1, ,5 57 $9, $ , $5, $ , 634 $14, $ , $9, $ , $7, $443 TOTAL 1,228, $98,787 1,591.3 $11,251 Energy Use Index: Annual Total Energy Cost = 11,38 $/year Total site BTU's/Yr Total Area (SF) = 64 kbtu/sf/year Total KWH/yr x.3413 = 4, MMBTU/year Total MCF/yr x 1.3 = 1,639.4 MMBTU/year Energy Cost Index: Total Other x =. MMBTU/year Total Energy Cost/Yr Total Area (SF) = 1.2 $/SF/year Total Site MMBTU's/yr = 5,832 MMBTU/year Electric Utility: CPS Gas Utility: CPS/Grey Forest Utilities Appendix C-1
73 District: Northside ISD ACCOUNT# Electric Gas BUILDING: Adams Hill Elementary FLOOR AREA: 57,155 estimated ELECTRICAL NATURAL GAS / FUEL DEMAND TOTAL ALL CONSUMPTION METERED CHARGED COST OF ELECTRIC CONSUMPTION TOTAL MONTH YEAR KWH KW KW DEMAND ($) COSTS ($) MCF COSTS ($) 21 5, $4,37 62 $ , $3, $ , $3, $1, , $4, $ ,8 36 $4,52 49 $ ,4 393 $6, $ ,2 48 $7, $ ,8 28 $5, $ ,8 356 $4, $ , 444 $8, $ ,6 426 $7, $ ,4 416 $5, $397 TOTAL 836, $67, $4,743 Energy Use Index: Annual Total Energy Cost = 71,89 $/year Total site BTU's/Yr Total Area (SF) = 62 kbtu/sf/year Total KWH/yr x.3413 = 2, MMBTU/year Total MCF/yr x 1.3 = MMBTU/year Energy Cost Index: Total Other x =. MMBTU/year Total Energy Cost/Yr Total Area (SF) = 1.26 $/SF/year Total Site MMBTU's/yr = 3,548 MMBTU/year Electric Utility: CPS Gas Utility: CPS/Grey Forest Utilities Appendix C-11
74 District: Northside ISD ACCOUNT# Electric Gas BUILDING: Ross Middle School FLOOR AREA: 146,521 estimated ELECTRICAL NATURAL GAS / FUEL DEMAND TOTAL ALL CONSUMPTION METERED CHARGED COST OF ELECTRIC CONSUMPTION TOTAL MONTH YEAR KWH KW KW DEMAND ($) COSTS ($) MCF COSTS ($) 21 14, $1, $2, , $9, $2, , $9, $4, , $1, $3, , $11, $1, , $14,7 18 $ , $17, $ , $8,72 8 $ , $6,52 $ ,6 854 $18, $ , $14, $ , $11, $559 TOTAL 1,81, $142,88 2,382.6 $16,595 Energy Use Index: Annual Total Energy Cost = 159,475 $/year Total site BTU's/Yr Total Area (SF) = 59 kbtu/sf/year Total KWH/yr x.3413 = 6,18.75 MMBTU/year Total MCF/yr x 1.3 = 2,454.8 MMBTU/year Energy Cost Index: Total Other x =. MMBTU/year Total Energy Cost/Yr Total Area (SF) = 1.9 $/SF/year Total Site MMBTU's/yr = 8,635 MMBTU/year Electric Utility: CPS Gas Utility: CPS/Grey Forest Utilities Appendix C-12
75 District: Northside ISD ACCOUNT# Electric Gas BUILDING: Garcia Middle School FLOOR AREA: 192,725 estimated ELECTRICAL NATURAL GAS / FUEL DEMAND TOTAL ALL CONSUMPTION METERED CHARGED COST OF ELECTRIC CONSUMPTION TOTAL MONTH YEAR KWH KW KW DEMAND ($) COSTS ($) MCF COSTS ($) ,16 1,48 $13, $2, ,4 1,48 $1, $2, ,84 1,48 $12,25 65 $4, ,68 1,48 $14, $6, ,4 1,48 $13, $2, ,96 1,116 $16, $2, ,64 1,138 $2, $1, , $17, $ ,44 1,44 $15,8 2 $ , 1,92 $19, $ ,44 1,214 $19, $1, , $14, $1,583 TOTAL 2,289, $189,144 3,49.6 $26,47 Energy Use Index: Annual Total Energy Cost = 215,614 $/year Total site BTU's/Yr Total Area (SF) = 59 kbtu/sf/year Total KWH/yr x.3413 = 7,814.4 MMBTU/year Total MCF/yr x 1.3 = 3, MMBTU/year Energy Cost Index: Total Other x =. MMBTU/year Total Energy Cost/Yr Total Area (SF) = 1.12 $/SF/year Total Site MMBTU's/yr = 11,41 MMBTU/year Electric Utility: CPS Gas Utility: CPS/Grey Forest Utilities Appendix C-13
76 District: Northside ISD ACCOUNT# Electric Gas BUILDING: Jefferson Middle School FLOOR AREA: 196,27 estimated ELECTRICAL NATURAL GAS / FUEL DEMAND TOTAL ALL CONSUMPTION METERED CHARGED COST OF ELECTRIC CONSUMPTION TOTAL MONTH YEAR KWH KW KW DEMAND ($) COSTS ($) MCF COSTS ($) ,52 1,16 $12, $2, ,76 1,16 $8, $3, ,96 1,16 $14, $5, ,16 1,16 $1, $6, ,68 1,13 $14, $2, ,76 1,16 $16, $1, ,84 1,182 $23, $2, ,6 7,772 $11, $2, ,6 566 $8,15 21 $1, ,64 1,25 $23, $3, ,36 1,63 $22, $2, ,84 1,5 $15,5 354 $2,518 TOTAL 2,214, $181,316 4,787.9 $37,74 Energy Use Index: Annual Total Energy Cost = 218,39 $/year Total site BTU's/Yr Total Area (SF) = 64 kbtu/sf/year Total KWH/yr x.3413 = 7, MMBTU/year Total MCF/yr x 1.3 = 4, MMBTU/year Energy Cost Index: Total Other x =. MMBTU/year Total Energy Cost/Yr Total Area (SF) = 1.11 $/SF/year Total Site MMBTU's/yr = 12,49 MMBTU/year Electric Utility: CPS Gas Utility: CPS/Grey Forest Utilities Appendix C-14
77 District: Northside ISD ACCOUNT# Electric Gas BUILDING: Jones Middle School FLOOR AREA: 159,759 ELECTRICAL NATURAL GAS / FUEL DEMAND TOTAL ALL CONSUMPTION METERED CHARGED COST OF ELECTRIC CONSUMPTION TOTAL MONTH YEAR KWH KW KW DEMAND ($) COSTS ($) MCF COSTS ($) , $1, $1, , $9, $2, , $1, $4, ,4 773 $11, $2, ,12 75 $12, $1, ,36 84 $14, $1, ,36 93 $19,66 95 $ , $1,36 $ ,8 531 $1,769 $ , $2, $1, , $15, $ , $12, $1,45 TOTAL 2,2, $156,268 2,549.8 $17,646 Energy Use Index: Annual Total Energy Cost = 173,914 $/year Total site BTU's/Yr Total Area (SF) = 59 kbtu/sf/year Total KWH/yr x.3413 = 6, MMBTU/year Total MCF/yr x 1.3 = 2, MMBTU/year Energy Cost Index: Total Other x =. MMBTU/year Total Energy Cost/Yr Total Area (SF) = 1.9 $/SF/year Total Site MMBTU's/yr = 9,46 MMBTU/year Electric Utility: CPS Gas Utility: CPS/Grey Forest Utilities Appendix C-15
78 District: Northside ISD ACCOUNT# Electric Gas BUILDING: Pease Middle School FLOOR AREA: 144,235 ELECTRICAL NATURAL GAS / FUEL DEMAND TOTAL ALL CONSUMPTION METERED CHARGED COST OF ELECTRIC CONSUMPTION TOTAL MONTH YEAR KWH KW KW DEMAND ($) COSTS ($) MCF COSTS ($) , $1, $1, , 692 $8, $2, , 692 $9, $5, , 692 $9, $2, , $1, $2, , 828 $12, $ , 768 $15, $ , 442 $8,18 2 $ , $7,141 1 $ , $14, $ , 651 $12, $ , 614 $1, $855 TOTAL 1,572, 84 $128,976 2,491.2 $17,162 Energy Use Index: Annual Total Energy Cost = 146,138 $/year Total site BTU's/Yr Total Area (SF) = 55 kbtu/sf/year Total KWH/yr x.3413 = 5, MMBTU/year Total MCF/yr x 1.3 = 2, MMBTU/year Energy Cost Index: Total Other x =. MMBTU/year Total Energy Cost/Yr Total Area (SF) = 1.1 $/SF/year Total Site MMBTU's/yr = 7,931 MMBTU/year Electric Utility: CPS Gas Utility: CPS/Grey Forest Utilities Appendix C-16
79 District: Northside ISD ACCOUNT# Electric Gas BUILDING: O'Connor HS FLOOR AREA: 369,949 ELECTRICAL NATURAL GAS / FUEL DEMAND TOTAL ALL CONSUMPTION METERED CHARGED COST OF ELECTRIC CONSUMPTION TOTAL MONTH YEAR KWH KW KW DEMAND ($) COSTS ($) MCF COSTS ($) ,265 1,947 $28, $3, ,282 1,947 $24, $5, ,518 1,947 $26,513 1,113 $8, ,221 1,947 $3,294 1,531 $11, ,926 1,947 $3, $2, ,667 2,152 $36, $1, ,59 2,398 $47, $1, ,16 1,491 $26, $ ,45 1,973 $33, $ ,756 2,513 $53, $ ,287 2,18 $41, $1, ,955 2,114 $34, $2,59 TOTAL 5,192, $413,86 5,26.8 $4,785 Energy Use Index: Annual Total Energy Cost = 454,645 $/year Total site BTU's/Yr Total Area (SF) = 62 kbtu/sf/year Total KWH/yr x.3413 = 17,723.7 MMBTU/year Total MCF/yr x 1.3 = 5,363. MMBTU/year Energy Cost Index: Total Other x =. MMBTU/year Total Energy Cost/Yr Total Area (SF) = 1.23 $/SF/year Total Site MMBTU's/yr = 23,87 MMBTU/year Electric Utility: CPS Gas Utility: CPS/Grey Forest Utilities Appendix C-17
80 District: Northside ISD ACCOUNT# Electric Gas BUILDING: Jay HS FLOOR AREA: 366,8 ELECTRICAL NATURAL GAS / FUEL DEMAND TOTAL ALL CONSUMPTION METERED CHARGED COST OF ELECTRIC CONSUMPTION TOTAL MONTH YEAR KWH KW KW DEMAND ($) COSTS ($) MCF COSTS ($) ,44 1,562 $24, $4, ,84 1,454 $2, $4, ,6 1,442 $21,23 1,471 $9, ,12 1,487 $25, $5, ,52 1,532 $26, $3, ,36 1,776 $31, $2, ,8 1,772 $38, $1, ,96 1,43 $26,15 8 $ ,24 1,471 $25,659 9 $ ,4 1,612 $36, $1, ,8 1,727 $34,7 256 $1, ,48 1,532 $26, $2,998 TOTAL 4,615, $337,458 5,837.9 $39,78 Energy Use Index: Annual Total Energy Cost = 377,166 $/year Total site BTU's/Yr Total Area (SF) = 59 kbtu/sf/year Total KWH/yr x.3413 = 15, MMBTU/year Total MCF/yr x 1.3 = 6,13.4 MMBTU/year Energy Cost Index: Total Other x =. MMBTU/year Total Energy Cost/Yr Total Area (SF) = 1.3 $/SF/year Total Site MMBTU's/yr = 21,767 MMBTU/year Electric Utility: CPS Gas Utility: CPS/Grey Forest Utilities Appendix C-18
81 District: Northside ISD ACCOUNT# Electric Gas BUILDING: Warren HS FLOOR AREA: 396,325 ELECTRICAL NATURAL GAS / FUEL DEMAND TOTAL ALL CONSUMPTION METERED CHARGED COST OF ELECTRIC CONSUMPTION TOTAL MONTH YEAR KWH KW KW DEMAND ($) COSTS ($) MCF COSTS ($) ,869 1,95 $3, $4, ,78 1,95 $25, $3, ,586 1,95 $26,752 1,223 $7, ,911 1,95 $3, $3, ,178 1,95 $31, $2, ,578 2,338 $39, $3, ,356 2,421 $49, $2, ,563 1,73 $32, $ ,345 1,921 $31, $1, ,425 2,341 $48, $3, ,574 2,423 $41, $1, ,75 2,275 $36, $2,995 TOTAL 5,284, $423,76 5,592.7 $37,992 Energy Use Index: Annual Total Energy Cost = 461,68 $/year Total site BTU's/Yr Total Area (SF) = 6 kbtu/sf/year Total KWH/yr x.3413 = 18,34.87 MMBTU/year Total MCF/yr x 1.3 = 5,76.48 MMBTU/year Energy Cost Index: Total Other x =. MMBTU/year Total Energy Cost/Yr Total Area (SF) = 1.16 $/SF/year Total Site MMBTU's/yr = 23,795 MMBTU/year Electric Utility: CPS Gas Utility: CPS/Grey Forest Utilities Appendix C-19
82 District: Northside ISD ACCOUNT# Electric Gas BUILDING: Clark HS FLOOR AREA: 382,747 ELECTRICAL NATURAL GAS / FUEL DEMAND TOTAL ALL CONSUMPTION METERED CHARGED COST OF ELECTRIC CONSUMPTION TOTAL MONTH YEAR KWH KW KW DEMAND ($) COSTS ($) MCF COSTS ($) ,379 1,43 $21,289 1,621 $9, ,85 1,43 $22,23 1,61 $1, ,952 1,43 $23, $3, ,441 1,462 $29, $4, ,518 1,476 $31,29 59 $4, ,28 1,456 $29, $2, ,214 1,239 $22, $1, ,893 1,523 $31, $1, ,442 1,587 $33,39 39 $2, ,91 1,563 $25, $1, ,237 1,355 $2, $3, ,77 1,27 $18, $5,163 TOTAL 3,793, $39,326 7,834.9 $51,116 Energy Use Index: Annual Total Energy Cost = 36,442 $/year Total site BTU's/Yr Total Area (SF) = 55 kbtu/sf/year Total KWH/yr x.3413 = 12, MMBTU/year Total MCF/yr x 1.3 = 8,69.95 MMBTU/year Energy Cost Index: Total Other x =. MMBTU/year Total Energy Cost/Yr Total Area (SF) =.94 $/SF/year Total Site MMBTU's/yr = 21,16 MMBTU/year Electric Utility: CPS Gas Utility: CPS/Grey Forest Utilities Appendix C-2
83 District: Northside ISD ACCOUNT# Electric Gas BUILDING: Health Careers/Holmgreen HS FLOOR AREA: 168,896 ELECTRICAL NATURAL GAS / FUEL DEMAND TOTAL ALL CONSUMPTION METERED CHARGED COST OF ELECTRIC CONSUMPTION TOTAL MONTH YEAR KWH KW KW DEMAND ($) COSTS ($) MCF COSTS ($) 21 2,16 61 $12, $1, ,8 61 $1, $1, , 78 $11, $3, , $12,65 44 $2, ,8 693 $12, $1, , $13, $1, , $15, $1, ,6 56 $9, $ , $6,923 7 $ ,28 71 $14, $ ,6 714 $14, $ , 737 $13, $1,17 TOTAL 2,45, $149,387 2,343.1 $16,3 Energy Use Index: Annual Total Energy Cost = 165,687 $/year Total site BTU's/Yr Total Area (SF) = 56 kbtu/sf/year Total KWH/yr x.3413 = 6, MMBTU/year Total MCF/yr x 1.3 = 2, MMBTU/year Energy Cost Index: Total Other x =. MMBTU/year Total Energy Cost/Yr Total Area (SF) =.98 $/SF/year Total Site MMBTU's/yr = 9,395 MMBTU/year Electric Utility: CPS Gas Utility: CPS/Grey Forest Utilities Appendix C-21
84 APPENDIX D ENERGY PERFORMANCE COMPARISON CHARTS
85 TEESI Database of Texas Schools Energy Performance Comparison Chart HIGH SCHOOLS Warren HS HIGH SCHOOLS Clark HS Jay HS Health Careers/ Holmgreen HS O'Connor HS EUI (kbtu/sf/yr) (The chart above is a comparison of EUIs based on sample data from TEESI s database of Texas Schools) Appendix D-1
86 TEESI Database of Texas Schools Energy Performance EUI Comparison Chart MIDDLE SCHOOLS MIDDLE SCHOOLS Pease MS Ross MS Garcia MS Jones MS Jefferson MS EUI (kbtu/sf/yr) (The chart above is a comparison of EUIs based on sample data from TEESI s database of Texas Schools) Appendix D-2
87 TEESI Database of Texas Schools Energy Performance Comparison Chart ELEMENTARY SCHOOLS ELEMENTARY SCHOOLS Cable Elementary Timberwilde Elementary Valley Hi Elementary Adams Hill Elementary Cody Elementary Beard Elementary Driggers Elementary Hull Elementary Fisher Elementary Colonies North Elementary EUI (kbtu/sf/yr) (The chart above is a comparison of EUIs based on sample data from TEESI s database of Texas Schools) Appendix D-3
88 APPENDIX E TYPICAL EQUIPMENT MAINTENANCE CHECKLISTS


89 Appendix E-1


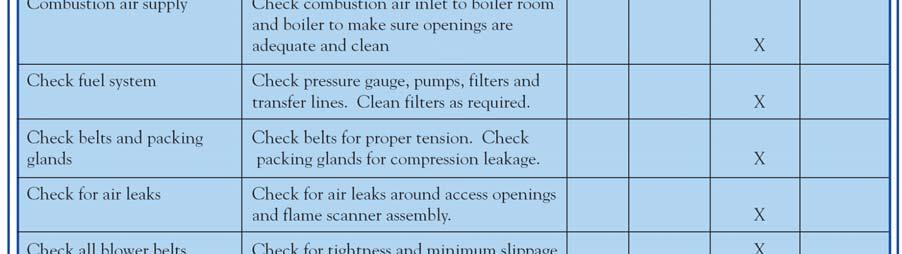

90 Appendix E-2


91 Appendix E-3


92 Appendix E-4


93 Appendix E-5


94 Appendix E-6


95 Appendix E-7
96 APPENDIX F LOANSTAR INFORMATION
97 Texas LoanSTAR Program FACTS ABOUT LoanSTAR The State of Texas LoanSTAR (Saving Taxes and Resources) Program finances energy efficient facility up-grades for state agencies, public schools, institutions of higher education, local governments, municipalities, and hospitals. The program s revolving loan mechanism allows participants to borrow money and repay all project costs through the stream of cost savings produced. ELIGIBLE PROJECTS Up-grades financed through the program include, but are not limited to, (1) energy efficient lighting systems; (2) high efficiency heating, ventilation and air conditioning systems; (3) energy management systems; (4) boiler efficiency improvements; (5) energy recovery systems; (6) building shell improvements; and (7) load management projects. The prospective borrower hires a Professional Engineer to analyze the potential energy efficient projects that will be submitted for funding through the Loan STAR Program. All engineering costs are covered under the program. PROGRAM REQUIREMENTS Once the projects are analyzed and the prospective borrower agrees with the recommended projects, the engineer prepares an Energy Assessment Report (EAR) with the project descriptions and calculations. The EAR must be prepared according to the LoanSTAR Technical Guidelines. The EAR is reviewed and approved by the State Energy Conservation Office (SECO) technical staff before project financing is authorized. Projects financed by LoanSTAR must have an average simple payback of ten years or less. Borrowers do, however, have the option of buying down paybacks to meet the composite ten-year limit. To ensure up-grade projects are designed and constructed according to the EAR, SECO performs a review of the design documents at the 5% and 1% completion phases. On-site construction monitoring is also performed at the 5% and 1% completion phases. SAVINGS VERIFICATION To ensure that the Borrower is achieving the estimated energy savings, monitoring and verification is required for all LoanSTAR funded projects. The level of monitoring and verifications may range from utility bill analysis to individual system or whole building metering depending on the size and type of retrofit projects. If whole building metering is required, metering and monitoring cost can be rolled into the loan. For additional information regarding the LoanSTAR program, please contact: Eddy Trevino SECO, LoanSTAR Program Manager (512) Appendix F-1
98 APPENDIX G BUILDING COMMISSIONING INFORMATION
99 BUILDING COMMISSIONING GENERAL INFORMATION Commissioning is common in all types of building systems, including heating, ventilating, and air-conditioning (HVAC), lighting, electric, and safety controls such as fire protection and security. Commissioning is available in many forms, the first of which is new construction commissioning. This type aims to construct a facility that obtains the performance and operation requirements of its occupants and owner, and begins during the pre-design portion of the project. If it is comprehensive commissioning, the process starts with the criteria for the facility s functionality, and constantly verifies this in all parts of the facility s creation, including design, construction, and building operation. Construction phase commissioning occurs when the Owner does not include commissioning requirements in the original design, and begins when construction is already underway. The second form is existing building commissioning, which is identified by two types. Retrocommissioning involves buildings that have never before been commissioned, and involves documenting methods to improve the building s systems and reach the original design intentions. It is an involved process starting with obtaining utility bills, talking to the building s occupants, performing diagnostic tests on the building, and preparing the information for the owner. The second type is re-commissioning, which is different from retro-commissioning in that the building s systems have previously had commissioning performed at some point, whether in the design or construction phases. However, it is similar to retro-commissioning because it arises from system performance problems or inadequacies. A more specific form of HVAC systems commissioning for existing building is Continuous Commissioning (CC ). Unlike the other forms, Continuous Commissioning ensures the optimization of HVAC systems for the building s existing conditions. It also works to improve the building air quality, increase comfort levels, and resolve any operating problems. When implemented, Continuous Commissioning can decrease energy usage by 2% on average 1. It is a joint effort between the commissioning engineers and the facility staff, and is an ongoing process that continues to both commission the building as well as train the facility staff. All of these forms of commissioning can be used to meet several of the requirements under the United States Green Building Council s (USGBC) Leadership in Energy and Environmental Design (LEED) rating system. The LEED rating system considers building commissioning to be an essential step towards sustainability. This is evident by the fact that many of the LEED rating systems (LEED-EB, LEED-NC, etc) require building commissioning as a pre-requisite. The scope of commissioning can involve a wide range of building systems, selectable by the building owner. Mechanical systems including HVAC systems, plumbing, piping, boilers, heaters, and valves can be commissioned. Electrical systems such as lighting, transformers, and lighting control is often included, as well as other systems like fire safety, security, and standby power systems. The costs of commissioning to the owner vary between forms, as well as from building to building. The cost per square foot (SF) of the facility to be commissioned may vary from 1 Continuous Commissioning Guidebook for Federal Energy Managers (Energy Systems Laboratory at Texas A&M University) Appendix G-1
100 $.4/SF to $2./SF. However, for typical new construction or renovation projects, the following lists the commissioning costs as percentages of each system cost. 2% to 3% of mechanical cost for Mechanical Systems (HVAC and controls) 2 1% to 2% of electrical cost for Electrical Systems 3.5% to 1.5% of construction cost for HVAC, controls, and light electrical There are many benefits to commissioning for the designer, the building s owner, and its occupants. HVAC systems simultaneously operate adequately, resulting in less expense during construction and after occupancy. Satisfied occupants also lead to increased productivity. Commissioning reviews decrease errors in the design phase, which ultimately reduces callbacks for the engineer. More efficient scheduling and design coordination reduce construction errors for the contractor, and thus reduces cost and keeps the project on schedule. Documentation helps prevent assumptions made during design, which reduces unnecessary expenditures. Selecting a commissioning service provider is a vital step in the process. First, the provider should be a certified commissioning professional by an industry accepted certification body (see sample certification bodies below). Next, the owner makes a formal request of the provider s qualifications in commissioning. An independent, third party commissioning provider is mostly recommended because they can objectively perform the work using practical experience. Other requirements for the provider include documentation, communication, and organization skills. This ensures the commissioning process is performed effectively. In addition, the earlier the commissioning authority can be implemented into the facility s construction or design, the more effective the process will be. END 2 Wilkison, R. (2) Establishing Commissioning Fees, ASHRAE Journal 42 (4): PECI, 2. The National Conference of Building Commissioning Proceedings, Portland Energy Conservation Inc. OR. Appendix G-2
101 APPENDIX H ENERGY STAR PORTFOLIO MANAGER REFERENCE MATERIAL
102 ENERGY STAR PORTFOLIO MANAGER REFERENCE MATERIAL TABLE OF CONTENTS CONTENTS Page No. TABLE OF CONTENTS... i INTROCUTION TO ENERGY STAR PORTFOLIO MANAGER... 1 LOGGING IN TO PORTFOLIO MANAGER... 2 ADDING A FACILITY/PROPERTY... 3 ADDING/EDITING SPACES... 4 ADDING/EDITING ENERGY METERS... 5 GENERATING A STATEMENT OF ENERGY PERFORMANCE... 7 SETTING ENERGY PERFORMANCE BASELINES AND TARGETS... 8 DELETING A FACILITY, SPACE, OR METER... 1 VIDEO TUTORIAL AND ONLINE HELP Appendix H-1 SCHOOLS/LOCAL GOVERNMENT ENERGY MANAGEMENT PROGRAM PAGE i
103 ENERGY STAR PORTFOLIO MANAGER REFERENCE MATERIAL INTRODUCTION TO ENERGY STAR PORTFOLIO MANAGER An entity s energy baseline can be developed using ENERGY STAR s Portfolio Manager. One of the primary reasons for using ENERGY STAR Portfolio Manager is its ability to normalize the baseline according to several key factors (i.e. Weather, Square Feet, Hours of Operation, Number of Computers, etc.). It is also a free online resource available to all registered users, and is a userfriendly web-based tool. ENERGY STAR is a joint program of the U.S. Environmental Protection Agency (EPA) and the U.S. Department of Energy (DOE). ENERGY STAR has developed Portfolio Manager, an innovative online energy management tool, designed to help organizations track and assess energy and water consumption of their facilities. Portfolio Manager helps organizations set investment priorities, identify under-performing facilities, verify efficiency improvements, and receive EPA recognition for superior energy performance. Portfolio Manger is also an energy performance benchmarking tool. Portfolio Manager rates a facility s energy performance on a scale of 1 1 relative to similar buildings and WWTPs nationwide. The rating system based on a statistically representative model utilizing a national survey conducted by the Department of Energy s Energy Information Administration. This national survey, known as the Commercial Building Energy Consumption Survey (CBECS), conducted every four years gathers data on building characteristics and energy use from thousands of buildings across the United States. A rating of 5 indicates that the facility, from an energy consumption standpoint, performs better than 5% of all similar facilities nationwide, while a rating of 75 indicates that the facility performs better than 75% of all similar facilities nationwide. In addition, Portfolio Manager is used to generate a Statement of Energy Performance (SEP) for each facility, summarizing key energy information such as site and source energy intensity, greenhouse gas emission, energy reduction targets and energy cost. The Statement of Energy Performance is required for applying for ENERGY STAR Recognition from EPA/DOE. If ENERGY STAR recognition is pursued, the SEP will need to be verified and certified by a qualified professional. Some facility types are not able to receive an ENERGY STAR rating. However, Portfolio Manager can still serve as a valuable tool for in tracking utility consumption and setting targets for performance of these facilities. To develop an entity s baseline, 12 months of utility consumption, cost data, and Building Space Use information is required. The following is reference materials that explain how to input this information as well as perform other basic tasks within Portfolio Manager. For further information, please visit ENERGY STAR S Portfolio Manager at: Appendix H-2 SCHOOLS/LOCAL GOVERNMENT ENERGY MANAGEMENT PROGRAM PAGE 1

104 LOGGING IN TO PORTFOLIO MANAGER ENERGY STAR PORTFOLIO MANAGER REFERENCE MATERIAL Log in to Portfolio Manager with user name and password. This will bring the user to the My Portfolio page, which includes a summary of the user s facilities. Website: Use this form to login to ENERGY STAR Portfolio Manager (or register for the first time). Figure 1: ENERGY STAR Portfolio Manager Homepage Appendix H-3 SCHOOLS/LOCAL GOVERNMENT ENERGY MANAGEMENT PROGRAM PAGE 2

105 ADDING A FACILITY/PROPERTY ENERGY STAR PORTFOLIO MANAGER REFERENCE MATERIAL If a facility does not already exist in Portfolio Manager, the user can use the Add a Property link to create an entry in Portfolio Manager for that single facility. Click the Add a Property selection located near the top of the main My Portfolio page, as seen in Figure 2. Click Add a Property to create an entry for a single facility. Figure 2: My Portfolio main page In Figure 3 below, check the type of property (i.e. a single facility, wastewater treatment plant, etc.) and enter basic information about the property, including facility name, facility details, and address. Click SAVE when completed. Enter basic information about the new facility (items required by Portfolio Manager are marked by a red asterisk). Figure 3: General Facility Information Appendix H-4 SCHOOLS/LOCAL GOVERNMENT ENERGY MANAGEMENT PROGRAM PAGE 3


106 ADDING/EDITING SPACES ENERGY STAR PORTFOLIO MANAGER REFERENCE MATERIAL From the Facility page, scroll to the Space Use tab (as seen in Figure 4 below) and click Add Space. Click Add Space to add a new space within a facility. Click Space Name to edit existing space. Figure 4: Adding/Editing a Space from the Facility page After clicking Add Space, Portfolio Manager will prompt the user to enter the Space Details, as seen below in Figure 5. They must be entered in correctly and accurately in order to be eligible for ENERGY STAR recognition. If ENERGY STAR recognition is not a primary goal, or if precise attribute values are initially unknown, default values may be used temporarily. These values can be edited at any time from the Facility main page (Figure 4) by clicking the assigned space name. Figure 5: Space attribute input Check this box if current attribute value is unknown. Appendix H-5 SCHOOLS/LOCAL GOVERNMENT ENERGY MANAGEMENT PROGRAM PAGE 4
. To edit an existing meter, click the meter name, as shown below. Click meter name to edit utility meter to a single facility.")
 to add to the energy meter, input the start date of the data to be entered")
107 ADDING/EDITING ENERGY METERS ENERGY STAR PORTFOLIO MANAGER REFERENCE MATERIAL From the Facility page, scroll to the Energy Meters section and click Add Meter (as seen in Figure 6). To edit an existing meter, click the meter name, as shown below. Click meter name to edit utility meter to a single facility. Click Add Meter to add a utility meter to a single facility. Figure 6: Adding an Energy Meter from the Facility page Select the number of entries (in months) to add to the energy meter, input the start date of the data to be entered (form the facility utility bill) and click CONTINUE. Figure 7: Configuring meter entries Appendix H-6 SCHOOLS/LOCAL GOVERNMENT ENERGY MANAGEMENT PROGRAM PAGE 5
, and click SAVE (see Figure 8).")
108 ENERGY STAR PORTFOLIO MANAGER REFERENCE MATERIAL Figure 9 shows a sample utility bill. Use this information to input monthly energy data (including start and end dates, energy use and cost), and click SAVE (see Figure 8). Figure 8: Entering energy data Enter correct billing period from the monthly utility bill. Enter monthly energy use data from utility bill. Enter monthly cost data from utility bill. Figure 9: Sample facility utility bill Appendix H-7 SCHOOLS/LOCAL GOVERNMENT ENERGY MANAGEMENT PROGRAM PAGE 6


109 ENERGY STAR PORTFOLIO MANAGER REFERENCE MATERIAL GENERATING A STATEMENT OF ENERGY PERFORMANCE A Statement of Energy Performance (SEP) is a required document in applying for ENERGY STAR recognition. It can also be used for purposes other than applying for ENERGY STAR, such as formalizing information regarding a facility s energy performance or energy and environmental performance impacts. Near the top of the Facility page, click Generate a Statement of Energy Performance, as shown below. Figure 1: Generating a Statement of Energy Performance from the Facility page Select reporting options for SEP as shown below, and click GENERATE REPORT. Select options for SEP. Click GENERATE REPORT. Figure 11: Setting up Statement of Energy Performance Appendix H-8 SCHOOLS/LOCAL GOVERNMENT ENERGY MANAGEMENT PROGRAM PAGE 7
.")
110 ENERGY STAR PORTFOLIO MANAGER REFERENCE MATERIAL SETTING ENERGY PERFORMANCE BASELINES AND TARGETS An energy Baseline Period for a facility is a 12-month period of complete energy data that can be compared to a facility s current energy performance. To set a baseline period for a particular facility, click Set Baseline Periods on the main facility page (as shown below). Figure 12: Setting a baseline period for a single facility from the Facility page Use the drop down menus to select an Energy Baseline Period to compare with the current period. Then click SAVE. This will establish the baseline period for the facility. This period can be changed as necessary. Enter ending month and year of desired 12- month baseline period. Figure 13: Setting a baseline period for a single facility Setting an Energy Performance Target for a single facility allows the user to select a desired energy use reduction goal. It can also provide the user with the amount of total energy use reduction required to obtain a particular ENERGY STAR rating. To set an Energy Performance Target for a particular facility, click Set Energy Performance Target on the main facility page (as shown below). Appendix H-9 SCHOOLS/LOCAL GOVERNMENT ENERGY MANAGEMENT PROGRAM PAGE 8
. Click the desired method, and specify a desired target (as seen below).")

111 ENERGY STAR PORTFOLIO MANAGER REFERENCE MATERIAL Figure 14: Setting an Energy Performance Target for a single facility from the Facility page The user can choose one of two methods to set an energy performance target: by ENERGY STAR rating or target reduction (%). Click the desired method, and specify a desired target (as seen below). Click RECALCULATE to view the Target Energy Use and Energy Cost Savings results set by the target, and click SAVE to keep the current target and return to the Facility page. Click this button and specify a target ENERGY STAR rating 1-1. Click this button and specify a target energy use reduction. Figure 15: Setting an Energy Performance Target for a single facility Appendix H-1 SCHOOLS/LOCAL GOVERNMENT ENERGY MANAGEMENT PROGRAM PAGE 9
, any spaces designated within the facility, and any Energy/Water meters.")

112 ENERGY STAR PORTFOLIO MANAGER REFERENCE MATERIAL DELETING A FACILITY, SPACE, OR METER Deleting a facility from Portfolio Manager will delete everything associated with that particular facility, including general information (address, year built, type of facility), any spaces designated within the facility, and any Energy/Water meters. To delete a facility, click Delete this Facility from Portfolio Manager on the Main Facility Page, as shown in Figure 16 below. Figure 16: Deleting a facility from the Facility page Deleting a space from within a facility will remove that single space from the Main Facility page, including any space attribute data associated with the space. To delete a single space from a facility, click Delete Space on the corresponding space from the Main Facility page, as shown in Figure 17 below. Deleting a meter from a facility will remove any data associated with the meter, including energy consumption and cost data. To delete a meter from a facility, click Delete Meter on the corresponding meter form the Main Facility page, as shown below. Click this to delete a single space. In this example, Sample Space Name will be deleted. Figure 17: Deleting a space or meter Facility page Click this to delete a single meter. In this example, Sample Meter 1 will be deleted. Appendix H-11 SCHOOLS/LOCAL GOVERNMENT ENERGY MANAGEMENT PROGRAM PAGE 1

113 VIDEO TUTORIAL AND ONLINE HELP ENERGY STAR PORTFOLIO MANAGER REFERENCE MATERIAL ENERGY STAR provides Step-by-Step video tutorials for benchmarking using Portfolio Manager. These videos can be found at the following link: In addition, ENERGY STAR provides a detailed HELP section online, as seen in Figure 18. Click the HELP link (found at the top of every Portfolio Manager page) for further assistance from ENERGY STAR. It can also be found at the following link: Figure 18: ENERGY STAR Portfolio Manager Help Section The information found in this section provides a wealth of information regarding operation of Portfolio Manager, including a glossary of terms, step-by-step tutorials, instructions for applying for ENERGY STAR recognition, and managing user accounts. It also includes a Search function, which allows the user to locate applicable Help topics. Appendix H-12 SCHOOLS/LOCAL GOVERNMENT ENERGY MANAGEMENT PROGRAM PAGE 11
Sample Energy Benchmarking Report
 Sample Energy Benchmarking Report SUBMITTED TO: Name Address City, State, Zip Phone SUBMITTED BY: Sample Program Address City, State, Zip Contact: Name Phone Email March 24 th, 2011 Sponsored by [Utility]
Establishing a Baseline, Energy Audits and Energy Star s Portfolio Manager
 Establishing a Baseline, Energy Audits and Energy Star s Portfolio Manager Glenn Barnes Environmental Finance Center University of North Carolina at Chapel Hill 919-962-2789 glennbarnes@sog.unc.edu Energy
Benchmarking EPA Portfolio Manager and Energy Star Certification
 Benchmarking EPA Portfolio Manager and Energy Star Certification 1 What is Benchmarking? Energy Benchmarking is the practice of comparing any given building to similar buildings for the purpose of evaluating
Deep Energy Savings in Existing Buildings
 Case Study Deep Energy Savings in Existing Buildings Overview Site Details Owner: 200 Market Associates Location: Portland, OR Building Type: Office, Mixed-use Project Description: Major Renovation Size
Energy Reduction Strategy Through 2020
 Through 2020 Revised: August 2017 Executive Summary Auburn University is a land, sea and space grant university established in 1856. The university consists of 11,629,000 square feet on 1,840 acres and
Example LEED-NC v2.1 Energy & Atmosphere Credit 1 Submittal
 Example LEED-NC v2.1 Energy & Atmosphere Credit 1 Submittal The following documentation provides an example submittal for the LEED-NC v2.1 Energy & Atmosphere Credit 1 (EAc1). This sample EAc1 submittal
Energy Benchmarking Report for Mill Pond Elementary School Lanoka Harbor, NJ
 Energy Benchmarking Report for Mill Pond Elementary School Lanoka Harbor, NJ (for the period: January 2006 through December 2008) Prepared by: Background & Findings The New Jersey Clean Energy Program
Reducing Costs with Energy Efficiency
 Reducing Costs with Energy Efficiency Presented to Pennsylvania Demand Side Response Working Group February 9, 2007 2/9/2007 1 Austin Energy Municipally-owned 700,000 population Area > 400 sq. miles Generation
Energy Benchmarking Report for LaMonte Elementary School Bound Brook, NJ
 Energy Benchmarking Report for LaMonte Elementary School Bound Brook, NJ (for the period: March 2007 through February 2009) Prepared by: Background & Findings The New Jersey Clean Energy Program (NJCEP)
Low-Hanging Fruit Simple Steps Toward Energy Effective Building Operations
 Low-Hanging Fruit Simple Steps Toward Energy Effective Building Operations Roger Ebbage Northwest Water / Energy Education Institute Lane Community College May 7-9 Enzian Inn - Leavenworth, Washington
Request for Proposals Town of Plymouth, New Hampshire
 1. General Information Request for Proposals Town of Plymouth, New Hampshire Building Energy Audits The Town of Plymouth is seeking bids for qualified individuals or firms to provide six (6) Building Energy
South Carolina Society for Hospital Engineers
 South Carolina Society for Hospital Engineers Selecting Energy Partners: Criteria & Pitfalls and the Top 10 Ways to Reduce Energy in a Hospital Presented by Jon Dierking, PE, CEM, LEED AP Director of Energy
No Cost/Low Cost Energy
 No Cost/Low Cost Energy Saving Strategies Randall D. Manteufel University of Texas at San Antonio Energy Efficiency in Local Government andschool Districts in the Border Region No Cost/Low Cost Relatively
Texas Tech University Energy Savings Program October 2010 Update
 Texas Tech University Energy Savings Program October 2010 Update The Texas Tech Energy Savings Update is being submitted in accordance with Governor s Executive Order RP 49, Electric Conservation by State
Integrated Energy Audit:
 Integrated Energy Audit: College of the Redwoods Prepared for: Pacific Gas and Electric Company Prepared by: KEMA Quality Assurance Check by: Charles Middleton (signature line) Copyright 2010 Pacific Gas
MOORESTOWN TOWNSHIP PUBLIC SCHOOLS GEORGE BAKER ELEMENTARY SCHOOL FACILITY ENERGY REPORT 139 WEST MAPLE AVENUE MOORESTOWN, NJ 08057
 MOORESTOWN TOWNSHIP PUBLIC SCHOOLS GEORGE BAKER ELEMENTARY SCHOOL 139 WEST MAPLE AVENUE MOORESTOWN, NJ 08057 FACILITY ENERGY REPORT Moorestown Township Public Schools George Baker TABLE OF CONTENTS I.
ENERGY AND WATER CONSERVATION AND DEMAND MANAGEMENT PLAN
 ENERGY AND WATER CONSERVATION AND DEMAND MANAGEMENT PLAN 2014 2019 CONTENTS EXECUTIVE SUMMARY... 3 1. CENTENNIAL COLLEGE - DISTRIBUTION OF ENERGY CONSUMPTION IN 2012... 4 1.1. Overview of Centennial College
The Mirenda Center for Sports, Spirituality, and Character Development
 prepared by: Zachary Heilman MECHANICAL OPTION prepared for: James Freihaut, PhD Technical Report 3: (Mechanical Systems Existing Conditions Evaluation) Due Date: November 29, 2010 The Mirenda Center for
ENERGY INITIATIVE ENERGY EFFICIENCY PROGRAM Impact Evaluation of Prescriptive and Custom Lighting Installations. National Grid. Prepared by DNV GL
 ENERGY INITIATIVE ENERGY EFFICIENCY PROGRAM Impact Evaluation of Prescriptive and Custom Lighting Installations National Grid Prepared by DNV GL Date: September 25, 2015 DNV GL www.dnvgl.com September,
Low Cost Building Automation System for Small- and Medium- Sized Commercial Buildings
 Low Cost Building Automation System for Small- and Medium- Sized Commercial Buildings Srinivas Katipamula, Ph.D. Staff Scientist, Pacific Northwest National Laboratory Other TAG Members: Irfan Rehmanji
ENERGY AUDIT. 123 Main Street Mississauga, Ontario. January 1, Report To: Mr. John Smith Smith Printing Company.
 Report To: Mr. John Smith Smith Printing Company ENERGY AUDIT 123 Main Street Mississauga, Ontario January 1, 2009 120 Carlton Street, Suite 212 Toronto, Ontario M5A 4K2 Tel 416-964-3246 Toll Free 1-866-964-3246
Conservation & Demand Management Plan
 Conservation & Demand Management Plan Nipigon District Memorial Hospital www.ndmh.ca 397-11: Phase 2 2014-07-04 1 Executive Summary The following Energy Conservation and Demand Management Plan is written
Marysville School District Resource Conservation Program. John Bingham Marysville S.D. Ray Burton Snohomish Co. P.U.D.
 Marysville School District Resource Conservation Program John Bingham Marysville S.D. Ray Burton Snohomish Co. P.U.D. Tools Resource Conservation Program Utility budget Utility tracking Benchmarking Load
Penn State AE Senior Thesis 2009
 Penn State AE Senior Thesis 2009 Project Overview Location Baltimore, MD Size 107,000SF/6 Stories Schedule March 2007 to September 2008 Cost $27.5 Million (Est.) Structure Cast in Place Post-Tension Concrete
BENCHMARKING & DISCLOSURE REPORT
 BENCHMARKING & DISCLOSURE REPORT DRAFT COPY SUBJECT PROPERTY: Property Name: Property Address: Property Type: Gross Square Footage (SF): Office 6 - Pre ECM 69 New Street New York, NY 10004 Office - Large
DTE Energy Commercial & Industrial Energy Optimization Program. Trade Ally Meeting. Guardian Plumbing & Heating January 20, 2011
 DTE Energy Commercial & Industrial Energy Optimization Program Trade Ally Meeting Guardian Plumbing & Heating January 20, 2011 Agenda Introduction DTE Energy Your Energy Savings Program Overview 2011 Program
A METHODOLOGY FOR REDUCING BUILDING ENERGY CONSUMPTION
 ME 164 Senior Capstone Design The Cooper Union Spring 2014 A METHODOLOGY FOR REDUCING BUILDING ENERGY CONSUMPTION Eric Leong Cooper Union New York, NY Advised by Prof. Melody Baglione Cooper Union New
Matt Gudorf UCI Energy Manager
 Matt Gudorf UCI Energy Manager UNIVERSITY OF CALIFORNIA, IRVINE Comprehensive research university 22,216 Undergraduate Students $330 million sponsored research 27 lab buildings operating 24/7 ~7.5 Million
Donna Independent School District. Energy Management Department
 Donna Independent School District Energy Management Department Supporting Staff Donna ISD Energy Management Department Urban Gonzalez Energy Management Director (Ext. 1419) Philip D. Waldron Energy Management
Green Ordinance Implementation City of Dallas, TX
 Green Ordinance Implementation City of Dallas, TX City of Dallas BUILDING INSPECTION DEPARTMENT Phase 1 Effective Date October 1, 2009 Applications for building permits Structure One ordinance amending
Building X Retrocommissioning Final Report
 Building X Retrocommissioning Final Report A study done by Portland Energy Conservation, Inc. (PECI) And Partner IMPORTANT NOTICE: This sample document is provided for instructional purposes only. CCC
Partner for Change : Energy
 11/8/217 Partner for Change - 218: Energy Practice Greenhealth Awards Probo.CI CEC_HOSPITAL no.35321 Partner for Change - 218: Energy Introduction The generation of energy from fossil fuels emits a range
GETTING TO EFFICIENT BUILDINGS
 GETTING TO EFFICIENT BUILDINGS Andy Robinson, SEDAC SEDAC + EPA Moraine Valley Community College Dec 2016 SEDAC GOALS FOR OUR CLIENTS: Save energy dollars Identify efficient equipment upgrades Identify
Cool Savings. The focus on cost reduction
 C A S E S T U D Y F O U R S E A S O N S P R O D U C E Cool Savings B Y N E L S O N L O N G E N E C K E R When David Hollinger started in 1976 with a few trucks and a 5,000 ft 2 warehouse, reducing costs
Sustainable Building Operations & Upgrades
 Sustainable Building Operations & Upgrades LEED for Existing Buildings 2010 Energy / Facilities Connections Conference Brightworks & Glumac Eric Baxter and Todd McGuire 12 May, 2010 The Value Proposition
AUDIT PROCESS. Preplanning. Audit Process
 An energy audit is a four-step process that includes the phases of planning, investigating, implementing, and sustaining. Thorough planning and careful action increase the chances of a successful energy
Recreation Centers of Sun City West R.H. Johnson Campus
 R.H. Johnson Campus SUN CITY WEST, AZ Renewable Energy System Feasibility Study Final Report February 21, 2014 4742 N. 24 th Street Suite 100 Phoenix, AZ 85016 (602) 429.5800 AEI Project No. 13180-00 Table
Advantages of Financing Continuous Commissioning As An Energy Conservation Retrofit Measure
 Advantages of Financing Continuous Commissioning As An Energy Conservation Retrofit Measure Guanghua Wei, P.E. Malcolm Verdict, C.E.M Joseph T. Martinez Energy Systems Laboratory, 3581 TAMU Texas A&M University
Walmart Energy. Image Area. September 2015
 Walmart Energy Image Area September 2015 Walmart Walmart Facilities Globally Total Retail Units as of July 31 2015 11,532 Walmart U.S. 4,588 Sam s Club 651 Walmart international 6,293 Walmart employees
IES Whole-Building Energy Model Baseline Energy Model Input/ Output Report. Duquesne University Rockwell Hall. Duquesne University smba
 IES Whole-Building Energy Model Baseline Energy Model Input/ Output Report Duquesne University Rockwell Hall For: By: Duquesne University smba Craig E. Stevenson James Construction Date: December 15, 2014
Mount Sinai Main Hospital Energy Conservation and Demand Management Plan
 Mount Sinai Main Hospital Energy Conservation and Demand Management Plan Leadership in Energy Efficiency Already at the top quartile of energy performance, Mount Sinai is working towards becoming one of
University of North Texas Denton Campus RP-49 Energy Conservation Plan for Facilities December 7, 2005
 University of North Texas Denton Campus RP-49 Energy Conservation Plan for Facilities December 7, 2005 Summary of Overall Strategy University of North Texas has been progressive in adopting energy efficiency
Permanent Load Shifting Program
 1. Program Description Permanent Load Shifting (PLS) can help reduce system peak load by storing energy produced during off-peak period and shifting electricity use from on-peak to off-peak periods on
NEW FOUR STORY MIXED USE RESTAURANT, RETAIL, LODGING, AND OFFICE BUILDING OWNER S PROJECT REQUIREMENTS
 NEW FOUR STORY MIXED USE RESTAURANT, RETAIL, LODGING, AND OFFICE BUILDING OWNER S PROJECT REQUIREMENTS TABLE OF CONTENTS Introduction Page 2 Project Description Page 2 Owner s Directives Page 4 Design
OPPORTUNITIES FOR ENERGY EFFICIENCY AND DEMAND RESPONSE IN CORRUGATED CARDBOARD MANUFACTURING FACILITIES
 OPPORTUNITIES FOR ENERGY EFFICIENCY AND DEMAND RESPONSE IN CORRUGATED CARDBOARD MANUFACTURING FACILITIES Sandra Chow BASE Energy, Inc. * San Francisco, CA 94103 Ahmad R. Ganji, Ph.D., P.E. San Francisco
PRESENTATION BY: Sean P. Murray Energy/Facility Use Manager St. Lucie County Public Schools. Art Munns Senior Project Engineer OCI Associates, Inc.
 PRESENTATION BY: Sean P. Murray Energy/Facility Use Manager St. Lucie County Public Schools Jason Smith, PE, LEED AP BD+C, CEM Principal / Dir. of Mech. Engineering OCI Associates, Inc. Art Munns Senior
Energy Efficiency Planning. June 30, 2009
 Energy Efficiency Planning at Genzyme June 30, 2009 Genzyme - A Global Corporation >11,000 employees worldwide Helping patients in 100 countries 17 manufacturing sites 9 genetic testing lab sites 19 major
Bryant University s Energy Guidelines for Sustainability
 Bryant University s Energy Guidelines for Sustainability Rising carbon emissions have a disruptive impact on global climate patterns and pose a risk to the security of communities around the world. The
New Jersey: K-12 Schools Energy Efficiency / PCB Training Webinar. U.S. Environmental Protection Agency (EPA) Region 2 December 15, 2011
 Region 2 December 15, 2011") New Jersey: K-12 Schools Energy Efficiency / PCB Training Webinar U.S. Environmental Protection Agency (EPA) Region 2 December 15, 2011 Presenters Juan Gutierrez EPA/R2, ENERGY STAR / Regional Coordinator
New Jersey: K-12 Schools Energy Efficiency / PCB Training Webinar U.S. Environmental Protection Agency (EPA) Region 2 December 15, 2011 Presenters Juan Gutierrez EPA/R2, ENERGY STAR / Regional Coordinator
ENERGY INVESTIGATION. Energy Investigation Organization
 Energy Investigation Organization A. Building Information, Energy Costs, and Energy Sources This section includes general questions about the school building, as well as questions about energy costs and
LEED Application Guide for Multiple Buildings and On-Campus Building Projects
 LEED Application Guide for Multiple Buildings and On-Campus Building Projects For Use with 2009 LEED Rating Systems for Design and Construction and Operations and Maintenance Released October 31, 2011
Energy Transformation & Green Buildings
 Energy Transformation & Green Buildings Trends Challenges and Opportunities 6th German American Energy Efficiency Conference Design meets Energy Efficiency Pearl Street direct current (DC) to 59 customers
2.2. Energy and Emissions
 section 2.2 Corporate Social Responsibility 2016 Environmental Program Energy and Emissions SAS Environmental Management Program assigns top priority to minimizing energy consumption and related emissions
BECOME A CARBON ZERO HEROTM. EYP/energy. Case Studies
 BECOME A CARBON ZERO HEROTM EYP/energy Case Studies ENERGY STAR Residential Light Fixtures for Colleges and Universities Cut School Costs Light fixtures bearing the ENERGY STAR label can help lower your
HOW TO GUIDE. Contents.
 HOW TO GUIDE Step-by-step instructions to use the U.S. EPA s Portfolio Manager to comply with the City of Seattle s Energy Benchmarking and Reporting requirements. Contents step 1 Get started... 1 step
Energy Study. Commercial Custom Design Program Retrofit Projects. November 2014
 Energy Study Commercial Custom Design Program Retrofit Projects November 2014 Table of contents 1.0 Energy Study Guide 2 1.1 Introduction 2 1.2 Eligibility requirements 2 1.3 General requirements 3 2.0
Monitoring of Energy Efficiency. Ricky Wong
 Monitoring of Energy Efficiency Ricky Wong World energy consumption is expected to almost double in the next 25 years Unique challenges Increasing demand Pollution Global warming Solutions Technologies
Centre for Addiction and Mental Health Queen Street Campus Energy Conservation and Demand Management Plan
 Centre for Addiction and Mental Health Queen Street Campus Energy Conservation and Demand Management Plan In Transition to Sustainable Infrastructure The Centre for Addiction and Mental Health is in the
UC STRATEGIC ENERGY PLAN
 UC STRATEGIC ENERGY PLAN University of California, Riverside FINAL Prepared for University of California Office of the President October 9, 28 Prepared by: Newcomb Anderson McCormick, Inc. 21 Mission Street,
The Low Hanging Fruit Energy Efficient Lighting
 The Low Hanging Fruit Energy Efficient Lighting John Noel, President Energy & Environment, LLC 2121-B Hollywood Rd., NW Atlanta, GA 30318 p.404.794.2023 john@energyandenvironment.com www.energyandenvironment.com
YWCA 1503 S. Denver Tulsa, Oklahoma 5/18/2010 Performed By
 Energy Audit for YWCA 1503 S. Denver Tulsa, Oklahoma 5/18/2010 Performed By 220 E. 8th Street Tulsa, Oklahoma 74119 918-582.0229 Fax: 918.599.0665 www.craftontullsparks.com Table of Contents Cover Page...
LAWRENCE BROOK ELEMENTARY SCHOOL 48 Sullivan Way, East Brunswick, NJ 08816
 EAST BRUNSWICK BOARD OF EDUCATION LAWRENCE BROOK ELEMENTARY SCHOOL 48 Sullivan Way, East Brunswick, NJ 08816 LOCAL GOVERNMENT ENERGY AUDIT PROGRAM FOR NEW JERSEY BOARD OF PUBLIC UTILITIES February 2016
EnOcean Technology and LEED Enabling Sustainability
 Rev A 2010-01-22 Prepared by Building Intelligence Group LLC: Paul Ehrlich, PE Jeffrey Seewald, PE (651) 204-0105 info@buildingintelligencegroup.com www.buildingintelligencegroup.com Building Intelligence
Conservation and Energy Management Program Update & ERIP Webinar
 Conservation and Energy Management Program Update & ERIP Webinar May 14, 2008 Lawrence Musyj, Director, Conservation and Energy Management AGENDA Welcome Webinar Instructions - Henri van Rensburg Update
Comprehensive Energy Audit For Sleetmute Community Center
 Comprehensive Energy Audit For Sleetmute Community Center Prepared For The Traditional Council of Sleetmute, and the Alaska Rural Utility Collaborative Apr 26, 2011 Prepared By: ANTHC 1901 Bragaw St. Suite
Optimizing Energy Use in a HealthCare Setting. Michael P. Della Barba Environmental Health & Engineering, Director of Commissioning
 Optimizing Energy Use in a HealthCare Setting Michael P. Della Barba Environmental Health & Engineering, Director of Commissioning AIA Quality Assurance The Building Commissioning Association is a Registered
ASHRAE Standard 90.1 App G, PHI and PHIUS+
 ASHRAE Standard 90.1 App G, PHI and PHIUS+ A NYSERDA Comparative Evaluation Study June 16, 2017 Governor Cuomo s strategy to build a clean, resilient and affordable energy system for all New Yorkers 2
Green Building Ordinance Overview
 Green Building Ordinance Overview September, 2013 City of Dallas Sustainable Development and Construction Dallas Green Ordinance 2008 Task Force Recommendations Two-phase implementation strategy Solution
COMMERCIAL LOAD ESTIMATING. Load Estimating Level 3: Block and Zone Loads. Technical Development Program
 COMMERCIAL LOAD ESTIMATING Load Estimating Level 3: Block and Zone Loads Technical Development Program Technical Development Programs (TDP) are modules of technical training on HVAC theory, system design,
GM Energy, Carbon, & Water Management. Al Hildreth, PE, CEM General Motors Company Energy Manager 16-May-2012 SPE Energy team
 GM Energy, Carbon, & Water Management Al Hildreth, PE, CEM General Motors Company Energy Manager 16-May-2012 SPE Energy team Energy, Carbon, & Water in Vehicle Manufacturing Resources used to make a Vehicle
Duke Energy Corporation
 Commercial Audit for Account: 12345-56789 Thank you for completing the Duke Energy Corporation Business Energy Check. We hope the information and recommendations provided will assist you in managing your
Progressive Design Concepts for the Evolving Learning Environment
 Progressive Design Concepts for the Evolving Learning Environment Learning Objectives 1. Understand how air movement can maximize energy savings and comfort in a range of educational applications. 2. Demonstrate
UC Berkeley HVAC Systems
 UC Berkeley HVAC Systems Title Case study report: David Brower Center Permalink Authors Bauman, Fred Webster, Tom Dickerhoff, Darryl et al. Publication Date 2011-04-01 Peer reviewed escholarship.org Powered
Green Works Objectives
 Green Works Objectives Preserve natural resources (energy, water, ecological) Promote environmentally-friendly lifestyles and business practices Reduce pollution and public health impacts Develop new economies
Energy Efficiency Solutions for Multifamily Housing. Clark Energy Group LLC
 Energy Efficiency Solutions for Multifamily Housing Clark Energy Group LLC 1 Agenda About Clark Energy Group Energy Service Company (ESCO) Overview ESCO Services Utility Rate Forecasts Making the Decision
Bullitt Center s Energy Performance
 Bullitt Center s Energy Performance Introduction In 2007 Congress created a Zero Net Energy Commercial Buildings Initiative with a goal of achieving a market transition to Zero Net Energy for new commercial
Benchmarking Your Building Using ENERGY STAR Portfolio Manager
 Benchmarking Your Building Using ENERGY STAR Portfolio Manager A step-by-step guide to completing an energy and water benchmarking in Portfolio Manager Portfolio Manager help, training webinars, and office
Energy Conservation at the University of Pittsburgh - FY2014 and Beyond
 Energy Conservation at the University of Pittsburgh - FY2014 and Beyond Energy Conservation has long been a priority in Facilities Management. Understanding the large impact of utility costs on the University
An ordinance amending Chapter 52, Administrative Procedures for the Construction Codes,
 6-28-11 ORDINANCE NO. An ordinance amending Chapter 52, Administrative Procedures for the Construction Codes, Chapter 53, Dallas Building Code, and Chapter 57, Dallas One- and Two-Family Dwelling Code,
United Illuminating Company and Connecticut Light & Power. Final Report, 2005 Coincidence Factor Study
 United Illuminating Company and Connecticut Light & Power, 2005 Coincidence Factor Study Prepared for: The Connecticut Energy Conservation Management Board and United Illuminating 157 Church Street New
Greenhouse Gas Emissions Inventory 2015
 Greenhouse Gas Emissions Inventory 2015 Introduction Measuring Greenhouse Gas & Climate Impact at Tulane Since 2006, Tulane University has conducted an annual Greenhouse Gas (GHG) emissions inventory,
George Bourassa, National Director, Commissioning Services Robert Bucey, Program Manager RETRO-COMMISSIONING
 George Bourassa, National Director, Commissioning Services Robert Bucey, Program Manager RETRO-COMMISSIONING AIA Quality Assurance Learning Objectives Demonstrate global results of the analysis of energy
Pope Science Hall Dwight Englewood School 315 East Palisade Avenue Englewood, NJ 07631
 Steven Winter Associates, Inc. 293 Route 18 South, Suite 330 Telephone (866) 676-1972 Building Systems Consultants East Brunswick, NJ 08816 Facsimile (203) 852-0741 www.swinter.com June 14, 2013 Local
DCAS Energy Management. August 15, 2014 Ellen Ryan & Mike Dipple
 DCAS Energy Management August 15, 2014 Ellen Ryan & Mike Dipple DCAS Energy Management Mission DCAS Energy Management (DEM) serves as the hub for City government s energy management. DEM provides energy
Energy Efficient Buildings: Realizing Money and Energy- Saving Opportunities
 January 10 th, 2013 Energy Efficient Buildings: Realizing Money and Energy- Saving Opportunities 1 Energy Efficient County Buildings: Realizing Money and Energy- Saving Opportunities Energy Efficient Buildings:
BUSINESS NEW CONSTRUCTION Energy Design Assistance Energy Efficient Buildings
 BUSINESS NEW CONSTRUCTION Energy Design Assistance Energy Efficient Buildings Add energy efficiency to your new construction plans Business New Construction is a FREE, comprehensive approach to energy
Underf loor For Schools
 The following article was published in ASHRAE Journal, May 2008. Copyright 2008 American Society of Heating, Refrigerating and Air-Conditioning Engineers, Inc. It is presented for educational purposes
Sustaining Our Operation in a Changing World. Michael Younis October
 Sustaining Our Operation in a Changing World Michael Younis October 16 2008 Business Case Energy Consumption Cook Clean Refrigerate Cost Escalation 2 nd largest conversion cost 5.5% CAGR Environmental
KEY FACILITIES METRICS SURVEY
 APPA & NACUBO KEY FACILITIES METRICS SURVEY A Gateway to Better Decision Making for Your Campus 2016 Five Key Metrics That Every Business Officer Should Know Sponsored by: Key Facilities Metrics... that
Saving Energy in The Food Service Industry. September 13, 2016
 Saving Energy in The Food Service Industry September 13, 2016 Webinar Sponsors With special thanks to Agenda Introductions Energy savings in food service Cooking equipment HVAC Lighting Utility incentives
Thermal Energy Storage
 This article was published in ASHRAE Journal, June 2013. Copyright 2013 ASHRAE. Posted at www.ashrae.org. This article may not be copied and/or distributed electronically or in paper form without permission
ELIAS BOUDINOT ELEMENTARY SCHOOL Pearl and Ellis Street, Burlington NJ 08016
 BURLINGTON CITY PUBLIC SCHOOLS ELIAS BOUDINOT ELEMENTARY SCHOOL Pearl and Ellis Street, Burlington NJ 08016 LOCAL GOVERNMENT ENERGY AUDIT PROGRAM FOR NEW JERSEY BOARD OF PUBLIC UTILITIES September 2014
Comprehensive Energy Audit For Kongiganak Health Clinic
 Comprehensive Energy Audit For Kongiganak Health Clinic Prepared For Native Village of Kongiganak September 15, 2011 Prepared By: ANTHC DEHE Energy Projects Group Anchorage, Alaska 99508 1 Table of Contents
BUILDING PERFORMANCE PARTNERSHIP PARTICIPANT HANDBOOK
 BUILDING PERFORMANCE PARTNERSHIP PARTICIPANT HANDBOOK Last Updated April 2012 TABLE OF CONTENTS Overview 1 Section 1 ENERGY STAR s Portfolio Manager (For Commercial Buildings) 2 Sharing Access to Portfolio
Energy Savings Made Simple
 Energy Savings Made Simple SWARM LOGIC FOR DEMAND MANAGEMENT EXCESSIVE COINCIDENCE LEADS TO HIGHER THAN NECESSARY PEAK DEMAND The issue at hand is a lack of system-wide coordination of HVAC loads, which
Home Built to LEED- H Silver Standards Monmouth County, NJ
 The project is one of three single-family homes built by Fluid Construction between 2006 and 2008, each built to an increasingly more robust green building standard. This home was built to LEED-H Silver
Persistence Tracking in a Retro-commissioning Program
 Persistence Tracking in a Retro-commissioning Program Mike Eardley Architectural Energy Corporation Synopsis The persistence of energy savings and electrical demand reductions created by retrocommissioning
Valley View Middle School
 Building at a Glance Valley View Middle School Location: Snohomish, Washington Owner: Snohomish School District Architect: Dykeman Civil Engineers: Harmsen & Associates, 2020 Engineers Mechanical/electrical
Energy and Environmental Analysis of Propane Energy Pod Homes
 Energy and Environmental Analysis of Propane Energy Pod Homes July 2011 Prepared for the Propane Education & Research Council by Newport Partners LLC About the Authors This research project was conducted