#10 Navigation Economic System Modeling
|
|
|
- Melinda Hensley
- 5 years ago
- Views:
Transcription


1 INLAND NAVIGATION ECONOMICS WEBINAR SERIES #10 Navigation Economic System Modeling Buddy Langdon Planning Regional Technical Specialist Navigation CELRH-NC / PCXIN Huntington, WV 24 April 2013 US Army Corps of Engineers
 Navigation Component Engineering Reliability (Gabriela Lyvers) Elasticity of Demand (Mike Hilliard) Vessel Operating Costs - Inland (Gabe Stala) Corps")
2 Inland Navigation Economics 101 (Mark Hammond) Transportation Rate Analysis & Externalities (Lin Prescott) Navigation Data Resources (Dick Ash) Waterborne Traffic Demand Forecasting (Wes Walker) Lock Capacity & Engineering Reliability (Mark Lisney) Navigation Component Engineering Reliability (Gabriela Lyvers) Elasticity of Demand (Mike Hilliard) Vessel Operating Costs - Inland (Gabe Stala) Corps Inland Navigation Mission Provide a safe, reliable, efficient, and environmentally sustainable waterborne transportation system for movement of commerce, national security needs, and recreation. Six Step Planning Process 1 Identify Problems & Opportunities Inland Shallow Draft 2 Inventory & Forecast Critical Resources 3 Formulate Alternative Plans 4 Evaluate Alternative Plans 5 Compare Alternative Plans 6 Select Recommended Plan 2
3 Outline q Inland Shallow-Draft Navigation Economic Modeling Background, History, & Guidance q Model Calculations (NIM) q Outputs 3
4 Background : Inland Shallow-Draft Navigation Development History q Founded on framework established in the 1950 s. q First model North Central Division for the Illinois Waterway in the 1960 s. q Simulation Models TOWGEN / WATSIM à WATSIM IV s. q Inland Navigation Systems Analysis (INSA) Coordination Group within the Office of the Chief of Engineers (OCE) (WAM, Flotilla, Commodity Flow, Multi-Modal) q Transportation Systems Center of the U.S. DOT sponsored model expansion in 1977 of the Flotilla Model for user charges, called Waterway Cost Model. q Waterway Cost Model evolved to Tow Cost Model (TCM) & Marginal Economic Analysis Model (MEA) by Huntington District. q Tow Cost / Equilibrium (TC/EQ) model mid-1980s. q ERDC modified the Waterways Analysis Model (WAM) q ORNL TC/EQ Model à Java object oriented NIM , added relational database management (C++) , modified for Upper Ohio analysis (C#) , HQ Corporate certification 14 Feb 2012, modified for Bayou Sorrel alternative waterway routing equilibrium
5 Background : Inland Shallow-Draft Navigation Application History q TCM/MEA & TC/EQ Models (and WAM) ü Gallipolis (1982) online Jan 1993 ü William Bacon Oliver (1986) online 1991 ü Gray s Landing & Point Marion (1986) Monongahela River on line June 1995 / Sept 1994 ü Winfield (1986) online November 1997 ü London (1998) online July 2003 ü Marmet (Dec 1993 & May 1996) online Jan 2008 ü McAlpine (Aug 1994 & 1996) online May 2009 q Olmsted (April 1985 & Oct 1990) under construction q Markland (Aug 1999) under construction q Kentucky (1992 & 1996) under construction q Lower Monongahela (1992, 1994) under construction q Upper Tennessee Recon (1991) & Feasibility (1993) q TCM vs GEM (1986), Comparison to ESSENCE (----) q NIM & WAM q ORMSS-SIP (May 2006) q Greenup (April 2000 & June 2006) q Myers (April 2000) under construction q Olmsted (May 2008) under construction q NIM 5.3 & WAM q Upper Ohio Navigation Study (in review) q Calcasieu Lock (underway) q NIM 5.4 & WAM q Bayou Sorrel Lock (underway) q Greenup Locks (underway) 5


6 Background : Analysis Guidance NED benefits are defined as increases in the net value of the national output of goods and services, expressed in monetary units 6

7 Background : Analysis Guidance Done in a system context! 7

8 Background : Analysis Guidance 8

9 Background : Analysis Guidance 9
10 Navigation Investment Model (NIM) Description System Economic Model spatially-detailed partialequilibrium period-based (annual) waterway movement transportation cost & equilibration model given a defined waterway system. Calculations include infrastructure service reliability (results are expected values) Calculates & summarizes benefits & costs over a life cycle Benefits are a function of barge transportation demands, barge transportation characteristics, waterway characteristics (lock capacity & reliability, taxes, towsize limits, vessel costs, etc), and shipper willingness-topay for barge transportation (e.g., least-cost all-overland rate) Costs are a function of investment costs and condition (scheduled & unscheduled / probabilistic repair costs) Optimizes investments for the system What component, rehab, or new construction When year Where by lock site 10
11 NIM Sectorial, Spatial, & Temporal Simplifying Assumptions q Incremental transportation investment changes to the waterway transportation system can be analyzed under a spatially detailed partial-equilibrium waterway transportation cost & equilibrium model framework. q Link only traffic experiences and creates no congestion effects; traffic not moving through a lock (intra pool traffic) is inconsequential to the analysis of lock investments. Non-lock traffic flows are not modeled. q Annual simulation of movements and av. costs & system equilibrium provides adequate cost-benefit analysis of ORS investments, assuming: a) shipments are scheduled well in advance with a carrier motive to fully employ their transportation equipment (with scheduled waterway system service disruption events scheduled 2 years in advance through Notice to Navigation process); b) insignificant seasonal variation; and c) unscheduled service disruptions are uniformly distributed throughout the year. q All shipments of all movements are assumed to experience the same av. transit time through a constraint node. There is no seasonal variation beyond the seasonal variation endogenous to the tonnage-transit curve. In short, the model actually assumes that any seasonal variation in the tonnage-transit curve remains constant through time, tonnage level, and tonnage mix. q Assumptions regarding the level of resolution for the waterway transportation network is user specified. Typically only one or two pick-up / drop-off nodes are assigned to each navigation pool. q Assumptions regarding the level of resolution for movement commodity, barge type, & towboat class is user specified. 11


12 NIM Sectorial, Spatial, & Temporal Simplifying Assumptions 12
 12 barge types. 8 towboat classes.")
13 NIM Sectorial, Spatial, & Temporal Simplifying Assumptions 171 ports. 56 navigation projects (ORS). Link-Node Network (granularity user defined) 12 barge types. 8 towboat classes. 9 commodity types 16,948 unique origin-destination-commodity-barge mvts. 13
14 NIM Barge Transportation (movement) Demand Assumptions q Technology assumptions are user defined through the traffic demand forecasts. Typically it is assumed in the forecasted demand development that technology is fixed at the time of the analysis, however, the economic and population growth rates, and environmental policies are often varied between forecast scenarios. q Waterway forecasted demand (whether defined as inelastic or elastic) represents future waterway traffic given the endogenous technology assumptions, current water transportation cost and current land transportation cost. Since the model is calibrated to the current shipping-plans and a current waterway transportation cost is calculated from which to determine waterway transportation price change (into the future and between different system performance characteristics), the demands should be based on the current water and land transportation costs. q Unmet waterway barge transportation demand can be assumed to be transported overland at the long-run least-costly all-overland rate. This assumption is based on the assumptions that: q any waterway diverted traffic to the land modes would represent a insignificant increase in the land transportation tonnage; and q land mode utilization in the future will approximate current utilization rates (i.e. land transportation capacity will grow with land transportation demand). 14
15 NIM Barge Transportation (movement) Demand Assumptions (continued) q Waterway movement demand can be defined by the user as either fixed quantity (inelastic) or price-responsive (elastic). q For fixed quantity (inelastic) demand movements, the willingness-to-pay for barge transportation is assumed fixed through time (unaffected by demand or land congestion). The proxy for the fixed demand willingness-to-pay is typically set as the least-costly all-overland transportation rate (noting that this value is externally derived and input to the model by the user). q For price-responsive (elastic) demand movements, we have sufficient exogenous information to allow a unique demand curve to be calculated. The exogenous forecasted tonnage for each movement for each year corresponds to the given long-run least-costly all-overland rate, which establishes one point on each demand curve. 15
16 NIM Equilibrium Assumptions q Shippers decisions on waterway movement volume are determined by an economic equilibrium based on an annual cost of waterway transportation and an annual cost-demand relationship (demand function) assigned to the movement. As discussed under the movement demand assumptions, this cost-demand relationship can either be defined by the user as fixed or elastic. q When multiple scheduled closures occur in a given year at a lock, the closures are assumed to be spaced far enough apart for queues to dissipate to normal levels before the next closure occurs. The model combines the service disruption tonnage-transit curves. q The supply of land transportation for feeder legs of the waterway routing are perfectly elastic at the given long-run base rate. Only congestion changes on the waterway leg are considered in the equilibrium process. q Shippers have complete knowledge of annual waterway transportation prices which incorporates the cost of scheduled lock closures. Shippers do not estimate or consider expected costs for unplanned closures; they are not risk adverse and they do not have knowledge of unscheduled service disruption probability or transportation cost effects. 16
17 NIM Equilibrium Assumptions q Individual shippers will not restrict waterway usage to the social optimal level, but will continue to expand waterway volumes to the level at which their average towing costs equal their marginal ratesavings (ATC = MRS). This occurs because each individual carrier pays only its own average cost for moving on the waterway system, not the true marginal costs, which include the costs imposed on all shippers. q Each movement is considered to be continuously divisible (i.e. tonnage values are not limited to discrete barge loads or full tow configurations). q Equilibrium in a year is independent of preceding year equilibrium (i.e. movements can change transportation mode each year). Note that scheduled and unscheduled service disruption is not independent from one year to the next and that equilibrium is a function of scheduled service disruption and that equilibrium is probabilistically adjusted (not determined) for unscheduled service disruptions. q Unmet equilibrium waterway demand can be assumed to be transported overland at the long-run least-costly all-overland rate (note that this is not the same as traffic diverted during unscheduled service disruption). 17
18 NIM Reliability Assumptions q Survivability of all components is assumed to the user defined analysis base year (decision point). q Components are assumed independent and fail independently of each other. Note however, that with event-tree state change option the user can lump components into a model-level component and thus model joint components. q Components can only fail once in a year, however, multiple reliability closures from different components are allowed to occur in a year. q When multiple reliability closures (from different components) occur in a given year at a lock, the closures are assumed to be spaced far enough apart for queues to dissipate before the next closure occurs. The model combines the service disruption tonnage-transit curves. 18
19 NIM Unscheduled Service Disruption Assumptions q Equilibrium traffic levels are determined with shipper knowledge of scheduled service disruption but without knowledge of unscheduled service disruption probabilities q When calculating the impacts of an unscheduled service disruption event, equilibrium traffic can be diverted from the waterway because the traffic level exceeds the annual capacity of the lock with the outage, or because movements have been defined with a river closure diversion response. q Unscheduled service disruption over capacity tonnage diversion is assumed to move at the long-run least-costly all-overland rate (and not at the river closure response diversion rate). q Unscheduled river closure service disruption tonnage diversion is assumed to move at a user specified spot-rate. q Except for unscheduled over capacity diversion and / or river closure response diversion, equilibrium traffic will be assumed to move on the waterway at a higher unscheduled service disruption lock transit time (as specified in the service disruption tonnage-transit curve). q Movement river closure diversion response percentage assumed constant through time and between forecast scenario. 19
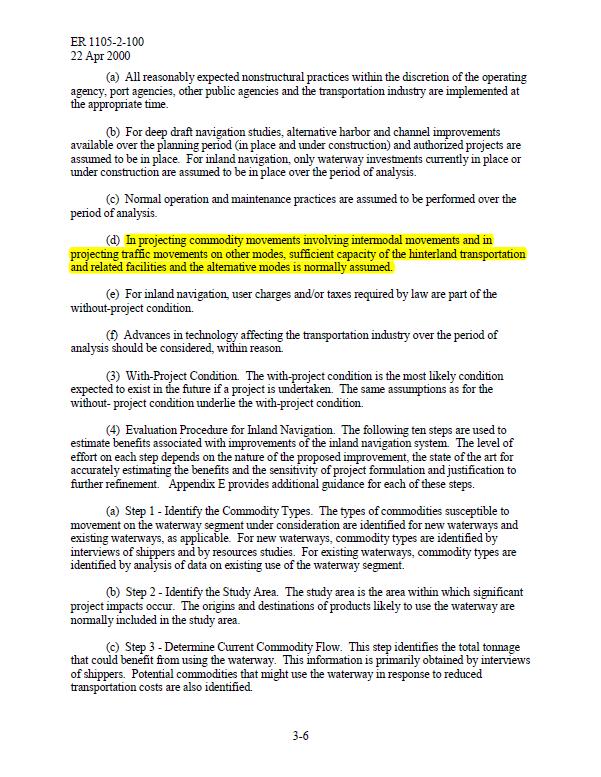
20 Adjustment for Unscheduled Service Disruption Average Transit (hours/tow) Service disruption e ( nn -days) Service disruption e ( n -days) Normal Operations (both chambers open) Millions of Tons 20
21 Adjustment for Unscheduled Service Disruption Transit Time Adj. no traffic diversion. Average Transit (hours/tow) Service disruption e ( n -days) Service disruption e ( nn -days) Pt. C (36M Tons, hours/tow) Pt. B (36M Tons, hours/tow) Millions of Tons Normal Operations (both chambers open) Pt. A (36M Tons, 9.57 hours/tow) 21
22 Adjustment for Unscheduled Service Disruption Transit Time Adj. no traffic diversion (multiple events in same year). Average Transit (hours/tow) Service disruption e ( n -days) Service disruption e ( nn -days) Pt. D (36M Tons, hours/tow) Pt. C (36M Tons, hours/tow) Pt. B (36M Tons, hours/tow) Normal Operations (both chambers open) Pt. A (36M Tons, 9.57 hours/tow) Millions of Tons 22
23 Adjustment for Unscheduled Service Disruption Transit Time Adj. no traffic diversion vs. over capacity diversion. Average Transit (hours/tow) Service disruption e ( n -days) Pt. C (37.5M Tons, 50.0 hours/tow) Service disruption e ( nn -days) Pt. B (41M Tons, hours/tow) Normal Operations (both chambers open) Pt. A (41M Tons, 16.2 hours/tow) Millions of Tons (annual) 23
24 Adjustment for Unscheduled Service Disruption Transit Time Adj. at adjacent project. 60 Average Transit (hours/tow) Normal Operations (both chambers open) Pt. B (45M Tons, 31.0 hours/tow) Pt. C (43M Tons, hours/tow) Pt. A (46M Tons, hours/tow) Millions of Tons (annual) 24
25 Adjustment for Unscheduled Service Disruption LRM Service Disruption Event probabilities System Equilibrium Statistics given known Average Towing Cost Adjustment 1 River Closure Response Traffic Adjustment Adjustment 2 RCR Diversion Transportation Cost Calculation Adjustment 3 RCR Diversion Externality Cost Calculation Adjustment 4 Over Capacity Traffic Adjustment Adjustment 5 OC Diversion Transportation Cost Calculation Adjustment 6 Waterway Transportation Cost Recalculation, no diversion Adjustment 7 Waterway Transportation Cost Recalculation, with diversion Adjustment 8 Expected Waterway Transportation Costs EXPECTED Equilibrium Statistics 25
26 Navigation Investment Model (NIM) Process Traffic Demand Models Traffic & Willingness Demand Models to Pay & Models Willingness to Pay Models Waterway Analysis Waterway Model Analysis (WAM) Model (WAM) Engineering Reliability Engineering Models Reliability Models Movement Data Sys. Perf. Characteristics & Costs Sys. Perf. Characteristics & Costs NIM NIM WITHOUT- SYSTEM PROJECT EQUILIBRIUM CONDITION WITH-PROJECT CONDITION Cost-Benefit Analysis 26
27 Navigation Investment Model (NIM) Primary Modules System Characteristics Traffic Char. & Demands Reliability Data WSDM EQ Traffic Levels LRM Investment Plan Optimization Reliability Estimates 27
28 While there are three primary modules, the model is much more complex. The model structure is best described and understood through the following nine separable modules: Water Supply and Demand Module (WSDM) Calibration Sub-Module (Calibrate.exe) Equilibrium Sub-Module (WSDM.exe) Set-Up Component Alternatives and Runs Module Generate All Component Replacements Sub-Module (GenAllCompRep.exe) Generate Component Replacement Curve Sets Sub-Module (GenCompReplaceCurveSet.exe) Build Transit Time Curve Set Sub-Module (BuildTransitTimeCurveSet.exe) Copy Run Sub-Module (CopyRun.exe) Lock Risk Module (LRM.exe and runlrm.exe) Summarize Closures Module (SummClosures.exe) Optimization Module (ORNIMOptim.exe) Build Investment Plan Module (BuildInvestmentPlan.exe) Build Investment Plan Closures Module (BuildInvestmentPlanClosure.exe) Calculate Costs Module (CalculateCosts.exe) Output Utility Module Navigation Investment Model (NIM) Primary Modules 28
29 Navigation Investment Model (NIM) A hazard function identifies the probability of failure of a component in a specified time period, given that it has survived up to the selected time period. Lock Risk Module Simulation of the Engineering Reliability Data Engineering Reliability (& fix consequences) Repair Plans & Costs Hazard Function h(t) 100% 80% 60% 40% 20% Hazard Function Probability of Unsatisfactory Performance (PUP) 10% 9% 8% 7% 6% 5% 4% 3% 2% PUP f(t) Lock Risk Module (LRM) EXPECTED Repair Costs 0% Period (Age) 1% 0% Prob. Of Service Disruptions by Year An event tree describes the levels of failure and the associated consequences and repairs. Year of Following Annual Time Prob. Prob. Year Failure Year Dependent Degree of Repair Repair of Closure 1/2 Spd Effect on Component Probabilities Failure Level Level Repair Cost Days Days Reliability Satisfactory New Gate 5% 1 $13,150, R=1 all future years Table Values 2 $3,150, Main - Gate Event Tree Major Major Repair 35% 1 $1,575, Back 5 years 100% 2 $1,575, estimates the probability of each potential closure in each year of a component s life given equilibrium traffic levels, hazard functions and event trees. Temporary Repair with 60% 1 $3,575, R=1 all future years New Gates 60% 2 $3,575, Annual Unsatisfactory 3 $5,050, Table Values Minor 0% Scheduled Replacement Year 1 = 30 - closure days and cost $5,050,000 Year 2 = 30 - closure days and cost $5,050,000 Future Reliability will be equal to 1.0 for all future years after replacement 29
30 Navigation Investment Model (NIM) Year of Following Annual Time Prob. Prob. Year Failure Year Dependent Degree of Repair Repair of Closure 1/2 Spd Effect on Component Probabilities Failure Level Level Repair Cost Days Days Reliability Satisfactory New Gate 5% 1 $13,150, R=1 all future years Table Values 2 $3,150, Main - Gate Event Tree Major Major Repair 35% 1 $1,575, Back 5 years 100% 2 $1,575, PUP Temporary Repair with 60% 1 $3,575, R=1 all future years Annual New Gates 60% 2 $3,575, Unsatisfactory 3 $5,050, Table Values Minor 0% Scheduled Replacement Year 1 = 30 - closure days and cost $5,050,000 Year 2 = 30 - closure days and cost $5,050,000 Future Reliability will be equal to 1.0 for all future years after replacement Varies by yr. Can now go to different PUP curve and event-tree. 30


31 Navigation Investment Model (NIM) Lock Risk Module Output Project A Component A Probability of Service Disruption by Year EXPECTED Repair Cost closureid closureid Age n n % 0.00% 5.00% 0.10% $ 248 $ - $ 620 $ % 0.00% 7.00% 0.15% $ 260 $ - $ 868 $ % 0.00% 11.00% 0.20% $ 273 $ - $ 1,364 $ % 0.00% 67.00% 0.90% $ 1,240 $ - $ 8,308 $ 112 closureid 1 = 5-day main closed closureid 2 = not used closureid 3 = 15-day auxiliary chamber closed closureid n = 30-day main chamber 1/2 speed fill / spill 31

32 Navigation Investment Model (NIM) NIM Waterway Supply & Demand Module (WSDM) Determination of Equilibrium Traffic Levels and Transportation Costs determines equilibrium waterway traffic levels under a given system configuration and forecast scenario for each year in the analysis period, taking into account scheduled lock closures. Step 1 Determine Shipping Plans WSDM calculates the towing costs and determines the cost-effective tow configurations to move the port-to-port tonnage on the waterway network honoring tow and operating characteristics. Step 2 Equilibrate Traffic Levels Ranks mvts by base rate savings adds mvts and Iterates until savings are stable with no negatives. 32


33 Navigation Investment Model (NIM) NIM Optimization Module Qualify & Compare Investment Options systematically compares investments and selects the optimal investment strategy and summarizes the results. INVESTMENT ANALYSIS Example Av.Ann. Assuming Investment in Specified Year Least cost 1) the recapitalization cost (if there is one); 2) the expected unsch repair costs; 3) the sch repair costs; 4) maintenance costs; and 5) expected transportation impact costs. Structural + all below options best New asset Initial state, condition grade A Strategy: Ideal Performance Level, best and continous C maintenance complete rebuild, changed demands Depending on maintenance strategy Rehabs + Comp Replacements and Reactive Maintenance Component Replacements + Reactive Maintenance Structural capacity A B Strategy: no maintenance at all Minimum Acceptable Level varies, depending on political, social and administrative consensus Strategy c Strategy b Strategy a Strategy d Reactive Maintenance Fix-as-Fails worst Failure Asset Age and Lifespan (in years) 20 - varies between asset types, construction, usage
34 Navigation Investment Model (NIM) Quantify & Compare Structural Capacity Strategies Investment Plan 1) the recapitalization cost (if there is one); best New asset Initial state, condition grade A complete rebuild, changed demands 2) the expected unscheduled repair costs; 3) the scheduled repair costs; C Strategy: Ideal Performance Level, best and continous maintenance Depending on maintenance strategy 4) maintenance costs; and A B Strategy c 5) expected transportation impact costs etc. Structural capacity Strategy: no maintenance at all Minimum Acceptable Level varies, depending on political, social and administrative consensus Strategy b Strategy a Strategy d worst Failure Asset Age and Lifespan (in years) - varies between asset types, construction, usage EP Dec 1996 Appendix C 34

35 Navigation Investment Model (NIM) NIM Optimization Module Qualify & Compare Investment Options 35
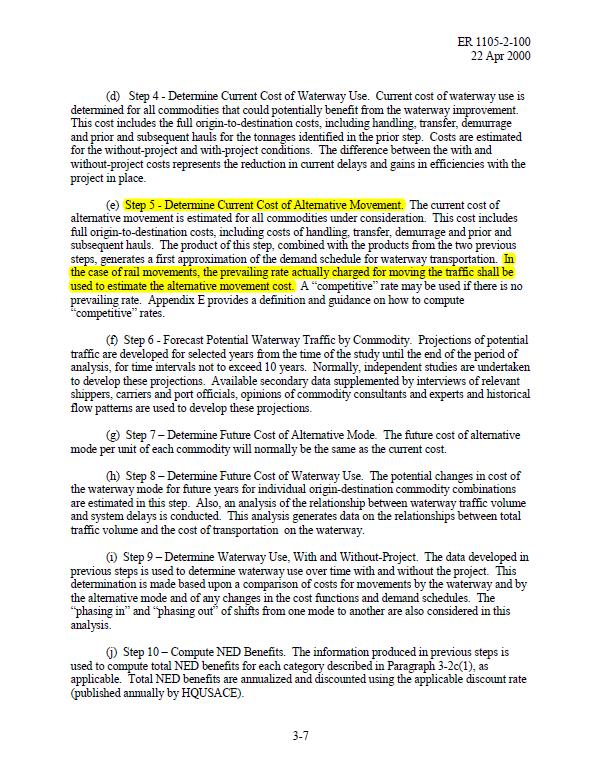
36 Outputs : Navigation Investment Model (NIM) BAYOU SORREL LOCK ANALYS (Millions of dollars, Average annual 3.75% discount/amortization rate, 201 Elastic Movement-Level Demand, NIM Selected Waterw ITEM Without-Project Condition Alt. 2 (Alt.6 Build-In-Place Floodgate) New 75' x 1200' Cap.= M tons Cap.= M tons first cost = $ first cost = $ Forecast Scenario Forecast Scenario Low Reference High Low Reference High WITH Benefits Base Transportation Savings (no service disruptions) * Reduced Surplus frm Scheduled Disruptions Total System Benefits Incremental System BENEFITS WOPC Cost Foregone - Constr WOPC Costs Foregone - Sch Repair WOPC Costs Foregone - Unsch Repair WOPC Costs Foregone - normal O&M TOTAL Incremental BENEFITS $ 1,429.2 $ 1,725.6 $ 2,104.2 $ 1,431.8 $ 1,728.4 $ 2,107.1 $ $ (2.5) $ (2.5) $ (3.2) $ (1.0) $ (1.1) $ (1.2) $ $ 1,426.7 $ 1,723.1 $ 2,101.0 $ 1,430.7 $ 1,727.3 $ 2,105.9 $ na na na $ 4.0 $ 4.3 $ 4.9 $ na na na $ 3.2 $ 3.2 $ 3.2 $ na na na $ 1.7 $ 1.7 $ 1.7 $ na na na $ - $ - $ - $ na na na $ 0.3 $ 0.3 $ 0.3 $ na na na $ 9.2 $ 9.4 $ 10.1 $ Costs ** With-Project Improvement Cost $ - $ - $ - $ 13.3 $ 13.3 $ 13.3 $ Scheduled Repair Cost $ - $ - $ - $ 1.1 $ 1.1 $ 1.1 $ Unscheduled Repair Cost $ - $ - $ - $ - $ - $ - $ Normal O&M Cost $ - $ - $ - $ 0.3 $ 0.3 $ 0.3 $ Total System Costs $ - $ - $ - $ 14.6 $ 14.6 $ 14.6 $ Incremental COSTS na na na $ 14.6 $ 14.6 $ 14.6 $ INCREMENTAL Net Benefits na na na ($5.4) ($5.2) ($4.5) ( ALT. BENEFIT-COST RATIO (BCR) na na na * Includes construction impacts. Only Alt. 4 and Alt. 6 have construction / implementation impacts to transportation. ** While NIM can track costs for each lock modeled in the system, only Bayou Sorrel costs have been entered. SOURCE: SUMMARY_BayouSorrel-Sys_noHR_ xlsx 36
37 Questions? 37
INLAND NAVIGATION ECONOMICS WEBINAR SERIES
 INLAND NAVIGATION ECONOMICS WEBINAR SERIES Mark Hammond Inland Navigation Economics 101 LRD-PD-S 20 February 2013 US Army Corps of Engineers Corps Inland Navigation Mission Provide a safe, reliable, efficient,
INLAND WATERWAYS AND INFRASTRUCTURE PLANNING
 INLAND WATERWAYS AND INFRASTRUCTURE PLANNING Mark Hammond Co-Tech Director, Planning Center of Expertise for Inland Navigation (PCXIN) Great Lakes and Ohio River Division (LRD) 22 November 2013 US Army
INLAND NAVIGATION ECONOMICS WEBINAR SERIES #8 Elasticity of Demand - Shipper Responsiveness
 INLAND NAVIGATION ECONOMICS WEBINAR SERIES #8 Elasticity of Demand - Shipper Responsiveness Michael R. Hilliard, Ph.D. Center for Transportation Analysis Oak Ridge National Laboratory April 10, 2013 US
INLAND NAVIGATION ECONOMICS WEBINAR SERIES Summary Series Wrap-up
 INLAND NAVIGATION ECONOMICS WEBINAR SERIES Summary Series Wrap-up Bill Frechione/Gabe Stala Planning Center of Expertise for Inland Navigation Huntington District 1 May 2013 US Army Corps of Engineers
Inland Waterway User Board Total Risk Exposure Update and Discussion
 Inland Waterway User Board Total Risk Exposure Update and Discussion Jim Hannon Chief, Operations and Regulatory HQ US Army Corps of Engineers James.R.Hannon@usace.army.mil PH: 202/761-1983 14 August 2014
INLAND NAVIGATION ECONOMICS WEBINAR SERIES #4 Waterway Traffic Projections
 INLAND NAVIGATION ECONOMICS WEBINAR SERIES #4 Waterway Traffic Projections Wes Walker Co-Technical Director, PCXIN Huntington, WV 13 March 2013 US Army Corps of Engineers Waterway Traffic Demand Forecasts
Ohio River Navigation Investment Model (ORNIM) By Tim Smith Sept. 2007
 By Tim Smith Sept. 2007") Ohio River Navigation Investment Model (ORNIM) By Tim Smith Sept. 2007 Evolution of Models Updated Tow Cost Model Flotilla Model Early Tow Cost Model Resource Requirements Model Resource Requirements Model
Ohio River Navigation Investment Model (ORNIM) By Tim Smith Sept. 2007 Evolution of Models Updated Tow Cost Model Flotilla Model Early Tow Cost Model Resource Requirements Model Resource Requirements Model
Inland Waterways Users Board #73 Using Risk Exposure for Development of Inland Navigation Life-Cycle Investment Strategies
 Inland Waterways Users Board #73 Using Risk Exposure for Development of Inland Navigation Life-Cycle Investment Strategies Jim Hannon Chief, Operations and Regulatory HQ US Army Corps of Engineers James.R.Hannon@usace.army.mil
The national public policy organization advocating a modern and well-maintained system of ports and inland waterways
 The national public policy organization advocating a modern and well-maintained system of ports and inland waterways America s Waterways - A Great Success Story - Attracts billions of dollars of investment
DRAFT ECONOMICS APPENDIX B
 DRAFT ECONOMICS APPENDIX B GULF INTRACOASTAL WATERWAY BRAZOS RIVER FLOODGATES AND COLORADO RIVER LOCKS SYSTEMS FEASIBILITY STUDY Prepared by: Great Lakes and Ohio River Division Planning Center of Expertise
Conceptual Framework for Analyzing the MTS within the Intermodal System
 Conceptual Framework for Analyzing the MTS within the Intermodal System Dr. Mike Hilliard Center for Transportation Analysis Oak Ridge National Laboratory Dr. Ned Mitchell U.S. Army Engineer Research and
Modernizing the Ohio River Navigation System
 Modernizing the Ohio River Navigation System Presented By: R. Barry Palmer DINAMO, he Association For he Development Of Inland Navigation In America s Ohio Valley Modernizing he Ohio River Navigation System
America s Inland Waterways
 America s Inland Waterways Original prepared by Steve Little Crounse Corporation Modified by Chuck Knowles Kentucky Transportation Center America s Inland Waterways: An Inland Marine Highway for Freight
BINNENSCHIFFFAHRT IN DEN VEREINIGTEN STAATEN INLAND WATERWAY TRANSPORT IN THE UNITED STATES. von / by David GRIER
 BINNENSCHIFFFAHRT IN DEN VEREINIGTEN STAATEN INLAND WATERWAY TRANSPORT IN THE UNITED STATES von / by David GRIER Einführungsvortrag Presentation to NAVILOG 2002 International Workshop University of Hannover,
Review of Inland Navigation Needs: Shipper and Carrier Perspectives
 Transportation Research Board 2002 Annual Meeting Review of Inland Navigation Needs: Shipper and Carrier Perspectives Mark E. Stevens Ingram Barge Company United States Navigable Waterways System is an
MULTIMODAL NETWORK ANALYSIS FOR COAL FREIGHT IN KENTUCKY SESSION 6.2.3
 MULTIMODAL NETWORK ANALYSIS FOR COAL FREIGHT IN KENTUCKY SESSION 6.2.3 John Ripy, GISP, CISSP, Senior Investigator Ted Grossardt, PhD, Research Program Manager Ben Blandford, ABD, Research Investigator
total 2011 tonnage. The total value of Illinois domestic internal commodity movements was over $21.2 billion.
 Illinois The state of Illinois borders or contains over 1,000 miles of the inland waterway system. The state s western border is defined by 580 miles of the upper River. The Illinois Waterway flows for
Waterways 1 Water Transportation History
 Waterways 1 Water Transportation History Water Transportation Propulsion History Human (oars, poles) - - 7,000-10,000 BC Wind (sails) - - 3,000 BC Steamboat invented - - 1787 AD First diesel-powered ship
Eric Thomas Benchmark River and Rail Terminals
 Eric Thomas Benchmark River and Rail Terminals CORBA s Mission The Central Ohio River Business Association (CORBA) is an alliance of businesses and industry engaged in river commerce on and along the Ohio
Inland Waterway Navigation
 Inland Waterway Navigation Value of Inland Navigation As the sun rises over the Mississippi River a 15-barge tow slides slowly past the St. Louis Harbor and heads south to New Orleans where its cargo of
Can Traditional Highway Asset Management Strategies Be Adapted To Waterway Infrastructure Analysis?
 Can Traditional Highway Asset Management Strategies Be Adapted To Waterway Infrastructure Analysis? Bruce Lambert Institute For Water Resources S Army Corps Engineers Presentation Objectives What is condition
Analysis Methods for Inland Waterways
 Analysis Methods for Inland Waterways by Paul Schonfeld Professor Dept. of Civil & University of Maryland College Park, MD 20742 pschon@eng.umd.edu September 9, 2005 Outline Overview Traffic Lock Operations
ECONOMIC IMPACTS ANALYSIS OF INLAND WATERWAYS DISRUPTION ON THE TRANSPORT OF CORN AND SOYBEANS. T. Edward Yu, University of Tennessee
 ECONOMIC IMPACTS ANALYSIS OF INLAND WATERWAYS DISRUPTION ON THE TRANSPORT OF CORN AND SOYBEANS T. Edward Yu, University of Tennessee Burton C. English, University of Tennessee R. Jamey Menard, University
Marine Transportation System Travel Time Atlas
 Marine Transportation System Travel Time Atlas Patricia DiJoseph, PhD Coastal & Hydraulics Lab U.S. Army Engineer Research and Development Center Harbors & Navigation Committee Meeting AAPA March 30-31,
PROJECTS. The KIPDA MPO s Central Location
 PROJECTS Freight The economy of the Louisville KY-IN) Metropolitan Planning Area MPA), similar to that of the United States as a whole, is largely dependent on the efficient, reliable, and safe movement
INLAND WATERWAYS USERS BOARD 14 TH ANNUAL REPORT TO THE SECRETARY OF THE ARMY AND THE UNITED STATES CONGRESS WITH APPENDIXES
 INLAND WATERWAYS USERS BOARD 14 TH ANNUAL REPORT TO THE SECRETARY OF THE ARMY AND THE UNITED STATES CONGRESS WITH APPENDIXES August 2000 (Final Version) TABLE OF CONTENTS EXECUTIVE SUMMARY... ES-1 ANNUAL
Upper Ohio Navigation Study, Pennsylvania
 October 2014 (Revised August 2016) Upper Ohio Navigation Study, Pennsylvania and Integrated Environmental Impact Statement Opening celebration at Montgomery Locks and Dam - 1936 Emsworth, Dashields, and
The Impacts of Unscheduled Lock Outages
 The Impacts of Unscheduled Lock Outages Submitted to Prepared for: The National Waterways Foundation and The U.S. Maritime Administration Center for Transportation Research The University of Tennessee
The Impacts of Unscheduled Lock Outages
 The Impacts of Unscheduled Lock Outages Sponsored by The National Waterways Foundation The U.S. Maritime Administration November 2017 Mark Burton Larry Bray Mike Murphree The University of Tennessee Center
FREIGHT POLICY TRANSPORTATION INSTITUTE. A Real Time Assessment of a Major Transportation Disruption Sara Simmons, Eric Jessup and Ken Casavant
 FREIGHT POLICY TRANSPORTATION INSTITUTE A Real Time Assessment of a Major Transportation Disruption Sara Simmons, Eric Jessup and Ken Casavant A REAL TIME ASSESSMENT OF A MAJOR TRANSPORTATION DISRUPTION
AGING AND FAILING INFRASTRUCTURE SYSTEMS: NAVIGATION LOCKS
 AGING AND FAILING INFRASTRUCTURE SYSTEMS: NAVIGATION LOCKS December 8, 2015; 1300 EST PREPARED BY: OPERATIONAL ANALYSIS DIVISION SCOPE The U.S. Department of Homeland Security/Office of Cyber and Infrastructure
Upper Ohio Navigation Study, Pennsylvania
 October 2014 (Revised October 2016) Upper Ohio Navigation Study, Pennsylvania and Integrated Environmental Impact Statement Opening celebration at Montgomery Locks and Dam - 1936 Emsworth, Dashields, and
Channel Prioritization Tool. CPT Overview to AAPA
 CPT Overview to AAPA Kenneth Ned Mitchell USACE-ERDC Coastal and Hydraulics Lab August 26th, 2009 1 What does CPT do? Deep-draft commerce analysis - See tonnage, $-value, and commodities transiting at
Louisiana s Marine Transportation System Plan and Sponsored Projects
 Louisiana s Marine Transportation System Plan and Sponsored Projects Department of Transportation and Development Sharon J. Balfour Intermodal Transportation Administrator Marine and Rail LOUISIANA TRANSPORTATION
Quantifying the Impacts of Shoaling in Navigation Channels via Historical Waterborne Commerce Data
 Quantifying the Impacts of Shoaling in Navigation Channels via Historical Waterborne Commerce Data Kenneth Ned Mitchell, PhD U.S. Army Engineer Research and Development Center CAPT David MacFarland NOAA
Evaluating the Consequences of an Inland Waterway Port Closure with a Dynamic Multiregional Interdependency Model
 Evaluating the Consequences of an Inland Waterway Port Closure with a Dynamic Multiregional Interdependency Model Cameron MacKenzie and Kash Barker School of Industrial Engineering University of Oklahoma
Systems : An Analysis. TG Crainic, J Damay, M Gendreau, R Namboothiri June 15, 2009
 Strategic Planning of National/Regional Freight Transportation Systems : An Analysis TG Crainic, J Damay, M Gendreau, R Namboothiri June 15, 2009 Talk Outline Problem Motivation Multi-product Multi-modal
AAPA Facilities Engineering Seminar & Expo
 AAPA Facilities Engineering Seminar & Expo Wade M. Battles New Orleans Nov 9, 2011 Opportunities for Port Growth Through Marine Highway Development ATKINS Who we are Global, full-service professional planning,
United States Army Corps of Engineers. Calculating Economics: What Kind of Science? SWG Summer Stakeholder Partnering Forum
 United States Army Corps of Engineers Calculating Economics: What Kind of Science? SWG Summer Stakeholder Partnering Forum Katie Williams Planning Program Manager PRICE SWD Regional Integration Team HQ
UNDERSTANDING THE GLOBAL IMPACT OF INCREASED WATERWAY COMMERCE. Bruce Lambert Executive Director, Institute for Trade and Transportation Studies
 UNDERSTANDING THE GLOBAL IMPACT OF INCREASED WATERWAY COMMERCE Bruce Lambert Executive Director, Institute for Trade and Transportation Studies Does Waterway Commerce: Improve system efficiency Encourage
CHANNEL SILTATION AND NATIONAL ECONOMIC DEVELOPMENT BENEFITS OF MAINTAINING AUTHORIZED DEPTHS IN TEXAS
 CHANNEL SILTATION AND NATIONAL ECONOMIC DEVELOPMENT BENEFITS OF MAINTAINING AUTHORIZED DEPTHS IN TEXAS C. J. Kruse 1 ABSTRACT This analysis of the economic effects of a lack of maintenance dredging focuses
INLAND WATERWAYS USERS BOARD TWELFTH ANNUAL REPORT TO THE SECRETARY OF THE ARMY AND THE UNITED STATES CONGRESS WITH APPENDIXES
 INLAND WATERWAYS USERS BOARD TWELFTH ANNUAL REPORT TO THE SECRETARY OF THE ARMY AND THE UNITED STATES CONGRESS WITH APPENDIXES JULY 1998 TABLE OF CONTENTS EXECUTIVE SUMMARY ES-1 ANNUAL RECOMMENDATIONS
Gulf Intracoastal Waterway Value to the Nation
 Gulf Intracoastal Waterway Value to the Nation Jim Stark, GICA Executive Director jstark@gicaonline.com www.gicaonline.com GICA Mission..to ensure the Gulf Intracoastal Waterway is maintained, operated
USACE Integration of Metrics
 USACE Integration of Metrics CMANC Annual Fall Meeting Anne K. Sturm, P.E. Navigation and Coastal Business Line Manager South Pacific Division Anne.K.Sturm@usace.army.mil 11 October 2012 US Army Corps
Testimony of. Steve Ebke, Chairman, Production & Stewardship Action Team National Corn Growers Association
 Testimony of Steve Ebke, Chairman, Production & Stewardship Action Team National Corn Growers Association The Economic Importance and Financial Challenges of Recapitalizing the Nation s Inland Waterways
STATUS OF MAJOR PROJECT INVESTMENTS BRIEFING TO INLAND WATERWAYS USERS BOARD
 STATUS OF MAJOR PROJECT INVESTMENTS BRIEFING TO INLAND WATERWAYS USERS BOARD February 20, 2009 Sandy Gore Project Programs Team 1 $ Million 450 400 350 300 250 200 150 100 50 0-50 -100-150 IWTF HISTORY
U. S. Army Corps of Engineers Charleston District Overview
 U. S. Army Corps of Engineers Charleston District Overview Diane C. Perkins, AICP Charleston District Chief, Planning & Environmental Branch Diane.Perkins@usace.army.mil US Army Corps of Engineers General
Waterborne Commerce Statistics Center
 Waterborne Commerce Statistics Center Amy Tujague, Data Liaison Waterborne Commerce Statistics Center Navigation and Civil Works Decision Support Center Institute for Water Resources 19 April 2018 US Army
Testimony of. Mike Steenhoek, Executive Director Soy Transportation Coalition. Wednesday, April 18, 2012
 Testimony of Mike Steenhoek, Executive Director Soy Transportation Coalition How Reliability of the Inland Waterways System Impacts Economic Competitiveness House Committee on Transportation and Infrastructure
WATERWAYS: Vital to the Nation. The benefits provided by America s waterways spread far beyond commercial navigation.
 WATERWAYS: Vital to the Nation The benefits provided by America s waterways spread far beyond commercial navigation. Who are the true beneficiaries of America s waterways? From recreational enjoyment to
A Robust Strategy for Managing Congestion at Locks on the Upper Mississippi River
 A Robust Strategy for Managing Congestion at Locks on the Upper Mississippi River James F. Campbell, L. Douglas Smith, Donald C. Sweeney II, College of Business Administration, University of Missouri-St.
Waterborne Commerce Statistics Center
 Waterborne Commerce Statistics Center Amy Tujague, Special Requests Project Manager Waterborne Commerce Statistics Center Navigation & Civil Works Decision Support Center USACE 30 March 2016 US Army Corps
The Coal Institute Fall Education and Engineering Seminar
 INGRAM MARINE GROUP The Coal Institute Fall Education and Engineering Seminar OCTOBER 25, 2018 INGRAM MARINE GROUP OVERVIEW Ingram s Flagship M/V E. Bronson Ingram Nashville, TN What Makes Ingram Different
US Navigation Program Overview
 US Navigation Program Overview For the ERDC and Dutch Ecoshape meeting Jim Walker Navigation Program Manager HQ, US Army Corps of Engineers 18 Jan 2011 US Army Corps of Engineers Recreation areas 376 M
Position of the Upper Mississippi River Basin Association On Investment and Key Issues for Upper Mississippi River System Commercial Navigation
 Position of the Upper Mississippi River Basin Association On Investment and Key Issues for Upper Mississippi River System Commercial Navigation June 25, 2013 The Upper Mississippi River System (Upper Mississippi)
Presentation to the Illinois Chamber of Commerce Infrastructure Committee on the Illinois Maritime Transportation System
 Presentation to the Illinois Chamber of Commerce Infrastructure Committee on the Illinois Maritime Transportation System Robert Ginsburg, Ph.D. Urban Transportation Center, UIC reginsb@uic.edu September
USACE Navigation Strategic Vision
 USACE Navigation Strategic Vision USACE Navigation Mission: To provide safe, reliable, efficient, effective and environmentally sustainable waterborne transportation systems for movement of commerce, national
A MODAL COMPARISON OF DOMESTIC FREIGHT TRANSPORTATION EFFECTS ON THE GENERAL PUBLIC EXECUTIVE SUMMARY. November 2007
 A MODAL COMPARISON OF DOMESTIC FREIGHT TRANSPORTATION EFFECTS ON THE GENERAL PUBLIC EXECUTIVE SUMMARY November 2007 Prepared by CENTER FOR PORTS AND WATERWAYS TEXAS TRANSPORTATION INSTITUTE 701 NORTH POST
WATERWAYS: Vital to the Nation. The benefits provided by America s waterways spread far beyond commercial navigation.
 Who are the true beneficiaries of America s waterways? The Beneficiaries of America s Inland Waterways From recreational enjoyment to flood control, the pools and channels of our national inland waterways
WATERWAYS: Working for America
 Robert J. Hu rt WATERWAYS: Working for America Andrew Riester Waterways Council, Inc. Global Greenship Conference September 18, 2009 Robert J. Hurt WATERWAYS: Working for America Waterways transportation
US ARMY CORPS OF ENGINEERS ROCK ISLAND DISTRICT RIVER INFRASTRUCTURE
 US ARMY CORPS OF ENGINEERS ROCK ISLAND DISTRICT RIVER INFRASTRUCTURE Thomas Heinold Chief, Operations Division Rock Island District Clock Tower Building Rock Island, IL 61204 (309) 794-5401 15 FEB 2018
Miami River Freight Improvement Plan Financial Management Number:
 Miami River Commission January 8, 2018 Miami, FL Carlos A. Castro, District Freight Coordinator Miami River Freight Improvement Plan Financial Management Number: 437946-1-22-01 Agenda Study Background
Channel Portfolio Tool
 Channel Portfolio Tool Kenneth Ned Mitchell CIRP Technology Transfer Workshop New Orleans District May 20-21, 2010 US Army Corps of Engineers BUILDING STRONG Background Need within USACE for more objective,
INLAND WATERWAYS USERS BOARD 17 TH ANNUAL REPORT TO THE SECRETARY OF THE ARMY AND THE UNITED STATES CONGRESS WITH APPENDIXES
 INLAND WATERWAYS USERS BOARD 17 TH ANNUAL REPORT TO THE SECRETARY OF THE ARMY AND THE UNITED STATES CONGRESS WITH APPENDIXES February 2003 TABLE OF CONTENTS Executive Summary... ES-1 Annual Recommendations
Inland Waters User s Board. Mississippi River Valley Division Prioritized Backlog Maintenance
 Presentation to Inland Waters User s Board Mississippi River Valley Division Prioritized Backlog Maintenance by Steve Jones, Mississippi River Valley Division Leon F. Mucha, P.E., St. Paul District 13
Chapter 1 Introduction
 Chapter 1 Introduction KEY POINTS The amount and value of freight are critical components of the overall economic health of Missouri. Missouri s multimodal freight system supports the movement of trucks,
Presentation to 2017 Annual Alabama Water Resources Conference. By: Larry Merrihew, Presdent Warrior-Tombigbee Waterway Association
 Presentation to 2017 Annual Alabama Water Resources Conference By: Larry Merrihew, Presdent Warrior-Tombigbee Waterway Association Alabama s Inland Navigable Waterways Alabama River Apalachicola Chattahoochee
Waterborne Commerce and Performance Data
 Waterborne Commerce and Performance Data Douglas McDonald USACE 18-Jul-2013 US Army Corps of Engineers Waterborne Commerce Information Waterborne Trip & Tonnage Origin & Destination Location Port and Dock
Investment Program Action Team (IPAT): Updating the Capital Projects Business Model
: Updating the Capital Projects Business Model") Investment Program Action Team (IPAT): Updating the Capital Projects Business Model IPAT Briefing Inland Waterways Users Board Meeting #73 November 18, 2014 Kareem El-Naggar, P.E. IMTS Program Manager
Investment Program Action Team (IPAT): Updating the Capital Projects Business Model IPAT Briefing Inland Waterways Users Board Meeting #73 November 18, 2014 Kareem El-Naggar, P.E. IMTS Program Manager
Inland Waterway Operational Model & Simulation Along the Ohio River
 Transportation Kentucky Transportation Center Research Report University of Kentucky Year 2014 Inland Waterway Operational Model & Simulation Along the Ohio River Doug Kreis Roy E. Sturgill Brian K. Howell
The Point Intermodal River Port Facility at the Port of Huntington Project Benefit Cost Summary
 The Point Intermodal River Port Facility at the Port of Huntington Project Benefit Cost Summary The Lawrence County Port Authority 216 Collins Avenue South Point, Ohio 45638 P a g e Contents I. Base Case...
Waterways Dredging and Operational Improvements
 Waterways Dredging and Operational Improvements Bruce Lambert Institute of Water Resources US Army Corps of Engineers Outline Role of Inland Navigation System in U.S. Overview of Dredging in U.S. Current
APPENDIX B COMMODITY FLOWS NOVEMBER 2018 DRAFT
 APPENDIX B COMMODITY FLOWS NOVEMBER 2018 DRAFT 2 CURRENT COMMODITY FLOWS IN THE BIRMINGHAM REGION A commodity flow analysis for a region allows for an understanding of which commodities generate a significant
Ingram Barge Company's test containers make dramatic arrival at America's Central Port
 Ingram Barge Company's test containers make dramatic arrival at America's Central Port by Dan Brannan, Content Director April 10 2015 10:00 AM Ingram Barge Company s test run of containers aboard a barge
Economic Analysis. Appendix C: Lower Pool 2 Channel Management Study: Boulanger Bend to Lock and Dam No. 2
 Appendix C: Economic Analysis Lower Pool 2 Channel Management Study: Boulanger Bend to Lock and Dam No. 2 Pool 2: Boulanger Bend to Lock and Dam 2 C-1 Economic Analysis Introduction This analysis evaluates
Economic Contribution of the US Tugboat,
 www.pwc.com/us/nes Economic Contribution of the US Tugboat, Towboat, and Barge Industry Economic Contribution of the US Tugboat, Towboat, and Barge Industry May 10, 2017 Prepared for the American Waterways
A Real Time Assessment of the Columbia-Snake River Extended Lock Outage: Process and Impacts
 FREIGHT POLICY TRANSPORTATION INSTITUTE A Real Time Assessment of the Columbia-Snake River Extended Lock Outage: Process and Impacts Sara Simmons, Ken Casavant and Jeremy Sage A Real Time Assessment of
THE AMERICAN WATERWAYS OPERATORS ABOUT US
 THE AMERICAN WATERWAYS OPERATORS ABOUT US JOBS AND THE ECONOMY The American Waterways Operators is the national advocate for the U.S. tugboat, towboat and barge industry, which serves the nation as the
Maritime Transportation Research Bank
 University of Arkansas, Fayetteville ScholarWorks@UARK Industrial Engineering Undergraduate Honors Theses Industrial Engineering 5-2015 Maritime Transportation Research Bank Valeria A. Remon Perez University
International Propeller Club
 International Propeller Club Merritt Lane Canal Barge Company President & CEO October 3, 2012 Agenda Brief description of Canal Barge Company Overview of industry issues Waterways story and advocacy for
Missouri Freight Transportation Economy on the Move. Waterway Freight. Missouri Economic Research and Information Center
 Missouri Freight Transportation Economy on the Move Waterway Freight Waterway Industry Missouri is home to 14 public Port Authorities and over 200 private ports operating on over 1,000 miles of waterways
Data Sources and Performance Measures for the Marine Transportation System
 Data Sources and Performance Measures for the Marine Transportation System Ned Mitchell, PhD Research Civil Engineer Coastal and Hydraulics Lab TRB 5 th International Transportation Systems Performance
A MODEL OF CORN AND SOYBEAN SHIPMENTS ON THE OHIO RIVER
 A MODEL OF CORN AND SOYBEAN SHIPMENTS ON THE OHIO RIVER Michael W. Babcock Economics Department Kansas State University Manhattan, KS 66506 ph: 785-532-4571 fax: 785-532-6919 e-mail: mwb@ksu.edu Stephen
State Five Year Tonnage Trend. Shipping Tons Receving Tons Within Tons Total Tons
 U.S. ARMY CORPS OF ENGINEERS BUILDING STRONG 2015 State Quick Facts (Tons in Millions) Tons Shipped - 27.3 Tons Received - 6.7 Tons Shipped Within State - 4.9 Total Commerical Docks - 200 Total Value (billions)-
Barkley L&D BUILDING STRONG
 U.S. ARMY CORPS OF ENGINEERS 2016 Quick Facts Barkley L&D BUILDING STRONG Commercial Lock Operations - 1,296 National Rank - 104 Short Tons (Thousands) - 7,248 National Rank - 84 Commodity Value (Millions)
Planning Center of Expertise for Inland Navigation and Risk-Informed Economics=----- Division (PCXIN-RED)
") Planning Center of Expertise for Inland Navigation and Risk-Informed Economics=----- Division (PCXIN-RED) Patrick J. Donovan Chief May 13, 2015 ~--"" US Army Corps of Engineers BUILDING STRONG. Topics
Planning Center of Expertise for Inland Navigation and Risk-Informed Economics=----- Division (PCXIN-RED) Patrick J. Donovan Chief May 13, 2015 ~--"" US Army Corps of Engineers BUILDING STRONG. Topics
AIR FORCE INSTITUTE OF TECHNOLOGY
 OHIO RIVER DENIAL AS A TRANSPORTATION CORRIDOR AND ITS ECONOMIC IMPACTS ON THE ENERGY INDUSTRY THESIS Çağlar Utku GÜLER, 1st Lieutenant, TUAF AFIT/GLM/ENS/09-5 DEPARTMENT OF THE AIR FORCE AIR UNIVERSITY
RE-EVALUATION OF THE RECOMMENDED PLAN: UMR-IWW SYSTEM NAVIGATION STUDY INTERIM REPORT
 FINAL RE-EVALUATION OF THE RECOMMENDED PLAN: UMR-IWW SYSTEM NAVIGATION STUDY INTERIM REPORT March 2008 Congestion and capacity issues have not really been resolved, we have just been given a breather.
CESWL-OP-O DEPARTMENT OF THE ARMY SWLR XX Little Rock, District Corps of Engineers P.O. Box 867 Little Rock, Arkansas
 DEPARTMENT OF THE ARMY SWLR-1145-2-XX Little Rock, District Corps of Engineers P.O. Box 867 Little Rock, Arkansas 72203-0867 Regulation XX January 2013 No. 1145-2-XX Corps of Engineers Project Operations
VESSEL, FIRM AND LOCK EFFICIENCY MEASURES IN LOCK PERFORMANCE
 The Navigation Economic Technologies Program November 14, 2005 navigation economics technologies VESSEL, FIRM AND LOCK EFFICIENCY MEASURES IN LOCK PERFORMANCE US Army Corps of Engineers IWR Report 05-NETS-R-13
OHIO STATEWIDE FREIGHT STUDY PROGRESS UPDATE. Ohio Conference on Freight: September 12, 2012
 OHIO STATEWIDE FREIGHT STUDY PROGRESS UPDATE Ohio Conference on Freight: September 12, 2012 Progress and Timeline Dec 2011 Aug 2012 Sept 2012 Dec 2012 Stakeholder Involvement Interviews Supply Chain Survey
Fatigue Analysis of the Greenup Lock Gate on the Ohio River
 University of Arkansas, Fayetteville ScholarWorks@UARK Civil Engineering Undergraduate Honors Theses Civil Engineering 5-2017 Fatigue Analysis of the Greenup Lock Gate on the Ohio River Maggie Langston
INLAND WATERWAYS TRANSPORTATION: Our Competitive Advantage. Delbert R Wilkins Canal Barge Company Big River Moves Leadership Forum April 15, 2013
 INLAND WATERWAYS TRANSPORTATION: Our Competitive Advantage Delbert R Wilkins Canal Barge Company Big River Moves Leadership Forum April 15, 2013 INLAND WATERWAYS TRANSPORTATION: Our Competitive Advantage
DEPARTMENT OF THE ARMY EC U.S. Army Corps of Engineers CECW-P Washington, D.C EXPIRES 15 JANUARY 2012 Planning WATERSHED PLANS
 DEPARTMENT OF THE ARMY EC 1105-2-411 U.S. Army Corps of Engineers CECW-P Washington, D.C. 20314-1000 Circular No. 1105-2-411 2010 15 January EXPIRES 15 JANUARY 2012 Planning WATERSHED PLANS 1. Purpose.
Comprehensive Regional Goods Movement Plan and Implementation Strategy Study Introduction and Overview
 Comprehensive Regional Goods Movement Plan and Implementation Strategy Study Introduction and Overview presented to Regional Goods Movement Steering Committee SCAG s Consulting Team: Cambridge Systematics,
GALVESTON DISTRICT DREDGING CONFERENCE
 GALVESTON DISTRICT DREDGING CONFERENCE October 24, 2012 TEXAS PORTS - VALUE TO THE NATION Col. Christopher W. Sallese Commander, Galveston District U.S. Army Corps of Engineers This briefing is USACE SNAPSHOT
Infrastructure Framework
 Infrastructure Framework Infrastructure Impediment = Inefficiencies = Less Effective Transport Capacity = Higher Freight Rates = Lower Producer Returns = Lower Returns and Competitiveness = 2 Global Population
CEDER THE SNAKE RIVER DAMS: ANALYSIS OF COST CLAIMS. Center for Economic Development Education and Research
 Center for Economic Development Education and Research THE SNAKE RIVER DAMS: ANALYSIS OF COST CLAIMS A REVIEW OF: The Costs of Keeping the Four Lower Snake River Dams: A Reevaluation of the Lower Snake
TRANSPORTATION DEMANDS FOR THE MOVEMENT OF NON- AGRICULTURAL COMMODITIES PERTINENT TO THE UPPER MISSISSIPPI AND ILLINOIS RIVER BASIN
 The Navigation Economic Technologies Program May 2007 navigation economics technologies TRANSPORTATION DEMANDS FOR THE MOVEMENT OF NON- AGRICULTURAL COMMODITIES PERTINENT TO THE UPPER MISSISSIPPI AND ILLINOIS
SOO LOCKS ST. MARYS RIVER SAULT STE. MARIE, MICHIGAN
 SOO LOCKS ST. MARYS RIVER SAULT STE. MARIE, MICHIGAN New Soo Lock Economic Validation Study U.S. Army Corps Of Engineers Detroit District June 2018 SOO LOCKS ST. MARYS RIVER SAULT STE. MARIE, MICHIGAN