THE CHALLENGE OF NUTRIENT CONTROL IN LARGE SCALE WATERSHEDS: EFFORTS IN THE U.S.
|
|
|
- Cecilia Harmon
- 5 years ago
- Views:
Transcription
1 THE CHALLENGE OF NUTRIENT CONTROL IN LARGE SCALE WATERSHEDS: EFFORTS IN THE U.S. NAE Convocation of the Professional Engineering Societies David Dzombak Carnegie Mellon University May 16, 2011
2 OUTLINE Nutrients and water quality Hypoxia in coastal waters Chesapeake Bay Northern Gulf of Mexico The Clean Water Act Agriculture and water quality Summary
3 NUTRIENTS AND WATER QUALITY Primary production (algae) in natural waters 106 CO NO 3- + HPO H H + C 106 H 263 O 110 N 16 P O 2 Biochemical oxygen demand bacteria biomass + O 2 CO 2 + H 2 O light
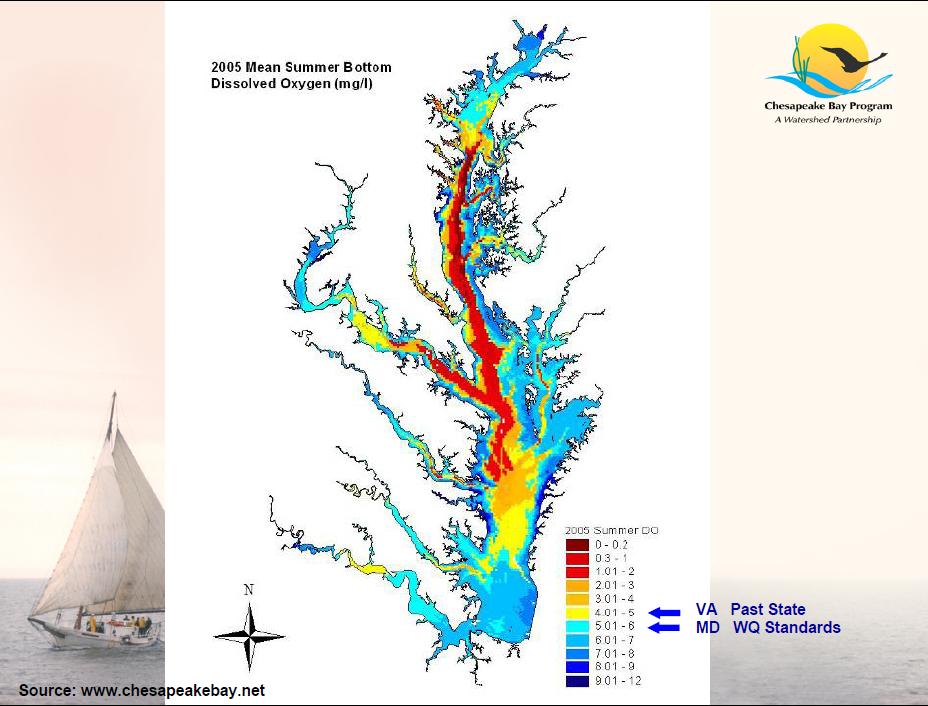
4 HYPOXIA: OXYGEN DEPLETION Dissolved oxygen important to ensure the ecological health of a receiving water Solubility of oxygen is low ( 10 mg/l at 20C) Low dissolved oxygen levels (< 4.0 mg/l) are toxic to many types of fish and other aquatic organisms

5 SOURCES OF NUTRIENT DISCHARGES Source:
6 HYPOXIA IN COASTAL WATERS Global problem N loadings are the most significant driver (NRC, 2000) Production and application of N-fertilizers for agriculture has greatly increased in last 50 yrs In U.S., 6x increased N fluxes to coastal waters relative to natural loadings (Howarth et al 2002) NAE Grand Challenge for Engineering: Manage the N cycle (

7 MANAGING NUTRIENT INPUTS: A GLOBAL CHALLENGE
8
9 CHESAPEAKE BAY PROGRAM Chesapeake Bay Agreement: 1983 Multi-state partnership with EPA on bay restoration (PA, MD, VA, WV, NY, DE, DC) Focused on reducing nutrient and sediment loadings; restoring bay grasses, fish, blue crabs and other aquatic life Basin-wide, coordinated monitoring, modeling and action programs

10
11

12 HYPOXIC ZONES IN NORTHERN GULF OF MEXICO HYPOXIA, 2010 Source: Rabalais et al. (2010)
 to the Gulf Nitrogen SPARROW Model Output for 2002 Source:")
13 Total Nitrogen Delivered Incremental Yield HUC 8 Scale (818 basins) Delivered TN Incremental Yields (kg/km2) to the Gulf Nitrogen SPARROW Model Output for 2002 Source: Robertson (2009)
 Total")

14 Phosphorus Yield (kg/km 2 ) Total Phosphorus Delivered Incremental Yield 2002
 Committee on the Mississippi River and the Clean Water Act:")
 Committee on the Mississippi River and the Clean Water Act (2005-2007) www.")
15 NRC STUDIES OF MR WATER QUALITY Committee on the Clean Water Act Implementation Across the Mississippi River Basin ( ) Committee on the Mississippi River and the Clean Water Act: Scientific, Modeling, and Technical Aspects of Nutrient Pollutant Load Allocation and Implementation (2008) Committee on the Mississippi River and the Clean Water Act ( )
16 NRC MR STUDY SPONSORS McKnight Foundation Minneapolis, Minnesota US Environmental Protection Agency Office of Water
17 CHARACTERISTICS OF THE MR SYSTEM Basin covers nearly 50% of continental US Extensive modification of the basin (land cover and land use) and of the river over past 200 years Construction of river control structures (levees, dams) and wetland loss influence water discharge and quality UMR is much smaller river than LMR, different recreational and commercial value.
18 AVG MR WATER DISCHARGE (km 3 /yr) Source: Meade (1995)
19 MR WATER QUALITY PROBLEMS At the scale of the entire river, nutrients and sediment are two primary water quality problems Nutrient and sediment inputs derive mostly from nonpoint sources, and mostly from agriculture Sediment: excess sediment loads in UMR, sediment deprivation in LMR

20 MR NUTRIENT INPUTS Source: Goolsby (2000)
21 THE CLEAN WATER ACT Cornerstone of surface water quality protection in US; 39 years old Contains variety of reg and non-reg tools Technology-based standards for point-source discharges CWA has been effective in addressing point sources of water pollutants CWA addresses nonpoint source pollution only in a limited manner
22 THE CLEAN WATER ACT Primary mechanism for nonpoint source control: total max daily load (TMDL) process to establish loads that will achieve water quality standards CWA requires states or EPA to establish water quality standards and develop TMDLs for water bodies that do not meet standards For water quality standards and TMDLs to be effectively implemented in interstate waters like the MR, essential that interstate pollutant loadings be fully considered
23 TMDLs FOR MISSISSIPPI RIVER NRC recommendations: EPA should develop water quality criteria for nutrients in the MR and north Gulf of Mexico. EPA should ensure that states establish standards (designated uses and water quality criteria) and TMDLs to protect these waters from excessive nutrient pollution. EPA should develop a federal TMDL or its equivalent, using a process similar to that developed for the Chesapeake Bay.

24 State or regional nutrient caps to reduce nutrient flow to Gulf Numerical Nutrient criteria
25 LIMITATIONS OF THE CWA CWA cannot be the sole legal vehicle used to achieve water quality objectives for the MR Weak nonpoint source control provisions Most agriculture discharges exempted
26 AGRICULTURE AND MR WATER QUALITY NRC recommendations Important that USDA conservation programs be aggressively targeted at areas of high sediment and nutrient input EPA and USDA should strengthen their cooperative activities For example, EPA can help USDA identify land that should receive priority attention for USDA conservation programs

 USDA MR Basin Healthy Watersheds")
27 AGRICULTURE AND WATER QUALITY Reduction in nutrient loadings from agriculture, crucial for improving MR water quality USDA has important role through its land and water conservation programs (CRP, EQIP, CSP) USDA MR Basin Healthy Watersheds Initiative (MRBI)
28 SUMMARY Excess nutrient (N,P) loadings to coastal waters are a global problem Nonpoint sources primarily agriculture Key impact: low dissolved oxygen (hypoxia) Large watersheds and major discharges are affected, e.g., Ches Bay and MR/Gulf of Mexico Clean Water Act limited authority with respect to nonpoint sources TMDL provisions being tested USDA MRBI
29 Questions?

30 SPARROW Modeling Approach - Relates water quality measurements at monitoring stations to watershed attributes - Incorporates in-stream decay of nutrients Sources D Land-to-water transport S Instream transport Monitored load Source: Robertson, 2009
31 USGS SPARROW Model Load at a specific site F i * N S n 1 Flux from Within the Watershed S n, i D n n D S R Z ; θ T Z, Z ; θ, θ i D Sources Land-to-Water Delivery Calibration Coefficients SPARROW: SPAtially Referenced Regressions On Watershed attributes i i S R Transport/Decay Flux from Upstream Watersheds j J i F j it Z S i, Z R i ; θ Transport Calibration of National model based on 425 sites with coinciding loads and GIS information S, θ R Source: Robertson (2009)
32 TMDLs for Mississippi River State EPA- Approved TMDLs Pollutants Addressed % of Miss River in State covered by TMDLs Minnesota 3 Mercury, PCBs, Nutrients Not available Wisconsin 0 0 Iowa 0 0 Illinois 0 0 Missouri 1 PCBs, Chlordane 100 Kentucky 0 0 Tennessee 0 0 Arkansas 0 0 Mississippi 0 0 Louisiana 0 0
NUTRIENT THE OHIO RIVER
 NUTRIENT MANAGEMENT FOR THE OHIO RIVER Why nutrient management is necessary Nutrients are necessary for a healthy aquatic community, but Excessive quantities of nutrients can have negative effects Negative
Mississippi River Basin Healthy Watersheds Initiative
 Helping People Help the Land www.nrcs.usda.gov Mississippi River Basin Healthy Watersheds Initiative Overview To improve the health of the Mississippi River Basin, including water quality and wildlife
North Dakota s Nutrient Reduction Strategy. Presented to the 2016 ND Water Quality Monitoring Conference March 4, 2016
 North Dakota s Nutrient Reduction Strategy Presented to the 2016 ND Water Quality Monitoring Conference March 4, 2016 Nutrients Nutrients, in appropriate amounts, are essential to the growth and health
Gulf Hypoxia and the Mississippi River Basin Healthy Watershed Initiative
 Gulf Hypoxia and the Mississippi River Basin Healthy Watershed Initiative Presented by: Mike Sullivan, Arkansas State Conservationist Mississippi/Atchafalaya River Basin 2008 Action Plan Goals 4 1. Coastal
HYPOXIA ACTION PLAN: WHAT CAN MIDWEST AGRICULTURE DO? Dennis McKenna Illinois Department of Agriculture
 HYPOXIA ACTION PLAN: WHAT CAN MIDWEST AGRICULTURE DO? Dennis McKenna Illinois Department of Agriculture The hypoxic zone is an area in the northern Gulf of Mexico where dissolved oxygen concentrations
Mississippi River/Gulf of Mexico Watershed Nutrient (Hypoxia) Task Force
 Task Force") Mississippi River/Gulf of Mexico Watershed Nutrient (Hypoxia) Task Force History and New Direction: Tracking Progress Towards Our Goal NEMW Institute Congressional Briefing Katie Flahive, US EPA January
Mississippi River/Gulf of Mexico Watershed Nutrient (Hypoxia) Task Force History and New Direction: Tracking Progress Towards Our Goal NEMW Institute Congressional Briefing Katie Flahive, US EPA January
Protecting & Restoring Local Waters and the Chesapeake Bay
 Protecting & Restoring Local Waters and the Chesapeake Bay Restore America s Estuaries National Conference Gregory Barranco Chesapeake Bay Program Office November 2010 The Chesapeake Bay and Watershed
KENTUCKY S NUTRIENT STRATEGY Identification and Discussion of Potential Impacts
 Click to edit Master title style KENTUCKY S NUTRIENT STRATEGY Identification and Discussion of Potential Impacts SPEAKERS Kyle Hagen, PE William Shane, PE DATE August 20, 2014 Click INTRODUCTION to edit
Environmental Concerns in Midwest Agricultural Landscapes. Roberta Parry US EPA Office of Water June 25, 2014
 Environmental Concerns in Midwest Agricultural Landscapes Roberta Parry US EPA Office of Water June 25, 2014 Water Quality Nutrients Local Regional Key Concerns Agricultural Drainage Human Health Wildlife
IMPROVING WATER QUALITY: A REVIEW OF THE MISSISSIPPI RIVER BASIN HEALTHY WATERSHEDS INITIATIVE (MRBI) TO TARGET U.S. FARM CONSERVATION FUNDS
 TO TARGET U.S. FARM CONSERVATION FUNDS") Working Paper IMPROVING WATER QUALITY: A REVIEW OF THE MISSISSIPPI RIVER BASIN HEALTHY WATERSHEDS INITIATIVE (MRBI) TO TARGET U.S. FARM CONSERVATION FUNDS MICHELLE PEREZ AND SARA WALKER SUMMARY Historically,
Working Paper IMPROVING WATER QUALITY: A REVIEW OF THE MISSISSIPPI RIVER BASIN HEALTHY WATERSHEDS INITIATIVE (MRBI) TO TARGET U.S. FARM CONSERVATION FUNDS MICHELLE PEREZ AND SARA WALKER SUMMARY Historically,
SUPPORTING CHESAPEAKE BAY RESTORATION BY MODELING NUTRIENT AND SEDIMENT SOURCES AND TRANSPORT
 SUPPORTING CHESAPEAKE BAY RESTORATION BY MODELING NUTRIENT AND SEDIMENT SOURCES AND TRANSPORT Applications and Results of SPARROW Models John W. Brakebill jwbrakeb@usgs.gov Scott W. Ator swator@usgs.gov
SUPPORTING CHESAPEAKE BAY RESTORATION BY MODELING NUTRIENT SOURCES AND TRANSPORT
 SUPPORTING CHESAPEAKE BAY RESTORATION BY MODELING NUTRIENT SOURCES AND TRANSPORT USGS and EPA Applications and Results of SPARROW Models Goals Update on recently released SPARROW models of Nitrogen and
Chesapeake Bay Nitrogen Assessments
 Chesapeake Bay Nitrogen Assessments May 20, 2010 Workshop on Nitrogen Assessment Science in the USA Thomas E. Jordan Chesapeake Bay Watershed Area=167,000 km 2 Spans 6 states + DC 6 physiographic provinces
Causes of Gulf of Mexico Hypoxia
 Causes of Gulf of Mexico Hypoxia Nancy N. Rabalais 1 R. Eugene Turner 2 1 Louisiana Universities Marine Consortium 2 Louisiana State University Center for Sponsored Coastal Ocean Research, Coastal Ocean
Some Context behind the Implementation of Numeric Nutrient Criteria or Why do we have these Water Quality Regulations?
 Some Context behind the Implementation of Numeric Nutrient Criteria or Why do we have these Water Quality Regulations? Mark W. Clark and Thomas Obreza Soil and Water Science Department University of Florida,
Strategies for Phosphorus Management on Cropland. Renee Hancock, NE NRCS State Water Quality Specialist
 Strategies for Phosphorus Management on Cropland Renee Hancock, NE NRCS State Water Quality Specialist Phosphorus Essential nutrient for growth of crops. Often needs to be applied to land for optimal crop
How Efficient is Your Nitrogen Program? Assessing Nitrogen Use Efficiency on Your Farm
 How Efficient is Your Nitrogen Program? Assessing Nitrogen Use Efficiency on Your Farm Presented at Wisconsin Discovery Farms Conference Wisconsin Dells, WI December 9, 2014 by C.S. Snyder, PhD, CCA Nitrogen
Septic Systems 4% Chemical Fertilizer: Agricultural Land 15%
 Chesapeake Bay Draft TMDL Overview of the Draft TMDL and WIP Evaluations September 2010 Sources of Nitrogen Loads to Bay Municipal & Industrial Wastewater 20% Septic Systems 4% Chemical Fertilizer: Agricultural
Fact Sheet. Chesapeake Bay Water Quality
 Fact Sheet Chesapeake Bay Water Quality Water quality is a critical measure of the Chesapeake Bay s health. For the Bay to be healthy and productive, the water must be safe for people and must support
Science of the Causes of Hypoxia Nancy Rabalais et al.
 Science of the Causes of Hypoxia Nancy Rabalais et al. In support of overview of diversions and hypoxia, and context for refining science needs; July 14, 2014 Scientific Curiosity Hypothesis Testing Management
Intersection of Policy & Trends: Climate, Hypoxia, and Louisiana s Coast
 Intersection of Policy & Trends: Climate, Hypoxia, and Louisiana s Coast Doug Daigle Louisiana Hypoxia Working Group Louisiana Water Conference March 27, 2018 Louisiana State University Mississippi
Total Maximum Daily Load Development for Unnamed Tributary to Pitts Creek. Public Meeting March 26, Why Are We Here
 Total Maximum Daily Load Development for Unnamed Tributary to Pitts Creek Public Meeting March, Why Are We Here. Learn about water quality of the stream. Discuss the Total Maximum Daily Load (TMDL) development.
The Relationship of Agriculture, Water and the Environment
 The Relationship of Agriculture, Water and the Environment Marcia Fox DNREC, Division of Watershed Stewardship, Nonpoint Source Program Delaware s Watersheds Piedmont Delaware Basin Chesapeake Basin Inland
The Hypoxic Zone in the Gulf of Mexico
 The Hypoxic Zone in the Gulf of Mexico References Council Committee on Environmental and Natural Resources. 2003. An Assessment of Coastal Hypoxia and Eutrophication in U.S. Water. National Science and
Riparian Buffers and Stream Restoration
 Riparian Buffers and Stream Restoration Why focus on riparian areas? Link land and water on any given site and link landscapes together in a watershed Riparian corridors protect the circulatory system
Hypoxia in the Gulf of Mexico: Benefits and Challenges of Using Multiple Models to Inform Management Decisions
 Hypoxia in the Gulf of Mexico: Benefits and Challenges of Using Multiple Models to Inform Management Decisions Multiple Models for Management (M3.2) in the Chesapeake Bay February 25, 2013 Annapolis MD
Mike Langland USGS PA Agricultural Advisory Board April 28, 2016
 Mike Langland USGS PA Agricultural Advisory Board April 28, 2016 Chesapeake Bay Nontidal Monitoring Network - Loads to the Bay (1) How are nitrogen, phosphorus, and suspendedsediment loads responding to
Water Quality in the Upper Mississippi Basin:
 Water Quality in the Upper Mississippi Basin: Nitrates, Treatment Costs, and the Role of Agriculture December 6, 2017 Introductions Alyssa Charney, Policy Specialist, National Sustainable Agriculture Coalition.
PRESS RELEASE. LOUISIANA UNIVERSITIES MARINE CONSORTIUM August 2, 2017 SUMMARY
 PRESS RELEASE LOUISIANA UNIVERSITIES MARINE CONSORTIUM August 2, 2017 SUMMARY The 2017 area of low oxygen, commonly known as the Dead Zone, measured 22,720 square kilometers (= 8,776 square miles) is the
WELCOME TO THE JUNE EDITION OF THE 2015 M&R SEMINAR SERIES
 WELCOME TO THE JUNE EDITION OF THE 2015 M&R SEMINAR SERIES PLEASE SILENCE CELL PHONES OR SMART PHONES QUESTION AND ANSWER SESSION WILL FOLLOW PRESENTATION PLEASE FILL EVALUATION FORM SEMINAR SLIDES WILL
Chesapeake Bay Water Quality Restoration:
 Chesapeake Bay Water Quality Restoration: The Transition to a Regulatory Approach Building on Decades of Cooperative Partnership Rich Batiuk Assoc. Director for Science Chesapeake Bay Program Office U.S.
Overview of Gulf of Mexico Hypoxia Policy in Doug Daigle Lower Mississippi River Sub-basin Committee
 Overview of Gulf of Mexico Hypoxia Policy in 2017 Doug Daigle Lower Mississippi River Sub-basin Committee Mississippi Water Resources Conference April 12, 2017 Jackson, MS Nutrient Yields from the Mississippi
The Role of Midwestern Agriculture in Gulf of Mexico Hypoxia. Peter Scharf Nutrient Management Specialist MU Agronomy Extension
 The Role of Midwestern Agriculture in Gulf of Mexico Hypoxia Peter Scharf Nutrient Management Specialist MU Agronomy Extension What is hypoxia? Hyp = low Oxia = oxygen Hypoxia = low oxygen defined as less
SOCIAL INDICATORS: A NEW METRIC TO GUIDE, MEASURE, AND ACCELERATE IMPLEMENTATION OF STATE-LEVEL NUTRIENT REDUCTION STRATEGIES
 SOCIAL INDICATORS: A NEW METRIC TO GUIDE, MEASURE, AND ACCELERATE IMPLEMENTATION OF STATE-LEVEL NUTRIENT REDUCTION STRATEGIES Sandra M. Guzmán a, Ronald E. Cossman a, and Richard Ingram b a Social Research
So, Is the Chesapeake Bay. Yet After Going on The Bay Pollution Diet?
 So, Is the Chesapeake Bay Watershed Losing Weight Yet After Going on The Bay Pollution Diet? Rich Batiuk Associate Director for Science Chesapeake Bay Program Office U.S. Environmental Protection Agency
Workshop. By: Jim Klang, PE Kieser & Associates. Kalamazoo, MI 49007
 By: Jim Klang, PE Kieser & Associates 536 East Michigan Ave Suite 300 Kalamazoo, MI 49007 Why Trade? TN Reduction Cost Comparisons Minnesota has: Why Trade? Two point-nonpoint p permits One basin overlay
An Introduction to Aggregate Air-Water Exchanges
 An Introduction to Aggregate Air-Water Exchanges Air Directors Meeting March 25, 2013 Lewis Linker CBP Modeling Coordinator linker.lewis@epa.gov 1 In the Chesapeake TMDL exchanges of nitrogen are allowed
Saturated Buffer. Subsurface Drainage PURPOSE N REDUCTION LOCATION COST BARRIERS
 Saturated Buffer To intercept tile drainage prior to discharging to surface waters and redistribute the water laterally in the soil profile of the streamside buffer. Subsurface drainage, also known as
HOME PRACTICES TO PROMOTE WATER QUALITY
 November 2004 HOME PRACTICES TO PROMOTE WATER QUALITY There are four major watersheds in the Mid- Atlantic: the Ohio River basin draining to the Gulf of Mexico, the Delaware Bay, the Roanoke and Chowan
PRESS RELEASE. LOUISIANA UNIVERSITIES MARINE CONSORTIUM August 4, 2013
 PRESS RELEASE LOUISIANA UNIVERSITIES MARINE CONSORTIUM August 4, 2013 The 2014 area of low oxygen, commonly known as the Dead Zone, measured 13,080 square kilometers (= 5,052 square miles) as of Aug 1,
Nutrient TMDLs and NPDES Permits
 Nutrient TMDLs and NPDES Permits Mississippi Department of Environmental Quality Adrien Carroll-Perkins, P.E. Bradley Crain, P. E. Nutrient TMDLs in Mississippi Mississippi was a Consent Decree State History
EXECUTIVE SUMMARY DRAFT CHESAPEAKE BAY TMDL
 EXECUTIVE SUMMARY DRAFT CHESAPEAKE BAY TMDL Introduction The U.S. Environmental Protection Agency has released the draft Chesapeake Bay Total Maximum Daily Load (TMDL), a pollution diet that will compel
The Chesapeake Bay TMDL
 The Chesapeake Bay TMDL Introduction to a Pollution Diet for 17 Million Chesapeake Bay Watershed Residents Rich Batiuk Associate Director for Science U.S. EPA Region 3 Chesapeake Bay Program Office March
Ocean Pollution. Ocean Pollution
 Ocean Pollution Ocean Pollution Some scientists believe that it is safer to dump sewage sludge into the deep ocean because it has the ability to dilute, disperse, and degrade large amounts of pollutants
Gulf Hypoxia Initiative Conservation Practices for Wildlife, Water Quality, Energy & Agricultur
 Gulf Hypoxia Initiative Conservation Practices for Wildlife, Water Quality, Energy & Agricultur Dozens of agencies & organizations in the 7 Landscape Conservation Cooperatives (LCCs) of the Mississippi
Strategies for nitrate reduction: The Cedar River Case Study
 2010 Integrated Crop Management Conference - Iowa State University 195 Strategies for nitrate : The Cedar River Case Study Matthew J. Helmers, associate professor, Agricultural and Biosystems Engineering,
Nitrogen (N) affects in-state and downstream waters in three primary ways:
 affects in-state and downstream waters in three primary ways:") G. Conclusions Concerns with nitrogen in waters Nitrogen (N) affects in-state and downstream waters in three primary ways: 1. Aquatic life toxicity - Aquatic life have been found to be adversely affected
G. Conclusions Concerns with nitrogen in waters Nitrogen (N) affects in-state and downstream waters in three primary ways: 1. Aquatic life toxicity - Aquatic life have been found to be adversely affected
Bayesian Uncertainty Quantification in SPARROW Models Richard B. Alexander
 Bayesian Uncertainty Quantification in SPARROW Models Richard B. Alexander National Water Quality Assessment Project U.S. Geological Survey Reston, VA Chesapeake Bay STAC, Assessing Uncertainty Workshop,
The Midpoint Assessment and Phase III WIP
 The Midpoint Assessment and Phase III WIP A Regional Workshop from the Maryland Department of the Environment Generously sponsored by the Harry R. Hughes Center for Agro-Ecology of the University of Maryland
OCEAN POLLUTION. Pollution of coastal waters near heavily populated areas is a serious problem.
 Ocean Pollution Ocean Pollution Some scientists believe that it is safer to dump sewage sludge into the deep ocean because it has the ability to dilute, disperse, and degrade large amounts of pollutants
Paul J. Pickett (co-author) Siana Wong (principal author) Washington State Department of Ecology AWRA National Conference Tysons Corner, VA
 Siana Wong (principal author) Washington State Department of Ecology AWRA National Conference Tysons Corner, VA") An Assessment of Nonpoint Pollution in Washington State Paul J. Pickett (co-author) Siana Wong (principal author) Washington State Department of Ecology AWRA National Conference Tysons Corner, VA November
An Assessment of Nonpoint Pollution in Washington State Paul J. Pickett (co-author) Siana Wong (principal author) Washington State Department of Ecology AWRA National Conference Tysons Corner, VA November
Leadership for Midwestern Watersheds: EPA Update. Katie Flahive
 Leadership for Midwestern Watersheds: EPA Update Katie Flahive 202-566-1206 Flahive.Katie@epa.gov NPS Pollution Diverse and dominates the nation s impaired waters Agriculture Nutrients, sediment, pathogens,
2010 DEAD ZONE ONE OF THE LARGEST EVER. 1 August 2010, from Cocodrie, Louisiana
 2010 DEAD ZONE ONE OF THE LARGEST EVER 1 August 2010, from Cocodrie, Louisiana The area of hypoxia, or low oxygen, in the northern Gulf of Mexico west of the Mississippi River delta covered 20,000 square
The Chesapeake Bay TMDL. How did we get here?
 The Chesapeake Bay TMDL How did we get here? About the Chesapeake Bay The nation s largest estuary worth $1 trillion Covers 64,000 square miles 6 states and the District of Columbia contribute: PA, VA,
Restoring the Chesapeake Bay Challenges & Opportunities
 Restoring the Chesapeake Bay Challenges & Opportunities Jeff Corbin Senior Advisor for Chesapeake Bay U.S. EPA May 29, 2014 A few things to talk about History of Bay Restoration How are we doing? What
2014 Chesapeake Bay Watershed Agreement:
 2014 Chesapeake Bay Watershed Agreement: Management Strategy for the 2017 WIP Outcome, 2025 WIP Outcome, and Water Quality Standards Attainment & Monitoring Outcome Introduction Draft February 9, 2015
Mississippi River/Gulf of Mexico Watershed Nutrient Task Force Timeline for Reassessment Revised 9/5/06. Revised 9/5/06. Symposia.
 Hypoxia in the Gulf of Mexico Extent of Hypoxia in the Gulf Reassessment of the Science & Revision of the Action Plan Frequency of Occurrence 1985-1999 Rabalais, et al. Summer Hypoxia Dissolved Oxygen
Guiding the Restoration of the Chesapeake Bay: The EPA Chesapeake Bay Program Partnership. Keely Clifford U.S. Embassy Paris
 Guiding the Restoration of the Chesapeake Bay: The EPA Chesapeake Bay Program Partnership Keely Clifford U.S. Embassy Paris PISCES Workshop June 14, 2011 1 Chesapeake Bay Watershed About 17 million people
Some Modeling Approaches and Issues for Nitrogen
 Some Modeling Approaches and Issues for Nitrogen Susquehanna River basin workshop June 23, 2004 Robert W. Howarth Department of Ecology & Evolutionary Biology Cornell University Two models: ReNuMa (based
Executive Summary EXECUTIVE SUMMARY
 EXECUTIVE SUMMARY The Wetlands Initiative (TWI) was formed in 1994 with the objective of restoring wetland resources in the Upper Mississippi River Basin and the Great Lakes Region for ecological and economic
Incorporating Ecosystem Services into Monarch. Buffer Strips. Habitat Restoration Planning using Riparian
 Incorporating Ecosystem Services into Monarch Habitat Restoration Planning using Riparian Buffer Strips Copyright: Google Images Copyright: Google Images Zachary H. Ancona and Darius J. Semmens U.S. Geological
of Hypoxia in the Northern Gulf of Mexico
 of Hypoxia in the Northern Gulf of Mexico hile information gaps still exist and several factors discussed below may contribute to hypoxia, the overwhelming scientific evidence indicates that excess nitrogen
NACWA Comments on SAB Hypoxia Report July 20, 2007 Page 1
 Page 1 EXECUTIVE COMMITTEE PRESIDENT Christopher M. Westhoff Assistant City Attorney Public Works General Counsel City of Los Angeles Los Angeles, CA VICE PRESIDENT Marian Orfeo Director of Planning &
Steve Glasgow- NRCS Shanon Phillips- OCC OCLWA 24 th Annual Symposium April 8-9, 2015, Stillwater, OK
 Steve Glasgow- NRCS Shanon Phillips- OCC OCLWA 24 th Annual Symposium April 8-9, 2015, Stillwater, OK Conservation Partnership Roles NRCS- conservation practice design, ID conservation resource needs,
Corn Acreage, Fertilizer Use, & Spring Nutrient Discharge in the Mississippi River Basin: Relationships & Impact on Hypoxia
 Corn Acreage, Fertilizer Use, & Spring Nutrient Discharge in the Mississippi River Basin: Relationships & Impact on Hypoxia C.S. Snyder, PhD, CCA Nitrogen Program Director Northern Gulf of Mexico Hypoxia:
7 Section 7: Land to Water
 7 Section 7: Land to Water 7.1 Introduction As discussed in Section 1, the multiple modeling approach permits P6 to represent processes on a finer scale than previous versions of the Watershed Model. Table
ONLINE SUPPORTING MATERIAL
 ONLINE SUPPORTING MATERIAL for the paper bg-22-78: Simulating the effects of phosphorus limitation in the Mississippi and Atchafalaya River plumes by A. Laurent, K. Fennel, J. Hu and R. Hetland. 5 Patterns
The Total Maximum Daily Load (TMDL) Program in Illinois. Watershed Management Section Bureau of Water
 Program in Illinois. Watershed Management Section Bureau of Water") The Total Maximum Daily Load (TMDL) Program in Illinois Watershed Management Section Bureau of Water Illinois EPA TMDL Program Illinois Integrated Water Quality Report What is a TMDL The TMDL Process 11/10/2014
The Total Maximum Daily Load (TMDL) Program in Illinois Watershed Management Section Bureau of Water Illinois EPA TMDL Program Illinois Integrated Water Quality Report What is a TMDL The TMDL Process 11/10/2014
Top Environmental Regulations Affecting Agriculture in 2015
 Top Environmental Regulations Affecting Agriculture in 2015 Lauren Lurkins Director of Natural and Environmental Resources Illinois Farm Bureau WHAT WE WILL COVER Waters of the United States Proposed Regulation
Addressing Nutrient-Related Water Quality Impacts on the Upper Mississippi River
 Addressing Nutrient-Related Water Quality Impacts on the Upper Mississippi River Clean Water Act Approaches, Conservation Efforts, and Collaboration Opportunities Report on Cross-Programmatic Workshops
Testimony to the U. S. Commission on Ocean Policy Great Lakes Regional Public Meeting September 24, Chicago, Illinois
 Testimony to the U. S. Commission on Ocean Policy Great Lakes Regional Public Meeting September 24, 2002. Chicago, Illinois Dennis Keeney Senior Fellow, Institute for Agriculture and Trade Policy Minneapolis,
Fishing and Boating: Past, Present, and Restoration Thoughts
 Fishing and Boating: Past, Present, and Restoration Thoughts West Branch Susquehanna River Douglas Austen Pennsylvania Fish and Boat Commission West Branch Basin Stream Resources Miles Category 1,249
Critical Period for the Chesapeake Bay TMDL
 Critical Period for the Chesapeake Bay TMDL September 29 th and 30 th, 2009 Presentation C Bob Koroncai and Mike Haire U.S. EPA Region III Water Protection Division and U.S. EPA Office of Water Choosing
Upper Mississippi River Conference 2016 Action Agenda: Raise the Grade
 Upper Mississippi River Conference 2016 Action Agenda: Raise the Grade December 16, 2016 On Oct. 13 14, 2016, a partnership of river stakeholders hosted the ninth annual Upper Mississippi River Conference,
Chapter 1 Development of the Minnesota Nutrient Reduction Strategy
 Chapter 1 Development of the Minnesota s state, federal, and regional partner agencies along with the University of Minnesota have collaborated to provide a statewide strategy to reduce levels of phosphorus
Status of Nutrient Standards in Texas
 Status of Nutrient Standards in Texas May 28, 2010 Presented by: Ana J. Pena-Tijerina, Ph.D., P.E. David Harkins, Ph.D., P.E. In collaboration with: Raj Bhattarai, P.E., DEE Austin Water Utility This Presentation
Funding, Progress, and Other Issues Regarding Agricultural Nonpoint Source Pollution
 Funding, Progress, and Other Issues Regarding Agricultural Nonpoint Source Pollution Paul Van Lenten, Jr. Legislative Fiscal Analyst November 14, 2012 1 What is Nonpoint Source Pollution? Nonpoint source
Adjustments to the Bay s Assimilative Capacity & Determination of Additional Nitrogen and Phosphorus Loads
 Adjustments to the Bay s Assimilative Capacity & Determination of Additional Nitrogen and Phosphorus Loads Rich Batiuk Associate Director for Science, Analysis and Implementation U.S. EPA Chesapeake Bay
WELCOME TO THE MARCH EDITION OF THE 2018 M&R SEMINAR SERIES
 WELCOME TO THE MARCH EDITION OF THE 2018 M&R SEMINAR SERIES SAFETY PRECAUTIONS BEFORE WE BEGIN PLEASE FOLLOW EXIT SIGN IN CASE OF EMERGENCY EVALUATION AUTOMATED EXTERNAL DEFIBRILLATOR (AED) LOCATED OUTSIDE
Chesapeake Bay s Problems
 Environmental Issues for the Chesapeake Bay Russ Perkinson Virginia State Feed Association Conference February 16, 2011 Chesapeake Bay s Problems Congressional appropriation of $27 million for six year
Status of Water Quality in Ohio: The 2018 Integrated Report. April 25, 2018
 Status of Water Quality in Ohio: The 2018 Integrated Report April 25, 2018 Today s Topics Overview of the 2018 Integrated Report Purpose and requirements Assessment overview Differences from the 2016 Integrated
Restoring the Water-Quality Conditions in the Chesapeake Bay: What is working and what still needs to be done
 Restoring the Water-Quality Conditions in the Chesapeake Bay: What is working and what still needs to be done Scott Phillips, USGS Water-Quality Goal Team January 12, 2015 Many Contributors Authors: Christina
Sources of Nutrients in the Nation s Watersheds
 Sources of Nutrients in the Nation s Watersheds By Richard A. Smith and Richard B. Alexander Hydrologists U. S. Geological Survey Reston, Virginia Introduction Animal agriculture is a common source of
Historical Water Quality Data Analysis, Pearson Creek, Springfield, Missouri
 The Ozarks Environmental and Water Resources Institute (OEWRI) Missouri State University (MSU) Historical Water Quality Data Analysis, Pearson Creek, Springfield, Missouri Prepared by: Marc R. Owen, M.S.,
Understanding Agriculture And Clean Water
 1 IOWA CHAPTER Understanding Agriculture And Clean Water Clean Water Act Established in 1972, the Clean Water Act (CWA) created the basic structure for regulating discharges of pollutants into water bodies
Nancy Rabalais Louisiana Universities Marine Consortium
 Eutrophication, Coastal Hypoxia, Carbon & Climate Nancy Rabalais Louisiana Universities Marine Consortium nrabalais@lumcon.edu http://www.gulfhypoxia.net Charismatically stressed and dead benthic fauna
Title Slide Welcome, I will share with you some of the most recent efforts to move forward on Gulf hypoxia including the release of the 2008 Gulf
 Title Slide Welcome, I will share with you some of the most recent efforts to move forward on Gulf hypoxia including the release of the 2008 Gulf Hypoxia Action Plan, research and modeling in the Gulf,
Chesapeake Bay Updates. Agricultural Advisory Board June 18, 2014 Andy Zemba Interstate Waters Office
 Chesapeake Bay Updates Agricultural Advisory Board June 18, 2014 Andy Zemba Interstate Waters Office Updates Total Maximum Daily Load (TMDL) Chesapeake Bay Watershed Agreement Chesapeake Bay TMDL Progress
Upper Mississippi River Lake Pepin Modeling Lake Pepin Municipal Sector Meeting August 6, 2008
 Upper Mississippi River Lake Pepin Modeling Lake Pepin Municipal Sector Meeting August 6, 2008 Lake Pepin Photo by Guy Schmickle Overview Fundamentals Why model? What is a model? Model Development How
Lake Creek Watershed Management Plan Public Meeting. Arrowhead Lake May 3, :00 PM
 Lake Creek Watershed Management Plan Public Meeting Arrowhead Lake May 3, 2018 6:00 PM Agenda I. Welcome and Introductions II. III. IV. Watershed Basics Overview of Lake Creek Watershed Elements of a Successful
Modeling watershed nutrient fluxes & delivery to coastal waters. Pennsylvania State University. Collaborators
 Modeling watershed nutrient fluxes & delivery to coastal waters Elizabeth W. Boyer Pennsylvania State University Collaborators Richard Alexander Gregory Schwarz Richard Smith US Geological Survey National
Streamflow of 2013 Water Year Summary
 Streamflow of 23 Water Year Summary U.S. Geological Survey Reston, Virginia January 24 23 Statewide Streamflow Ranks (93 23) Introduction National Overview Regional Patterns Seasonal Characteristics High
Chesapeake Bay TMDL and Maryland s Watershed Implementation Plan. Robert M. Summers, Ph.D. Acting Secretary Maryland Department of the Environment
 Chesapeake Bay TMDL and Maryland s Watershed Implementation Plan Robert M. Summers, Ph.D. Acting Secretary Maryland Department of the Environment TMDL Background TMDL = Total Maximum Daily Load. The maximum
Appendix D Monitoring Program
 Appendix D Monitoring Program [This page left intentionally blank.] Shingle Creek and West Mississippi Watershed Management Commissions Third Generation Watershed Management Plan Monitoring Program Minnesota
PROTECTING OUR WATERWAYS: STORMWATER POLLUTION REDUCTION EFFORTS
 PROTECTING OUR WATERWAYS: STORMWATER POLLUTION REDUCTION EFFORTS Public Information Meeting ~ May 2, 2018 Public Works Stormwater Management Division OVERVIEW Surface Water Quality Protection Municipal
2017 Revised Guide for Chesapeake Bay Water Quality Two-year Milestones
 2017 Revised Guide for Chesapeake Bay Water Quality Two-year Milestones Purpose Based upon agreements by the Chesapeake Executive Council beginning in 2008, EPA created an accountability framework that
February 24, 2011 Public Webcast
 Audio: Ohio River Basin Trading Program for Wastewater Treatment Plants February 24, 2011 Public Webcast Jessica Fox EPRI Greg Youngstrom ORSANCO Mark Kieser Kieser & Associates, LLC Announcements This
Background What is the Integrated Report (IR)? CWA Background
? CWA Background") Department of the Environment Monday, September 8th, 2014 6:00 pm Montgomery Park, Lobby Conference Rooms Purpose of This Meeting Provide General Information/Updates on 2014 IR Encourage public dialogue,
Department of the Environment Monday, September 8th, 2014 6:00 pm Montgomery Park, Lobby Conference Rooms Purpose of This Meeting Provide General Information/Updates on 2014 IR Encourage public dialogue,
Putting Drinking Water First to Address Nutrient Pollution
 Putting Drinking Water First to Address Nutrient Pollution Nutrient pollution remains one of the greatest challenges to our Nation s water quality and presents a growing threat to public health and local
The Chesapeake Bay TMDL -
 The Chesapeake Bay TMDL - A Driver for New Stormwater Strategies Jane McDonough October 21, 2010 2010 MAFSM Conference, Maritime Institute, Linthicum Heights, Maryland0 Presentation Overview Chesapeake