Exploring Opportunities for a Stronger Regional Economy. Module Six
|
|
|
- Mervyn Wilson
- 5 years ago
- Views:
Transcription
1 Exploring Opportunities for a Stronger Regional Economy Module Six

2 Reflecting on the Previous Session What did you find most useful or valuable? What progress have you made since then? Any questions or clarification needed?

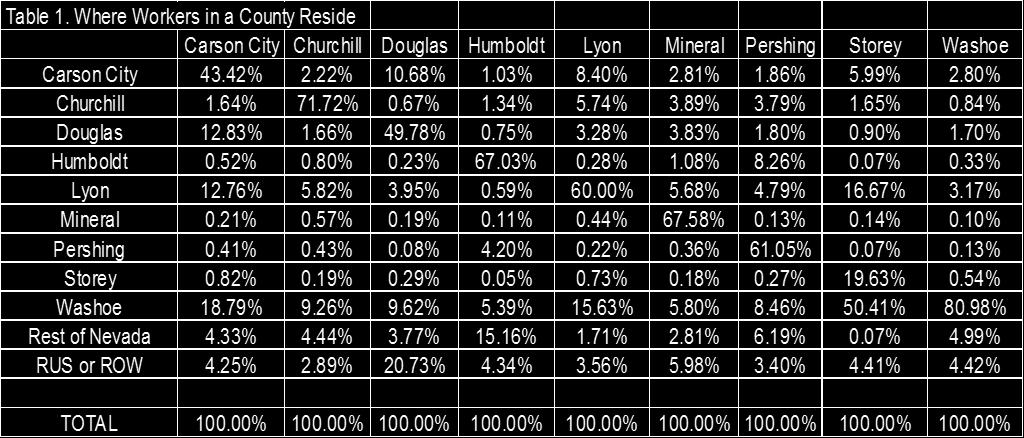
3 COMMUTING PATTERNS


4 COMMUTING PATTERNS

5 Overview of Module Six Explore basic concepts of competitive advantage Provide an overview of tools and data available to detect regional competitive advantage Examine strategies for building stronger regional economies


6 BASIC CONCEPTS OF COMPETITIVE ADVANTAGE
7 Competitive Advantage: Four Factors Business shapes the economic value of a region, but places can help shape, nourish and sustain local enterprises and industry. What determines competitive advantage? Firm Strategy, Structure and Rivalry Factor Conditions Related and Supporting Industries Demand Conditions

8 How many competitors? What is the threat of new entry? Firm Strategy: 3 hospitals 7 full-time doctors Industry determined by university-owned hospital, located 100 miles away Local customer base? What do people want? Related and Supporting Industry: 25% of durable supplies can be purchased locally 0% of non-durable supplies can be purchased locally Health Care Industry Demand Conditions: Unemployed and underemployed seeking low-cost health care Higher income leaving the region for large urban hospital What value chains or clusters exist in our region? Factor Conditions: Low rent Inexpensive unskilled labor Difficult to retain medical professionals How does place influence the quantity, quality and cost of input factors?


9 DETECTING REGIONAL COMPETITIVE ADVANTAGE

10 What Are the Keys to Economic Growth? People Place Businesses Innovation Clusters or branding


11 First Key to Economic Growth: People Who are our workers? Skill level, education, occupation Work ethic Who are our residents? History and culture Long time residents, newcomers

12 People: The Residents Who are the people that live in this region? How long have they lived here? How many generations have lived here? Where did they originate? Why did they come? Why do they like living here? Social conditions Cultural factors Economic prospects

13 People: The Workforce Who are our workers? Basic demographics Experience Work ethic Is our workforce adapting to change? Technology Recognizing needs


14 Second Key to Economic Growth: Place What amenities does our region offer? Why would people want to live here? Why would businesses relocate here?


15 Place: Industrial Indicators Current leading employers New and expanding companies and industries Research facilities, R & D Available land and buildings Existing infrastructure Access to transportation networks Tax structure


16 Place: People & Quality of Life Indicators Population and labor force Education Health care Recreational opportunities Shopping Crime, weather, etc.

?")

17 Third Key to Economic Growth: Business What is the portfolio of businesses (small, medium, large)? What does entrepreneurship look like? What s the mix of industrial sectors?


18 Industries & Occupations: Looking at Your Region s Data What types of industries/ businesses currently exist? What are key occupations? How have these businesses fared, particularly during the recent economic downturn?

19 Business Assistance in the Region What type of programs, assistance or incentives are offered to: Support expanding businesses? Recruit new businesses? Foster the growth of entrepreneurs or small, locallyowned businesses?

20 Identifying Entrepreneurs Social Entrepreneurs People with underutilized talent Small businesses Unemployed Entrepreneurship High growth businesses Youth Self- Employed Innovators
21 Who Is an Innovator/Entrepreneur? Identifying Innovators & Entrepreneurs Solution Problem/Opportunity New Old New YES YES Old YES NO Entrepreneur: one whose goal is to create or capitalize on new economic opportunities through innovation.


22 Assessing Entrepreneurship Capacity Community surveys Existing programs Community readiness Leadership Networks One-on-one interviews with local entrepreneurs Assess ambitions and needs Identify local/regional constraints


23 Assessing Entrepreneurship Capacity Inventory of Entrepreneurship: BEA-REIS data Census (non-employer statistics) County Business Patterns Panel Study on Entrepreneurial Dynamics Business owners survey Capacity for New Entrepreneurs: Educational attainment Immigration and diversity Financial resources Business resources

24 Fourth Key to Economic Growth: Innovation "Innovation... the successful introduction of a new thing or method... Innovation is the embodiment, combination or synthesis of knowledge in original, relevant, valued new products, processes or services. Luecke and Katz, 2003


25 How Nurturing is Your Region? Three Phases of Innovation Conception Implementation Marketing Business Process Idea Generation Project Planning Development Prototype Dev Testing Production Launch Regional Capacity Education Technical Assistance R&D centers Universities Industrial Parks Capital Availability Community Support Source: Tawari, Buse and Herstatt, 2007
 assets")

26 Your Region s Capacity for Innovation Research & Development (R&D) assets Regional universities or community colleges Other resources that foster innovation


27 Fifth Key to Economic Growth: Clusters or Branding Cluster making the whole greater than the sum of the parts Branding consolidating the essential characteristics of the individual identity into a brand core

28 Industry Cluster Analysis Views firms and industries, as interdependent, not isolated Identifies value chains Discovers collections of businesses producing similar outputs

29 What Can Regional Cluster Analysis Tell Us? Where we have... Gaps Growing industries/clusters Declining industries/clusters

30 Data Needs Industry sector data: number of establishments (over time), number of employees, payroll, earnings Potential linkages to determine value chains

31 You Think There Is a Regional Cluster, Map the cluster So Now What? Determine if growing or declining Evaluate regional capacity Identify potential leakages & opportunities Determine potential strengthening strategies


32 MAPPING THE CLUSTER
33 Value Chain Cluster Example Grape stock Fertilizers, Pesticides, Herbicides Grape harvesting equipment Irrigation technology Growers/ Vineyards Wine State government agencies Wineries/ Processing facilities Educational, Research & Trade organizations Winemaking equipment Barrels Bottles Caps & Corks Labels Public Relations & Advertising Specialized publications California Agricultural Cluster Food Cluster Tourism Cluster Source: California Department of Food and Agriculture
34 Cluster Illustration: Bubble Chart Source: EMSI.com

35 Identify Potential Leakages and Business Opportunities For the cluster, determine the: Current regional capacity Industry potential Future growth of industry Types of skills needed

36 Identify Potential Leakages and Opportunities for New Businesses Grapes Fertilizer Advertising Wine Research Zero inputs available regionally Small % of inputs available regionally Large % of inputs available regionally 100% of inputs available regionally
37 Let s look at the data for the Region Yesterday we looked at data that describes the people and the place. Today we are going to look at the data that describe the workers and the businesses Workforce Data Industry Data
38 The Workforce Who are the workers in this region? Are they blue collar or white collar? What types of occupations have done well lately? Do you attract the creative class? What are the skills or education needs for targeted occupations? What industries hire particular occupations?
39 Occupation 2011 Jobs Growth ( ) Real Estate Brokers and Sales Agents Securities, Commodities, and Financial Services Financial Analysts and Advisors Fast Food and Counter Workers Miscellaneous Managers Nursing, Psychiatric and Home Health Aides Accountants and Auditors 6,751 82% 4,437 73% 6,788 67% 6,305 27% 4,055 45% 3,420 36% 3,286 32%


40 The Creative Class Should be attracted and retained Develop, design or create new applications, ideas, relationships, systems or products Considered footloose Attracted to amenities Florida, 2002

41 Where is the Creative Class in the US? How "creatively-driven" is your economy compared to the national average? Dark-blue is the least creative and dark-red the most creative areas.

42

43 INDUSTRY OVERVIEW

44

45 Examining Clusters in Your Region
46 Cluster Choices Advanced Materials Agribusiness, Food Processing & Technology Apparel & Textiles Arts, Entertainment, Recreation & Visitor Industries Biomedical/Biotechnical (Life Sciences) Business & Financial Services Chemicals & Chemical Based Products Communications Computer & Electronic Product Manufacturing Computers & Software Construction Materials Defense & Security Education & Knowledge Creation Electrical Equipment, Appliance & Component Manufacturing Energy Energy (Fossil & Renewable) Fabricated Metal Product Manufacturing Food Products & Services Forest & Wood Products Glass & Ceramics Health Information Information Technology & Telecommunications Machinery Manufacturing Manufacturing Super Cluster (6 sub-clusters) Metals & Machining Mining Primary Metal Manufacturing Printing & Publishing Transportation & Logistics Transportation Equipment Manufacturing
47 GOVERNOR S CLUSTERS Tourism, Gaming, and Entertainment Clean Energy Health and Medical Services Aerospace and Defense Mining, Materials, and Manufacturing Business IT Ecosystems Logistics Agriculture Intangibles and Financial Enterprises Water Technology
48 Example: NV Manufacturing Cluster
49 Total 22,991 19,017 $79, NV Manufacturing Cluster NAICS Code Description 2002 Jobs 2011 Jobs 2011 Average Earnings 2011 Establishments 311 Food Manufacturing 1,328 1,739 $57, Beverage and Tobacco Product Manufacturing $65, Textile Mills $30, Textile Product Mills $47, Apparel Manufacturing $15, Leather and Allied Product Manufacturing $32, Wood Product Manufacturing $56, Paper Manufacturing $63, Printing and Related Support Activities 1,762 1,149 $63, Petroleum and Coal Products Manufacturing $157, Chemical Manufacturing $97, Plastics and Rubber Products Manufacturing 2,070 1,192 $66, Nonmetallic Mineral Product Manufacturing 1, $82, Primary Metal Manufacturing $102, Fabricated Metal Product Manufacturing 3,366 2,802 $66, Machinery Manufacturing 1, $86, Computer and Electronic Product Manufacturing 2,930 2,328 $86, Electrical Equipment, Appliance, and Component Manufacturing $77, Transportation Equipment Manufacturing 1,399 1,176 $74, Furniture and Related Product Manufacturing $60, Miscellaneous Manufacturing 3,833 3,444 $104,242 95
50 NV Manufacturing Cluster NAICS Code Description 2002 Jobs 2002 LQ 2011 LQ 339 Miscellaneous Manufacturing 3, Plastics and Rubber Products Manufacturing 2, Printing and Related Support Activities 1, Nonmetallic Mineral Product Manufacturing 1, Fabricated Metal Product Manufacturing 3, Computer and Electronic Product Manufacturing 2, Textile Product Mills Furniture and Related Product Manufacturing Wood Product Manufacturing Primary Metal Manufacturing Machinery Manufacturing 1, Food Manufacturing 1, Transportation Equipment Manufacturing 1, Electrical Equipment, Appliance, and Component Manufacturing Chemical Manufacturing Total 22,
51 Looking Deeper into Misc Manufacturing Cluster

52 Distribution of Jobs Across Region

53 Strengthening the Miscellaneous Manufacturing Sector
54 Regional Occupations Related to Production

55 EXPLORING POSSIBLE ECONOMIC DEVELOPMENT STRATEGIES


56 Strategies to Strengthen a Cluster or Brand Targeted attraction of industry Business retention and expansion New firm creation/entrepreneurship Attraction of the creative class Network development and meta-business creation


57 Targeted Attraction of Industry Past: Blindly attracting industry Now: Targeting businesses likely to be successful in the region Strategies: Cluster mapping Location models Community Business Matching model

58 Location Models Employs place specific data to: Analyze the probability of an industry moving to the region Evaluate the region s ability to respond to industry needs Select industries with the highest likelihood of success


59 Community Business Matching Model Community Assets Goals The Ideal Compatibility Desirability Needs Profile Business Source: Cox et al., 2009


60 Business Retention & Expansion Lets businesses know they are valued Helps solve local business issues Improves community awareness Connects businesses to community resources Creates connections between community organizations Fosters job retention & growth


61 How BR&E Works Planning Phase Action Phase Recruit volunteer visitors Visit local businesses Follow-up Respond to concerns Plan for future

62 Regional Strategies to Increase Entrepreneurism Community-based training options Weekend boot camps FASTRAC or other 13-week programs Short-term targeted business training Access to business coaching Youth entrepreneurship: 4H, Scouts, in-school programs
63 Entrepreneurial Communities or Regions Openness to new ideas and intellectual stimulation Capital: Equity and Debt Education: K-22 Community Support Conception Birth Information Connections + Networking Services and Amenities Infrastructure Source: Based on Reynolds, et. al., Small Business Economics 23: , 2004.

64 Attracting the Creative Class The creative class is footloose and tends to congregate in places with a high quality of life. Potential to Affect Networking Retain/attract youth Recreational activities Cultural diversity, tolerance and inclusiveness Infrastructure Population density Proximity to metropolitan areas Natural amenities (esp. mountains, forest)

65 Business Network Development A formal or informal collaboration or cooperation among either competing firms or firms that are part of a value chain for the purpose of creating a net benefit for all involved

66 Network Examples Workforce Development Example Milwaukee Seven Water Council: Transform the workforce system and create high performance talent pipelines within the region Entrepreneurship Network Example The Entrepreneurs Network: Promote job growth and business creation


67 Meta-Business Formation Strategies for generating revenue that support all local business Examples: Local coupons Local credit/debit cards Local currency Business directories Local stock exchange Businesses that support other businesses

68 What s Next? Consider other potential strategies that could be successful in the region Further examine the regional data

69 Final Reflections What topics did you find most helpful? What did you find confusing? What other data do you need? Other items you want to mention?

70 Looking Ahead: Module Seven We will: Examine regional assets Explore the region s seven capitals Take an honest look at potential barriers Take steps to link assets to your potential regional goals
Exploring Strategies for Enhancing the Regional Economy
 Exploring Strategies for Enhancing the Regional Economy Reflecting on the Previous Session What did you find most useful or valuable? What progress have you made since then? Any questions or clarification
Stronger Economies. Session 2: More Data Exploration & Strategy Identification. Revised Data Snapshot
 Stronger Economies Together Session 2: More Data Exploration & Strategy Identification Revised Data Snapshot 1 Income and poverty Questions: Total in Poverty Minors (Age 0-17) in Poverty Real Median Household
Overview and Exploration of Regional Data. Session 1 Northeast Arkansas Economic Development Council November 29, 2017
 Overview and Exploration of Regional Data Session 1 Northeast Arkansas Economic Development Council November 29, 2017 The SET Process You are here SET Purpose: Doing Better Together The regional team develops
Yolo County Workforce Innovation Board Industry Clusters of Opportunity
 This report was prepared by the Labor Market Information Division (LMID) of the California Development Department to provide the Workforce Innovation Board () a resource for workforce development and planning.
White River Colorado
 White River Colorado State County Metro Status Colorado Moffat Noncore Colorado Rio Blanco Noncore Colorado Routt Noncore Prepared by: Roberto Gallardo Associate Extension Professor March 2013 Pg. 1 Pre-Defined*
Business-Facts Summary - Construction and Manufacturing NAICS Summary
 - Construction and NAICS Summary Title Page Title Page Data Version: 2018 Feb (Internal) Report Generation Method: Single Analysis Area: 1789 STATE ST, SAN DIEGO, CA, 92101-2530 Reporting Detail: As Selected
Business-Facts Summary - 3 Digit NAICS Summary
 - 3 Digit NAICS Summary Title Page Title Page Data Version: 2018 Feb (Internal) Report Generation Method: Single Analysis Area: 1789 STATE ST, SAN DIEGO, CA, 92101-2530 Reporting Detail: As Selected Include
Kansas Advanced Manufacturing
 2008 Kansas Advanced Manufacturing Center for Economic Development and Business Research W. Frank Barton School of Business Wichita State University August 2008 1 Kansas Advanced Manufacturing Summary
Business-Facts Summary Dublin city, CA ( )
") 3 Digit NAICS Top Ten Summary Healthcare and Social Assistance Ambulatory Health Care Retail Trade Professional, Scientific, and Technical Other (except Public Administration) Retail Trade Retail Trade
3 Digit NAICS Top Ten Summary Healthcare and Social Assistance Ambulatory Health Care Retail Trade Professional, Scientific, and Technical Other (except Public Administration) Retail Trade Retail Trade
THE ECONOMIC IMPACT OF INFORMATION TECHNOLOGIES AFTER THE FINANCIAL CRISIS
 THE ECONOMIC IMPACT OF INFORMATION TECHNOLOGIES AFTER THE FINANCIAL CRISIS Dale W. Jorgenson, Harvard University http://economics.harvard.edu/faculty/jorgenson/ Keynote Lecture to the Annual Conference
STATE OF HAWAI'I. No. of. Total Average Rep. Units Average Quarterly Quarterly Industry March Employment Wages Wages January February March
 STATE OF HAWAI'I TOTAL, including government 37,439 598,205 6,028,316,620 10,077 596,822 598,744 599,049 TOTAL GOVERNMENT 6 123,628 1,526,182,323 12,345 121,692 123,988 125,205 Federal 1 32,650 483,102,256
STATE OF HAWAI'I. No. of. Total Average Rep. Units Average Quarterly Quarterly Industry September Employment Wages Wages July August September
 STATE OF HAWAI'I TOTAL, including government 37,044 581,957 6,080,565,857 10,448 581,677 578,368 585,826 TOTAL GOVERNMENT 6 118,031 1,532,738,257 12,986 118,907 114,660 120,525 Federal 1 34,864 560,380,978
Dallas Industry Strategy
 Dallas Industry Strategy Economic Development and Housing Committee April 3, 2006 1 Purpose Introduce a target industry strategy to guide the s (OED) proactive business development efforts over the next
REGIONAL SNAPSHOT. Mount Rogers Region, Virginia
 REGIONAL SNAPSHOT Mount Rogers Region, Virginia Table of contents 01 Overview 02 Industry Cluster Analysis 01 overview Mount Rogers Region, VA Overview Mount Rogers Region The Mount Rogers Region is comprised
WORLD KLEMS AND ASIA KLEMS
 WORLD KLEMS AND ASIA KLEMS By Dale W. Jorgenson Harvard University First Asia KLEMS Conference Asian Development Bank Institute Tokyo, Japan July 27, 2011 http://economics.harvard.edu/faculty/jorgenson/
This table has been produced by. The State & Regional Fiscal Studies Unit, University of Missouri-Columbia
 Table B-39 NAICS Component 1963 1964 1965 1966 1967 1968 1969 1970 1971 All industry total 607,008 650,513 704,697 767,075 811,782 887,569 962,902 1,012,299 1,097,173 Private industries 534,043 572,138
This table has been produced by. The State & Regional Fiscal Studies Unit, University of Missouri-Columbia
 Table B-39 NAICS Component *1987 1988 1989 1990 1991 1992 All industry total 6,076,695 6,398,624 6,540,047 6,638,210 6,627,809 6,828,525 Private industries 5,195,468 5,492,391 5,612,260 5,690,087 5,677,736
The Bush Record: Jobs -1,634,000 Net Private Sector Jobs Lost In First 3 Years and Eight Months
 Total nonfarm jobs... 131,567 132,388 (821) -0.6% Total private jobs... 109,926 111,560 (1,634) -1.5% Total private production jobs... 89,169 90,716 (1,547) -1.7% Goods-producing... 21,908 24,511 (2,603)
Rural Manufacturing at a Glance, 2017 Edition
 United States Department of Agriculture Economic Research Service, Economic Information Bulletin 177, August 17 Rural Manufacturing at a Glance, 17 Edition Overview Despite declining rural manufacturing
2019 TNCPE Board of Examiners Return Examiner Application
 2019 TNCPE Board of Examiners Return Examiner Application This form should be completed by applicants who have served on the TNCPE Board of Examiners within the last two years. Our Mission To drive organizational
2018 TNCPE Board of Examiners Return Examiner Application
 2018 TNCPE Board of Examiners Return Examiner Application This form should be completed by applicants who have served on the TNCPE Board of Examiners within the last two years. Our Mission To drive organizational
Business-Facts: 3 Digit NAICS Summary 2015
 Business-Facts: 3 Digit NAICS Summary 25 McLean CRD 25 Polygon : MCLEAN, NAICS Code Business Description Establishment Employees Sales (in Millions) Agriculture, Forestry, Fishing and Hunting Crop Production
NORTHWEST GEORGIA HIGH DEMAND CAREER INITIATIVE SECTOR PARTNERSHIP
 NORTHWEST GEORGIA HIGH DEMAND CAREER INITIATIVE SECTOR PARTNERSHIP CANDICE MCKIE ENTERPRISE INNOVATION INSTITUTE GEORGIA TECH NOVEMBER 17, 2017 Project Recap HDCI Overview The High Demand Career Initiative
Results of Mt. Auburn Survey of Merrimack Valley Manufacturers
 Results of Mt. Auburn Survey of Merrimack Valley Manufacturers METHODOLOGY Survey Methodology 622 email addresses were collected through each of the WIBs. This accounted for about one third of total manufacturers
COMMUNITY WORKPLACE POPULATION McHenry, Illinois
 COMMUNITY WORKPLACE POPULATION Prepared for City of McHenry September 2018 LOCATION CONTACT DOROTHY M. WOLF, ECONOMIC DEVELOPMENT COORDINATOR City of McHenry 333 S Green Street 60050 815.363.2175 dwolf@ci.mchenry.il.us
Business-Facts: 3 Digit NAICS Summary 2015
 Business-Facts: 3 Digit NAICS Summary 215 Polygon 1:, Total NAICS Code Business Description Total Establishment Total Employees Sales (in Millions) 11 Agriculture, Forestry, Fishing and Hunting 111 Crop
A MAN UFACTURING COMEBACK 1. A Man ufacturing Comeback: Men s and Women s Employment Gains and Losses in March 2012
 A MAN UFACTURING COMEBACK 1 UNEMPLOYMENT A Man ufacturing Comeback: Men s and Women s Employment Gains and Losses in 2011 March 2012 In 2011 manufacturing employment increased for the first time in more
Entrepreneurs and Their Communities
 Entrepreneurs and Their Communities Targeting Regional Economic Development in a World of Clusters Steven Deller Department of Agricultural and Applied Economics University of Wisconsin-Madison/Extension
Business-Facts: 3 Digit NAICS Summary 2015
 Business-Facts: 3 Digit NAICS Summary 215 Polygon 1:, Total NAICS Code Business Description Total Establishment Total Employees Sales (in Millions) 11 Agriculture, Forestry, Fishing and Hunting 111 Crop
2019 TNCPE Board of Examiners New Examiner Application
 2019 TNCPE Board of Examiners New Examiner Application This form should be completed by applicants who have not served on the TNCPE Board of Examiners within the last two years. Our Mission To drive organizational
Massachusetts Employment Projections Through 2014
 Massachusetts Employment Projections Through 2014 Massachusetts Department of Workforce Development Table of contents Overview 3 Job Growth by Major Industry Sector 6 Impact on workers 18 Impact on Education
11-Years From 2000 to 2011: Despite 30 Million Population Growth, First 11-Yr Job Loss Since 1927-'38
 40% 11-Years From 2000 to 2011: Despite 30 Million Population Growth, First 11-Yr Job Loss Since 1927-'38 % Total US Job Growth/Loss: Eleven Years Ending October Each Year 30% 20% 10% 0% October 2000 to
Business-Facts: 3 Digit NAICS Summary 2015
 Business-Facts: 3 Digit Summary 215 Lake Anne 215 Polygon 1: LAKE ANNE 2, 11 Agriculture, Forestry, Fishing and Hunting 111 Crop Production 112 Animal Production and Aquaculture 113 Forestry and Logging
Camden Food Economy Strategy July 2013 Campbell Soup Company
 Camden Food Economy Strategy July 2013 Campbell Soup Company The Reinvestment Fund $1.2 billion in community investments $700 million in capital under management 800 individual & institutional investors
MANUFACTURING IN IOWA
 MANUFACTURING IN IOWA NOVEMBER 2011 INSIDE: SECTOR SIZE 2 KEY INDUSTRIES EARNINGS 4 EXPORTS 5 JOB TRENDS 6 GDP TRENDS 7 COUNTY DEPENDENCE 3 8 OVERVIEW Iowa s competitive strengths in manufacturing emerged
"Check Out Our Web Site:
 AND PAYROLLS "Check Out Our Web Site: www.dllr.state.md.us/lmi/index.htm" MARYLAND DEPARTMENT LABOR, LICENSING AND REGULATION Office of Labor Market Analysis and Information 1100 North Eutaw Street Baltimore,
"Check Out Our Web Site:
 AND PAYROLLS "Check Out Our Web Site: www.dllr.state.md.us/lmi/index.htm" MARYLAND DEPARTMENT LABOR, LICENSING AND REGULATION Office of Labor Market Analysis and Information 1100 North Eutaw Street Baltimore,
REQUEST FOR RESULTS ECONOMIC VITALITY I WANT A STRONG, RESILIENT AND GROWING ECONOMY RESULTS SUMMARY: ECONOMIC VITALITY GUIDING PRINCIPALS
 ECONOMIC VITALITY I WANT A STRONG, RESILIENT AND GROWING ECONOMY REQUEST FOR RESULTS RESULTS SUMMARY: ECONOMIC VITALITY The City has a strong presence of universities and colleges that are key economic
Building Rural Communities From Within
 Building Rural Communities From Within Legislative Agriculture Chairs Summit Clearwater Beach, FL January 2, 2015 Presented by: Mark D. Partridge Swank Chair in Rural-Urban Policy Partridge.27@osu.edu
REACHING NEW HEIGHTS IN REGIONAL COMPETITIVENESS WITH VALUE-CHAIN ANALYSIS
 REACHING NEW HEIGHTS IN REGIONAL COMPETITIVENESS WITH VALUE-CHAIN ANALYSIS Marty Romitti, PhD, Senior Vice President CREC 1 The 2014 EMSI Leadership Conference Coeur d'alene, ID. October 21, 2014 WHAT
Freight Transportation Challenge More Trucks, More Fuel, More GHGs?
 Freight Transportation Challenge More Trucks, More Fuel, More GHGs? presented to Thirteenth Biennial Conference on Transportation Energy and Policy Asilomar Conference Center Pacific Grove, California
Industries for PI+ v2.2
 1 Forestry, fishing and hunting 113-115 1 Forestry and Logging; Fishing, hunting and trapping 113, 114 1 Forestry and Logging 113 2 Fishing, hunting and trapping 114 2 Support activities for agriculture
FEDERAL RESERVE statistical release
 FEDERAL RESERVE statistical release G.17 (419) For release at 9:15 a.m. (EST) January 18, 2019 INDUSTRIAL PRODUCTION AND CAPACITY UTILIZATION Industrial production increased 0.3 percent in December after
FASTER GROWTH IN MANUFACTURING
 A. Gary Anderson Center for Economic Research For Release: Contact: Raymond Sfeir Professor of Economics and Research Fellow (714) 997-6693 FASTER GROWTH IN MANUFACTURING ORANGE, CA According to a survey
MANUFACTURING. January Manufacturing INDUSTRY PROFILE. for Arapahoe & Douglas Counties Colorado WIOA Central Planning Region
 January 2016 Manufacturing INDUSTRY PROFILE for Arapahoe & Douglas Counties Colorado WIOA Central Planning Region Background Manufacturing is vital to a strong Colorado economy, and has great growth potential.
Chapman University rargyros School of Business and Economics
 Chapman University rargyros School of Business and Economics A. Gary Anderson Center for Economic Research For Release: Contact: Raymond Sfeir Professor of Economics and Research Fellow (714) 997-6693
Louisiana. NAICS code 1. Total recordable cases
 Table A-1. Percent relative standard errors for incidence rates of nonfatal occupational injuries and illnesses by industry and case types, 2012 recordable away from work, job transfer, or All industries
Page 1 of 7. Table 2.7 Employment and output by industry, 1998, 2008 and projected Average annual rate of change. Average annual rate of change
 Total(1)(2) 140,563.9 150,931.7 166,205.6 10,367.8 15,273.9 0.7 1.0 17,050.0 21,028.4 27,702.7 2.1 2.8 Nonagriculture wage and salary NA 126,624.7 137,814.8 152,443.5 11,190.1 14,628.7 0.9 1.0 16,784.8
Manufacturing in Missouri: Skills-Mismatch Index
 I. Overview..... 2 II...... 2 SIC20 - Food and Kindred Products... 4 SIC21 - Tobacco Products... 5 SIC22 - Textile Mill Products... 6 SIC23 - Apparel and Other Finished Fabric Products... 7 SIC24 - Lumber
Highest Ranked Industries Top 10 Manufacturing Industries (3-Digit) in 8 South Carolina Counties
 in 8 South Carolina Counties") Highest Ranked Industries Top 10 Industries (3-Digit) in 8 South Carolina Counties Emsi Q4 Data Set February 2018 Upstate SC Alliance Emsi Q4 Data Set www.economicmodeling.com 1 Parameters Regions Code
Highest Ranked Industries Top 10 Industries (3-Digit) in 8 South Carolina Counties Emsi Q4 Data Set February 2018 Upstate SC Alliance Emsi Q4 Data Set www.economicmodeling.com 1 Parameters Regions Code
See footnotes at end of table. Table 4. Incidence rates 1 and numbers of nonfatal occupational injuries by selected industries, Louisiana, 2016
 All industries including state and local government 4 2.1 34.0 Private industry 4 1.8 24.2 Goods-producing 4 1.3 4.4 Natural resources and mining 4,5 1.0 0.5 Mining, quarrying, and oil and gas extraction
MANUFACTURING GROWTH REBOUNDS
 A. Gary Anderson Center for Economic Research For Release: Contact: Raymond Sfeir Professor of Economics and Research Fellow (714) 997-6693 MANUFACTURING GROWTH REBOUNDS ORANGE, CA According to a survey
BusinessCounts Methodology 2015A Release June 2015
 Introduction BusinessCounts is a geographic summary database of business establishments and employees for nearly ten million businesses and one hundred and thirty million employees. The database is available
APPLIED GEOGRAPHIC SOLUTIONS
 Version Release 2018 Introduction BusinessCounts is a geographic summary database of business establishments and employees for nearly ten million businesses and one hundred and thirty million employees.
MEASURING KNOWLEDGE- BASED CAPITAL
 MEASURING KNOWLEDGE- BASED CAPITAL Some findings and open questions Mariagrazia Squicciarini OECD, Directorate for Science, Technology and Industry A Policy Framework for Knowledge-Based Capital OECD MIT
MANUFACTURING SECTOR CHURNS ALONG
 A. Gary Anderson Center for Economic Research For Release: Contact: Raymond Sfeir Professor of Economics and Research Fellow (714) 997-6693 MANUFACTURING SECTOR CHURNS ALONG ORANGE, CA According to a survey
FEDERAL RESERVE statistical release
 FEDERAL RESERVE statistical release G.17 (419) For release at 9:15 a.m. (EDT) August 17, 2017 INDUSTRIAL PRODUCTION AND CAPACITY UTILIZATION Industrial production rose 0.2 percent in July following an
Labour Market Information Workshop. Montréal 2006
 Labour Market Information Workshop Montréal 2006 The purpose of this information workshop is to help you understand labour market issues and enter the market as efficiently as possible. Emploi-Qu Québec
Intended Outcomes. Chapter Five - Citywide Economic Development Strategy Economic DEVELOPMENT
 Economic DEVELOPMENT Intended Outcomes Promote and position McKinney for desired and quality investment through these actions: Evaluate and modify existing incentive offerings in order to ensure the judicious
MODEST GROWTH RATE RETREAT IN THE MANUFACTURING SECTOR
 A. Gary Anderson Center for Economic Research For Release: Contact: Raymond Sfeir Professor of Economics and Research Fellow (714) 997-6693 MODEST GROWTH RATE RETREAT IN THE MANUFACTURING SECTOR ORANGE,
EMPLOYMENT AND PAYROLLS 2006 ANNUAL AVERAGES. "Check Out Our Web Site:
 AN PAYROLLS 2006 S "Check Out Our Web Site: www.dllr.state.md.us/lmi/index.htm" MARYLAN EPARTMENT OF LABOR, LICENSING AN REGULATION Office of Workforce Information and Performance 1100 North Eutaw Street
Economic DEVELOPMENT. ED/Market Opportunities. Assets to Capitalize On. Guiding Principles. Community Conscience. ED Priorities. City-Wide Strategies
 Economic DEVELOPMENT Intended Outcomes Promote and position McKinney for desired and quality investment through these actions: Evaluate and modify existing incentive offerings in order to ensure the judicious
Capitol Region Industry Clusters of Opportunity
 This report was prepared by the Labor Market Information Division (LMID) of the California Development Department to provide the Golden Sierra, North Central Counties Consortium, Sacramento and Training
ARC-LEAP. Local Economic Assessment Package. Teresa Lynch. Economic Development Research Group, Inc. www. edrgroup.com
 ARC-LEAP Local Economic Assessment Package Teresa Lynch Economic Development Research Group, Inc. www. edrgroup.com Presentation to Development District Association of Appalachia, 2004 Annual Meeting Presentation
Human-Powered Recreation Brings Partners Together
 The catalysts Capitalizing on assets: Coös County, New Hampshire boasts incredible natural resource assets and beautiful landscapes, intrinsic qualities that appeal to locals and visitors who enjoy activities
Chapman University rargyros School of Business and Economics
 Chapman University rargyros School of Business and Economics A. Gary Anderson Center for Economic Research For Release: Contact: Raymond Sfeir Professor of Economics and Research Fellow (714) 997-6693
Rising Flathead Valley 32 nd Annual Montana Economic Outlook Seminar February 6, 2007
 Rising Flathead Valley 32 nd Annual Montana Economic Outlook Seminar February 6, 2007 Center for Business Information and Research Flathead Valley Community College Director: Gregg Davis, Ph.D. Business
Industry Overview. 45-Minute Drive Time from Athens-Clarke County City Hall Source: EMSI, 2017.Q % Avg. Earnings
 Industry Overview 45-Minute Drive Time from Athens-Clarke County City Hall Source: EMSI,.Q4 NAICS Description Jobs 2027 Jobs - 2027 % Avg. Earnings Change Per Job 111 Crop Production 299 315 5% $30,827
April 2015 Manufacturing ISM Report On Business
 FOR RELEASE: May 1, 2015 Contact: Kristina Cahill Report On Business Analyst ISM, ROB/Research Tempe, Arizona 800/888-6276, Ext. 3015 E-mail: kcahill@instituteforsupplymanagement.org April 2015 Manufacturing
City of Hamilton. The current and future state of Hamilton s advanced manufacturing sector
 City of Hamilton The current and future state of Hamilton s advanced manufacturing sector October 2013 Advanced manufacturing is best viewed as a cluster of economic activities encompassing much more than
March 2015 Manufacturing ISM Report On Business
 FOR RELEASE: April 1, 2015 Contact: Kristina Cahill Report On Business Analyst ISM, ROB/Research Tempe, Arizona 800/888-6276, Ext. 3015 E-mail: kcahill@ism.ws March 2015 Manufacturing ISM Report On Business
Percentage of the Employed Population in Service Class Occupations Increasingly, as per capita income has grown in America, the share of
 Population in Service Class Occupations Increasingly, as per capita income has grown in America, the share of household expenses going toward goods, vis-à-vis services, is growing rapidly. From auto repair
6.1 Economic Impact Analysis... 1
 Table of Contents 6.1... 1 Introduction... 1 Economic Multiplier Effect Definitions... 1 Regional Context... 2 Economic Multiplier Findings... 3 6.2 Methodology... 7... 7 Airport Operational Impacts...
Detailed Industries for PI + v1.3 Detailed Industries for PI + v1.4
 Detailed Industries for PI + v1.3 Detailed Industries for PI + v1.4 1 Forestry; Fishing, hunting, and Forestry; Fishing, hunting, and 1131,1132,114 1 trapping trapping 1131,1132,114 2 Logging 1133 2 Logging
Assessing Manufacturing: Output and Labor
 Assessing : Output and Labor The Setup Making It In America Matters 212 NABE Industry Conference Cleveland, OH May 31, 212 William Strauss Senior Economist and Economic Advisor output peaked in December
Workforce Oklahoma Employment Outlook 2010
 Workforce Oklahoma Oklahoma Security Commission Economic Research and Analysis Division Will Rogers Memorial Office Building Labor Market Information Unit, 4 th Floor N P.O. Box 52003 Oklahoma City, OK
UC 311. Indraneel Kumar Edward Morrison Andrey Zhalnin. Purdue Center for Regional Development Purdue University
 Indraneel Kumar Edward Morrison Andrey Zhalnin Purdue Center for Regional Development Purdue University UC 311 Presented at the ESRI International User conference, July 10 th, 2013, San Diego, CA What
MANUFACTURING SECTOR S GROWTH SLOWS
 A. Gary Anderson Center for Economic Research For Release: Contact: Raymond Sfeir Professor of Economics and Research Fellow (714) 997-6693 MANUFACTURING SECTOR S GROWTH SLOWS ORANGE, CA According to a
BUSINESS-FACTS: 2 DIGIT SIC SUMMARY
 Project : South Tulsa BUSINESS-FACTS: 2 DIGIT SUMMARY Prepared For You 1.00 Mile Radius TOT All Industries MAN All Manufacturing ( 20-39) RET All Retailing ( 52-59) 01 Agricultural Production - Crops 02
Labor Market Assessment (LMA) Modules and Questions
 Modules and Questions") Labor Market Assessment (LMA) Modules and Questions Systems/Stakeholder Mapping Policy GATHER ANALYZE SYNTHESIZE What are the institutional What are the country s What policies impact the labor relationships,
Labor Market Assessment (LMA) Modules and Questions Systems/Stakeholder Mapping Policy GATHER ANALYZE SYNTHESIZE What are the institutional What are the country s What policies impact the labor relationships,
Regional Competitive Industry Analysis
 Regional Competitive Industry Analysis Clackamas, Multnomah, and Washington Counties July 2017 Washington Multnomah Clackamas Michael Meyers, Economist (503) 229-6179 michael.meyers@oregon.gov Jill Cuyler,
Regional Competitive Industry Analysis
 Regional Competitive Industry Analysis Jackson and Josephine Counties October 2016 Josephine Jackson Michael Meyers, Economist (503) 229-6179 michael.meyers@oregon.gov Jill Cuyler, Research Analyst (503)
6.1 Economic Impact Analysis... 1
 Table of Contents 6.1... 1 Introduction... 1 Economic Multiplier Effect Definitions... 1 Regional Context... 2 Economic Multiplier Findings... 3 6.2 Methodology... 7... 7 Airport Operational Impacts...
DRAFT SWOT Findings. Economic Vision for the City of Burlington. Burlington Economic Development Corporation. June 18, 2015
 DRAFT SWOT Findings Economic Vision for the City of Burlington Burlington Economic Development Corporation June 18, 2015 1 Millier Dickinson Blais: BEDC Burlington Economic Vision, Draft SWOT Findings
Appendix A NAICS Codes and Titles
 Appendix A NAICS Codes and Titles The current analysis of the US economy uses a classification system that is based on the 6-digit North American Industry Classification System (NAICS) introduced in year
REGIONAL WORKFORCE PROFILE
 REGIONAL WORKFORCE PROFILE Lake of the Ozarks Regional Economic Development Council Camden County Miller County Morgan County NOVEMBER 2016 Table of Contents Topic Page Purpose 2 Executive Summary 3 Overview
Food Manufacturing Research for Grand Erie
 Food Research for Grand Erie Research conducted by Paul Knafelc, Community Benchmarks Inc. on behalf of the Workforce Planning Board of Grand Erie, 2012 1 Brant County Table 1 Food (NAICS 311) Economic
Economic Recovery: State of Manufacturing
 Economic Recovery: State of The Setup Getting the Euro to Work Chicago, IL July 2, 212 William Strauss Senior Economist and Economic Advisor output peaked in December 27 and fell 2.4% over the following
Table of contents for Statistics Denmark s input-output tables, 69 industries including two preliminary years. New edition in English, June 2016.
 Table of contents for Statistics Denmark s input-output tables, 69 industries including two preliminary years. New edition in English, June 2016. Matricer Name Row Col From To DZB_fyy 69 69 Danish industries
MANUFACTURING LABOR MARKET PROFILE SACRAMENTO REGION. Prepared By: Center of Excellence Los Rios Community College District
 MANUFACTURING LABOR MARKET PROFILE SACRAMENTO REGION Prepared By: Center of Excellence Los Rios Community College District Table of Contents Introduction... 3 Manufacturing Sector Overview... 3 Size and
2015 Revised CEDS SWOT Background Information
 2015 Revised CEDS SWOT Background Information Information included in this document was gathered from prior CEDS documents where regional information was analyzed to produce a similar SWOT analysis. This
March 2014 Manufacturing ISM Report On Business
 FOR RELEASE: April 1, 2014 Contact: Kristina Cahill Report On Business Analyst ISM, ROB Media Relations Tempe, Arizona 800/888-6276, Ext. 3015 E-mail: kcahill@ism.ws March 2014 Manufacturing ISM Report
Mapping and identification of the regional potential of the Republic of Moldova
 The European Commission s science and knowledge service Joint Research Centre Mapping and identification of the regional potential of the Republic of Moldova Hugo Hollanders, Lina Stanionyte Launching
IHS ECONOMICS Southwest Regional Manufacturers Association
 IHS ECONOMICS Southwest Regional Manufacturers Association Manufacturing Sector Profile August 2016 ihs.com PREPARED ESPECIALLY FOR: IHS CONSULTING REPORT Economic Strategy Solutions Brendan O Neil Managing
Economic And Social Commission For Western Asia. ESCWA IRENA Joint Study Potential of Manufacturing RE Equipment in the Arab Region
 Economic And Social Commission For Western Asia ESCWA IRENA Joint Study Potential of Manufacturing RE Equipment in the Arab Region Background 2014: IRENA and LAS published Pan-Arab RE Strategy 2030: Road
Figures Population Growth Index 7. Manufacturing Share of Employment
 This section provides historical trends on key economic sectors with an emphasis on the manufacturing sector. This data is available at the County level so comparison trends are provided for Jefferson
Strengthening the Regional Workforce
 Strengthening the Regional Workforce Workforce Analysis and Strategy Project Kickoff Presented by CAEL and Avalanche Monday, February 24 th, 2014 Today s Presenters Joel Simon, Vice President Council for
IHS ECONOMICS Mid-Florida Regional Manufacturers Association
 IHS ECONOMICS Mid-Florida Regional Manufacturers Association Manufacturing Sector Profile August 2016 ihs.com PREPARED ESPECIALLY FOR: IHS CONSULTING REPORT Economic Strategy Solutions Brendan O Neil Managing
COMPARISON OF CEDS AND STRONGER ECONOMIES TOGETHER ELEMENTS JULY 2015
 COMPARISON OF AND STRONGER ECONOMIES TOGETHER ELEMENTS JULY 2015 Summary Background Evidence Base Demographic and socioeconomic data Detailed Data SnapShot including: Evidence-Based: Population change