Immunofluorescence images of different core histones and different histone exchange assay.
|
|
|
- Camilla Gaines
- 6 years ago
- Views:
Transcription
1 Molecular Cell, Volume 51 Supplemental Information Enhanced Chromatin Dynamics by FACT Promotes Transcriptional Restart after UV-Induced DNA Damage Christoffel Dinant, Giannis Ampatziadis-Michailidis, Hannes Lans, Maria Tresini, Anna Lagarou, Malgorzata Grosbart, Arjan Theil, Wiggert A. van Cappellen, Hiroshi Kimura, Jiri Bartek, Maria Fousteri, Adriaan B. Houtsmuller, Wim Vermeulen, and Jurgen A. Marteijn Inventory of Supplemental Information: Figure S1, related to Figure 1 Immunofluorescence images of different core histones and different histone exchange assay. Figure S2, related to Figure 2 Effect of NAP1L1 on histone exchange Efficiencies of sirna knockdown Effect of PARP and CK2 inhibitors on histone exchange Figure S3, related to Figure 3 Control blot of SSRP1-GFP and SPT16-GFP Immunofluorescence of SPT16 at UV damage in time Figure S4, related to Figure 4 Function of SPT16 in transcriptional restart and presence near TC-NER complexes Supplemental References
2 2
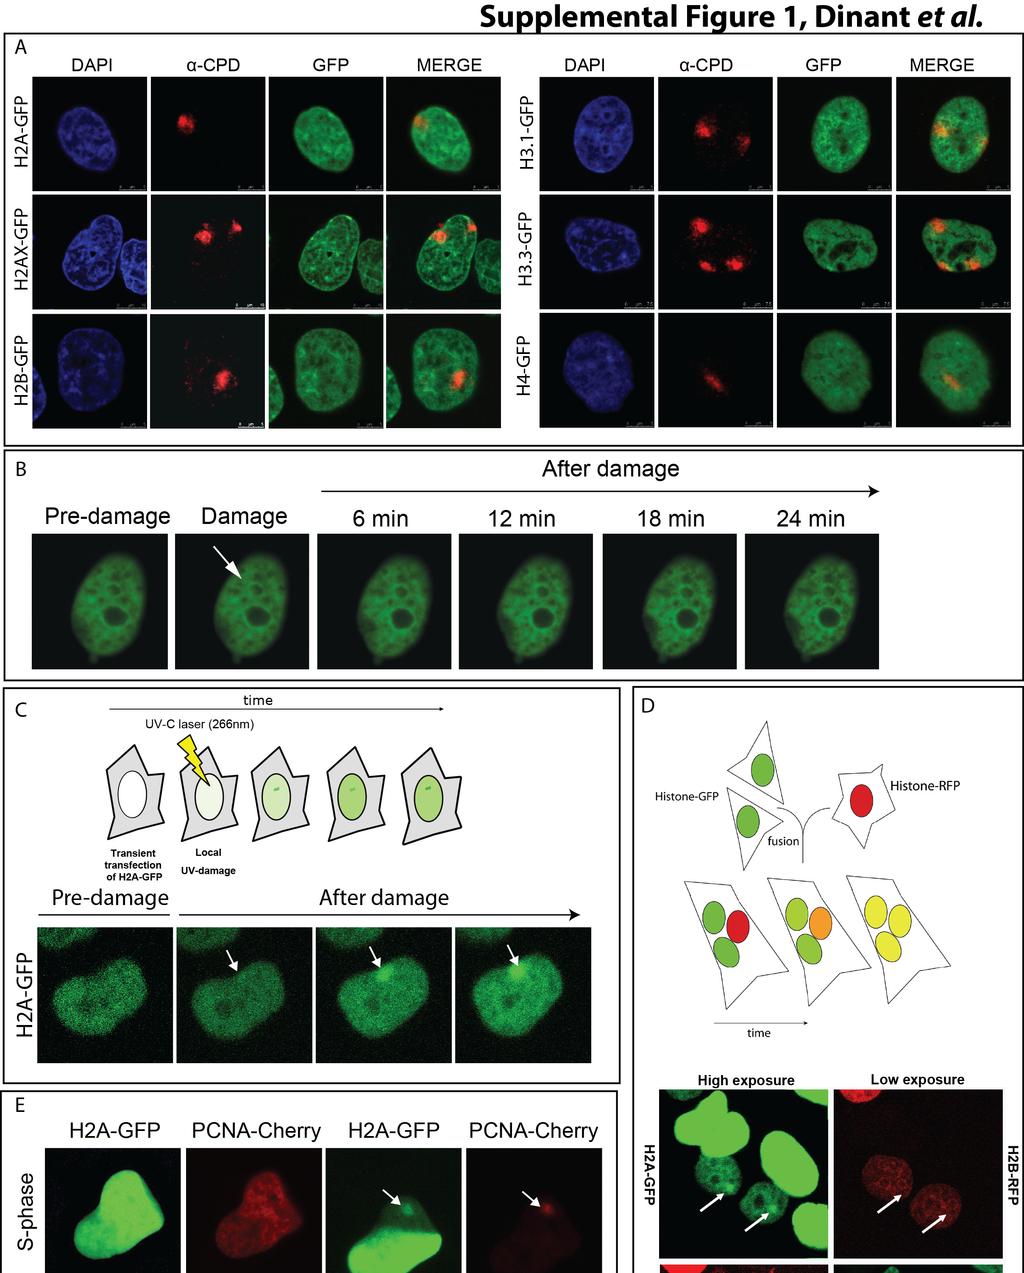
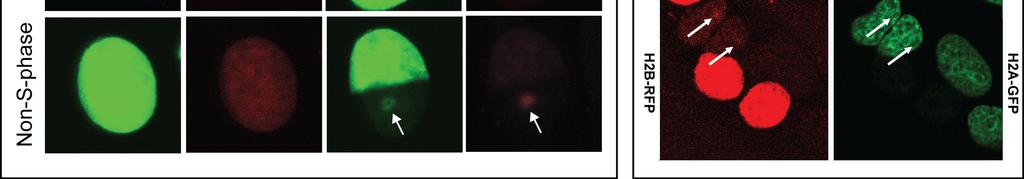
3 Figure S1, related to Figure 1 A. HeLa cells stably expressing the indicated GFP-tagged histones were locally UV irradiated with 100 J/m 2 by irradiation through a micro-porous filter. The local UV-irradiated area was visualized by anti-cpd immunofluorescent counterstaining. The general distribution and steady-state level of histones was not significantly affected at LUD. B. Local UV-C laser (266nm) DNA damage (LUD) infliction (arrow) in HeLa cells stably expressing H2A-GFP, showing that also with this procedure the total amount of core histones is not changed at LUD. C. HeLa cells were subjected to local UV-C laser (266nm) DNA damage infliction (arrow) 6-8 hrs after transient transfection of H2A-GFP. At this timepoint the expression of the transfected H2A-GFP starts, enabling us to follow de novo histone incorporation in the chromatin in time. D. HeLa cells expressing H2A-GFP (green) and HeLa cells expressing H2B-RFP (red) were PEG-mediated fused and local UV-irradiated 30 min after fusion. Images were taken 1 hr after local UV-C laser irradiation (arrow). E. Enhanced H2A-GFP exchange at LUD in S-phase and non S-phase cells, identified by the absence of the typical S- phase-specific PCNA foci using expression of PCNA-Cherry. PCNA also localizes to LUD. 3
4 4
5 Figure S2, related to Figure 2 A. H2A-GFP exchange at LUD in HeLa cells transfected with control sirna or sirna targeting NAP1L1 B. NAP1L1 expression levels in cells transfected with non-targeting control sirna (sictrl) or sirna directed against NAP1L1 (right lane, sinap1l1). A nonspecific cross-reacting band is used as loading control. C. Western blots for the knockdown efficiencies of sissrp1, sispt16 and sifact (both sissrp1 and sispt16 simultaneously). Tubulin is used as loading control. Graphs show quantification of SSRP1 (left) and SPT16 (right) proteins levels normalized to tubulin levels. D. Quantification of histone exchange in unperturbed or locally UV-C exposed regions of the bleached part of the nucleus transfected with the indicated sirna s. Fluorescence recovery directly after LUD is plotted against time in sec. for H2A-GFP, (n > 8 cells, mean ± s.e.m.). E. H2A-GFP exchange at LUD in HeLa cells, in the presence of PARP or CK2 inhibitors (1hr). Top panel images of half nucleus bleached immediately captured after local UV-C damage infliction, lower panel 15 minutes after UV damage. F. Quantification of histone exchange in unperturbed or locally UV-C exposed regions of the bleached part of the nucleus untreated or pre-incubated for 1 hour with the indicated inhibitors (n > 8 cells, mean ± s.e.m.). G. The activity of PARP inhibitor (AZD2281, 10 µm) is shown by the decrease of H induced (5 min treatment with 500 µm) PAR staining using immunofluorescence (Eltze et al., 2008). H. The efficacy of CK2 inhibition by 10 µm DMAT is illustrated by the strong redistribution of the CK2 substrate NPM/B23 (Louvet et al., 2006; Negi and Olson, 2006). 5
6 6
7 Figure S3, related to Figure 3 A. Comparison of expression levels of SSRP1-GFP, SPT16-GFP and their endogenous counterparts in U20S cells. B. Immuno-fluorescence, showing SPT16 co-localization at LUD as indicated by CPD staining 2, 6 and 24 hrs after local UV-C damage. C. Accelerated H2A- GFP exchange at LUD occurs in the absence of SSRP1 but not of SPT16. D. Immunofluorescence, showing SPT16 co-localization at LUD as indicated by CPD staining after transfection with control sirna or sirna targeting SSRP1. E. Quantification of the SPT16- GFP or SSRP1-GFP accumulation kinetics at LUD after the indicated sirna mediated knockdown. (n > 12 cells, mean ± s.e.m.). 7
8 8
9 Figure S4, related to Figure 4 A. Recruitment kinetics at LUD of GFP tagged version of the early NER factors DDB2, XPC and CSB upon RNAi-mediated knockdown of FACT is normal. (n > 10 cells, mean ± s.e.m.) B. Mock and UV-irradiated (1 hr. after 20 J/m 2 ) VH10 and CS1AN (CS-B) cells (both sv40 immortalized), were subject to SPT16 ChIP and stained for XPA. C. Mock and UV-irradiated (1 hr after 20 J/m 2 ) CS1AN (CS-B) and XP21RO (XP-C) cells (both htert immortalised) were in vivo crosslinked and ChIP-ed with p89 (XPB) antibodies for ChIP-on-western analysis. XPB interacts with RNApolII and TC-NER factors CSA, CSB, as well as SPT16 in response to UV-damage only in TC-NER proficient cells. C and D: longer exposures of the blots of the indicated proteins are depicted in the lower panel. D. Mock and UV-irradiated (1 hr after 20 J/m 2 ) CS1AN (CS-B) cells (htert immortalised) were in vivo crosslinked and ChIP-ed with antibodies against the late elongating form of RNAPII. An increased association between SPT16 and RNApolII is observed in CS-B cells. For figures B, C and D: samples were normalized to equal levels of the ChIP-ed protein. Immunoblot analysis of the coimmunoprecipitated proteins was performed with antibodies as indicated. E. Transcription levels as determined by 2-hour pulse-labelling with EU in U2OS cells. After fixation, EU is fluorescently labelled with Alexa594. Transcription is inhibited upon treatment with 25 μg/ml α-amanitin or 100 μm DRB. F. FRAP graph in which the relative fluorescence recovery after bleaching is plotted against time (s) of SPT16-GFP expressing cells untreated or treated with 25 μg/ml α-amanitin for the indicated times. (n > 15 cells, mean ± s.e.m.). G. FRAP graph in which the relative fluorescence recovery after bleaching is plotted against time (s) of SPT16- GFP expressing cells untreated or treated 100 μm DRB for 1 hour. (n > 12 cells, mean ± s.e.m.). 9
10 Supplemental References Eltze, T., Boer, R., Wagner, T., Weinbrenner, S., McDonald, M.C., Thiemermann, C., Burkle, A., and Klein, T. (2008). Imidazoquinolinone, imidazopyridine, and isoquinolindione derivatives as novel and potent inhibitors of the poly(adp-ribose) polymerase (PARP): a comparison with standard PARP inhibitors. Mol Pharmacol 74, Louvet, E., Junera, H.R., Berthuy, I., and Hernandez-Verdun, D. (2006). Compartmentation of the nucleolar processing proteins in the granular component is a CK2-driven process. Mol Biol Cell 17, Negi, S.S., and Olson, M.O. (2006). Effects of interphase and mitotic phosphorylation on the mobility and location of nucleolar protein B23. J Cell Sci 119,
UV-sensitive syndrome protein UVSSA recruits USP7 to regulate transcription-coupled repair
 Supplementary Information UVsensitive syndrome protein UVSSA recruits to regulate transcriptioncoupled repair Petra Schwertman 1, Anna Lagarou 2, Dick H.W. Dekkers 3, Anja Raams 1, Adriana C. van der Hoek
Four different active promoter genes were chosen, ATXN7L2, PSRC1, CELSR2 and
 SUPPLEMENTARY MATERIALS AND METHODS Chromatin Immunoprecipitation for qpcr analysis Four different active promoter genes were chosen, ATXN7L2, PSRC1, CELSR2 and IL24, all located on chromosome 1. Primer
T H E J O U R N A L O F C E L L B I O L O G Y
 T H E J O U R N A L O F C E L L B I O L O G Y Supplemental material Han et al., http://www.jcb.org/cgi/content/full/jcb.201311007/dc1 Figure S1. SIVA1 interacts with PCNA. (A) HEK293T cells were transiently
Enhanced Chromatin Dynamics by FACT Promotes Transcriptional Restart after UV-Induced DNA Damage
 Article Enhanced Chromatin Dynamics by FACT Promotes Transcriptional Restart after UV-Induced DNA Damage Christoffel Dinant, 1,2,3 Giannis Ampatziadis-Michailidis, 4 Hannes Lans, 1 Maria Tresini, 1 Anna
Coleman et al., Supplementary Figure 1
 Coleman et al., Supplementary Figure 1 BrdU Merge G1 Early S Mid S Supplementary Figure 1. Sequential destruction of CRL4 Cdt2 targets during the G1/S transition. HCT116 cells were synchronized by sequential
Molecular mechanisms of DNA repair and transcription studied by FRAP
 Molecular mechanisms of DNA repair and transcription studied by FRAP Adriaan Houtsmuller Josephine Nefkens Institute Erasmus Medical Centre Rotterdam The Netherlands Nucleus GFP-tagged proteins Confocal
SUPPLEMENTARY INFORMATION
 Figure S1: Activation of the ATM pathway by I-PpoI. A. HEK293T cells were either untransfected, vector transfected, transfected with an I-PpoI expression vector, or subjected to 2Gy γ-irradiation. 24 hrs
Supplementary Fig. 1 Proteomic analysis of ATR-interacting proteins. ATR, ARID1A and
 Supplementary Figure Legend: Supplementary Fig. 1 Proteomic analysis of ATR-interacting proteins. ATR, ARID1A and ATRIP protein peptides identified from our mass spectrum analysis were shown. Supplementary
Supplemental Material
 Supplemental Material 1 Figure S1. Phylogenetic analysis of Cep72 and Lrrc36, comparative localization of Cep72 and Lrrc36 and Cep72 antibody characterization (A) Phylogenetic alignment of Cep72 and Lrrc36
SUPPLEMENTARY INFORMATION
 DOI: 1.138/ncb37 a Supplementary Figure 1 Dapi EU γh2ax Overlay b Dapi NBS1-GFP Firbillarin Overlay c Pre-laser 2 min 5 min 1 min 2 min 3 min 4 min 5 min 6 min 7 min d Dapi GFP-MRE11 γh2ax Overlay Supplementary
 DOI: 10.1038/ncb3259 A Ismail et al. Supplementary Figure 1 B 60000 45000 SSC 30000 15000 Live cells 0 0 15000 30000 45000 60000 FSC- PARR 60000 45000 PARR Width 30000 FSC- 15000 Single cells 0 0 15000
Supplementary Fig. 1. Schematic structure of TRAIP and RAP80. The prey line below TRAIP indicates bait and the two lines above RAP80 highlight the
 Supplementary Fig. 1. Schematic structure of TRAIP and RAP80. The prey line below TRAIP indicates bait and the two lines above RAP80 highlight the prey clones identified in the yeast two hybrid screen.
Supplementary Figure 1. RAD51 and RAD51 paralogs are enriched spontaneously onto
 Supplementary Figure legends Supplementary Figure 1. and paralogs are enriched spontaneously onto the S-phase chromatin during DN replication. () Chromatin fractionation was carried out as described in
Supplementary Figure Legends
 Supplementary Figure Legends Figure S1 gene targeting strategy for disruption of chicken gene, related to Figure 1 (f)-(i). (a) The locus and the targeting constructs showing HpaI restriction sites. The
Supplemental Fig. 1: PEA-15 knockdown efficiency assessed by immunohistochemistry and qpcr
 Supplemental figure legends Supplemental Fig. 1: PEA-15 knockdown efficiency assessed by immunohistochemistry and qpcr A, LβT2 cells were transfected with either scrambled or PEA-15 sirna. Cells were then
T H E J O U R N A L O F C E L L B I O L O G Y
 T H E J O U R N A L O F C E L L B I O L O G Y Supplemental material Nakajima and Tanoue, http://www.jcb.org/cgi/content/full/jcb.201104118/dc1 Figure S1. DLD-1 cells exhibit the characteristic morphology
Supplementary Fig. 1. (A) Working model. The pluripotency transcription factor OCT4
 Working model. The pluripotency transcription factor OCT4") SUPPLEMENTARY FIGURE LEGENDS Supplementary Fig. 1. (A) Working model. The pluripotency transcription factor OCT4 directly up-regulates the expression of NIPP1 and CCNF that together inhibit protein phosphatase
SUPPLEMENTARY FIGURE LEGENDS Supplementary Fig. 1. (A) Working model. The pluripotency transcription factor OCT4 directly up-regulates the expression of NIPP1 and CCNF that together inhibit protein phosphatase
A RRM1 H2AX DAPI. RRM1 H2AX DAPI Merge. Cont. sirna RRM1
 A H2AX DAPI H2AX DAPI Merge Cont sirna Figure S1: Accumulation of RRM1 at DNA damage sites (A) HeLa cells were subjected to in situ detergent extraction without IR irradiation, and immunostained with the
SUPPLEMENTARY INFORMATION
 SUPPLEMENTARY INFORMATION Dynamic Phosphorylation of HP1 Regulates Mitotic Progression in Human Cells Supplementary Figures Supplementary Figure 1. NDR1 interacts with HP1. (a) Immunoprecipitation using
Supplementary Information for. Regulation of Rev1 by the Fanconi Anemia Core Complex
 Supplementary Information for Regulation of Rev1 by the Fanconi Anemia Core Complex Hyungjin Kim, Kailin Yang, Donniphat Dejsuphong, Alan D. D Andrea* *Corresponding Author: Alan D. D Andrea, M.D. Alan_dandrea@dfci.harvard.edu
SUPPLEMENTARY INFORMATION
 DOI: 10.1038/ncb2386 Figure 1 Src-containing puncta are not focal adhesions, podosomes or endosomes. (a) FAK-/- were stained with anti-py416 Src (green) and either (in red) the focal adhesion protein paxillin,
T H E J O U R N A L O F C E L L B I O L O G Y
 T H E J O U R N A L O F C E L L B I O L O G Y Supplemental material Rainero et al., http://www.jcb.org/cgi/content/full/jcb.201109112/dc1 Figure S1. The expression of DGK- is reduced upon transfection
Hossain_Supplemental Figure 1
 Hossain_Supplemental Figure 1 GFP-PACT GFP-PACT Motif I GFP-PACT Motif II A. MG132 (1µM) GFP Tubulin GFP-PACT Pericentrin GFP-PACT GFP-PACT Pericentrin Fig. S1. Expression and localization of Orc1 PACT
SUPPLEMENTARY INFORMATION
 DOI: 10.1038/ncb3209 Supplementary Figure 1 IR induces the association of FH with chromatin. a, U2OS cells synchronized by thymidine double block (2 mm) underwent no release (G1 phase) or release for 2
Supplementary Materials for
 www.sciencesignaling.org/cgi/content/full/9/429/ra54/dc1 Supplementary Materials for Dephosphorylation of the adaptor LAT and phospholipase C by SHP-1 inhibits natural killer cell cytotoxicity Omri Matalon,
Nature Structural & Molecular Biology: doi: /nsmb Supplementary Figure 1. Analyses of ECTRs by C-circle and T-circle assays.
 Supplementary Figure 1 Analyses of ECTRs by C-circle and T-circle assays. (a) C-circle and (b) T-circle amplification reactions using genomic DNA from different cell lines in the presence (+) or absence
The microtubule-associated tau protein has intrinsic acetyltransferase activity. Todd J. Cohen, Dave Friedmann, Andrew W. Hwang, Ronen Marmorstein and
 SUPPLEMENTARY INFORMATION: The microtubule-associated tau protein has intrinsic acetyltransferase activity Todd J. Cohen, Dave Friedmann, Andrew W. Hwang, Ronen Marmorstein and Virginia M.Y. Lee Cohen
T H E J O U R N A L O F C E L L B I O L O G Y
 T H E J O U R N A L O F C E L L B I O L O G Y Supplemental material Craft et al., http://www.jcb.org/cgi/content/full/jcb.201409036/dc1 Figure S1. GFP -tubulin interacts with endogenous -tubulin. Ciliary
Supplementary Figure 1 Collision-induced dissociation (CID) mass spectra of peptides from PPK1, PPK2, PPK3 and PPK4 respectively.
 mass spectra of peptides from PPK1, PPK2, PPK3 and PPK4 respectively.") Supplementary Figure 1 lision-induced dissociation (CID) mass spectra of peptides from PPK1, PPK, PPK3 and PPK respectively. % of nuclei with signal / field a 5 c ppif3:gus pppk1:gus 0 35 30 5 0 15 10
Supplementary Figure 1 lision-induced dissociation (CID) mass spectra of peptides from PPK1, PPK, PPK3 and PPK respectively. % of nuclei with signal / field a 5 c ppif3:gus pppk1:gus 0 35 30 5 0 15 10
Supplementary Methods
 Supplementary Methods Antibodies For immunocytochemistry, the following antibodies were used: mouse anti-γ-h2ax (Upstate), rabbit anti-γ-h2ax (Abcam), rabbit anti-53bp1 (Novus), mouse anti-atm-phosphoserine1981
Giardia RNAi Paper Discussion. Supplemental - VSG clonality. Variant-specific surface protein VSP9B10
 Giardia RNAi Paper Discussion Supplemental - VSG clonality VSP9B10 Green - VSP9B10 antibody Blue - DAPI Demonstration that cell line expresses a single VSP Variant-specific surface protein Outside Inside
Supplementary Materials for
 www.sciencesignaling.org/cgi/content/full/4/167/ra20/dc1 Supplementary Materials for Poly(ADP-Ribose) (PAR) Binding to Apoptosis-Inducing Factor Is Critical for PAR Polymerase-1 Dependent Cell Death (Parthanatos)
HPV E6 oncoprotein targets histone methyltransferases for modulating specific. Chih-Hung Hsu, Kai-Lin Peng, Hua-Ci Jhang, Chia-Hui Lin, Shwu-Yuan Wu,
 1 HPV E oncoprotein targets histone methyltransferases for modulating specific gene transcription 3 5 Chih-Hung Hsu, Kai-Lin Peng, Hua-Ci Jhang, Chia-Hui Lin, Shwu-Yuan Wu, Cheng-Ming Chiang, Sheng-Chung
Replication Factor C Recruits DNA Polymerase to Sites of Nucleotide Excision Repair but Is Not Required for PCNA Recruitment
 MOLECULAR AND CELLULAR BIOLOGY, Oct. 2010, p. 4828 4839 Vol. 30, No. 20 0270-7306/10/$12.00 doi:10.1128/mcb.00285-10 Copyright 2010, American Society for Microbiology. All Rights Reserved. Replication
3 P p25. p43 p41 28 FADD. cflips. PE-Cy5 [Fluorescence intensity]
![3 P p25. p43 p41 28 FADD. cflips. PE-Cy5 [Fluorescence intensity]](/thumbs/87/97394430.jpg "3 P p25. p43 p41 28 FADD. cflips. PE-Cy5 [Fluorescence intensity]") L S p4 3 D3 76 N S L Ve ct or p4 3 D3 76 N S L Ve ct or A aspase 8 FADD TRAF2 D95-R - + Vector D95L TL I S L D376N T RAIL-R1 T RAIL-R2 D95-R E-y5 [Fluorescence intensity] Supplemental Fig. 1 Different
L S p4 3 D3 76 N S L Ve ct or p4 3 D3 76 N S L Ve ct or A aspase 8 FADD TRAF2 D95-R - + Vector D95L TL I S L D376N T RAIL-R1 T RAIL-R2 D95-R E-y5 [Fluorescence intensity] Supplemental Fig. 1 Different
SUPPLEMENTARY INFORMATION
 (Supplementary Methods and Materials) GST pull-down assay GST-fusion proteins Fe65 365-533, and Fe65 538-700 were expressed in BL21 bacterial cells and purified with glutathione-agarose beads (Sigma).
Supplementary Information
 Supplementary Information stability is regulated by CK2-dependent interaction with R2TP complex Patrick von Morgen 1,2, Kamila Burdova 1, Thomas G. Flower 3, Nicola J. O'Reilly 4, Simon J. Boulton 5, Stephen
supplementary information
 DOI: 10.1038/ncb2172 Figure S1 p53 regulates cellular NADPH and lipid levels via inhibition of G6PD. (a) U2OS cells stably expressing p53 shrna or a control shrna were transfected with control sirna or
SUPPLEMENTARY INFORMATION
 SUPPLEMENTARY INFORMATION Legends for Supplementary Tables. Supplementary Table 1. An excel file containing primary screen data. Worksheet 1, Normalized quantification data from a duplicated screen: valid
Supplementary Material
 Supplementary Material Supplementary Methods Cell synchronization. For synchronized cell growth, thymidine was added to 30% confluent U2OS cells to a final concentration of 2.5mM. Cells were incubated
Supplemental Figure 1. HepG2 cells were transfected with GLI luciferase reporter construct
 Supplemental Figure 1. HepG2 cells were transfected with GLI luciferase reporter construct (pgl38xgli), EWS-FLI1 luciferase reporter construct (NROB1-Luc) with or without GLI1, EWS- FLI1 and cdnas respectively.
Supplementary Table 1. The Q-PCR primer sequence is summarized in the following table.
 Supplementary Table 1. The Q-PCR primer sequence is summarized in the following table. Name Sequence (5-3 ) Application Flag-u ggactacaaggacgacgatgac Shared upstream primer for all the amplifications of
Stabilization of the Transcription Factor Foxp3 by the Deubiquitinase USP7 Increases Treg-Cell-Suppressive Capacity
 Immunity, Volume 39 Supplemental Information Stabilization of the Transcription Factor Foxp3 by the Deubiquitinase USP7 Increases Treg-Cell-Suppressive Capacity Jorg van Loosdregt, Veerle Fleskens, Juan
Poly(ADP-ribose) polymerase 1 escorts XPC to UVinduced DNA lesions during nucleotide excision repair
 polymerase 1 escorts XPC to UVinduced DNA lesions during nucleotide excision repair") Poly(ADP-ribose) polymerase 1 escorts XPC to UVinduced DNA lesions during nucleotide excision repair Mihaela Robu a,1, Rashmi G. Shah a,1, Nupur K. Purohit a, Pengbo Zhou b, Hanspeter Naegeli c, and Girish
Poly(ADP-ribose) polymerase 1 escorts XPC to UVinduced DNA lesions during nucleotide excision repair Mihaela Robu a,1, Rashmi G. Shah a,1, Nupur K. Purohit a, Pengbo Zhou b, Hanspeter Naegeli c, and Girish
VCP adaptor interactions are exceptionally dynamic and subject to differential modulation by a VCP inhibitor
 VCP adaptor interactions are exceptionally dynamic and subject to differential modulation by a VCP inhibitor Liang Xue 1, Emily E. Blythe 1, Elyse C. Freiberger 2, Jennifer Mamrosh 1, Alexander S. Hebert
SUPPLEMENTARY INFORMATION
 DOI: 10.1038/ncb2579 Figure S1 Incorporation of heavy isotope-labeled amino acids and enrichment of di-glycine modified peptides. The incorporation of isotopelabeled amino acids in peptides was calculated
The Human Protein PRR14 Tethers Heterochromatin to the Nuclear Lamina During Interphase and Mitotic Exit
 Cell Reports, Volume 5 Supplemental Information The Human Protein PRR14 Tethers Heterochromatin to the Nuclear Lamina During Interphase and Mitotic Exit Andrey Poleshko, Katelyn M. Mansfield, Caroline
Supplemental Figure 1 A
 Supplemental Figure A prebleach postbleach 2 min 6 min 3 min mh2a.-gfp mh2a.2-gfp mh2a2-gfp GFP-H2A..9 Relative Intensity.8.7.6.5 mh2a. GFP n=8.4 mh2a.2 GFP n=4.3 mh2a2 GFP n=2.2 GFP H2A n=24. GFP n=7.
SUPPLEMENTARY INFORMATION
 SUPPLEMENTARY INFORMATION Supplementary figures Supplementary Figure 1: Suv39h1, but not Suv39h2, promotes HP1α sumoylation in vivo. In vivo HP1α sumoylation assay. Top: experimental scheme. Middle: we
SUPPLEMENTARY INFORMATION
 DOI: 10.1038/ncb2880 Supplementary Figure 1 Sequence alignment of Deup1 and Cep63. The protein sequence alignment was generated by the Clustal X 2.0 multiple sequence alignment program using default parameters.
Xeroderma Pigmentosum Group A Protein Loads as a Separate Factor onto DNA Lesions
 MOLECULAR AND CELLULAR BIOLOGY, Aug. 2003, p. 5755 5767 Vol. 23, No. 16 0270-7306/03/$08.00 0 DOI: 10.1128/MCB.23.16.5755 5767.2003 Copyright 2003, American Society for Microbiology. All Rights Reserved.
Figure 1: TDP-43 is subject to lysine acetylation within the RNA-binding domain a) QBI-293 cells were transfected with TDP-43 in the presence or
 QBI-293 cells were transfected with TDP-43 in the presence or") Figure 1: TDP-43 is subject to lysine acetylation within the RNA-binding domain a) QBI-293 cells were transfected with TDP-43 in the presence or absence of the acetyltransferase CBP and acetylated TDP-43
Figure 1: TDP-43 is subject to lysine acetylation within the RNA-binding domain a) QBI-293 cells were transfected with TDP-43 in the presence or absence of the acetyltransferase CBP and acetylated TDP-43
Supplemental Information. Dynamic Organization of Chromatin Domains. Revealed by Super-Resolution Live-Cell Imaging
 Molecular Cell, Volume 67 Supplemental Information Dynamic Organization of Chromatin Domains Revealed by Super-Resolution Live-Cell Imaging Tadasu Nozaki, Ryosuke Imai, Mai Tanbo, Ryosuke Nagashima, Sachiko
Li et al., Supplemental Figures
 Li et al., Supplemental Figures Fig. S1. Suppressing TGM2 expression with TGM2 sirnas inhibits migration and invasion in A549-TR cells. A, A549-TR cells transfected with negative control sirna (NC sirna)
SUPPLEMENTARY INFORMATION
 The Supplementary Information (SI) Methods Cell culture and transfections H1299, U2OS, 293, HeLa cells were maintained in DMEM medium supplemented with 10% fetal bovine serum. H1299 and 293 cells were
B Western blot of the p150caf-1 complex
 Loyola et al., Supplementary Figure 1 A MS data of the HP1α complex RIF1 SPT6 SMARCA4 POGZ CAF-1 p150 KAP-1 HP1α 200 116 97.1 CAF-1 p150 tnasp Importin4 B Western blot of the p150caf-1 complex Input mock
Supplementary Figure 1. APP cleavage assay. HEK293 cells were transfected with various
 Supplementary Figure 1. APP cleavage assay. HEK293 cells were transfected with various GST-tagged N-terminal truncated APP fragments including GST-APP full-length (FL), APP (123-695), APP (189-695), or
Supplemental Material: Rev1 promotes replication through UV lesions in conjunction with DNA
 Supplemental Material: Rev1 promotes replication through UV lesions in conjunction with DNA polymerases,, and, but not with DNA polymerase Jung-Hoon Yoon, Jeseong Park, Juan Conde, Maki Wakamiya, Louise
Supplementary Figure 1 PARP1 is involved in regulating the stability of mrnas from pro-inflammatory cytokine/chemokine mediators.
 Supplementary Figure 1 PARP1 is involved in regulating the stability of mrnas from pro-inflammatory cytokine/chemokine mediators. (a) A graphic depiction of the approach to determining the stability of
SUPPLEMENTARY INFORMATION
 DOI: 1.1/ncb2918 Supplementary Figure 1 (a) Biotin-dUTP labelling does not affect S phase progression. Cells synchronized in mid-s phase were labelled with biotindutp during a 5 min hypotonic shift (red)
Emanuela Tumini, Sonia Barroso, Carmen Pérez Calero and Andrés Aguilera
 SUPPLEMENTARY INFORMATION Roles of human POLD1 and POLD3 in genome stability Emanuela Tumini, Sonia Barroso, Carmen Pérez Calero and Andrés Aguilera SUPPLEMENTARY METHODS Cell proliferation After sirna
JCB. Supplemental material THE JOURNAL OF CELL BIOLOGY. Paul et al.,
 Supplemental material JCB Paul et al., http://www.jcb.org/cgi/content/full/jcb.201502040/dc1 THE JOURNAL OF CELL BIOLOGY Figure S1. Mutant p53-expressing cells display limited retrograde actin flow at
Supplementary information. Supplementary Figures
 Supplementary information Supplementary Figures Supplementary Figure 1. A. i. HA-JMY expressing U2OS cells were treated with SAHA (6h). DAPI was used to visualise nuclei. ii. U2OS cells stably expressing
transcription and the promoter occupancy of Smad proteins. (A) HepG2 cells were co-transfected with the wwp-luc reporter, and FLAG-tagged FHL1,
 HepG2 cells were co-transfected with the wwp-luc reporter, and FLAG-tagged FHL1,") Supplementary Data Supplementary Figure Legends Supplementary Figure 1 FHL-mediated TGFβ-responsive reporter transcription and the promoter occupancy of Smad proteins. (A) HepG2 cells were co-transfected
Supplementary Data Supplementary Figure Legends Supplementary Figure 1 FHL-mediated TGFβ-responsive reporter transcription and the promoter occupancy of Smad proteins. (A) HepG2 cells were co-transfected
Supplemental Figure Legends:
 Supplemental Figure Legends: Fig S1. GFP-ABRO1 localization. U2OS cells were infected with retrovirus expressing GFP- ABRO1. The cells were fixed with 3.6% formaldehyde and stained with antibodies against
Supplementary Figure 1. Localization of MST1 in RPE cells. Proliferating or ciliated HA- MST1 expressing RPE cells (see Fig. 5b for establishment of
 Supplementary Figure 1. Localization of MST1 in RPE cells. Proliferating or ciliated HA- MST1 expressing RPE cells (see Fig. 5b for establishment of the cell line) were immunostained for HA, acetylated
Nature Structural & Molecular Biology: doi: /nsmb.1583
 Acetylation by GCN5 regulates CDC6 phosphorylation in the S-phase of the cell cycle Roberta Paolinelli 1,2, Ramiro Mendoza-Maldonado 2, Anna Cereseto 1 and Mauro Giacca 2 1 Molecular Biology Laboratory,
Sarker et al. Supplementary Material. Subcellular Fractionation
 Supplementary Material Subcellular Fractionation Transfected 293T cells were harvested with phosphate buffered saline (PBS) and centrifuged at 2000 rpm (500g) for 3 min. The pellet was washed, re-centrifuged
NELF-E is recruited to DNA double-strand break sites to promote transcriptional repression and repair
 Manuscript EMBO-2016-43191 NELF-E is recruited to DNA double-strand break sites to promote transcriptional repression and repair Samah W. Awwad, Enas R. Abu-Zhayia, Noga Guttmann-Raviv, and Nabieh Ayoub
Supplemental Information Control of apico-basal epithelial polarity by the microtubule minus-end binding protein CAMSAP3 and spectraplakin ACF7
 Supplemental Information Control of apico-basal epithelial polarity by the microtubule minus-end binding protein CAMSAP3 and spectraplakin ACF7 Ivar Noordstra, Qingyang Liu, Wilco Nijenhuis, Shasha Hua,
SUPPORTING ONLINE MATERIAL
 SUPPORTING ONLINE MATERIAL SUPPLEMENTAL EXPERIMENTAL PROCEDURES Primers for qpcr and semiquantitative PCR and conditions for semiquantitative PCR G6Pase 5 -ttgtggcagaagcatttgag-3, 5 -atatccttgcactggcaacc-3.
MEFs were treated with the indicated concentrations of LLOMe for three hours, washed
 Supplementary Materials and Methods Cell Fractionation MEFs were treated with the indicated concentrations of LLOMe for three hours, washed with ice-cold PBS, collected by centrifugation, and then homogenized
Nature Structural & Molecular Biology: doi: /nsmb Supplementary Figure 1
 Supplementary Figure 1 Endogenous gene tagging to study subcellular localization and chromatin binding. a, b, Schematic of experimental set-up to endogenously tag RNAi factors using the CRISPR Cas9 technology,
Supplementary Figure 1. Drawing of spinal cord open-book preparations and DiI tracing. Nature Neuroscience: doi: /nn.3893
 Supplementary Figure 1 Drawing of spinal cord open-book preparations and DiI tracing. Supplementary Figure 2 In ovo electroporation of dominant-negative PlexinA1 in commissural neurons induces midline
Supplementary Fig. 1 Kinetics of appearence of the faster migrating form of Bcl-10.
 α-cd3 + α-cd28: Time (min): + + + + + + + + + 0 5 15 30 60 120 180 240 300 360 360 n.s. Supplementary Fig. 1 Kinetics of appearence of the faster migrating form of. Immunoblot of lysates from Jurkat cells
supplementary information
 DOI: 10.1038/ncb2156 Figure S1 Depletion of p114rhogef with different sirnas. Caco-2 (a) and HCE (b) cells were transfected with individual sirnas, pools of the two sirnas or the On Target (OnT) sirna
Thyroid peroxidase gene expression is induced by lipopolysaccharide involving Nuclear Factor (NF)-κB p65 subunit phosphorylation
-κB p65 subunit phosphorylation") 1 2 3 4 5 SUPPLEMENTAL DATA Thyroid peroxidase gene expression is induced by lipopolysaccharide involving Nuclear Factor (NF)-κB p65 subunit phosphorylation Magalí Nazar, Juan Pablo Nicola, María Laura
1 2 3 4 5 SUPPLEMENTAL DATA Thyroid peroxidase gene expression is induced by lipopolysaccharide involving Nuclear Factor (NF)-κB p65 subunit phosphorylation Magalí Nazar, Juan Pablo Nicola, María Laura
Supplementary Figure 1
 Supplementary Figure 1 A basic residue of BARD1 promotes Ub-transfer from BRCA1-E2~Ub. A. Scan of external facing BARD1 residues 91-99 for impact on Ub chain formation catalysed by the BRCA1- BARD1 ligase.
SUPPLEMENTARY INFORMATION
 DOI: 10.1038/ncb3363 Supplementary Figure 1 Several WNTs bind to the extracellular domains of PKD1. (a) HEK293T cells were co-transfected with indicated plasmids. Flag-tagged proteins were immunoprecipiated
supplementary information
 DOI: 10.1038/ncb1864 Figure S1 Apak specifically inhibits p53 transcriptional activity. Transcription activity of p53 was measured in U2OS (p53 wild-type) and H1299 (p53 deficient) cells which were transfected
Molecular basis for H3K36me3 recognition by the Tudor domain of PHF1
 Supplementary information Molecular basis for H3K36me3 recognition by the Tudor domain of PHF1 Catherine A. Musselman 1, Nikita Avvakumov 2, Reiko Watanabe 3, Christopher G. Abraham 4, Marie-Eve Lalonde
SUPPLEMENTARY NOTE 2. Supplememtary Note 2, Wehr et al., Monitoring Regulated Protein-Protein Interactions Using Split-TEV 1
 SUPPLEMENTARY NOTE 2 A recombinase reporter system for permanent reporter activation We made use of the Cre-loxP recombinase system for a maximal amplification and complete kinetic uncoupling within single
Hoffmann et al., http ://www.jcb.org /cgi /content /full /jcb /DC1
 Supplemental material JCB Hoffmann et al., http ://www.jcb.org /cgi /content /full /jcb.201506071 /DC1 THE JOU RNAL OF CELL BIO LOGY Figure S1. TRA IP harbors a PCNA-binding PIP box required for its recruitment
Hsapiens H. 47 ALFVQFNDQFFWGQLEAVEVKWSVRMTLCAGICSYE---GKGGMCSIRLSEPLLKLRPRK
 Supplementary Figures and Figure Legends Supplementary Figure 1 * * FAN1 KLACPVCSKMVPRYD...LNRHLDEMCANNDF POLK ILTCPVCFRAQGCISLEALNKHVD.ECLDGPS ALVCPVCNVEQKTSDLTLFNVHVD.VCLNKSF RAD18 KVDCPVCGVNIPESH...INKHLD.SCLSREE
JCB. Supplemental material THE JOURNAL OF CELL BIOLOGY. Kimura et al.,
 Supplemental material JCB Kimura et al., http://www.jcb.org/cgi/content/full/jcb.201503023/dc1 THE JOURNAL OF CELL BIOLOGY Figure S1. TRIMs regulate IFN-γ induced autophagy. (A and B) HC image analysis
THE JOURNAL OF CELL BIOLOGY
 Supplemental Material THE JOURNAL OF CELL BIOLOGY Toso et al., http://www.jcb.org/cgi/content/full/jcb.200809055/dc1 Figure S1. Control experiments for sirna depletions used in Figs. 1 3. The phenotype
Supplementary information to accompany: A novel role for the DNA repair gene Rad51 in Netrin-1 signalling
 Supplementary information to accompany: A novel role for the DNA repair gene Rad51 in Netrin-1 signalling Glendining KA 1, Markie D 2, Gardner RJM 4, Franz EA 3, Robertson SP 4, Jasoni CL 1 Supplementary
Description: Nuclear morphology and dynamics in nontargeting sirna transfected cells. HeLa Kyoto
 Title of file for HTML: Supplementary Information Description: Supplementary Figures and Supplementary Tables Title of file for HTML: Supplementary Movie 1 Description: Nuclear morphology and dynamics
PCNA appears in two populations of slow and fast diffusion with a constant ratio throughout S-phase in replicating mammalian cells
 PCNA appears in two populations of slow and fast diffusion with a constant ratio throughout S-phase in replicating mammalian cells Patrick J. M. Zessin 1, Anje Sporbert 2, *, Mike Heilemann 1, * 1 Institute
T H E J O U R N A L O F C E L L B I O L O G Y
 T H E J O U R N A L O F C E L L B I O L O G Y Supplemental material Bays et al., http://www.jcb.org/cgi/content/full/jcb.201309092/dc1 Figure S1. Specificity of the phospho-y822 antibody. (A) Total cell
Supplementary methods Shoc2 In Vitro Ubiquitination Assay
 Supplementary methods Shoc2 In Vitro Ubiquitination Assay 35 S-labelled Shoc2 was prepared using a TNT quick Coupled transcription/ translation System (Promega) as recommended by manufacturer. For the
14_integrins_EGFR
 α1 Integrin α1 -/- fibroblasts from integrin α1 knockout animals Figure S1. Serum-starved fibroblasts from α -/- 1 and +/+ mice were stimulated with 10% FBS for 30 min. (FBS) or plated on collagen I (CI)
Supplementary information
 Supplementary information The E3 ligase RNF8 regulates KU80 removal and NHEJ repair Lin Feng 1, Junjie Chen 1 1 Department of Experimental Radiation Oncology, The University of Texas M. D. Anderson Cancer
Journal of Cell Science Supplementary Material
 1 2 3 4 5 6 7 8 9 10 11 12 13 14 15 16 17 18 19 20 21 22 23 24 25 26 27 28 29 30 31 32 33 SUPPLEMENTARY FIGURE LEGENDS Figure S1: Eps8 is localized at focal adhesions and binds directly to FAK (A) Focal
Cell extracts and western blotting RNA isolation and real-time PCR Chromatin immunoprecipitation (ChIP)
") Cell extracts and western blotting Cells were washed with ice-cold phosphate-buffered saline (PBS) and lysed with lysis buffer. 1 Total cell extracts were separated by SDS-PAGE and transferred to nitrocellulose
Cell extracts and western blotting Cells were washed with ice-cold phosphate-buffered saline (PBS) and lysed with lysis buffer. 1 Total cell extracts were separated by SDS-PAGE and transferred to nitrocellulose
Short hairpin RNA (shrna) against MMP14. Lentiviral plasmids containing shrna
 against MMP14. Lentiviral plasmids containing shrna") Supplemental Materials and Methods Short hairpin RNA (shrna) against MMP14. Lentiviral plasmids containing shrna (Mission shrna, Sigma) against mouse MMP14 were transfected into HEK293 cells using FuGene6
Supplemental Materials and Methods Short hairpin RNA (shrna) against MMP14. Lentiviral plasmids containing shrna (Mission shrna, Sigma) against mouse MMP14 were transfected into HEK293 cells using FuGene6
Cell proliferation was measured with Cell Counting Kit-8 (Dojindo Laboratories, Kumamoto, Japan).
.") 1 2 3 4 5 6 7 8 Supplemental Materials and Methods Cell proliferation assay Cell proliferation was measured with Cell Counting Kit-8 (Dojindo Laboratories, Kumamoto, Japan). GCs were plated at 96-well
1 2 3 4 5 6 7 8 Supplemental Materials and Methods Cell proliferation assay Cell proliferation was measured with Cell Counting Kit-8 (Dojindo Laboratories, Kumamoto, Japan). GCs were plated at 96-well
SUPPLEMENTARY INFORMATION
 DOI: 10.1038/ncb2271 Supplementary Figure a! WM266.4 mock WM266.4 #7 sirna WM266.4 #10 sirna SKMEL28 mock SKMEL28 #7 sirna SKMEL28 #10 sirna WM1361 mock WM1361 #7 sirna WM1361 #10 sirna 9 WM266. WM136
No wash 2 Washes 2 Days ** ** IgG-bead phagocytosis (%)
") Supplementary Figures Supplementary Figure 1. No wash 2 Washes 2 Days Tat Control ** ** 2 4 6 8 IgG-bead phagocytosis (%) Supplementary Figure 1. Reversibility of phagocytosis inhibition by Tat. Human
Supplementary Figures Supplementary Figure 1. No wash 2 Washes 2 Days Tat Control ** ** 2 4 6 8 IgG-bead phagocytosis (%) Supplementary Figure 1. Reversibility of phagocytosis inhibition by Tat. Human
Supplementary Fig S1 Nutlin-3a treatment does not affect cell cycle progression in the absence
 Supplementary Figure Legends Supplementary Fig S1 Nutlin-3a treatment does not affect cell cycle progression in the absence of p53 or p21. HCT116 cells which were null for either p53 (A) or p21 (B) were