Supplementary material to Alterations in the properties of the cell membrane due to glycosphingolipid accumulation in a model of Gaucher disease
|
|
|
- Georgia Morgan
- 6 years ago
- Views:
Transcription
1 Supplementary material to Alterations in the properties of the cell membrane due to glycosphingolipid accumulation in a model of Gaucher disease Gyula Batta, Lilla Soltész, Tamás Kovács, Tamás Bozó, Zoltán Mészár, Miklós Kellermayer, János Szöllősi, Peter Nagy
 and fluorescein-diacetate (FDA, green channel) labeling dead and viable")
2 Figure S1. Cell viability is not affected by CBE treatment. Control samples and cells treated with CBE for four days were stained with a mixture of propidium iodide (PI, red channel) and fluorescein-diacetate (FDA, green channel) labeling dead and viable cells, respectively. Staining was performed with 200 g/ml PI and 25 g/ml FDA for 15 minutes. Fluorescence overlay images and the corresponding transmission images for control and CBE-treated cells are shown in the figure. The fraction of PI + dead cells was 94 1% and 96 1% for control and CBE-treated cells, respectively, based upon analysis of 10 images for both conditions. 2

3 Figure S2. Demonstration of labeling of different membrane domains by TR-DHPE and BodipyFL-GM1. Control cells were labeled with TR-DHPE and BodipyFL-GM1 lipid analogues and a confocal microscopic section of the flat membrane surface adjacent to the coverslip was recorded. The fluorescence of BodipyFL-GM1 and TR-DHPE are shown in the green and red channels, respectively. Although the displayed images were contrast-stretched, the analysis was performed on the original data. Pearson s correlation coefficient was calculated for the whole image (r=0.82) and for a smaller part as well (r= 0.08). The confidence interval (C.I.) for the lack of correlation (r=0) was calculated according to the method of Costes 1. The bright areas in the image on the left likely correspond to membrane folds often misinterpreted as areas exhibiting colocalization 2. 3
4 Figure S3. Analysis of fluorescence recovery after photobleaching (FRAP) experiments. Control and Gaucher-type macrophages were labeled with TR-DHPE followed by FRAP analysis. A. Due to movement of the cell during the recovery period, a single membrane mask ( static watershed ) was not sufficient to produce reliable recovery curves. When the membrane mask was defined in each slice using watershed segmentation ( moving watershed ), movement artifacts were removed. B-C. Representative recovery curves measured in control and Gaucher-type macrophages (B) and the residuals from the fitted model (C). 4
5 Figure S4. Averaged FRAP curves in control and Gaucher-type cells. Individual fluorescence recovery curves were double-normalized as described in Materials and Methods followed by calculating their mean ( standard error of the mean). The curves represent 10 individual cells from three independent measurements. 5


6 Figure S5. Demonstration of membrane staining with Laurdan and TMA-DPH. Control and Gaucher-type cells were stained with the two indicators as described in Materials and methods, and the fluorescence of Laurdan and TMA-DPH was measured by two-photon microscopy. The images demonstrate preferential staining of the plasma membrane under the applied staining and imaging conditions. 6


7 Figure S6. Determination of the relative height of cells. Control and Gaucher cells were labeled with Bodipy FL-GM1 followed by recording confocal stacks using identical microscope settings. Orthogonal views of representative examples are shown on the left. Manually-seeded, three dimensional watershed segmentation was used to identify cells. The color-coded cell masks are shown on the right. The area of the cell, defined as the number of pixels constituting the cell mask in the layer adjacent to the coverslip, and the height, defined as the distance in pixels between the bottom of the cell and its highest pixel in the mask, were calculated. The relative height of individual cells was calculated as the height divided by the area. These normalized cell heights did not differ significantly between the control and Gaucher-type cells (mean SEM was and for control and Gaucher cells, respectively. n=200 for both samples). 7

8 Figure S7. Analysis of membrane tether formation by atomic force microscopy. Membrane tether formation was analyzed in the retraction curves measured by atomic force microscopy in a custom-written Matlab program whose graphical user interface is shown in the figure. The force-separation plot of a full approach-retraction cycle is displayed in the insert in the lower right corner. Automatic detection of step-like changes in the force-separation plot was followed by visual correction. The red and green dots and lines label the detected drops in the force experienced by the AFM cantilever corresponding to severing of single membrane tethers. 8

. A.")
 and nuclear staining with DAPI (blue")
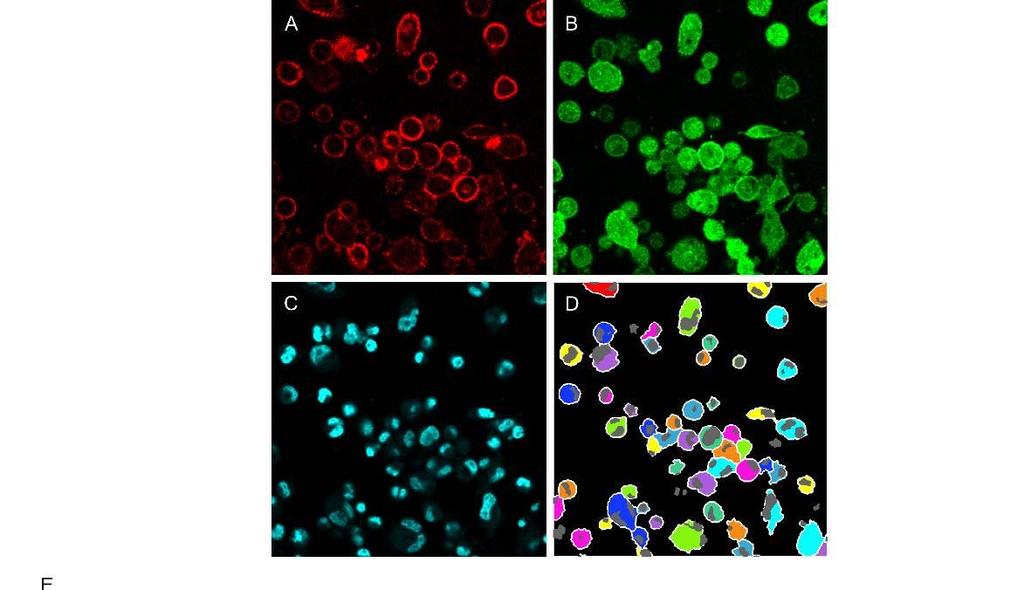
9 Figure S8. Quantitative evaluation of the endocytosis of transferrin and subunit B of cholera toxin (CTX-B). A. Membrane staining with anti-cd14 (green channel) and nuclear staining with DAPI (blue channel) were used for image segmentation. Red rectangles label each identified 9
10 cell. B. The fluorescence intensity of AlexaFluor647-transferrin is displayed in gray-scale. C. The membrane mask (blue) and the intracellular mask (red) identified by nuclear segmentation according to Wählby 3 and manually-seeded watershed segmentation 4 are shown in the image. D. The mask shown in C was overlaid on the fluorescence image of AlexaFluor647-transferrin shown in green. E-F. Representative images showing the endocytosis of transferrin (E) and CTX-B (F) in control and Gaucher-type macrophages. 10
11 11
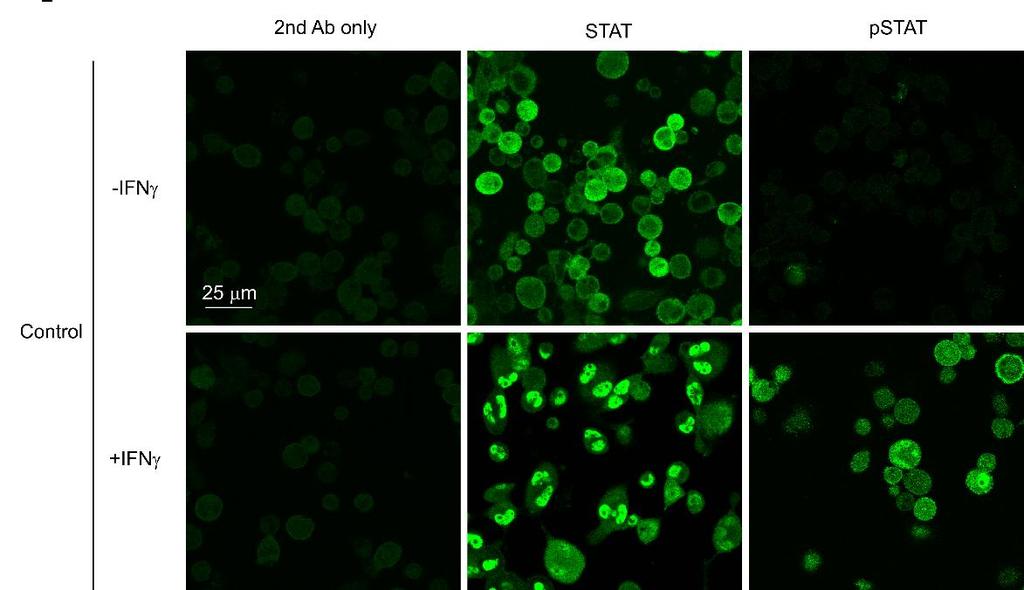
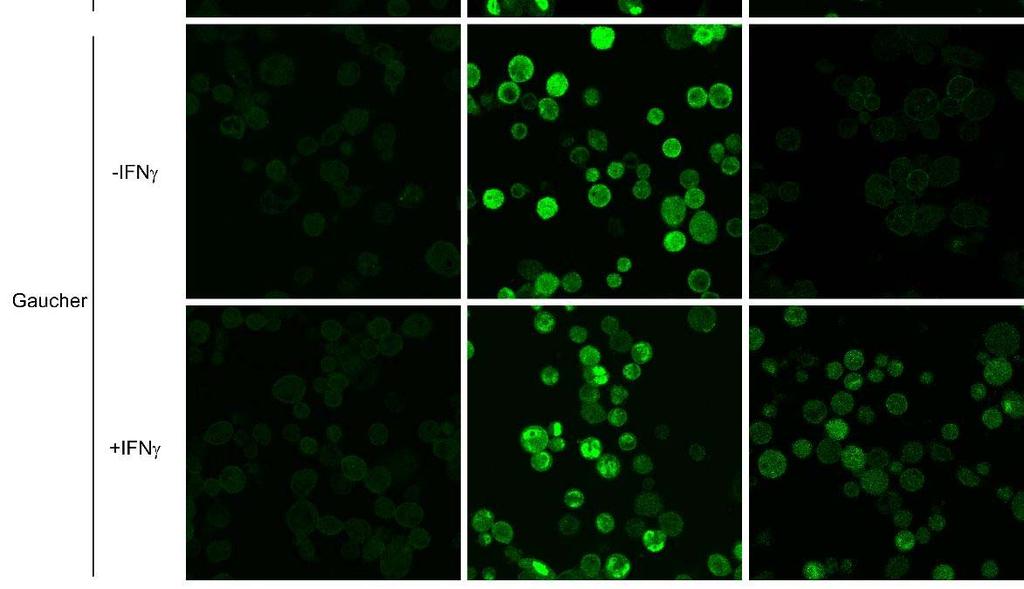
12 Figure S9. Measurement of STAT phosphorylation in control and Gaucher-type cells (on previous page). A-D. Segmentation of confocal images for analyzing STAT phosphorylation. Cells were labeled with AlexaFluor647-transferrin (A), a monoclonal antibody against pstat1 (B) and DAPI (C). Nuclei were identified by the Wählby algorithm 3 followed by watershed segmentation using the nuclei as seeds to identify the cell membrane 4. Segmentation results are shown in D. The white lines and the gray areas correspond to the cell membrane and the nucleus, respectively. Cells with nuclei whose size was below a threshold and nuclei without cytoplasm around them were not evaluated. E. Representative images for the measurement of tyrosine phosphorylation of STAT1. Control and Gaucher-type cells were starved overnight followed by stimulation with 1000 U/ml recombinant human IFNγ at 37 C for 30 min and staining for total-stat1 and tyrosinephosphorylated STAT1. Control samples stained with secondary antibody only, and cells stained with primary antibodies against STAT1 or tyrosine-phosphorylated STAT1 followed by secondary staining are shown in the figure. Images were contrast-stretched in an identical manner to preserve the relative differences between samples. 12
13 Figure S10. Flow cytometric investigation of the expression and tyrosine phosphorylation of STAT1 in control and Gaucher-type cells. Serum-starved control (top row) and Gaucher-type cells (bottom row) were stimulated with IFN- followed by trypsinization and secondary staining against STAT1 or tyrosine phosphorylated STAT1 (pstat1). Representative flow cytometric histograms are shown in the figure. 13
14 Supplementary references 1 Costes, S. V. et al. Automatic and quantitative measurement of protein-protein colocalization in live cells. Biophys J 86, , doi: /biophysj S (04) [pii] (2004). 2 Parmryd, I. & Onfelt, B. Consequences of membrane topography. FEBS J 280, , doi: /febs (2013). 3 Wählby, C., Sintorn, I. M., Erlandsson, F., Borgefors, G. & Bengtsson, E. Combining intensity, edge and shape information for 2D and 3D segmentation of cell nuclei in tissue sections. J Microsc 215, 67-76, doi: /j x (2004). 4 Gonzalez, R. C., Woods, R. E. & Eddins, S. L. in Digital Image Processing Using Matlab (eds R.C. Gonzalez, R.E. Woods, & S.L. Eddins) Ch. 10.5, (Pearson Prentice Hall, 2004). 14
Multiplex Fluorescence Assays for Adherence Cells without Trypsinization
 Multiplex Fluorescence Assays for Adherence Cells without Trypsinization The combination of a bright field and three fluorescent channels allows the Celigo to perform many multiplexed assays. A gating
Supplementary Figure 1. Two activation pathways and four conformations of β 2 integrins. KIM127 (red) can specifically detect
 can specifically detect") Supplementary Figure 1 Two activation pathways and four conformations of β 2 integrins. KIM127 (red) can specifically detect integrin extension (E + ) and mab24 (green) can specifically detect headpiece-opening
Supplementary Figure 1 Two activation pathways and four conformations of β 2 integrins. KIM127 (red) can specifically detect integrin extension (E + ) and mab24 (green) can specifically detect headpiece-opening
204 Part 3.3 SUMMARY INTRODUCTION
 204 Part 3.3 Chapter # METHODOLOGY FOR BUILDING OF COMPLEX WORKFLOWS WITH PROSTAK PACKAGE AND ISIMBIOS Matveeva A. *, Kozlov K., Samsonova M. Department of Computational Biology, Center for Advanced Studies,
Supplementary Materials and Methods
 Supplementary Materials and Methods Reagents Supplementary Material (ESI) for Lab on a Chip RPMI medium, FBS, HEPES buffer solution, sodium pyruvate, penicillin, and streptomycin were obtained from Biological
Add Live, Dead and Total Dyes. Overnight Variable 30 min. 10 min 5 min. 30 min
 Cell Viability Analysis using Calcein AM, Propidium Iodide and Hoechst Application Description Celigo Application Plate Type Major Steps Cell viability analysis using Calcein AM, Propidium Iodide and Hoechst
SUPPLEMENTARY INFORMATION
 DOI: 10.1038/NCHEM.1805 Visualization and Selective Chemical Targeting of RNA G-quadruplex Structures in the Cytoplasm of Human Cells Giulia Biffi 1, Marco Di Antonio 2, David Tannahill 1 and Shankar Balasubramanian
over time using live cell microscopy. The time post infection is indicated in the lower left corner.
 Title of file for HTML: Supplementary Information Description: Supplementary Figures and Supplementary Table Title of file for HTML: Supplementary Movie 1 Description: Fusion of NBs. BSR cells were infected
Large-scale fabrication of free-standing and sub-μm PDMS through-holes membranes
 Electronic Supplementary Material (ESI) for. This journal is The Royal Society of Chemistry 2018 Large-scale fabrication of free-standing and sub-μm PDMS through-holes membranes Hai Le-The,* a Martijn
Figure S1 is related to Figure 1B, showing more details of outer segment of
 Supplemental Information Supplementary Figure legends and Figures Figure S1. Electron microscopic images in Sema4A +/+ and Sema4A / retinas Figure S1 is related to Figure 1B, showing more details of outer
Beta3 integrin promotes long-lasting activation and polarization of Vascular Endothelial Growth Factor Receptor 2 by immobilized ligand
 SUPPLEMENTAL FIGURES Beta3 integrin promotes long-lasting activation and polarization of Vascular Endothelial Growth Factor Receptor 2 by immobilized ligand C. Ravelli et al. FIGURE S. I Figure S. I: Gremlin
Supplemental Fig. 1: PEA-15 knockdown efficiency assessed by immunohistochemistry and qpcr
 Supplemental figure legends Supplemental Fig. 1: PEA-15 knockdown efficiency assessed by immunohistochemistry and qpcr A, LβT2 cells were transfected with either scrambled or PEA-15 sirna. Cells were then
Supplementary Figure 1. Intracellular distribution of the EPE peptide. HeLa cells were serum-starved (16 h, 0.1%), and treated with EPE peptide,
, and treated with EPE peptide,") Supplementary Figure 1. Intracellular distribution of the EPE peptide. HeLa cells were serum-starved (16 h, 0.1%), and treated with EPE peptide, conjugated with either TAT or Myristic acid and biotin for
Supplementary Figure 1. Intracellular distribution of the EPE peptide. HeLa cells were serum-starved (16 h, 0.1%), and treated with EPE peptide, conjugated with either TAT or Myristic acid and biotin for
Ab-DeliverIN TM - Antibody Delivery Reagent Results
 Ab-DeliverIN TM - Antibody Delivery Reagent Results OZ Biosciences is delighted to announce the launching of the innovative Ab-DeliverIN TM - antibody delivery reagent. Ab-DeliverIN TM is a lipid based
Electronic Supplementary Information
 Electronic Supplementary Material (ESI) for Integrative Biology. This journal is The Royal Society of Chemistry 2015 Electronic Supplementary Information Table S1. Definition of quantitative cellular features
Brightfield and Fluorescence Imaging using 3D PrimeSurface Ultra-Low Attachment Microplates
 A p p l i c a t i o n N o t e Brightfield and Fluorescence Imaging using 3D PrimeSurface Ultra-Low Attachment Microplates Brad Larson, BioTek Instruments, Inc., Winooski, VT USA Anju Dang, S-BIO, Hudson,
JCB. Supplemental material THE JOURNAL OF CELL BIOLOGY. Prospéri et al.,
 Supplemental material JCB Prospéri et al., http://www.jcb.org/cgi/content/full/jcb.201501018/dc1 THE JOURNAL OF CELL BIOLOGY Figure S1. Myo1b Tail interacts with YFP-EphB2 coated beads and genistein inhibits
Supplemental figures Supplemental Figure 1: Fluorescence recovery for FRAP experiments depicted in Figure 1.
 Supplemental figures Supplemental Figure 1: Fluorescence recovery for FRAP experiments depicted in Figure 1. Percent of original fluorescence was plotted as a function of time following photobleaching
Supplemental Information. A Versatile Tool for Live-Cell Imaging. and Super-Resolution Nanoscopy Studies. of HIV-1 Env Distribution and Mobility
 Cell Chemical Biology, Volume 24 Supplemental Information A Versatile Tool for Live-Cell Imaging and Super-Resolution Nanoscopy Studies of HIV-1 Env Distribution and Mobility Volkan Sakin, Janina Hanne,
cell and tissue imaging by fluorescence microscopy
 cell and tissue imaging by fluorescence microscopy Steven NEDELLEC Plateforme Micropicell SFR Santé François Bonamy Nantes 1 A matter of size Limit of resolution 0.15mm aims: building the image of an object
Contents. SCHOOL of FLUORESCENCE. For more information, go to lifetechnologies.com/imagingbasics
 MPSF educator packet This packet contains illustrations and figures from the Molecular Probes School of Fluorescence website. They illustrate concepts from the basic physical properties that underlie fluorescence
λ N -GFP: an RNA reporter system for live-cell imaging
 λ N -GFP: an RNA reporter system for live-cell imaging Nathalie Daigle & Jan Ellenberg Supplementary Figures and Text: Supplementary Figure 1 localization in the cytoplasm. 4 λ N22-3 megfp-m9 serves as
Supplementary Figure 1.
 Supplementary Figure 1. Quantification of western blot analysis of fibroblasts (related to Figure 1) (A-F) Quantification of western blot analysis for control and IR-Mut fibroblasts. Data are expressed
ER stress and autophagy: new players in the mechanism of action and drug resistance of SUPPLEMENTAL DATA
 ER stress and autophagy: new players in the mechanism of action and drug resistance of the cyclin-dependent kinase inhibitor SUPPLEMENTAL DATA METHODS Confocal immunofluorescence microscopy of fixed cells:
. Viability of colonies was then assessed using the WST-1 reagent as described above, and normalized relative to untreated controls.
 Cell viability analysis in the absence of disaggregation To assess cell viability in the absence of disaggregation, quintuplicate samples of cells at 5 x 1 5 /ml were treated with mab (1 µg/ml) for 24
Live and Dead Cell Assay
 ab115347 Live and Dead Cell Assay Instructions for Use Differential fluorescent labeling of live and dead cells This product is for research use only and is not intended for diagnostic use. Last Updated
Technical Bulletin. Multiple Methods for Detecting Apoptosis on the BD Accuri C6 Flow Cytometer. Introduction
 March 212 Multiple Methods for Detecting Apoptosis on the BD Accuri C6 Flow Cytometer Contents 1 Introduction 2 Annexin V 4 JC-1 5 Caspase-3 6 APO-BrdU and APO-Direct Introduction Apoptosis (programmed
Nature Biotechnology: doi: /nbt.4086
 Ag (-) anti-cd3 p815 p815-hcd2 Ag (-) anti-cd3 p815 p815-hcd2 Ag (-) anti-cd3 p815 p815-hcd2 Ag (-) anti-cd3 p815 p815-hcd2 Ag (-) anti-cd3 p815 p815-hcd2 Ag (-) anti-cd3 p815 p815-hcd2 Ag (-) anti-cd3
Genome-wide CRISPR screen reveals novel host factors required for Staphylococcus aureus α-hemolysin-mediated toxicity
 Genome-wide CRISPR screen reveals novel host factors required for Staphylococcus aureus α-hemolysin-mediated toxicity Sebastian Virreira Winter, Arturo Zychlinsky and Bart W. Bardoel Department of Cellular
Quantitative real-time RT-PCR analysis of the expression levels of E-cadherin
 Supplementary Information 1 Quantitative real-time RT-PCR analysis of the expression levels of E-cadherin and ribosomal protein L19 (RPL19) mrna in cleft and bud epithelial cells of embryonic salivary
SUPPLEMENTARY INFORMATION
 Nanomechanical mapping of first binding steps of a virus to animal cells David Alsteens, Richard Newton, Rajib Schubert, David Martinez-Martin, Martin Delguste, Botond Roska and Daniel J. Müller This PDF
5.4 PERIODONTAL LIGAMENT STEM CELL (PDLSC) ISOLATION. Having validated that the isolated PDL stromal cells possessed the major phenotypic
 ISOLATION. Having validated that the isolated PDL stromal cells possessed the major phenotypic") 5.4 PERIODONTAL LIGAMENT STEM CELL (PDLSC) ISOLATION Having validated that the isolated PDL stromal cells possessed the major phenotypic characteristics of their tissue of origin, we next focused on identifying
5.4 PERIODONTAL LIGAMENT STEM CELL (PDLSC) ISOLATION Having validated that the isolated PDL stromal cells possessed the major phenotypic characteristics of their tissue of origin, we next focused on identifying
Supplementary Figure S1. Immunodetection of full-length XA21 and the XA21 C-terminal cleavage product.
 Supplementary Information Supplementary Figure S1. Immunodetection of full-length XA21 and the XA21 C-terminal cleavage product. Total protein extracted from Kitaake wild type and rice plants carrying
SUPPLEMENTARY INFORMATION
 SUPPLEMENTARY INFORMATION Legends for Supplementary Tables. Supplementary Table 1. An excel file containing primary screen data. Worksheet 1, Normalized quantification data from a duplicated screen: valid
SUPPLEMENTARY INFORMATION FIGURE LEGENDS
 SUPPLEMENTARY INFORMATION FIGURE LEGENDS Fig. S1. Radiation-induced phosphorylation of Rad50 at a specific site. A. Rad50 is an in vitro substrate for ATM. A series of Rad50-GSTs covering the entire molecule
Fundamentals and Applications of Biofilms Analysis, Structure and Physiology of Bacterial Biofilms Ching-Tsan Huang ( 黃慶璨 ) Office: Agronomy
 Office: Agronomy") 1 Fundamentals and Applications of Biofilms Analysis, Structure and Physiology of Bacterial Biofilms Ching-Tsan Huang ( 黃慶璨 ) Office: Agronomy Building, Room 111 Tel: (02) 33664454 E-mail: cthuang@ntu.edu.tw
1 Fundamentals and Applications of Biofilms Analysis, Structure and Physiology of Bacterial Biofilms Ching-Tsan Huang ( 黃慶璨 ) Office: Agronomy Building, Room 111 Tel: (02) 33664454 E-mail: cthuang@ntu.edu.tw
Combined fluorescence and AFM imaging of cells
 Combined fluorescence and AFM imaging of cells Introduction Combining optical and AFM imaging of cells opens up many possibilities for correlating structural information about the cell surface with functional
Supplementary Figure 1. Co-localization of GLUT1 and DNAL4 in BeWo cells cultured
 Supplementary Figure 1. Co-localization of GLUT1 and DNAL4 in BeWo cells cultured under static conditions. Cells were seeded in the chamber area of the device and cultured overnight without medium perfusion.
Supplemental Information. Histo-Cytometry: A Method for Highly Multiplex. Quantitative Tissue Imaging Analysis Applied to
 Immunity, Volume 37 Supplemental Information Histo-Cytometry: A Method for Highly Multiplex Quantitative Tissue Imaging Analysis Applied to Dendritic Cell Subset Microanatomy in Lymph Nodes Michael Y.
Image-based Quantification of Skin Irritation by Spatial Biomarker Profiling
 Image-based Quantification of Skin Irritation by Spatial Biomarker Profiling Thora Pommerencke, Kathi Westphal, Claudia Ernst, Hartmut Dickhaus, Niels Grabe Institute for Medical Biometry and Informatics,
Supplementary Information
 Supplementary Information Supplementary Figure S1 (a) P-cRAF colocalizes with LC3 puncta. Immunofluorescence (IF) depicting colocalization of P-cRAF (green) and LC3 puncta (red) in NIH/3T3 cells treated
PHT1;2-CFP YFP-PHF + PHT1;2-CFP YFP-PHF
 YFP-PHF1 CFP-PHT1;2 PHT1;2-CFP YFP-PHF + PHT1;2-CFP YFP-PHF + CFP-PHT1;2 Negative control!-gfp Supplemental Figure 1: PHT1;2 accumulation is PHF1 dependent. Immunoblot analysis on total protein extract
Image Analysis for Calculation of the Toxicity Degree of Cells in Phase Contrast Microscopy Images
 Image Analysis for Calculation of the Toxicity Degree of Cells in Phase Contrast Microscopy Images M. Athelogou 1, M. Eblenkamp 2, G. Schmidt 1, F. Novotny 2, E. Wintermantel 2, G. Binnig 1 1 Definiens
Description. Lipodin-Pro TM - Protein Transfection Reagent. 1. Kit Benefits
 Description Lipodin-Pro TM - Protein Transfection Reagent The delivery of proteins inside living cells represents an alternative to nucleic acids transfection and a powerful strategy for functional studies
T H E J O U R N A L O F C E L L B I O L O G Y
 T H E J O U R N A L O F C E L L B I O L O G Y Supplemental material Rainero et al., http://www.jcb.org/cgi/content/full/jcb.201109112/dc1 Figure S1. The expression of DGK- is reduced upon transfection
Performance of cell viability and cytotoxicity assays on the IN Cell Analyzer 3000
 GE Healthcare Application Note 28-4070-51 AA IN Cell Analyzer 3000 Performance of cell viability and cytotoxicity assays on the IN Cell Analyzer 3000 Key words: cell-based assay viability cytotoxicity
Imaging of Cells using fluorescents dyes. By: Josué A. Benjamín Rivera September 27, 2018
 Imaging of Cells using fluorescents dyes By: Josué A. Benjamín Rivera September 27, 2018 1 History Sir William Henry Perkin BRITISH CHEMIST In 1856, at the age of 18, William Henry Perkin set out with
Algorithms for Applied Digital Image Cytometry
 Comprehensive Summaries of Uppsala Dissertations from the Faculty of Science and Technology 896 Algorithms for Applied Digital Image Cytometry BY CAROLINA WÄHLBY ACTA UNIVERSITATIS UPSALIENSIS UPPSALA
CD93 and dystroglycan cooperation in human endothelial cell adhesion and migration
 /, Supplementary Advance Publications Materials 2016 CD93 and dystroglycan cooperation in human endothelial cell adhesion and migration Supplementary Materials Supplementary Figure S1: In ECs CD93 silencing
Cell Proliferation and Death
 Cell Proliferation and Death Derek Davies, Cancer Research UK http://www.london-research-institute.org.uk/technologies/120 Proliferation A cell Apoptosis Cell death Proliferation signals Senescence DNA
Reviewer #1 (Remarks to the Author):
:") Reviewer #1 (Remarks to the Author): This manuscript describes a novel application of dye-labeled DNA-conjugated AuNPs in visualizing intracellular transport within living cells. The most important result
Reviewer #1 (Remarks to the Author): This manuscript describes a novel application of dye-labeled DNA-conjugated AuNPs in visualizing intracellular transport within living cells. The most important result
SUPPLEMENTARY INFORMATION
 doi:10.1038/nature12072 SUPPLEMENTARY FIGURES: Supplementary Figure 1: The NV centre consists of a substitutional nitrogen atom (N) adjacent to a vacancy (V) in the diamond lattice. WWW.NATURE.COM/NATURE
Fast, three-dimensional super-resolution imaging of live cells
 Nature Methods Fast, three-dimensional super-resolution imaging of live cells Sara A Jones, Sang-Hee Shim, Jiang He & Xiaowei Zhuang Supplementary Figure 1 Supplementary Figure 2 Supplementary Figure 3
Analysis of receptor oligomerization by FRAP microscopy
 TIGP CBMB Student Seminar Analysis of receptor oligomerization by FRAP microscopy Dorsch S, Klotz KN, Engelhardt S, Lohse MJ, Bünemann M Nat Methods. 2009 Mar;6(3):225 30. K. Vijayasarathy March 10 th
11/19/2013. Janine Zankl FACS Core Facility 13. November Cellular Parameters. Cellular Parameters. Monocytes. Granulocytes.
 DEPARTEMENT BIOZENTRUM Janine Zankl FACS Core Facility 13. November 2013 Cellular Parameters Granulocytes Monocytes Basophils Neutrophils Lymphocytes Eosinophils Cellular Parameters 1 What Is Flow Cytometry?
Supplementary Figure 1
 Supplementary Figure 1 (A) Schematic of sequential hybridization and barcoding. (B) Schematic of the FISH images of the cell. In each round of hybridization, the same spots are detected, but the dye associated
Supplementary Figure 1: Two modes of low concentration of BsSMC on a DNA (a) Protein staining (left) and fluorescent imaging of Cy3 (right) confirm
 Protein staining (left) and fluorescent imaging of Cy3 (right) confirm") Supplementary Figure 1: Two modes of low concentration of BsSMC on a DNA (a) Protein staining (left) and fluorescent imaging of Cy3 (right) confirm that BsSMC was labeled with Cy3 NHS-Ester. In each panel,
Supplementary Figure 1: Two modes of low concentration of BsSMC on a DNA (a) Protein staining (left) and fluorescent imaging of Cy3 (right) confirm that BsSMC was labeled with Cy3 NHS-Ester. In each panel,
Visualizing mechanical tension across membrane receptors with a fluorescent sensor
 Nature Methods Visualizing mechanical tension across membrane receptors with a fluorescent sensor Daniel R. Stabley, Carol Jurchenko, Stephen S. Marshall, Khalid S. Salaita Supplementary Figure 1 Fabrication
Automated Digital Microscopy
 A p p l i c a t i o n G u i d e Peter Banks, Ph.D. and Peter J. Brescia, Applications Department, BioTek Instruments, Inc., Winooski, VT Table of Contents Introduction ----------------------------------------------------------------------------------------------------------------------
Supplementary Figure 1. Immunoprecipitation of synthetic SUMOm-remnant peptides using UMO monoclonal antibody. (a) LC-MS analyses of tryptic
 LC-MS analyses of tryptic") Supplementary Figure 1. Immunoprecipitation of synthetic SUMOm-remnant peptides using UMO 1-7-7 monoclonal antibody. (a) LC-MS analyses of tryptic digest from HEK293 cells spiked with 6 SUMOmremnant peptides
Supplementary Figure 1. Immunoprecipitation of synthetic SUMOm-remnant peptides using UMO 1-7-7 monoclonal antibody. (a) LC-MS analyses of tryptic digest from HEK293 cells spiked with 6 SUMOmremnant peptides
Supplementary Figures 1-6
 1 Supplementary Figures 1-6 2 3 4 5 6 7 Supplementary Fig. 1: GFP-KlpA forms a homodimer. a, Hydrodynamic analysis of the purified full-length GFP-KlpA protein. Fractions from size exclusion chromatography
Panx2 expression modulates neuronal differentiation SUPPLEMENTAL DATA. Figure Legends
 Panx2 expression modulates neuronal differentiation SUPPLEMENTAL DATA Figure Legends Suppl. Fig. S1. Antigenic determinants of the Panx2 antibodies employed in this study. (A) Schematic of mouse Panx2
A Brief History of Light Microscopy And How It Transformed Biomedical Research
 A Brief History of Light Microscopy And How It Transformed Biomedical Research Suewei Lin Office: Interdisciplinary Research Building 8A08 Email: sueweilin@gate.sinica.edu.tw TEL: 2789-9315 Microscope
Pro-DeliverIN TM - Protein Delivery Reagent Results
 Pro-DeliverIN TM - Protein Delivery Reagent Results OZ Biosciences is delighted to announce the launching of the innovative Pro-DeliverIN - Protein Delivery Reagent. Pro-DeliverIN is a lipid based formulation
Supplementary Figure 1. IFN-γ induces TRC dormancy. a, IFN-γ induced dormancy
 Supplementary Figure 1. IFN-γ induces TRC dormancy. a, IFN-γ induced dormancy of various tumor type TRCs, including H22 (murine hepatocarcinoma) and CT26 (murine colon cancer). Bar, 50 µm. b, B16 cells
APPLICATION SPECIFIC PROTOCOL CELL MIGRATION FOR ADHERENT CELLS
 APPLICATION SPECIFIC PROTOCOL CELL MIGRATION FOR ADHERENT CELLS AIM 3D Cell Culture Chips are very useful for the study of 3D cell invasion and migration. The chips are not only suitable for endpoint measurement;
SONOMA STATE UNIVERSITY DEPARTMENT OF BIOLOGY BIOLOGY 344: CELL BIOLOGY Fall 2013
 SONOMA STATE UNIVERSITY DEPARTMENT OF BIOLOGY BIOLOGY 344: CELL BIOLOGY Fall 2013 Instructor Murali C. Pillai, PhD Office 214 Darwin Hall Telephone (707) 664-2981 E-mail pillai@sonoma.edu Website www.sonoma.edu/users/p/pillai
Quantitative analysis of Bidirectional Signaling (qbids)
") Quantitative analysis of Bidirectional Signaling (qbids) EphB2 + cells were labeled independently with light (C 12 N 14 ) arginine and lysine or heavy (C 13 N 15 ) arginine and lysine ephrin-b1 + cells
Quantitative analysis of Bidirectional Signaling (qbids) EphB2 + cells were labeled independently with light (C 12 N 14 ) arginine and lysine or heavy (C 13 N 15 ) arginine and lysine ephrin-b1 + cells
SUPPLEMENTARY INFORMATION
 doi:10.1038/nature10016 Supplementary discussion on binding site density for protein complexes on the surface: The density of biotin sites on the chip is ~10 3 biotin-peg per µm 2. The biotin sites are
Immunofluorescence Staining Protocol for 3 Well Chamber, removable
 Immunofluorescence Staining Protocol for 3 Well Chamber, removable This Application Note presents a simple protocol for the cultivation, fixation, and staining of cells using the 3 Well Chamber, removable.
Nature Neuroscience: doi: /nn Supplementary Figure 1
 Supplementary Figure 1 PCR-genotyping of the three mouse models used in this study and controls for behavioral experiments after semi-chronic Pten inhibition. a-c. DNA from App/Psen1 (a), Pten tg (b) and
Primer pairs used for RT-PCR analyses Cell treatments with recombinant proteins Confocal microscopy Image analysis
 Primer pairs used for RT-PCR analyses Primer pairs were as follows: EphA1 (FW-GCCACCATCTGTACCTGTGA, RV- CTGACACTCCATTTTGGGCT); EphA2 (FW-GAACAACTGAAGCCCCTGAA; RV- ATGATGTTGTGGTGGCTGAA); EphA3 (FW-CCAGCAACATGGATTGTCAG;
A group A Streptococcus ADP-ribosyltransferase toxin stimulates a protective IL-1β-dependent macrophage immune response
 A group A Streptococcus ADP-ribosyltransferase toxin stimulates a protective IL-1β-dependent macrophage immune response Ann E. Lin, Federico C. Beasley, Nadia Keller, Andrew Hollands, Rodolfo Urbano, Emily
Supplementary Figure 1. Confirmation of sirna in PC3 and H1299 cells PC3 (a) and H1299 (b) cells were transfected with sirna oligonucleotides
 and H1299 (b) cells were transfected with sirna oligonucleotides") Supplementary Figure 1. Confirmation of sirna in PC3 and H1299 cells PC3 (a) and H1299 (b) cells were transfected with sirna oligonucleotides targeting RCP (SMARTPool (RCP) or two individual oligos (RCP#1
Supplementary Figure 1. Confirmation of sirna in PC3 and H1299 cells PC3 (a) and H1299 (b) cells were transfected with sirna oligonucleotides targeting RCP (SMARTPool (RCP) or two individual oligos (RCP#1
SUPPLEMENTARY INFORMATION
 VOLUME: 1 ARTICLE NUMBER: 0011 In the format provided by the authors and unedited. In situ Activation of Platelets with Checkpoint Inhibitors for Post-Surgical Cancer Immunotherapy Chao Wang 1, 2, Wujin
Supplementary Fig. 1 Identification of Nedd4 as an IRS-2-associated protein in camp-treated FRTL-5 cells.
 Supplementary Fig. 1 Supplementary Fig. 1 Identification of Nedd4 as an IRS-2-associated protein in camp-treated FRTL-5 cells. (a) FRTL-5 cells were treated with 1 mm dibutyryl camp for 24 h, and the lysates
COPYRIGHTED MATERIAL. Tissue Preparation and Microscopy. General Concepts. Chemical Fixation CHAPTER 1
 CHAPTER 1 Tissue Preparation and Microscopy General Concepts I. Biological tissues must undergo a series of treatments to be observed with light and electron microscopes. The process begins by stabilization
Supplementary Table 1. Sequences for BTG2 and BRCA1 sirnas.
 Supplementary Table 1. Sequences for BTG2 and BRCA1 sirnas. Target Gene Non-target / Control BTG2 BRCA1 NFE2L2 Target Sequence ON-TARGET plus Non-targeting sirna # 1 (Cat# D-001810-01-05) sirna1: GAACCGACAUGCUCCCGGA
Live Cell Imaging of RNA Expression
 A p p l i c a t i o n N o t e Live Cell Imaging of RNA Expression Using the Cytation 3 Cell Imaging Multi-Mode Reader to Image SmartFlare RNA Probes Paul Held Ph. D, Laboratory Manager, Applications Dept.,
Cycles of vascular plexus formation within the nephrogenic zone of the developing mouse kidney
 1 Supplementary text and data for: 2 3 4 5 Cycles of vascular plexus formation within the nephrogenic zone of the developing mouse kidney Authors: David A. D. Munro 1*, Peter Hohenstein 2, and Jamie A.
ab CFSE Fluorescent Cell Labeling Kit
 ab113853 CFSE Fluorescent Cell Labeling Kit Instructions for Use For the durable fluorescent labeling of live cells for fluorescent microscopy and flow cytometry, population growth studies and within sample
This is the author's accepted version of the manuscript.
 This is the author's accepted version of the manuscript. The definitive version is published in Nature Communications Online Edition: 2015/4/16 (Japan time), doi:10.1038/ncomms7780. The final version published
Supplemental Table 1 Primers used in study. Human. Mouse
 Supplemental Table 1 Primers used in study Human Forward primer region(5-3 ) Reverse primer region(5-3 ) RT-PCR GAPDH gagtcaacggatttggtcgt ttgattttggagggatctcg Raftlin atgggttgcggattgaacaagttaga ctgaggtataacaccaacgaatttcaggc
SUPPLEMENTARY INFORMATION. Chemical modulation of Chaperone-mediated autophagy by novel
 SUPPLEMENTARY INFORMATION Chemical modulation of Chaperone-mediated autophagy by novel retinoic acid derivatives Jaime Anguiano 1, Thomas P Garner 2, Murugesan Mahalingam 1, Bhaskar C. Das 1, Evripidis
Mechanical stimulation of Piezo1 receptors depends on extracellular matrix proteins and directionality of force. Supporting Information
 Mechanical stimulation of Piezo1 receptors depends on extracellular matrix proteins and directionality of force Benjamin M. Gaub and Daniel J. Müller Supporting Information Supporting Information Note
ab CFSE Fluorescent Cell Labeling Kit
 ab113853 CFSE Fluorescent Cell Labeling Kit Instructions for Use For the durable fluorescent labeling of live cells for fluorescent microscopy and flow cytometry, population growth studies and within sample
Online Supplement ALVEOLAR CELL SENESCENCE IN PATIENTS WITH PULMONARY EMPHYSEMA. Takao Tsuji, Kazutetsu Aoshiba, and Atsushi Nagai
 Online Supplement ALVEOLAR CELL SENESCENCE IN PATIENTS WITH PULMONARY EMPHYSEMA Takao Tsuji, Kazutetsu Aoshiba, and Atsushi Nagai MATERIALS AND METHODS Immunohistochemistry Deparaffinized tissue sections
ab CytoPainter ER Staining Kit Red Fluorescence
 ab139482 CytoPainter ER Staining Kit Red Fluorescence Instructions for Use Designed to detect Human endoplasmic reticulum by microscopy. This product is for research use only and is not intended for diagnostic
Localization Microscopy
 Localization Microscopy Theory, Sample Prep & Practical Considerations Patrina Pellett & Ann McEvoy Applications Scientist GE Healthcare, Cell Technologies May 27 th, 2015 Localization Microscopy Talk
The Human Protein PRR14 Tethers Heterochromatin to the Nuclear Lamina During Interphase and Mitotic Exit
 Cell Reports, Volume 5 Supplemental Information The Human Protein PRR14 Tethers Heterochromatin to the Nuclear Lamina During Interphase and Mitotic Exit Andrey Poleshko, Katelyn M. Mansfield, Caroline
An automated image processing routine for segmentation of cell cytoplasms in high-resolution autofluorescence images
 An automated image processing routine for segmentation of cell cytoplasms in high-resolution autofluorescence images Alex J. Walsh a, Melissa C. Skala *a a Department of Biomedical Engineering, Vanderbilt
INTRODUCTION TO FLOW CYTOMETRY
 DEPARTEMENT BIOZENTRUM INTRODUCTION TO FLOW CYTOMETRY F ACS C ore F acility Janine Zankl FACS Core Facility 3. Dezember 2015, 4pm Cellular Parameters Granulocytes Monocytes Basophils Lymphocytes Neutrophils
isolated from ctr and pictreated mice. Activation of effector CD4 +
 Supplementary Figure 1 Bystander inflammation conditioned T reg cells have normal functional suppressive activity and ex vivo phenotype. WT Balb/c mice were treated with polyi:c (pic) or PBS (ctr) via
SI Appendix. Supporting Materials (references cited here can be found in the reference list in the main text):
:") SI Appendix Supporting Materials (references cited here can be found in the reference list in the main text): SupplementaryText Figs. S1 to S13 Table S1 Captions for Supporting Movies S1 to S5 Other Supporting
SI Appendix Supporting Materials (references cited here can be found in the reference list in the main text): SupplementaryText Figs. S1 to S13 Table S1 Captions for Supporting Movies S1 to S5 Other Supporting
T H E J O U R N A L O F C E L L B I O L O G Y
 T H E J O U R N A L O F C E L L B I O L O G Y Supplemental material Rodríguez-Fraticelli et al., http://www.jcb.org/cgi/content/full/jcb.201203075/dc1 Figure S1. Cell spreading and lumen formation in confined
Propidium Iodide. Catalog Number: Structure: Molecular Formula: C 27H 34I 2N 4. Molecular Weight: CAS #
 Catalog Number: 195458 Propidium Iodide Structure: Molecular Formula: C 27H 34I 2N 4 Molecular Weight: 668.45 CAS # 25535-16-4 Physical Description: Dark red crystals Description: Reagent used for the
Nature Immunology: doi: /ni Supplementary Figure 1
 Supplementary Figure 1 BALB/c LYVE1-deficient mice exhibited reduced lymphatic trafficking of all DC subsets after oxazolone-induced sensitization. (a) Schematic overview of the mouse skin oxazolone contact