1.2. Net change in land cover [ha] 50000
|
|
|
- Godwin Randolph Gaines
- 5 years ago
- Views:
Transcription
![Artificial areas Arable & permanent crops Pastures & mosaics Forested Semi-natural vegetation Open spaces/ bare soils Wets Water bodies TOTAL [hundreds ha] Turkey Land cover 2006 Overview of cover &](/docs-images/81/84015495/images/1-0.jpg "change 2000-2006 Landscape in Turkey is composed mainly by natural surfaces (5), dominated by transitional wood and shrubs, and agricultural areas (4) formed by both non-irrigated and irrigated")
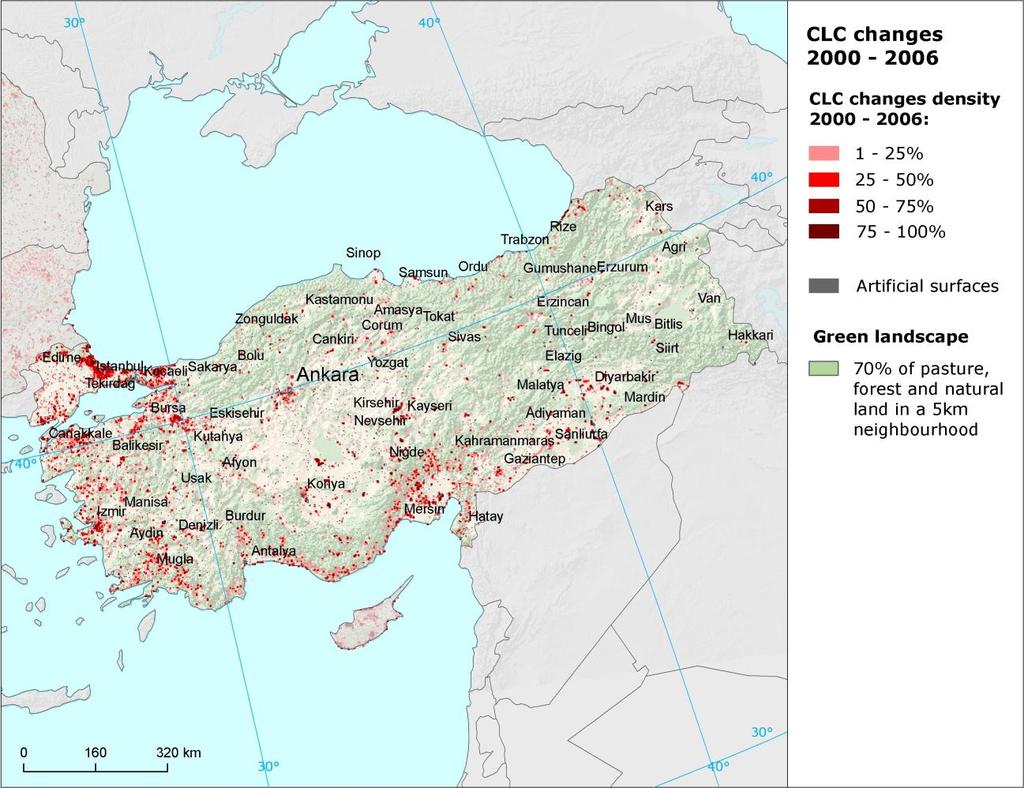
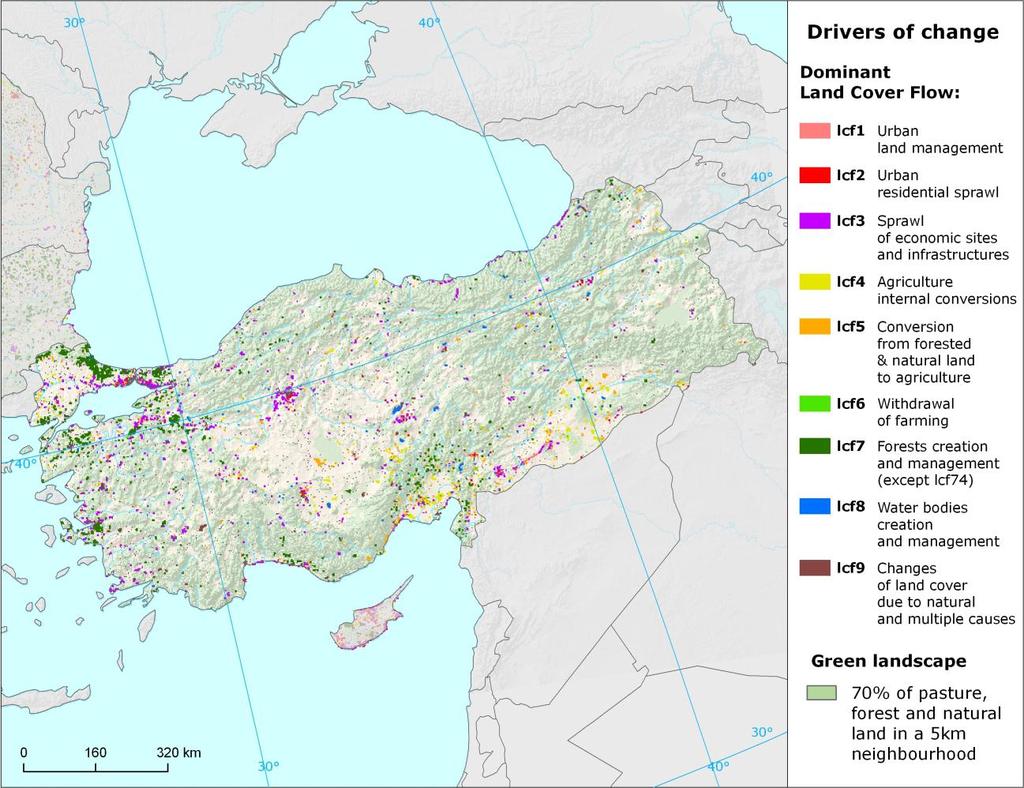
1 Artificial areas Arable & permanent crops Pastures & mosaics Forested Semi-natural vegetation Open spaces/ bare soils Wets Water bodies TOTAL [hundreds ha] Turkey Land cover 2006 Overview of cover & change Landscape in Turkey is composed mainly by natural surfaces (5), dominated by transitional wood and shrubs, and agricultural areas (4) formed by both non-irrigated and irrigated arable, with natural vegetation and complex cultivation patterns. The percentage of change area on total area of the country is relatively low (0.08% a year). However, total area of change is considerably large (70000 ha a year). The most dynamic cover type is forested having the highest area turnover, followed by arable and artificial areas. Concerning the net change, artificial areas are on the top, followed by arable/crop and forested areas. In contrast, negative net change balance (total area decrease) is observed for semi-natural vegetation areas and pastures/mosaics. Besides the forest internal conversions (57%), agricultural conversions (with prevailing share of internal changes) are the main driver of cover change in Turkey (20%). Artificial sprawl, represented mostly by sprawl of economic sites and infrastructures, is another significant driver of cover change in Turkish scape (1). Concerning the spatial distribution, highest density of changes is concentrated into surroundings of the Bosphorus (especially artificial take and changes of forested ) and into European part of Turkey. Izmir in western Turkey and Adana in southern part of the country are the other hotspots with high density of cover changes. Finally, there is also significant concentration of artificial sprawl in proximity of the capital city Ankara. Note: The results presented here are based on a change analysis of 44 cover types mapped consistently on a 1: scale across Europe over almost two decades see Corine cover (CLC) programme for details. Number of years between CLC2000-CLC2006 data for Turkey: Land cover 2006 [% of total] Wetl. 0,4 % 16% Net change in cover [ha] Net change in cover [% of initial year 2000] % A rtificial areas A rable & permanent crops P astures & mosaics Forested Semi-natural vegetation O pen spaces / bare soils Wets Water bodies Summary balance table Land cover Consumption of initial LC Formation of new LC Net Formation of LC Net formation as % of initial year Total turnover of LC Total turnover as % of initial year Land cover
2 lcf1 Urban management lcf2 Urban residential sprawl lcf3 Sprawl of economic sites and infrastructures lcf4 Agriculture internal conversions lcf5 Conversion from forested & natural to lcf6 Withdrawal of farming lcf7 Forests creation and management lcf8 Water bodies creation and management lcf9 Changes due to natural and multiple causes Turkey Land cover trends Annual cover change [ha/year, % of total area] % 2.5. Annual turnover of LC types [ha/year] Net annual change of LC types [ha/year] A rtificial areas A rable & permanent crops P as tures & mos aic s Forested A rtificial areas A rable & permanent crops P as tures & mos aic s Forested Semi-natural vegetation O pen s pac es / bare s oils Wets Water bodies Semi-natural vegetation O pen s pac es / bare s oils Wets Water bodies Summary trend figures Annual cover change [ha/year] Annual cover change as % of initial year 0.08% Land uptake by artificial development as mean annual change [ha/year] 7348 Agricultural uptake by urban and infrastructures development as mean annual change [ha/year] 5887 Net uptake of forests and semi-natural by as mean annual change [ha/year] 4136 Net conversion from pasture to arable and permanent crops as mean annual change [ha/year] 1346 Forest & other wood net formation as mean annual change [ha/year] 1453 Dry semi-natural cover net formation as mean annual change [ha/year] Wets & water bodies net formation as mean annual change [ha/year] Intensity of main change drivers (LC FLOWS) [ha/year]
3 Continuous urban fabric Discontinuous urban fabric Industrial or commercial units Road and rail networks and associated Port areas Airports Mineral extraction sites Dump sites Construction sites Green urban areas Sport and leisure facilities 0.6 Turkey Artificial areas 3.8. Artif icial take [ha/year, % of initial year] Artificial development driven by construction Sprawl of artificial areas is moderate, driven mainly by construction (38%) and by extension of quarrying sites and mines (26%), together with industrial/commercial (18%) and residential sprawl (1) to a lesser extent. Mainly agricultural areas, with almost equal percentage of pastures/mosaics and arable have been taken by the artificial sprawl. Besides the take, there are multiple areas where recycling of developed urban take place was identified, represented by conversion of construction sites into residential, commercial/industrial and transport units. Spatially, artificial sprawl occurs close to the existing large cities. In particular, the highest density of changes is concentrated into surroundings of the Bosphorus, in the European part of Turkey, in Izmir and Adana and in proximity of the capital city Ankara Artif icial surf aces 2006 [% of total area] Artif icial take [ha/year] 6% % Mean annual artificial change by class [ha/year]

4 Nonirrigated arable Permanently irrigated Rice fields Vineyards Fruit trees and berry plantations Olive groves Pastures Annual/ permanent crops Complex cult. patterns Agriculture with nat. Agroforestry areas Non-irrigated arable Permanently irrigated Rice fields Vineyards Fruit trees and berry plantations Olive groves Pastures Annual/ permanent crops Complex cult. patterns Agriculture with nat. Agro-forestry areas -0.29% % % % 0.19% % 0.28% % 0.08% 0.0 Turkey Agriculture Intensification of, conversion to permanently irrigated Agricultural in Turkey is composed by arable (both non-irrigated and irrigated), followed by agricultural areas with natural vegetation and complex cultivation patterns. Pastures and mosaics have negative balance of net change in 2000/2006. In contrast, net change balance of arable is positive, which is caused by formation of permanently irrigated arable (mostly through conversion from non-irrigated arable ) and rice fields. Internal development of agricultural surfaces in Turkey in this period is characterized by intensification of agricultural use. The most significant internal flow is the conversion of non-irrigated arable areas to permanently irrigated. The other major flows are conversions from pasture to both non-irrigated and irrigated arable and crop and internal conversions of arable. Moreover, there is also significant area of agro-natural mosaics, which have been converted into continuous. The interaction between agricultural and other cover types is represented mostly by consumption of by artificial sprawl, mainly by sprawl of economic sites and infrastructures. Besides, agricultural has been also consumed by water bodies creation. Formation of agricultural cover from natural surfaces has been driven mainly by intensive conversion from semi-natural (with more than ½ share of natural grasss) and wets to. Spatially changes are spread over intensive (low) regions Agricultural areas 2006 [% of total area] Development of agricultural areas detailed balance [ha] % % C onsumption of initial cover Formation of new cover 211 Non-irrigated arable 212 Permanently irrigated 213 Rice fields 221 Vineyards 222 Fruit trees and berry plantations 223 Olive groves Mean annual agricultural change by class [ha/year] 231 Pastures 241 Annual crops associated with permanent crops 242 Complex cultivation patterns Agriculture with significant areas of natural vegetation 244 Agro-forestry areas 4
5 Broad-leaved forest Coniferous forest Mixed forest Natural grass Moors and heath Sclerophyllous vegetation Transitional wood Beaches, dunes, sand Bare rock Sparsely vegetated Burnt areas Glaciers and perpetual In marshes Peatbogs Salt marshes Salines Intertidal flats Water courses Water bodies Coastal lagoons Estuaries Sea and ocean Broad-leaved forest Coniferous forest Mixed forest Natural grass Moors and heath Sclerophyllous vegetation Transitional wood Beaches, dunes, sand Bare rock Sparsely vegetated Burnt areas Glaciers/perp. snow In marshes Peatbogs Salt marshes Salines Intertidal flats Water courses Water bodies Coastal lagoons Estuaries Sea and ocean % -0.57% % % % 2.57% % % 1.27% Turkey Forest & nature Forest & nature areas 2006 [% of total area] 4 29% 2 Forest Semi-natural vegetation Open spaces/ bare soils Wets Water bodies Transitional wood/shrub creation over natural More than half of natural surfaces in Turkey consists of open space/bare soils and semi-natural vegetation areas. These cover types are represented mostly by sparsely vegetated areas and natural grasss. The rest of natural is composed of forested areas, with prevailing share of transitional wood. Beside forest internal conversions, the main flow in natural exchange is forest (mainly transitional wood/shrub) creation over natural grasss, restoration of burnt areas and to a lesser extent forest creation over sclerophyllous vegetation and sparsely vegetated areas. The other significant drivers of natural change are intensive consumption of natural grasss by arable (conversion of marginal ) and, in contrary, water bodies creation over agricultural Development of forest & nature areas detailed balance [ha] C onsumption of initial cover Formation of new cover Mean annual forest & nature change by class [ha/year]
6 Annex: Land cover flows and trends Land cover flows Consumption of cover [% of total change area] 8% Wetl Formation of cover [% of total change area] Wetl. Seminat. 1 10% 17% 56% 57% A rtificial areas A rable & permanent crops P astures & mosaics Forested Semi-natural vegetation O pen spaces / bare soils Wets Water bodies Drivers of change (LC FLOWS) [% of total change area] lc f8 lc f9 lc f1 lc f2 lc f3 lcf1 U rban management lcf2 U rban residential sprawl 1 lcf3 Sprawl of economic sites and infrastructures lc f4 lcf4 A griculture internal conversions 1 lcf5 C onversion from forested & natural to lc f5 7% lc f6 Withdrawal of farming lc f7 lc f6 lcf7 Forests creation and management 57% lcf8 Water bodies creation and management lc f9 C hanges due to natural and multiple c aus es 6
7 Artificial areas Consumption by artificial take [% of total] O pen Water s pac es / bodies bare soils A rable Seminatural & permanent vegetation c rops 1 29% Fores ted 19% Formation by artificial take [% of total] C ont. Sport/ urban Dis c. leis ure fabric urban 0.1 % fabric Green 1 urban 0.1 % I ndus trial/ c ommer. 18% C ons truc t. 38% Road/rail network P ort areas 0.2 % P as tures & mos aic s 3 Dump s ites 0.2 % M ineral extrac tion 26% A irports Net f ormation of artif icial area [ha/year, % of initial year] Artificial development by change drivers (LC FLOWS) [ha/year] % lcf11urban development/ infilling (cons.) lcf11urban development/ infilling (form.) lcf12 Recycling of developed urban (cons.) lcf12 Recycling of developed urban (form.) lcf13 Development of green urban areas (cons.) lcf13 Development of green urban areas (form.) lcf21 Urban dense residential sprawl lcf22 Urban diffuse residential sprawl lcf31 Sprawl of industrial & commercial sites lcf32 Sprawl of transport networks lcf33 Sprawl of harbours lcf34 Sprawl of airports lcf35 Sprawl of mines and quarrying areas lcf36 Sprawl of dumpsites lcf37 Construction lcf38 Sprawl of sport and leisure facilities (cons.) lcf38 Sprawl of sport and leisure facilities (form.) lcf54 Conversion from developed areas to lcf72 Forest creation, afforestation lcf81 Water bodies creation lcf911 Semi-natural creation lcf913 Extension of water courses lcf92 Forests and shrubs fires lcf93 Coastal erosion lcf99 Other changes and unknown (cons.) lcf99 Other changes and unknown (form.)
8 Agriculture LC consumed by [% of total] Water c. M in. extr. Salt mars h. 0,0 4 % I nl. Water b. mars h. 9% 9% Burnt ar. 0,3 % Spars ely areas 10% Beac h./ dunes / s and T rans. woodl./ s hrub Sc leroph. 0,5 % C ons truc t. Br.-leaved 0,4 % C onif. M ixed N atural gras s Formation of agricultural f rom non [% of total] C omplex c ultivation patterns A gric ulture with nat. 18% P as tures 7% O live groves 0.2 % Fruit N onirrigated arable 47% trees /berry plantations 0.3 % V ineyards % Rice fields P erm. irr Consumption of agricultural by non [% of total] Formation of non-agricultural from [% of total] A gric ulture with natural 2 C omplex c ultivation patterns 2 P as tures 1 O live groves N onirrigated arable 26% Fruit trees /berry plantations P erm. irrigated 1 Rice fields % V ineyards I nl. mars h T rans. woodl./ s hrub 321 0,2 % M ixed f. C onif. f. Br.-leaved Water c. Water b. 2 C ons tr. 28% Sport/ leis ure Dis c. urban I ndus trial/ fabric c ommer. 1 17% Road/rail network A irports M ineral extrac tion Dump 1 s ites 0.2 % Main annual conversions between and forests & semi-natural [ha/year] Mean annual conversion between arable and pasture [ha/year] Conversion from forest to Conversion from dry semi-natural & natural to Extension of pasture, set aside and fallow Conversion from wets to Withdrawal of farming with wood creation Conversion from pasture to arable and permanent crops Withdrawal of farming without significant wood creation 8
9 9.31. Mean annual internal conversions [ha/year] Mean annual conversions between and other LC types [ha/year] lcf411 Uniform extension of set aside fallow and pasture lcf13 Development of green urban areas lcf412 Diffuse extension of set aside fallow and pasture lcf2 Urban residential sprawl lcf421 Conversion from arable to permanent irrigation perimeters lcf422 Other internal conversions of arable lcf3 Sprawl of economic sites and infrastructures lcf511 Intensive conversion from forest to lcf431 Conversion from olives groves to vineyards and orchards lcf512 Diffuse conversion from forest to lcf432 Conversion from vineyards and orchards to olive groves lcf433 Other conversions between vineyards and orchards lcf441 Conversion from permanent crops to permanent irrigation perimeters lcf442 Conversion from vineyards and orchards to non-irrigated arable lcf443 Conversion from olive groves to non-irrigated arable lcf444 Diffuse conversion from permanent crops to arable lcf451 Conversion from arable to vineyards and orchards lcf521 Intensive conversion from seminatural to lcf522 Diffuse conversion from seminatural to lcf523 Conversions from nature mosaics to continuous (cont. agri. cons.) lcf523 Conversions from nature mosaics to continuous (cont. agri. form.) lcf53 Conversion from wets to lcf54 Conversion from developed areas to lcf61 Withdrawal of farming with wood creation lcf62 Withdrawal of farming without significant wood creation lcf452 Conversion from arable to olive groves lcf81 Water bodies creation lcf453 Diffuse conversion from arable to permanent crops lcf913 Extension of water courses lcf461 Conversion from pasture to permanent irrigation perimeters lcf92 Forests and shrubs fires lcf462 Intensive conversion from pasture to non-irrigated arable and permanent crops lcf93 Coastal erosion lcf463 Diffuse conversion from pasture to arable and permanent crops lcf99 Other changes and unknown (agri. cons.) lcf47 Extension of agroforestry lcf99 Other changes and unknown (agri. form.)
10 Forest & nature I ndus trial/ c ommer. A gric ulture with nat. 29% C omplex c ultivation patterns I nl. 2 mars h. Burnt ar. 0,2 % Spars l. ar. 10% Bare rock 0.1 % Beac h./ dunes / LC consumed by forest & nature [% of total] M ineral Dis c. urb. Dump extrac tion fabric s ites 9% C ons truc t. P as tures Fruit / berry arable 9% Consumption of forest & nature P erm. irrigated 10% V ineyards by non-forest/nature [% of total] Salt mars h. 0,3 % s and T rans. woodl./ s hrub Sc leroph. Water b. 6% Sea/ oc ean N atural gras s 4 Br.-leaved C onif. f. 6% M ixed Br.-leaved Sea and Formation of f orest & nature oc ean 0.2 % Water bodies 7 f rom non-f orest /nature C onif. f. [% of total] M ixed f N at. gras s l. Water c. 0,4 % Sc leroph. Beac h./ dunes / s and Spars l. ar. Burnt ar. I nl. mars h Formation of non-forest/nature from forest & nature [% of total] P erm. irr. 1 C ompl. c ult. pat. P as tures O live gr. Fruit/berry 0,2 % Rice fields 0.5 % N on-irr. arable 26% A gri-nat. fabr. 0,2 % 10% C ont. urb. Sport/ leis ure C ons tr. 16% Dis c. urb. Green urban 0.1 % fabr. I nd./c om. Road/rail network P ort a. 0,2 % M in. extr. 19% Dump s ites 0.1 % Forested 2006 [% of total area] Main trends in wood & f orests consumption/formation [ha/year] T rans it. wood s hrub 38% 7% N onirrigated Broadleaved 20% Consumption of forest by urban sprawl Conversion from forest to Recent fellings and transitions M ixed 18% C onif. 2 Withdrawal of farming with wood creation Forest creation, afforestation Conversion from transitional wood to forests Forest creation over wets 10
11 Dry semi-natural areas 2006 [% of total area] Main trends in dry semi-natural consumption/formation [ha/year] Spars ely areas 4 N atural gras s. 40% Consumption of dry semi-natural cover by urban sprawl Conversion of semi-natural cover to Bare roc k 10% Beac h./ dunes / s and Sc leroph. Forest creation, afforestation over dry semi-natural Withdrawal of farming without wood creation Decrease of permanent snow and glaciers Wets & water 2006 [% of total area] Main trends in wets & water consumption/formation [ha/year] C oas tal lagoons I n mars hes 16% Salt mars hes Salines Consumption of wets by urban sprawl Conversion of wets to Forest creation and afforestation over wets Water bodies 7 Water c ours es 7% Withdrawal of farming without wood creation Net water bodies creation Net wets creation Mean annual conversions of forest & other wood [ha/year] lcf13 Development of green urban areas lcf2 Urban residential sprawl lcf3 Sprawl of economic sites and infrastructures lcf511 Intensive conversion from forest to lcf512 Diffuse conversion from forest to lcf61 Withdrawal of farming with wood creation lcf71 Conversion from transitional wood to forest (cons.) lcf71 Conversion from transitional wood to forest (form.) lcf72 Forest creation, afforestation lcf73 Forests internal conversions (cons.) lcf73 Forests internal conversions (form.) lcf74 Recent felling and transition (cons.) lcf74 Recent felling and transition (form.) lcf8 Water bodies creation and management lcf9 Changes of cover due to natural and multiple causes (cons.) lcf9 Changes of cover due to natural and multiple causes (form.)
12 Mean annual conversions of dry semi-natural LC [ha/year] lcf13 Development of green urban areas lcf2 Urban residential sprawl lcf3 Sprawl of economic sites and infrastructures lcf521 Intensive conversion from semi-natural to lcf522 Diffuse conversion from semi-natural to lcf523 Conversions from -nature mosaics to continuous lcf62 Withdrawal of farming without significant wood creation lcf72 Forest creation, afforestation lcf74 Recent felling and transition lcf8 Water bodies creation and management lcf82 Water bodies management lcf911 Semi-natural creation (form.) lcf912 Semi-natural rotation (cons.) lcf912 Semi-natural rotation (form.) lcf913 Extension of water courses (cons.) lcf92 Forests and shrubs fires (cons.) lcf92 Forests and shrubs fires (form.) lcf93 Coastal erosion (cons.) lcf94 Decrease in permanent snow and glaciers cover (cons.) lcf94 Decrease in permanent snow and glaciers cover (form.) lcf99 Other changes and unknown (cons.) lcf99 Other changes and unknown (form.) Mean annual conversions of wets and water LC [ha/year] lcf13 Development of green urban areas lcf2 Urban residential sprawl lcf3 Sprawl of economic sites and infrastructures lcf53 Conversion from wets to lcf62 Withdrawal of farming without significant wood creation lcf72 Forest creation, afforestation lcf8 Water bodies creation and management (cons.) lcf81 Water bodies creation lcf9 Changes of cover due to natural and multiple causes (other than LCF91) lcf9 Changes of cover due to natural and multiple causes (other than LCF912) lcf911 Semi-natural creation (form.) lcf912 Semi-natural rotation (cons.) lcf912 Semi-natural rotation (form.) lcf913 Extension of water courses (form.)
13 13
1.2. Net change in land cover [ha] 50000
![1.2. Net change in land cover [ha] 50000](/thumbs/92/107846366.jpg "1.2. Net change in land cover [ha] 50000") Land cover 2006 Overview of land cover & change Finish landscape is characterized by high amount of forested areas and water bodies (almost ¾ of area are composed of coniferous and mixed forest, together
Land cover 2006 Overview of land cover & change Finish landscape is characterized by high amount of forested areas and water bodies (almost ¾ of area are composed of coniferous and mixed forest, together
1.2. Net change in land cover [ha] 12000
![1.2. Net change in land cover [ha] 12000](/thumbs/72/66539401.jpg "1.2. Net change in land cover [ha] 12000") Land cover 2006 Overview of land cover & change The change of landscape in Cyprus during is dominated by formation of artificial and forested land and on the other hand consumption of open spaces/bare
Land cover 2006 Overview of land cover & change The change of landscape in Cyprus during is dominated by formation of artificial and forested land and on the other hand consumption of open spaces/bare
1.2. Net change in land cover [ha] 8000
![1.2. Net change in land cover [ha] 8000](/thumbs/72/66958110.jpg "1.2. Net change in land cover [ha] 8000") Land cover 2006 Overview of land cover & change Landscape in Bosnia and Herzegovina is covered mostly by forests (54%), pastures (34%) and semi-natural vegetation (7%). The overall development of land
Land cover 2006 Overview of land cover & change Landscape in Bosnia and Herzegovina is covered mostly by forests (54%), pastures (34%) and semi-natural vegetation (7%). The overall development of land
1.2. Net change in land cover [ha] 1000
![1.2. Net change in land cover [ha] 1000](/thumbs/73/69481075.jpg "1.2. Net change in land cover [ha] 1000") Land cover 2006 Overview of land cover & change The development of landscape in Kosovo is characterized by formation of artificial areas, forested land and, to a lesser extent, arable/crop land and consumption
Land cover 2006 Overview of land cover & change The development of landscape in Kosovo is characterized by formation of artificial areas, forested land and, to a lesser extent, arable/crop land and consumption
1.2. Net change in land cover [ha] 20000
![1.2. Net change in land cover [ha] 20000](/thumbs/79/80301912.jpg "1.2. Net change in land cover [ha] 20000") Land cover 2006 Overview of land cover & change Polish landscape is dominated by (63%) and forest (3). The situation is characterized by consumption of agricultural areas (with a predominant share of arable
Land cover 2006 Overview of land cover & change Polish landscape is dominated by (63%) and forest (3). The situation is characterized by consumption of agricultural areas (with a predominant share of arable
1.2. Net change in land cover [ha] 5000
![1.2. Net change in land cover [ha] 5000](/thumbs/94/120614901.jpg "1.2. Net change in land cover [ha] 5000") Land cover 2006 Overview of land cover & change consists of two regions with significantly different character of the landscape. Lowland region of Vojvodina, situated in the northern part of the country,
Land cover 2006 Overview of land cover & change consists of two regions with significantly different character of the landscape. Lowland region of Vojvodina, situated in the northern part of the country,
1.2. Net change in land cover [ha] 20000
![1.2. Net change in land cover [ha] 20000](/thumbs/96/128717489.jpg "1.2. Net change in land cover [ha] 20000") Land cover 2006 Overview of land cover & change The landscape in is characteristic by predominant share of natural land cover, mostly forested land and water bodies. The development of land cover in is
Land cover 2006 Overview of land cover & change The landscape in is characteristic by predominant share of natural land cover, mostly forested land and water bodies. The development of land cover in is
1.2. Net change in land cover [ha] % 1
![1.2. Net change in land cover [ha] % 1](/thumbs/74/69747122.jpg "1.2. Net change in land cover [ha] % 1") Land cover 2006 Overview of land cover & change In period, the situation in landscape of the FYR of Macedonia can be characterized by dynamic development of agricultural land, driven by both internal agricultural
Land cover 2006 Overview of land cover & change In period, the situation in landscape of the FYR of Macedonia can be characterized by dynamic development of agricultural land, driven by both internal agricultural
1.2. Net change in land cover [ha]
![1.2. Net change in land cover [ha]](/thumbs/72/67518217.jpg "1.2. Net change in land cover [ha]") Land cover 2006 Overview of land cover & change After the large political and economical changes in Slovakia during 90 s, the period is characterised by stabilization - rapid decrease of overall intensity
Land cover 2006 Overview of land cover & change After the large political and economical changes in Slovakia during 90 s, the period is characterised by stabilization - rapid decrease of overall intensity
Country fact sheet. Land cover Norway. September Photo: Toni García, My City/EEA
 Country fact sheet Land cover 2012 Norway September 2017 Photo: Toni García, My City/EEA Land cover 2012 Overview of land cover & change The Norwegian landscape is characterized by very low intensity of
1.2. Net change in land cover [ha] 15
![1.2. Net change in land cover [ha] 15](/thumbs/88/115381486.jpg "1.2. Net change in land cover [ha] 15") Land cover 2006 Overview of land cover & change The Irish landscape (dominated by pastures and peatlands) shows to be less dynamic during this period as average yearly land cover change rate decreased
Land cover 2006 Overview of land cover & change The Irish landscape (dominated by pastures and peatlands) shows to be less dynamic during this period as average yearly land cover change rate decreased
Country fact sheet. Land cover Liechtenstein. September Photo: Toni García, My City/EEA
 Country fact sheet Land cover 2012 Liechtenstein September 2017 Photo: Toni García, My City/EEA Land cover 2012 Overview of land cover & change As in previous periods, the land cover development in the
Country fact sheet. Land cover Luxembourg. September Photo: Toni García, My City/EEA
 Country fact sheet Land cover 2012 Luxembourg September 2017 Photo: Toni García, My City/EEA Land cover 2012 Overview of land cover & change The small country of Luxembourg shows significant decrease of
Country fact sheet. Land cover Kosovo* September Photo: Toni García, My City/EEA. *Under UNSCR 1244/99.
 Country fact sheet Land cover 2012 Kosovo* September 2017 Photo: Toni García, My City/EEA *Under UNSCR 1244/99. Land cover 2012 Overview of land cover & change The overall pace of land cover development
Bosnia and Herzegovina
 Country fact sheet Land cover 2012 Bosnia and Herzegovina September 2017 Photo: Toni García, My City/EEA Land cover 2012 Overview of land cover & change The overall pace of land cover development in Bosnia
Country fact sheet. Land cover Romania. September Photo: Toni García, My City/EEA
 Country fact sheet Land cover 2012 Romania September 2017 Photo: Toni García, My City/EEA Land cover 2012 Overview of land cover & change The Romanian landscape is characterised by its low dynamics of
Country fact sheet. Land cover Malta. September Photo: Toni García, My City/EEA
 Country fact sheet Land cover 2012 Malta September 2017 Photo: Toni García, My City/EEA Land cover 2012 Overview of land cover & change Concerning the land cover development, there occurs no significant
Country fact sheet. Land cover Switzerland. September Photo: Toni García, My City/EEA
 Country fact sheet Land cover 2012 Switzerland September 2017 Photo: Toni García, My City/EEA Land cover 2012 Overview of land cover & change In the long term, the Swiss landscape shows very low intensity
Country fact sheet. Land cover Albania. September Photo: Toni García, My City/EEA
 Country fact sheet Land cover 2012 Albania September 2017 Photo: Toni García, My City/EEA Land cover 2012 Overview of land cover & change With an annual land cover change rate of 0.1, the overall pace
Country fact sheet. Land cover Slovenia. September Photo: Toni García, My City/EEA
 Country fact sheet Land cover 2012 Slovenia September 2017 Photo: Toni García, My City/EEA Land cover 2012 Overview of land cover & change 2006-2012 In the long term, Slovenia is a country with one of
Country fact sheet. Land cover Serbia. September Photo: Toni García, My City/EEA
 Country fact sheet Land cover 2012 September 2017 Photo: Toni García, My City/EEA Land cover 2012 Overview of land cover & change The development of the n landscape seems to remain stable compared to previous
Country fact sheet. Land cover Cyprus. September Photo: Toni García, My City/EEA
 Country fact sheet Land cover 2012 Cyprus September 2017 Photo: Toni García, My City/EEA Land cover 2012 Overview of land cover & change In the period, there has been observed significant decrease of intensity
The former Yugoslav Republic of Macedonia
 Country fact sheet Land cover 2012 The former Yugoslav Republic of Macedonia September 2017 Photo: Toni García, My City/EEA Land cover 2012 Overview of land cover & change The period in the former Yugoslav
Country fact sheet. Land cover Finland. September Photo: Toni García, My City/EEA
 Country fact sheet Land cover 2012 Finland September 2017 Photo: Toni García, My City/EEA Land cover 2012 Overview of land cover & change The land cover development in Finland has similar intensity and
Country fact sheet. Land cover Slovakia. September Photo: Toni García, My City/EEA
 Country fact sheet Land cover 2012 Slovakia September 2017 Photo: Toni García, My City/EEA Land cover 2012 Overview of land cover & change With the overall land cover change rate of 0.3 of total area,
Country fact sheet. Land cover Denmark. September Photo: Toni García, My City/EEA
 Country fact sheet Land cover 2012 Denmark September 2017 Photo: Toni García, My City/EEA Land cover 2012 Overview of land cover & change The overall land cover change rate in Denmark, which has been below
Country fact sheet. Land cover Bulgaria. September Photo: Toni García, My City/EEA
 Country fact sheet Land cover 2012 Bulgaria September 2017 Photo: Toni García, My City/EEA Land cover 2012 Overview of land cover & change The overall change rate in Bulgaria is very low, compared to other
Country fact sheet. Land cover Turkey. September Photo: Toni García, My City/EEA
 Country fact sheet Land cover 2012 Turkey September 2017 Photo: Toni García, My City/EEA Land cover 2012 Overview of land cover & change The overall pace of land cover development in Turkey has increased,
Country fact sheet. Land cover Sweden. September Photo: Toni García, My City/EEA
 Country fact sheet Land cover 2012 Sweden September 2017 Photo: Toni García, My City/EEA Land cover 2012 Overview of land cover & change Landscape development in Sweden is very intensive in the 2006-2012
Country fact sheet. Land cover Poland. September Photo: Toni García, My City/EEA
 Country fact sheet Land cover 2012 Poland September 2017 Photo: Toni García, My City/EEA Land cover 2012 Overview of land cover & change The comparison of annual change rates for the last three observing
Country fact sheet. Land cover Austria. September Photo: Toni García, My City/EEA
 Country fact sheet Land cover 2012 Austria September 2017 Photo: Toni García, My City/EEA Land cover 2012 Overview of land cover & change 2006-2012 Despite its significant acceleration, compared to the
Country fact sheet. Land cover Germany. September Photo: Toni García, My City/EEA
 Country fact sheet Land cover 2012 Germany September 2017 Photo: Toni García, My City/EEA Land cover 2012 Overview of land cover & change Characterized by the annual land cover change rate of 0,1, the
Country fact sheet. Land cover Italy. September Photo: Toni García, My City/EEA
 Country fact sheet Land cover 2012 Italy September 2017 Photo: Toni García, My City/EEA Land cover 2012 Overview of land cover & change Italy is a country with a relatively stable landscape, compared to
Country fact sheet. Land cover Hungary. September Photo: Toni García, My City/EEA
 Country fact sheet Land cover 2012 Hungary September 2017 Photo: Toni García, My City/EEA Land cover 2012 Overview of land cover & change With a mean annual land cover change rate of 0.5%, the overall
Country fact sheet. Land cover Portugal. September Photo: Toni García, My City/EEA
 Country fact sheet Land cover 2012 Portugal September 2017 Photo: Toni García, My City/EEA Land cover 2012 Overview of land cover & change In the long term, Portugal is a country with the highest dynamics
Country fact sheet. Land cover Czech Republic. September Photo: Toni García, My City/EEA
 Country fact sheet Land cover 2012 Czech Republic September 2017 Photo: Toni García, My City/EEA Land cover 2012 Overview of land cover & change According to the annual change rate (0.40%), the overall
Country fact sheet. Land cover Spain. September Photo: Toni García, My City/EEA
 Country fact sheet Land cover 2012 Spain September 2017 Photo: Toni García, My City/EEA Land cover 2012 Overview of land cover & change The overall annual land cover change rate in Spain is 0,2, which
Southern Finland regional analysis
 Southern Finland regional analysis Background for the exercise Training example and data created originally for training of regional council of Southern Finland 2013 Aims at presenting a realitic, yet
Changes of artificial surfaces in Slovakia
 Changes of artificial surfaces in Slovakia 1990-2006 Ján Feranec, Monika Kopecká, Ján Oťaheľ, Jozef Novaček Institute of Geography, Slovak Academy of Sciences, Bratislava, Slovakia 32 nd International
Overview of land cover & change
 Note The results presented here are based on a change analysis of 44 land cover types mapped consistently on a 1:1. scale across Europe over the decade 199-2 - see Corine land cover programme for details.
Land Cover / Land Use & Digital Elevation Maps. These are required for almost all coastal products involving the terrestrial side.
 Land Cover / Land Use & Digital Elevation Maps These are required for almost all coastal products involving the terrestrial side. Example Issues to be Addressed Risk and vulnerability assessment Urbanization
Use of CORINE Land Cover in delivering the EEA strategy
 Use of CORINE Land Cover in delivering the EEA strategy Prof. Jacqueline McGlade Executive Director EIONET Member Countries national teams / co-funding Commission Services: Acknowledgements JRC: joint
Methodological notes for the calculation of Total Surface Area and Land surface area for all NUTS
 EUROPEAN COMMISSION EUROSTAT Directorate E: Sectoral and regional statistics Unit E-4: Regional statistics and geographical information Methodological notes for the calculation of Total Surface Area and
Translation of the CORINE Land Cover nomenclature to the Land Cover Meta Language using LCCS3
 Translation of the CORINE Land Cover nomenclature to the Land Cover Meta Language using LCCS3 Vasco Nunes Remote Sensing Group (GDR) Portuguese Geographic Institute (IGP) http://www.igeo.pt/gdr/ Coordinator:
Corine Land Cover and Land & Ecosystem Accounting tools
 Enrichment of the MedWet Inventory Method Exploring applications of Remote Sensing techniques and of Spatial Data Infrastructure Corine Land Cover and Land & Ecosystem Accounting tools Jean-Louis Weber
Land & Ecosystem Accounts in Europe. Ronan Uhel & Jean-Louis Weber
 Land & Ecosystem Accounts in Europe Ronan Uhel & Jean-Louis Weber Why accounting for Land? Produce synthetic assessments, keeping track of the geographic differences Analyse the relation between changes
CORINE land cover nomenclature definitions
 By: Roula Trigou/ HOS CORINE land cover nomenclature definitions 1. Artificial surfaces 1.1. Urban fabric 1. 1. 1. Continuous urban fabric Most of the land is covered by areas of urban centres. Buildings,
Open Linked Data in Portugal
 Open Linked Data in Portugal Contribution for INSPIRE Implementation Maria José Vale, Rui Reis, Bruno M. Meneses, Raquel Saraiva, Paulo Patrício, Jesus Estrada Maria José Vale, Rui Reis, Bruno M. Meneses,
A Framework for Land Accounting - Draft Set of Tables
 A Framework for Land Accounting - Draft Set of Tables Note: an earlier version of this set of tables was discussed by the Eurostat Task Force on Land Accounting at its meeting 5-6 July 1999 in Luxembourg
Optimization of the Hub Height of a Wind Turbine
 Journal of Industrial and Intelligent Information Vol., No. 4, December 014 Optimization of the Hub Height of a Wind Turbine Jaehwan Lee, Woojin Cho, and Kwan-Soo Lee School of Mechanical Engineering of
The European Environment s Agency requirements for Meteorological and Climatic data
 The European Environment s Agency requirements for Meteorological and Climatic data With special focus on reanalysed meteorological fields Philippe Crouzet EEA with inputs from André Jol EEA and Hadley
for Wildland Fire GOFC-GOLD Fire IT Workshop October 2011 Stresa, Italy
 The Global Early Warning System for Wildland Fire 1 GOFC-GOLD Fire IT Workshop 18-19 October 2011 Stresa, Italy Presentation Outline 1. Fire danger and early warning 2. Overview of the Global EWS 3. Recent
The wetland ecosystems in MAES nomenclature
 The wetland ecosystems in MAES menclature SWOS modifications Version 1.2 Date of Creation 11/05/2017 This project has received funding from the European Union s Horizon 2020 research and The wetland invation
TOWARDS ESTIMATING EMISSIONS FROM GM AND CM IN THE UK
 TOWARDS ESTIMATING EMISSIONS FROM GM AND CM IN THE UK Defra project SP1113 CEH, SRUC, ADAS, AFBI, Ricardo-AEA, University of Aberdeen OBJECTIVES To assess the feasibility of including changes in soil carbon
Manual of CORINE Land Cover changes
 Manual of CORINE Land Cover changes EEA subvention 2011 Final Draft Prepared by: Gy. Büttner and B. Kosztra Date: 30 Nov 2011 Project Manager: Gy. Büttner Manual of CORINE Land Cover Changes 1 TABLE OF
ASSESSMENT AND SCENARIOS OF LAND USE CHANGE IN EUROPE
 ASSESSMENT AND SCENARIOS OF LAND USE CHANGE IN EUROPE Content: Layout: Illustrations: Published by: RIKS BV (November 28) RIKS BV RIKS BV RIKS BV RIKS BV This is a publication of the Research Institute
PRIORITISATION OF TARGET AREAS FOR FOREST RESTORATION. Final Report. Produced by WCMC for WWF International
 PRIORITISATION OF TARGET AREAS FOR FOREST RESTORATION Final Report Produced by WCMC for WWF International May 2000 PRIORITISATION OF TARGET AREAS FOR FOREST RESTORATION Contents 1. Background... 1 2. Objectives...
Tier 1 estimation of GHG emissions from organic soils in Cropland Management (CM) and Grazing Land Management (GM) at EU level
 and Grazing Land Management (GM) at EU level") Tier 1 estimation of GHG emissions from organic soils in Cropland Management (CM) and Grazing Land Management (GM) at EU level Simone Rossi, Roland Hiederer, Giacomo Grassi, Raul Abad Viñas Joint Research
Tier 1 estimation of GHG emissions from organic soils in Cropland Management (CM) and Grazing Land Management (GM) at EU level Simone Rossi, Roland Hiederer, Giacomo Grassi, Raul Abad Viñas Joint Research
Annex 2.1 The dynamic use of land in the period
 Annex 2.1 The dynamic use of land in the period 1990 2000 Land use (CLC) Code CLC Area (ha) 1990 2000 1990 2000 Class 1: Artificial areas 2.361,616 Class 1.1 Urban fabric 39,974 Discontinous urban fabric
SPATIAL ANALYSIS OF LAND COVER AND LAND USE CHANGES IN BULGARIA FOR THE PERIOD BASED ON IMAGE AND CORINE LAND COVER DATA
 Proceedings of the 2 nd Workshop of the EARSeL SIG on Land Use and Land Cover SPATIAL ANALYSIS OF LAND COVER AND LAND USE CHANGES IN BULGARIA FOR THE PERIOD 1990-2000 BASED ON IMAGE AND CORINE LAND COVER
Land Use and Soil Protection in Europe
 EUROSOIL 2008 1 Land Use and Soil Protection in Europe Luca Montanarella European Commission Agriculture in Europe: Shaping the environment over the past 5000 years EUROSOIL 2008 2 Human Impact in Europe
JRC Contribution to MAES-SOIL Workshop
 JRC Contribution to MAES-SOIL Workshop Ghent 02-03.06.16 Arwyn Jones EC-JRC, Land Resource Management Natural Capital: Unit-Soil Project arwyn.jones@jrc.ec.europa.eu LUCAS Soil Sampling strategy First
Forest/Grassland, Secondary / Vegetation. not used
 Table 1 Biodiversity damage potential (BDP) characterization factors (median) of occupation per land use type, 1. and 3. quartile and number of data points (n). For n
Enclosed farmland: Arable and Horticultural, Improved and Neutral Grasslands
 executive summary Executive summary 1 Countryside Survey 2000 (CS2000) and the Northern Ireland Countryside Survey 2000 (NICS2000) have been designed to provide detailed information about the habitats
European Mapping activities and results
 The Economics of Action 5 - Valuation of ecosystems and their services, INBO, Brussels 01-02 July 2015 European Mapping activities and results Markus Erhard European Environment Agency, Copenhagen markus.erhard@eea.europa.eu
3. Forests and semi-natural areas Forests Shrub and/or herbaceous vegetation associations Open spaces with little or no vegetation
 3. Forests and semi-natural areas 3.1. Forests 3.2. Shrub and/or herbaceous vegetation associations 3.3. Open spaces with little or no vegetation CORINE land cover 131 3.1. Forests 3.1.1. Broad-leaved
Implementation of Tier 1 for Mineral Soil under Cropland and Grassland in EU MS
 Implementation of Tier 1 for Mineral Soil under Cropland and Grassland in EU MS IPCC Tier 1 Approach Roland Hiederer, Raul Abad-Viñas, Viorel Blujdea, Giacomo Grassi European Commission Joint Research
The European Commission (EC) is due to present a proposal during 2000 for a new regime to be implemented from November 2001.
 is due to present a proposal during 2000 for a new regime to be implemented from November 2001.") 7KLVUHSRUWZDVSURGXFHGE\WKH(XURSHDQ)RUXPRQ1DWXUH&RQVHUYDWLRQDQG 3DVWRUDOLVPDQGWKH$VRFLDFLyQSDUDHO$QiOLVLV\5HIRUPDGHOD3ROtWLFD$JUR UXUDO 7KH YLHZV VHW RXW LQ WKH UHSRUW DUH WKRVH RI WKH DXWKRUV DQG GR QRW
7KLVUHSRUWZDVSURGXFHGE\WKH(XURSHDQ)RUXPRQ1DWXUH&RQVHUYDWLRQDQG 3DVWRUDOLVPDQGWKH$VRFLDFLyQSDUDHO$QiOLVLV\5HIRUPDGHOD3ROtWLFD$JUR UXUDO 7KH YLHZV VHW RXW LQ WKH UHSRUW DUH WKRVH RI WKH DXWKRUV DQG GR QRW
Natura 2000: Benefits and Opportunities for Farmers. Małgorzata Siuta, CEEweb for Biodiversity and Olivia Lewis
 Natura 2000: Benefits and Opportunities for Farmers Małgorzata Siuta, CEEweb for Biodiversity and Olivia Lewis EU Biodiversity Committments HD Art. 6: avoid deterioration of species and habitats: implement
The thematic accuracy of Corine land cover 2000
 EEA Technical report No 7/2006 Assessment using LUCAS (land use/cover area frame statistical survey) ISSN 1725-2237 X EEA Technical report No 7/2006 Assessment using LUCAS (land use/cover area frame statistical
Land use change analysis for assessment of soil protection efficiency in urban area URBAN SMS project
 Land use change analysis for assessment of soil protection efficiency in urban area URBAN SMS project Magdalena Gluszynska 1, Grzegorz Siebielec 1, Anna Zurek 1, Artur Lopatka 1 1 Department of Soil Science
0.0. Pervious CN = 40. (Unconnected impervious) (Total impervious) Total impervious area (percent) Composite CN
 (Total impervious) Total impervious area (percent) Composite CN") Figure 2-3 Composite CN with connected impervious area. 100 Composite CN 90 80 70 60 Pervious CN = 90 80 70 60 50 40 50 40 0 10 20 30 40 50 60 70 80 90 100 Connected impervious area (percent) Figure 2-4
Figure 2-3 Composite CN with connected impervious area. 100 Composite CN 90 80 70 60 Pervious CN = 90 80 70 60 50 40 50 40 0 10 20 30 40 50 60 70 80 90 100 Connected impervious area (percent) Figure 2-4
Supplementary material. Assessing the effect of a fuel break network to reduce burnt area and wildfire risk transmission
 International Journal of Wildland Fire 25(6), 619 632 doi: 10.1071/WF15146_AC IAWF 2016 Supplementary material Assessing the effect of a fuel break network to reduce burnt area and wildfire risk transmission
Estimation of Land-use Changes in Portugal. Methodology used in NIR 2013 JRC Workshop, February 2013
 Estimation of Land-use Changes in Portugal Methodology used in NIR 2013 JRC Workshop, 27-29 February 2013 Land-use Changes in Portugal: General Approach 3 separate approaches for Portugal (9,22Mha) Portuguese
Ecosystem accounting at the European Environment Agency: a summary of progress 1
 Ecosystem accounting at the European Environment Agency: a summary of progress 1 Glenn-Marie Lange, The Earth Institute at Columbia University Jean-Louis Weber, European Environment Agency 25 October 2006
Annex. Suggestion for EC GIG
 Annex Category Introduction REFCOND-Guidance High status or reference conditions is a state in the present or in the past corresponding to very low pressure, without the effects of major industrialisation,
6. Land take by intensive agriculture
 6. Land take by intensive agriculture Key message Intensive agriculture attributes mainly to South of Europe, particularly to Mediterranean region. Outside this region land areas taken by intensive agriculture
Image Classification I
 Image Classification I Classification is the process of labeling image pixels using predetermined categorical classes. Components: Image features Classification scheme Signatures Training Classifiers Classification
Approach to Simplified Ecosystem Capital Accounts
 Sixth Meeting of the UN Committee of Experts on Environmental-Economic Accounting New York, 15-17 June 2011 Approach to Simplified Ecosystem Capital Accounts Jean-Louis Weber Special Adviser to Economic
ORDINANCE APPENDIX C RUNOFF COEFFICIENTS AND CURVE NUMBERS
 ORDINANCE APPENDIX C RUNOFF COEFFICIENTS AND CURVE NUMBERS TABLE C-1. RUNOFF CURVE NUMBERS Source: Table 2-2a, Table 2-2b, and Table 2-2c from U. S. Department of Agriculture, Natural Resources Conservation
DEGRADATION IN EAST KALIMANTAN
 DEGRADATION IN EAST KALIMANTAN 2006-2016 7 sheets Deg 06-09,, Deg 15-16 contain LUTM for the calculation of emission from forest degradation (loss of living biomass due to change from primary to secondary
Re-connecting Landscapes. Grazing Animals Partnership Conference 22 nd 24 th September 2009
 Re-connecting Landscapes Grazing Animals Partnership Conference 22 nd 24 th September 2009 Topics Landscape what is it and why it is important How Natural England works at the landscape scale Tools Advice
The UNCCD is the custodian agency leading an Inter-Agency Advisory Group on
 SDG indicator 15.3.1 Proportion of land that is degraded over total land area The UNCCD is the custodian agency leading an Inter-Agency Advisory Group on 15.3.1 composed of our key partner FAO as well
GIS-based Valuation of Ecosystem Services in Mountain Regions:
 GIS-based Valuation of Ecosystem Services in Mountain Regions: A Case Study of the Karlovo Municipality in Bulgaria Boian Kulov 1, Ekaterina Ivanova 2, Bilyana Borisova 3, Assen Assenov 4, Aleksandra Ravnachka
Land Accounts. March 2018
 Land Accounts March 2018 Land accounts Land cover Land use Land value Relationship to ecosystem accounting 2 Definition and scope Definition: Land is a unique environmental asset that delineates the space
URBAN SMS Soil Management Strategy
 URBAN SMS Soil Management Strategy Assessment of Soil Protection Efficiency And Land Use Change G. Siebielec, A. Lopatka, T. Stuczynski, M.Kozak, M. Gluszynska, J. Koza, A. Zurek & R. Korzeniowska-Puculek
Agriculture A GRICULTURE
 Agriculture Throughout Europe, the intensification and specialisation of agricultural production have resulted in considerable environmental pressures. Among the most important consequences are soil erosion,
Conservation agriculture in Catalonia
 Mid-term Conference Life HelpSoilproject Conservation agriculture, enhancement of soil functions, reduction of production costs Jaume Boixadera Soils and Agrarian Production Environmental Affairs Service
Oslo, September. Brendan Freeman. UK Office for National Statistics
 22 nd Meeting of the London Group on Environmental Accounting Oslo, 28-30 September CARBON ACCOUNTING IN THE UK: AN OVERVIEW OF PROGRESS AND ISSUES Brendan Freeman UK Office for National Statistics Introduction
Code of Practice for the Sustainable Management of the Forests and Tree Resources of Tonga
 Code of Practice for the Sustainable Management of the Forests and Tree Resources of Tonga National Code Code for Eua plantations Why do we need a code of practice? Forests and trees make a significant
Chapter 1 Resources and Development
 Chapter 1 Resources and Development Resources Substances available in our environment that can be used for specific purposes and are technologically accessible, economically viable and culturally acceptable
An Overview of Cropland Management and Grazing Land Management in the KP Supplement
 Task Force on National Greenhouse Gas Inventories An Overview of Cropland Management and Grazing Land Management in the KP Supplement Nalin SRIVASTAVA, IPCC TFI TSU JRC Technical Workshop 2014 on Reporting
Is there enough land for growing energy crops?
 Is there enough land for growing energy crops? One question that often pops up in the debate about bioenergy, and not least biofuels, is the availability of land for energy crops. The EU Commission wants
Very slight to negligible limitations no special land management practices required.
 Land Capability Classes Land and Soil Capability Class 1 Class 1 Definition Very slight to negligible limitations no special land management practices required. On-site impact of land management practices
DANUBEparksCONNECTED Workshop Corridor Land
 DANUBEparksCONNECTED Workshop Corridor Land 06.-07. April 2017, Spitz a. D., Wachau, Austria Copernicus Land Monitoring Services: from satellite data to ecosystem condition, ecosystem services and green
1. LEGAL STATUS OF THE FARM (to confirm, write ``x``)
") 69 1 LEGAL STATUS OF THE FARM (to confirm write ``x``) 1 LEGAL PERSON 3 FAMILY FARM (OPG) 2 FARM INFORMATION (to confirm write ``x``) 4 Farm is no longer engaged in agricultural production 8 Other (out
69 1 LEGAL STATUS OF THE FARM (to confirm write ``x``) 1 LEGAL PERSON 3 FAMILY FARM (OPG) 2 FARM INFORMATION (to confirm write ``x``) 4 Farm is no longer engaged in agricultural production 8 Other (out
Olives ecosystems and biodiversity - considerations for action in the EU
 Olives ecosystems and biodiversity - considerations for action in the EU IOC Madrid 18/11/09 Guy Beaufoy EFNCP 1 How important are olive ecosystems for European biodiversity? The EU aims to stop biodiversity
Assessing the role of agri-environmental measures to enhance the environment in the Veneto Region with a model based-approach
 Assessing the role of agri-environmental measures to enhance the environment in the Veneto Region with a model based-approach Francesco Morari Department of Agronomy Food Natural resources Animals Environment
The revised and supplemented Corine land cover nomenclature
 Technical report No 38 The revised and supplemented Corine land cover nomenclature Prepared by: M. Bossard, J. Feranec & J. Otahel February 2000 Project manager: Chris Steenmans European Environment Agency