Cascade Natural Gas Corporation
|
|
|
- Reynard Arnold
- 6 years ago
- Views:
Transcription
1 Cascade Natural Gas Corporation 2018 Integrated Resource Plan Technical Advisory Group Meeting #4 Thursday, Oct. 19th, 2017 Oregon Public Utility Commission Offices Salem, OR
2 Agenda Introductions IRP Action Plan Update Fracking Presentation (NWIGU) SENDOUT Optimization Modeling Alternative Resources Candidate Portfolios Monte Carlo Simulations Results Upcoming Schedule Questions 2
3 IRP Action Plan Update 2014 IRP Action Item Update 1. Cascade will improve its demand forecast by developing a report to track the issuance of corrected bills On June 26th Cascade's Gas Supply Oversight Committee (GSOC) and reclassifying therms from corrected bills to the month those therms were used. In its next IRP, Cascade met and was provided an update on the 2017 portfolio will use its new Statistical Analysis Software (SAS) to test non-linear weather effects on natural gas, to procurement plan, which included recent market intelligence and perform analysis on potential serial correlation problems, and to create a time series autoregressive updated pricing. In TAG 3 the company will discuss its supplies of integrated moving average (ARIMA) model for customer forecasting. varying lengths and pricing alternatives. 2. Cascade will continue to monitor outside determinants of natural gas usage, such as legislative building Since the 2014 Action Plan, Cascade has monitored the following code changes and electrical Direct Use campaigns as they are determined to significantly affect the legislation, campaigns, and other external actions with the potential Company s forecast. to influence natural gas use in the States of Washington and Oregon: - National standard practice manual, Portland renewable energy goals, gas to electric fuel switching, HB-2711 moratorium on hydraulic fracturing for oil and gas exploration and production, several Washington state bills on Carbon taxes, deep decarbonization, and the clean air rule. 3. Cascade will continue to monitor the effectiveness of the Oregon Public Purpose Fund to ensure the funds are adequate to capture significant portions of achievable therm savings in Oregon. Since the 2014 IRP, Cascade has made two filings to increase its public purpose charge to ensure funding would be sufficient to acquire the therm savings target established in the IRP as a least cost resource: Advice No. O on December 11th, 2015 to increase its public purpose charge from 1.85% to 3.7% (reduced to 3.4% before Commission approval) and Advice No. O on October 31st, 2016, in which the Company asked to increase the Public Purpose Charge from 3.4% to 4.87%. 4. The company will continue to follow and analyze the impacts of the Western Climate Initiative and The Company has continued to monitor the Western Climate proposed carbon legislation atboth the state and federal level as they pertain to natural gas conservation, Initiative and proposed carbon legislation since the 2014 Action as well as other such acts that may arise from these efforts. The company will continue to monitor the Plan. While no significant action has been taken on the WCI with timing and the costs associated with carbon legislation and analyze the impacts on the company s overall impacts to the Company, the Company is actively following the portfolio costs. As specific carbon legislation is passed, the company will update its avoided cost current legislation and is monitoring the potential impacts to calculations, conservation potential and make modifications to its DSM incentive programs as necessary. portfolio costs. 3
4 IRP Action Plan Update Cont d 2014 IRP Action Item Update 5. The company will continue to monitor the cost effectiveness of existing conservation measures and Cascade continually monitors the region and natural gas industry on emerging technologies to ensure that the current mix of measures included in the Washington currently available technology advancements as part of our Conservation program is appropriate. Areas for further analysis include the impacts associated with Washington incentive programs. We reevaluate the portfolio costeffectiveness paired with current technology and update install modifications to building codes along with the cost effectiveness of newer technologies such as the next generation of high efficiency water heaters (.70 EF) and high-efficiency hybrid heat pumps. The costs to maintain viability and as robust of a program as feasible. applicability of these measures within Cascade s service territory will be analyzed and the company s The Company is also engaged with the Northwest Energy Efficiency Conservation Incentive Program will be modified as necessary. Alliance market transformation collaborative in coordination with other local utilities and the Energy Trust of Oregon as well as the Gas Technology Institute s emerging technology program to stay abreast of new technologies and opportunities for additions and changes to the Company s offerings. The Company also maintains a Trade Ally network for our Washington programs and routinely connects with local contractors to gauge availability of product and costs associated with installs of rebate eligible equipment and measures. The landscape is constantly evolving and Cascade works with its partners and local agencies and builders (including home builder associations) to track building code updates as well as changes to industry standards. 6. The Company will continue to monitor the potential reporting, administrative and potential financial impacts of long term resources as a result of concerns surrounding fracking. In particular we are awaiting the EPA to reveal the results of their current study in alleged water contamination found in Wyoming as a result of fracking activities. Cascade has included a slide in TAG 3 to address this action item. Additionally, Cascade has extended an invitation to NWIGU to discuss this item. 4
5 IRP Action Plan Update Cont d 2014 IRP Action Item Update 7. Cascade will continue to evaluate gas supply resources on an ongoing basis, including supplies of varying Due to the robust nature of TAG 3, this will now be discussed in TAG lengths (base, swing, peaking) and pricing alternatives. We will continue to analyze the uncertainties 4. associated with supply and demand relationships. 8. The Company will continue to monitor the proposed pipeline expansion projects to access more NWP has provided an updated Wenatchee lateral expansion which supplies out of the Rockies. As cost estimates change, the company will analyze those resources under is currently being considered for modeling. consideration to determine if modifications to the preferred portfolio are necessary. 9. As part of the Cascade s risk management policy and implementation, the Company will report on the Interested parties met on August 23rd, with the conclusion that an status of the UM 1720 as well as related risk management policy enhancements to Cascade s risk agreement could not be reached. The parties at this meeting (Staff, management policy, at the first Purchased Gas Adjustment (PGA) quarterly meeting with OPUC Staff in regional LDCs, NWIGU and CUB) will be requesting that this docket early This docket is the Commission s Investigation into Long Term Hedging Policy. be closed. Cascade continues to work on enhancing its risk management policies in compliance with Washington's new hedging rules 10. The Company will continue to explore options to incorporate biogas into its portfolio, as specific Cascade has filed a Biomethane Reciept Services (Schedule 800) in projects are identified in our service territory. Price, location and gas quality considerations of the biogas Oregon to estabilsh biogas injection terms, conditions and gas supply will be evaluated. quality requirements. Cascade continues to work with possible biomethane producers and evaluate those projects for possible future core supplies. 11. The Company will continue to monitor proposed LNG import facilities as information becomes Cascade is continuing to monitor the progress of import/export available and will evaluate the various options that, if built, could result. Issues to monitor include specific facilities such as the proposed Jordan Cove LNG terminal. The status cost, the availability of pipeline capacity and project timing. of these projects are documented each month in Cascade's monthly internal market intelligence report 12. The Company will continue to monitor the futures market for price trends and will evaluate the Cascade has updated its price forecast to modify its weights based effectiveness of its risk management policy. Implementation of Dodd- Frank in the coming year raises on a backcast of the accuracy of its sources. At this time the price potential administrative challenges from a reporting standpoint; additionally it is unknown how the costs impacts of Dodd-Frank and hedging related dockets such as UM associated with the use of clearinghouses might impact prices of natural gas in the future and UG continues to be unknown. The Company will continue to provide updates in coming TAG meetings. 5
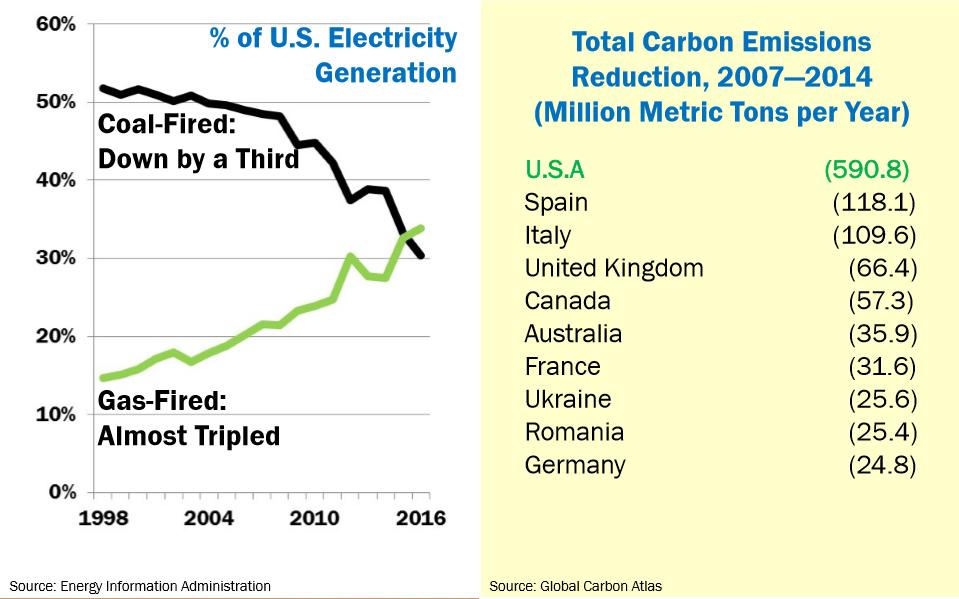
6 Consumer and Environmental Benefits of Shale Revolution Ed Finklea Northwest Industrial Gas Users Presentation to Cascade TAG October 19, 2017
7 Oil and Natural Gas Price History

8 U.S. Natural Gas Production and Consumption in Billions of Cubic Feet
9 Natural Gas Production Outlook in North America, in Trillion Cubic Feet 9

10 10
11 Eliminate Shale 11
12 Prices Stay Above $
13 No Fracking s Impact on Oregon Consumers Oregon Natural Gas Consumers Burned 239 million Dekatherm's in If no fracking raised natural gas prices by $5.00 per Dekatherm, staying at the pre fracking price of just above $8.00, Oregon consumers would have paid at least $1.1 billion more for natural gas in Every $1.00 per Dekaterm price reduction annually saves Oregon consumers $239 million on natural gas. US would have approximately a 10TCF shortfall to meet 2016 consumption levels without shale gas. How much LNG would US be importing? From where? Through what terminals? In Oregon, where would our natural gas be coming from? Would Canada be saving us at higher prices? 13
14 14
15 SENDOUT Optimization Modeling
16 SENDOUT Model Cascade utilizes SENDOUT for resource optimization. This model permits the Company to develop and analyze a variety of resource portfolios to help determine the type, size, and timing of resources best matched to forecast requirements. SENDOUT is very powerful and complex. It operates by combining a series of existing and potential demand side and supply side resources, and optimizes their utilization at the lowest net present cost over the entire planning period for a given demand forecast. 16
17 SENDOUT Model (Cont d) SENDOUT utilizes a linear programming approach. The model knows the exact load and price for every day of the planning period based on the analyst s input and can therefore minimize costs in a way that would not be possible in the real world. Therefore, it is important to recognize that linear programming analysis provides helpful but not perfect information to guide decisions. 17
18 Modeling Transportation In SENDOUT is a Balancing Act Start with a point in time look at each jurisdiction s resources Use the Nov17-Oct18 PGA portfolio Contracts Receipt and Delivery Points We start with current transport contracts, using centralized receipts and approximately 66 delivery locations Rates - Current contractual, with CPI increase every 3 years Contractual vs. Operational Contractual can be overly restrictive Operational can be overly flexible Incorporating operational realities into our modeling can defer the need to acquire new resources. Gas Supply s job is to get gas from the supply basin to the pipeline citygate IRP focus is on the core Operations job is to take gas from the pipeline gate to our customers Operations focus is on the system, not just the core Limiting factor is receipt quantity how much can you bring into the system? 18
19 Modeling Challenges Supply needs to get gas to the citygate. Many of Cascade s transport agreements were entered into decades ago, based on demand projections at that point in time. Sum of receipt quantity and aggregated delivery quantity can help identify resource deficiency depending on how rights are allocated. The aggregated look can mask individual citygate issues for looped sections, and the disaggregated look can create deficiencies where they don t exist. In many cases operational capacity is greater than contracted. SENDOUT has perfect knowledge. 19
20 Supply Resource Optimization Process Step 1: As-Is Analysis o Run a deterministic optimization of existing resources with a three-day peak event to uncover timing and quantity of resource deficiencies. Step 2: Introduce Additional Resources o Include incremental supply, storage, and transportation to derive a deterministic optimal portfolio, additional portfolios. Step 3: Stochastic Analysis of All Portfolios Under Existing Conditions o Run all portfolios through a Monte Carlo weather simulation, using expected growth, supply and storage accessibility. Record the probability distributions of total system costs for each portfolio. Step 4: Ranking of Portfolios o Determine the preferred portfolio based on the mean and Value at Risk (VaR) of the total system cost and unserved demand of each portfolio. This resource mix will be the best combination of cost and risk for Cascade and its customers. 20
21 Supply Resource Optimization Process (Cont d) Step 5: Stochastic Analysis of Preferred Portfolio o Run Monte Carlo simulations of various scenarios on preferred portfolio; comparing Mean and VaR to a managerial limit. Step 6: Analysis of Preferred Portfolio o Review data to confirm total system costs did not exceed Mean and VaR limits in any scenario. If limit is exceeded, repeat step 5 with next highest ranked portfolio. Step 7: Sensitivity of Preferred Portfolio o Run the preferred portfolio through Monte Carlo simulations on price. Review results to determine if total system cost is within the Mean and VaR limits across all sensitivities. Step 8: Re-evaluation of Preferred Portfolio o If the total system costs fall outside of the Mean and VaR limits in sensitivity analysis, select the next most optimal portfolio to run scenario and sensitivity analysis on. Repeat as needed. 21
22 Base Case Sendout Inputs Supply Storage Transportation Constraints Demand Weather Price Forecast 22

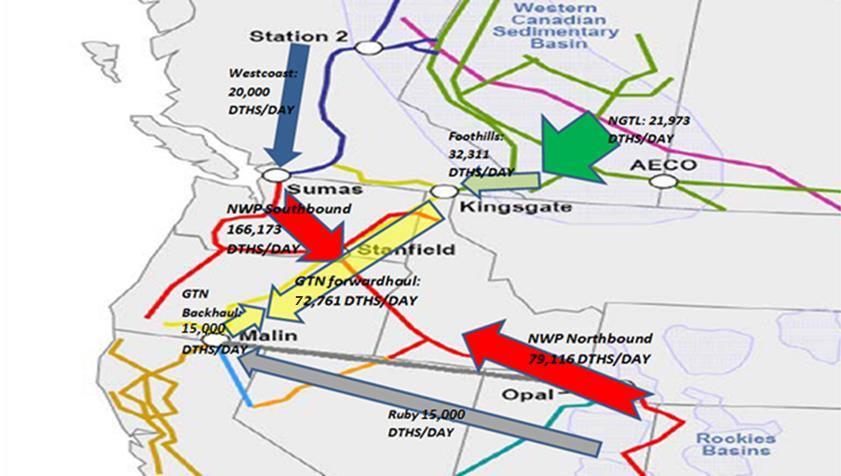
23 Supply Cascade can purchase gas at four markets; AECO, SUMAS, KINGSGATE and OPAL. At each market Cascade can purchase gas at different locations along the pipeline. For the first year, Cascade uses all current contracts for Supply inputs. For years 2-20, Cascade uses Base, Fixed, Winter base, Summer and Winter day gas, and Peak day incremental supplies as inputs. Over the planning horizon, the contracts are renewed in November and April. 23
24 Supply 24
25 Supply Base and Fixed Supply Base and Fixed are the baseline supply contracts that are entered into every 12 months. A base contract has a basis rate. This is defined as the price of gas at a given market (i.e., AECO base is the expected cost of gas at NYMEX plus the basis for AECO, for a given month). A fixed contract has a fixed rate. A penalty is applied to each contract when the gas is not taken for a day. This type of penalty forces these types of contracts to only take the optimal amount of gas to serve the base demand. 25

26 Supply Example 26
27 Base Supply (Cont d) 27
28 Winter base Supply Winter base supply is contracted supply with a premium charge that is slightly higher than base gas. The Maximum Daily Quantity (MDQ) is optimally set by SENDOUT. Winter supply is renewed every November and completes at the end of March. Winter Supply is additional baseline supply on top of the base or fixed supplies for the winter months. There is a penalty associated to this contract to force SENDOUT to take the optimal amount of additional winter base gas. 28
29 Winter Base Supply (Cont d) 29
30 Day Supply (Winter) Winter Day supply is gas that is R-mixed at the beginning of November each year. The R-mix function takes into account the fixed and variable costs of a resource to determine the proper amount to take in a given period. Winter day gas has an MDQ cap but is not a must take supply. If a winter day supply has an MDQ of 10,000 dth then it can take anywhere from 0 to 10,000 dth of gas on any given day in the winter. Winter day supply has a slightly higher premium than winter base supply and it can be contracted from November to April. 30
31 Winter Day Supply (Cont d) 31
32 Day Supply (Summer) Summer day supply is gas that is R-mixed at the beginning of April each year. Summer day gas has an MDQ cap but is not a must take supply. If a summer day supply has an MDQ of 10,000 dth then it can take anywhere from 0 to 10,000 dth of gas on any given day in the summer. Summer day supply has a slightly higher cost than base supply and it can be contracted from April to November. 32
33 Day Supply (Summer) 33
34 Peak Supply Peak supply is gas purchased on high demand days where base, index, winter base, or day supply cannot accommodate. Peak supply has a slightly higher premium to buy than day supply. As long as Cascade has the transport capacity or can utilize a third party s transport capacity, we can purchase as much peak supply as needed to meet peak demand. 34
35 Total Supply 35
36 Storage Cascade leases storage at 2 locations: Jackson Prairie (JP) and Plymouth (Ply). Cascade has 4 storage contracts with JP and 2 contracts with Plymouth. Storage injections targets are set at 35% by the end of June, 80% by the end of August, and 100% by the end of September. These targets are set by our Gas Supply Oversight Committee. Cascade can withdrawal approximately 56,000 dth per day from JP and 78,000 dth per day from Plymouth for a total of approximately 134,000 dth per day. 36

37 Storage Example 37

38 Storage Example 2 38
39 Transportation Transportation contracts are the means of how Cascade gets the gas from the supplier to the end user. Cascade has multiple types of transportation: A single delivery point. Multiple delivery points. The multiple delivery point contracts gives Cascade the flexibility to move the gas where it s most needed. On NWP, transportation goes to the zonal level because MDDO s can be reallocated within a zone to the citygate. Additionally, NWP typically issues constraint concerns at the zonal level. On GTN, transportation goes to the citygate level as MDDO s cannot be reallocated within the GTN zone. 39
40 Transportation (Cont d) Transportation has an MDQ, a D1 rate, a transportation rate, and a fuel loss percentage. A maximum delivery quantity (MDQ) which is the maximum amount of gas Cascade can move on the pipeline on a single day. A D1 rate which is the reservation rate to have the ability to move the MDQ amount on the pipeline. A transportation rate which is the rate per dekatherm that is actually moved on the pipeline. The fuel loss percentage is the statutory percent of gas based on the tariff from the pipeline that is lost and unaccounted for from the point of where the gas was purchased to the citygate. 40

41 Transport Example 41
42 Transport Example 42
43 Delivery Rights vs Receipt Rights Cascade has more Delivery Rights than Receipt Rights. Approximately 457,000 Dth of Delivery Rights. Approximately 360,000 Dth of Receipt Rights. The excess Delivery Rights allow Cascade to be flexible with the 360,000 Dth of Receipt Rights. 43
44 Example of delivery right flexibility All of the following must be true X1 4MDTs X2 4MDTs X3 4MDTs X1 + X2 + X3 4MDTs 44

45 Example of delivery right inflexibility 2.5 MDTs 0.5 MDTs 1 MDT 45
46 Transport Constraints To simplify modeling in SENDOUT, the software allows the user to group multiple paths of one contract into a constraint group. This tells SENDOUT to allow each path to take up to X Dekatherms, but not to exceed X Dekatherms for all paths of the contract. The analyst identifies which contracts should be in the group and assigns an MDQ for the constraint group. 46

47 Transport Constraints Example 47

48 Location of Zones (Source: NWP) 48
49 Zone 26 on Peak Day for Transport
50 Zone 30-S on Peak Day for Transport
51 Zone 30-W on Peak Day for Transport
52 Transport Contract on Peak Day 52
53 Example of delivery right flexibility 53
54 Demand Behind the Gate Cascade has strived over the last several years to enhance the IRP forecast and resource analysis to get to as granular a level as possible using the available data. Attempts to forecast demand behind the gate using existing forecasting methodology has been challenging. Customer billing data does not have daily meter reads for core customers making regression analysis on use per HDD per customer difficult. Given Cascade is not a contiguous system, DSM by citygate is currently is an ongoing complication: This year we have added the Climate Zone. Future IRPs will address the citygate level. Some towns can be served by multiple pipelines and the mix can change over time. 54
55 Demand Demand is forecasted at the citygate level by rate schedule. For NWP, each citygate s demand is associated with the zone. For GTN, each citygate s demand is associated with it s respective citygate interconnect. Demand Inputs Forecast type (Monthly amount or Regressions). Monthly projected customers for 20 years. Regression coefficients if using the Regression forecast type. If using a monthly number, it is the 2016 demand for that month with a growth factor. 55

56 Demand Example 56
57 Demand Example 2 57
58 Weather Weather inputs for SENDOUT include: Monte Carlo Historical Normal Monte Carlo inputs include mean, standard deviation, max, minimum, and distribution. Historical data is used to build weather profiles for Monte Carlo. Normal weather is the daily average of the 30-year most recent history ( ). 58

59 Weather Example Monte Carlo 59
60 Long Range Price Forecast Cascade s long-term planning price forecast is based on a blend of current market pricing along with long-term fundamental price forecasts. The fundamental forecasts include Wood Mackenzie, EIA, the Northwest Power Planning Council (NPPC), Bentek and the Financial Forecast Center s long term price forecasts. While not a guarantee of where the market will ultimately finish, Henry Hub NYMEX is the most current information that provides some direction as to future market prices. Wood Mackenzie's long-term forecast is at a monthly level by basin. Cascade uses this to help shape the forecast s monthly basis pricing. The Company also relies on EIA s forecast; however, it has its limitations since it is not always as current as the most recent market activity. Further, the EIA forecast provides monthly breakdowns in the short-term, but longer term forecasts are only by year. 60
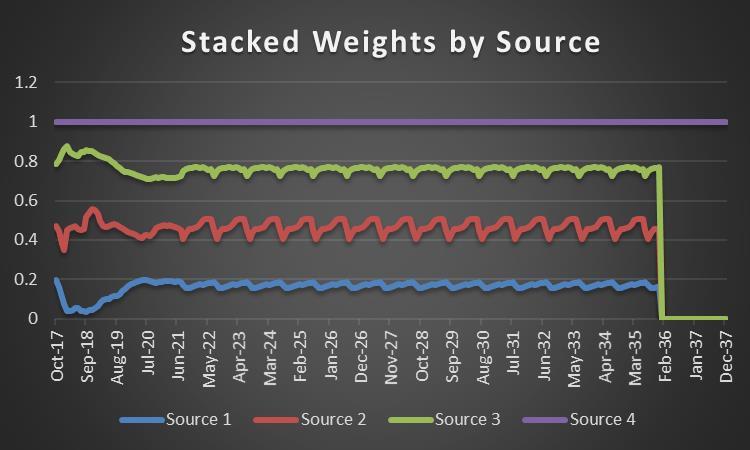
61 Long Range Price Forecast (Cont d) CNGC assigns a weight to each source to develop the monthly Henry Hub price forecast for the 20-year planning horizon. Although it is impossible to accurately estimate the future, for trading purposes the most recent period has been the best indicator of the direction of the market. However, Cascade also considers other factors (historical constraints) which can lead to minor adjustments to the final long range forecast. 61
62 Price Forecast Weights Considerations in weight assignments o Cascade has modified its weighting system based on a backcast of the symmetric mean absolute percentage error (SMAPE) of its sources since Wood Mackenzie (monthly, covers all basins) - EIA (industry barometer, annual long term) - NPPC (regional perspective, but recognize it is also a blend) - NYMEX Henry Hub o EIA is the only source who produces a forecast after EIA typically forecasts higher than most other sources, so their forecast needs to be normalized based on their average error 62
63 Example of SMAPE Calculations by Source Source 1 Source 2 Source 3 Source 4 T T T T T T T T T T T T
64 Example Weights Price Forecast For 2018 Date Source 1 Source 2 Source 3 Source 4 18-Jan 7.443% % % % 18-Feb 4.103% % % % 18-Mar 4.142% % % % 18-Apr 4.619% % % % 18-May 5.469% % % % 18-Jun 5.248% % % % 18-Jul 3.654% % % % 18-Aug 3.970% % % % 18-Sep 3.324% % % % 18-Oct 4.354% % % % 18-Nov 4.459% % % % 18-Dec 5.599% % % % 64
65 65
66 66
67 Alternative Resources
68 Major Resource Issues on the Horizon Once a deficiency is identified, Cascade must analyze potential solutions to ensure service over the planning horizon. Conversations with partners at various pipelines, storage facilities, new supply sources. SENDOUT is used to ultimately derive the optimal mix of resources, referred to as the preferred portfolio. 68

69 Location of Current & Alternative Resources 69

70 Incremental Transport North to South Incremental NGTL Additional capacity to move gas from AECO basin to Alberta/BC border Incremental Foothills Additional capacity to move gas from Alberta/BC border to Kingsgate Incremental GTN N/S Additional capacity to move gas from Kingsgate to various citygates along GTN 70

71 Incremental Transport Northwest Pipeline I-5 Mainline Expansion Additional capacity to move gas along I-5 corridor in western Washington Wenatchee Lateral Expansion Additional capacity to move gas along Wenatchee Lateral to central Washington Spokane Lateral Expansion Additional capacity to move gas along Spokane Lateral to eastern Washington Eastern Oregon Mainline Expansion Additional capacity to move gas along Eastern Oregon Lateral to Oregon citygates 71

72 Incremental Transport South to North Incremental Opal Additional capacity to move gas from Utah to Opal Incremental Ruby Additional capacity to move gas from Rockies Basin to Turquoise Flats Incremental GTN S/N Additional capacity to move gas from Turquois Flats to various citygates along GTN 72

73 Incremental Transport Bilateral T-South Southern Crossing Price arbitrage opportunity to move gas between Sumas and AECO basins bilaterally Trails West (Palomar) Additional capacity to move Rockies gas to the I-5 corridor Pacific Connector Pipeline that will feed LNG facility on Oregon coast, increasing liquidity at Malin 73

74 Incremental Storage - North and East Ryckman Creek Storage Additional storage in southwest Wyoming serving the system, primarily Oregon Magnum Storage Additional storage near Rocky Mountains, serving the system, primarily Oregon AECO Hub Storage Additional storage near AECO Hub, serving the system Clay Basin Storage Additional storage near Opal, serving the system 74

75 Incremental Storage - South and West Gill Ranch Storage Additional storage in central California, serving the system, primarily Oregon Mist Storage Additional storage in northern Oregon, serving the system, primarily Washington Wild Goose Storage Additional storage in northern California, serving the system, primarily Oregon 75

76 Incremental Supplies Incremental Opal Supply Additional supply around the Rockies Basin Renewable Natural Gas Incremental biogas supply directly to distribution system 76
77 Candidate Portfolios
78 Portfolio Summary GTN No GTN NWP ALL-IN NWP Only NWP Only w/ Storage No NWP GTN Only GTN Only w/ Storage Only Storage 78
79 Portfolio Components All In Incremental GTN Incremental GTN & Storage Incremental NWP Incremental NWP & Storage Storage Only Incremental NGTL X X X Incremental Foothills X X X Incremental GTN N/S X X X I-5 Expansion X X X Wenatchee Lateral Spokane Expansion X X Eastern OR Expansion Incremental Opal Incremental Ruby Incremental GTN S/N T-South Southern Crossing Trails West (Palomar) Pacific Connector Ryckman Creek Storage X X X Magnum Storage AECO Hub Storage Clay Basin Storage Gill Ranch Storage Mist Storage Wild Goose Storage Incremental Opal Supply Renewable Natural Gas 79
80 All In Portfolio Deterministic optimum mix of all evaluated resources, including incremental transportation on NWP & GTN, and all regional storage facilities. Components: Incrm GTN: 10,200 Dths by Nov. 2027, escalating to 25,021 Dths by Nov Incrm Fthls: 25,908 Dths by Nov Incrm I-5 Exp: 17,469 Dths by Nov. 2027, escalating to 41,035 Dths by Nov Incrm Nova: 36,246 Dths by Nov
81 Incremental GTN & Storage Portfolio Deterministic optimum mix of incremental transportation on GTN and all regional storage facilities. Components: Incrm GTN: 21,218 Dths by Nov. 2027, escalating to 43,490 Dths by Nov Incrm Fthls: 48,783 Dths by Nov Incrm Nova: 6,364 Dths by Nov. 2027, escalating to 59,121 Dths by Nov Incrm Ryckman Creek: 1,000 Dths by Nov
82 Incremental GTN Only Deterministic optimum mix of incremental transportation on GTN. Components: Incrm GTN: 21,218 Dths by Nov. 2027, escalating to 43,490 Dths by Nov Incrm Fthls: 48,783 Dths by Nov Incrm Nova: 6,364 Dths by Nov. 2027, escalating to 59,121 Dths by Nov
83 Incremental NWP & Storage Portfolio Deterministic optimum mix of incremental transportation on NWP and all regional storage facilities. Components: Incrm I-5 Exp: 7,531 Dths by Nov. 2027, escalating to 37,321 Dths by Nov Incrm Spokane Exp: 14,794 Dths by Nov Incrm Ryckman Creek: 1,000 Dths by Nov
84 Incremental NWP Only Deterministic optimum mix of incremental transportation on NWP. Components: Incrm I-5 Exp: 7,531 Dths by Nov. 2027, escalating to 37,321 Dths by Nov Incrm Spokane Exp: 14,794 Dths by Nov
85 Incremental Storage Only Deterministic optimum mix of incremental regional storage facilities. Components: Incrm Ryckman Creek: 1,000 Dths by Nov
86 Final Ranking Mean and VaR Total System Cost Portfolios Mean ($000) VaR ($000) Unserved Demand Mean VaR (Mdts) (Mdts) All-In 3,730,375 3,761, Incrm GTN 3,605,874 3,636, Incrm GTN with Storage 3,607,897 3,638, Storage Only 3,741,640 3,772, Incrm NWP with Storage 3,763,508 3,794, Incrm NWP 3,763,540 3,795,
87 Candidate Portfolio - All In Portfolio Deterministic optimum mix of all evaluated resources, including incremental transportation on NWP & GTN, and all regional storage facilities. Components: Incrm GTN 10,200 Dths by Nov. 2027, escalating to 25,021 Dths by Nov Incrm Fthls 25,908 Dths by Nov Incrm I-5 Exp 17,469 Dths by Nov. 2027, escalating to 41,035 Dths by Nov Incrm Nova 36,246 Dths by Nov
88 Scenarios and Sensitivities
89 Monte Carlo Simulations Monte Carlo Scenarios Weather Monte Carlo Sensitivities NYMEX price Why not Monte Carlo on both together? 89
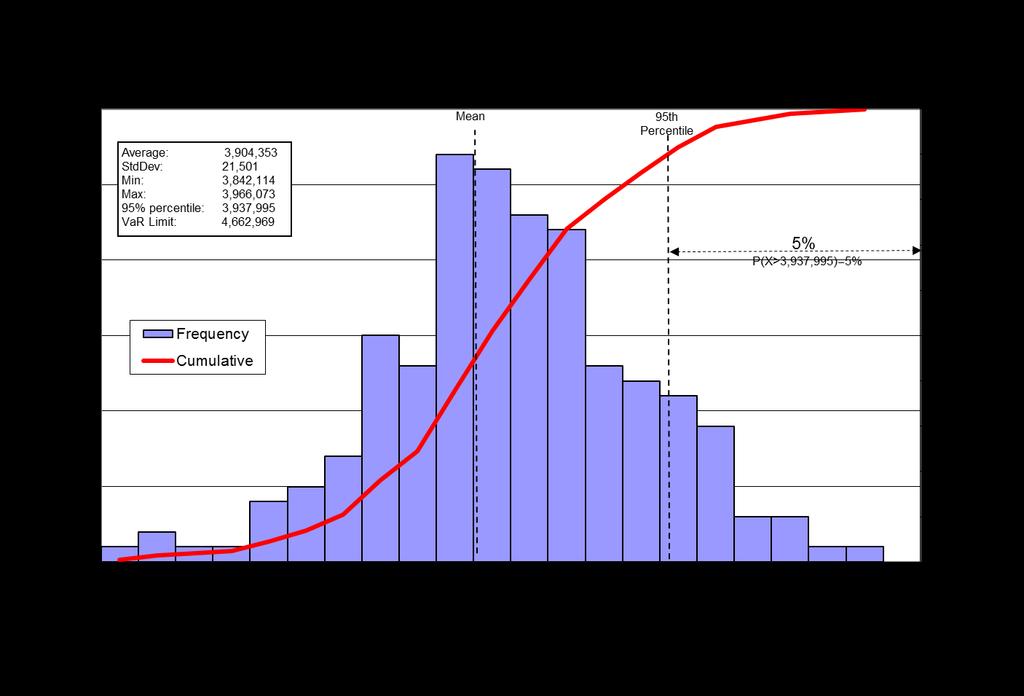
90 Monte Carlo Weather Using historical weather, we had SENDOUT run 200 simulations to stress test our candidate portfolio over a variety of different scenarios. In each scenario, we are testing to confirm that the mean and VaR are within acceptable limits as set by Cascade s Gas Supply Oversight Committee. This ensures that our expected resource portfolio is still the optimal choice even in extreme weather situations. 90

91 Low Growth and High Growth 91

92 Limit JP and Limit Ply Storage 92

93 Limit Both Storage and No JP 93
94 No Ply Storage and No Storage 94
95 Monte Carlo Weather Normal Distribution 95
96 Monte Carlo Weather Normal Distribution When following a normal distribution your data will follow the 68%, 95%, 99.7% rule like in the below diagram. 96


97 Monte Carlo Weather Normal Distribution To build our monthly inputs for SENDOUT we analyze our 30 data samples for each weather location which are the monthly HDD totals for the years After getting the mean and standard deviation we can compute how many data samples fall within each range of standard deviations. 97
98 98
99 99
100 100
101 101
102 102
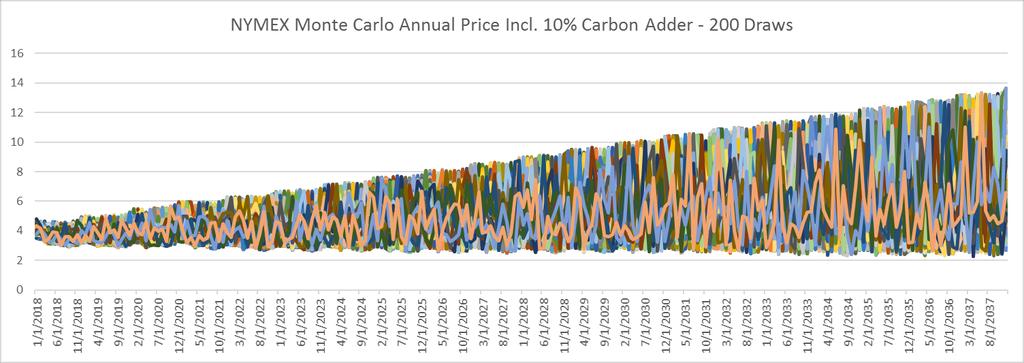
103 Monte Carlo NYMEX Price Using our 20 year price forecast as the mean value for the NYMEX market, we had SENDOUT run 200 simulations to stress test our expected case over a variety of different pricing environments. In each sensitivity test, we are testing to confirm that the mean and VaR are within acceptable limits as set by Cascade s Gas Supply Oversight Committee. This ensures that our expected resource portfolio is still the optimal choice even in extreme pricing situations. 103

104 Sensitivities Analysis 104
105 105
106 106
107 107
108 108

109 Scenario/Sensitivity Analysis ($000) 109
110 110
111 111
112 112

113 Why not Monte Carlo Price AND Weather? What happens when we look at drawing on both price and weather at the same time? We can imagine a 3 dimensional histogram, instead of the 2 dimensional histograms on the previous pages. Filling this in takes many more draws. 200 draws of weather on the X axis and 200 draws of price on the Y axis might need 200 x 200 = 40,000 draws to fill in a histogram like this 113
114 2018 IRP Timeline Monday, November 6, 2017 Draft of 2018 IRP distributed Tuesday, December 5, 2017 Comments due on draft from all stakeholders Wednesday, December 20, 2017 TAG 5, if needed WebEx Only Monday, January 22, 2018 Executive Summary Presentation to Senior Kennewick, WebEx Management Thursday, January 25, 2018 IRP filing in Oregon 114
115 Questions? 115
116 Cascade Natural Gas Corporation 2018 Integrated Resource Plan Technical Advisory Group Meeting #4 Thursday, Oct. 19th, 2017 Oregon Public Utility Commission Offices Salem, OR
Cascade Natural Gas Corporation
 Cascade Natural Gas Corporation 2016 Integrated Resource Plan Update Workshop with OPUC Staff and Stakeholders Monday, March 27, 2017 OPUC Salem, OR 1 AGENDA Opening Remarks Item 1 Modeling Item 2&3 Shortfalls
OREGON PUBLIC UTILITY COMMISSION 2011 NATURAL GAS OUTLOOK WORKSHOP. August 3, :30 AM Main Hearing Room
 OREGON PUBLIC UTILITY COMMISSION 2011 NATURAL GAS OUTLOOK WORKSHOP August 3, 2011 9:30 AM Main Hearing Room Agenda Overview of expected PNW natural gas prices for 2011-2012 Staff Top natural gas issues
I 5 Corridor Analysis Phase 1 Report
 Power & Natural Gas Planning Task Force I 5 Corridor Analysis Phase 1 Report Table of Contents 1. Executive Summary... 2 2. Background and Need for Study... 4 3. NGA Outlook Approach... 5 4. Natural Gas
Appendix C. Regulatory Compliance Matrix DRAFT 2018 OR IRP
 Matrix DRAFT 2018 OR IRP Matrix Page 2 Order No. 07-047 Guideline (1)(a) Guideline (1)(b) All resources must be evaluated on a consistent and comparable basis All known resources for meeting the utility
Gas sales refers to PSE s direct delivery of natural gas to end-use customers.
 CHAPTER 6 Gas Analysis Contents 1. Gas Resource Need... 6-1 2. Gas Sales Existing Resources... 6-10 3. Gas Sales Resource Alternatives... 6-22 Natural gas has become an increasingly important resource
GAS ANALYSIS. Contents. Chapter 7: Gas Analysis
 GAS ANALYSIS Contents 7-2. GAS SALES RESOURCE NEED & KEY ISSUE Gas Sales Need Gas Sales Key Issue 7-4. GAS SALES ANALYTIC METHODOLOGY Optimization Analysis Tools Deterministic Optimization Analysis 7-6.
NORTHERN UTILITIES, INC. NEW HAMPSHIRE DIVISION ANNUAL COST OF GAS ADJUSTMENT FILING PREFILED TESTIMONY OF FRANCIS X.
 NORTHERN UTILITIES, INC. NEW HAMPSHIRE DIVISION ANNUAL 0-0 COST OF GAS ADJUSTMENT FILING PREFILED TESTIMONY OF FRANCIS X. WELLS Prefiled Testimony of Francis X. Wells Annual 0-0 COG Filing Page of I. INTRODUCTION
Gas Analysis. Contents. 1. Analytical Models APPENDIX L. 1. Analytical Models... L Analytical Results... L-9
 APPENDIX L Gas Analysis Contents 1. Analytical Models... L-1 2. Analytical Results... L-9 3. Portfolio Delivered Gas Costs... L-24 1. Analytical Models PSE uses the SENDOUT software model from Ventyx for
BEFORE THE PUBLIC UTILITY COMMISSION OF OREGON
 ORDER NO. 08-308 ENTERED 06/02/08 BEFORE THE PUBLIC UTILITY COMMISSION OF OREGON LC 44 In the Matter of AVISTA CORPORATION, dba AVISTA UTILITIES 2007 Integrated Resource Plan. ) ) ) ) ) ) ORDER DISPOSITION:
2017 PSE Integrated Resource Plan. Gas Analysis
 7 2017 PSE Integrated Resource Plan Gas Analysis This analysis enables PSE to develop valuable foresight about how resource decisions to serve our natural gas customers may unfold over the next 20 years
NWGA Members: 1914 Willamette Falls Dr., #255 West Linn, OR (503) Avista Corporation. Cascade Natural Gas Co.
 Avista Corporation. Cascade Natural Gas Co.") 1914 Willamette Falls Dr., #255 West Linn, OR 97068 (503) 344-6637 www.nwga.org NWGA Members: Avista Corporation Cascade Natural Gas Co. FortisBC Energy Intermountain Gas Co. NW Natural Puget Sound Energy
1914 Willamette Falls Dr., #255 West Linn, OR 97068 (503) 344-6637 www.nwga.org NWGA Members: Avista Corporation Cascade Natural Gas Co. FortisBC Energy Intermountain Gas Co. NW Natural Puget Sound Energy
May 29, 2015 VIA ELECTRONIC FILING
 MARK R. THOMPSON Manager, Rates & Regulatory Affairs Tel: 503.721.2476 Fax: 503.721.2516 Email: mark.thompson@nwnatural.com May 29, 2015 VIA ELECTRONIC FILING Public Utility Commission of Oregon Attention:
Plugging In To Natural Gas Portland, Oregon January 25
 Plugging In To Natural Gas Portland, Oregon January 25 1914 Willamette Falls Dr., #255 West Linn, OR 97068 (503) 344-6637 www.nwga.org NWGA Members: Avista Corporation Cascade Natural Gas Co. FortisBC
2016 Integrated Resource Plan
 2016 Integrated Resource Plan December 14, 2016 CASCADE NATURAL GAS CORPORATION 2016 INTEGRATED RESOURCE PLAN (UG-160453) TABLE OF CONTENTS Section 1 Executive Summary Page # Purpose 1-2 IRP Process and
TABLE OF CONTENTS I. INTRODUCTION AND QUALIFICATIONS... II. NED SUPPLY PATH PROPOSAL... III. GAS PRICE FORECASTS... IV. NED SUPPLY PATH QUANTITY... V.
 BEFORE THE NEW HAMPSHIRE PUBLIC UTILITIES COMMISSION Liberty Utilities (EnergyNorth Natural Gas) Corp. d/b/a Liberty Utilities Docket No. DG - Petition for Approval of Tennessee Gas Pipeline Company, L.L.C.
OREGON PUBLIC UTILITY COMMISSION 2009 NATURAL GAS OUTLOOK WORKSHOP. July 7, :30 PM Main Hearing Room
 OREGON PUBLIC UTILITY COMMISSION 2009 NATURAL GAS OUTLOOK WORKSHOP July 7, 2009 1:30 PM Main Hearing Room Agenda Overview of expected PNW natural gas prices for 2009-2010 Staff Five top natural gas issues
BEFORE THE PUBLIC UTILITY COMMISSION OF OREGON LC 72
 BEFORE THE PUBLIC UTILITY COMMISSION OF OREGON LC 72 In the Matter of AVISTA CORPORATION, dba AVISTA UTILITIES, 2018 Opening Comments 2018 Integrated Resource Plan Introduction The following are the Public
Customer Select Supply/Storage. Effective May 2009
 Customer Select Supply/Storage Effective May 2009 Service Territory Nicor Gas Territory Area: 17,000 square miles Population: 5.7 million (est.) Communities Served: 640 Customers: 2.2 million Rockford
Natural Gas. Integrated Resource Plan August 31, 2016
 2016 Natural Gas Integrated Resource Plan August 31, 2016 Safe Harbor Statement This document contains forward-looking statements. Such statements are subject to a variety of risks, uncertainties and
ONTARIO ENERGY REPORT Q2 2018
 ONTARIO ENERGY REPORT Q APRIL JUNE OIL AND NATURAL GAS Regular Gasoline and Diesel Provincial Retail Prices ($/L) Regular Gasoline $1.3 Diesel $1.7 Source: Ministry of Energy, Northern Development and
ONTARIO ENERGY REPORT Q1 2018
 ONTARIO ENERGY REPORT Q1 018 JANUARY MARCH 018 OIL AND NATURAL GAS Regular Gasoline and Diesel Provincial Retail Prices ($/L) Regular Gasoline $1.3 Diesel $1.3 Source: Ministry of Energy Fuel Prices Natural
EIA Winter Fuels Outlook
 EIA 2018 19 Winter Fuels Outlook U.S. Energy Information Administration Independent Statistics & Analysis www.eia.gov The main determinants of winter heating fuels expenditures are temperatures and prices
LDC SUPPLY PORTFOLIO MANAGEMENT DURING THE WINTER HEATING SEASON
 EA 2013-04 December 12, 2013 LDC SUPPLY PORTFOLIO MANAGEMENT DURING THE 2012-13 WINTER HEATING SEASON I. Introduction Each year local natural gas utilities develop a plan to reliably meet customer needs
Natural Gas Market Update
 Natural Gas Market Update John Jicha - MGE Director - Energy Supply and Trading Madison Gas and Electric Company Agenda What a difference ten years can make Low prices Fundamental factors impacting the
Electric Forward Market Report
 Mar-01 Mar-02 Jun-02 Sep-02 Dec-02 Mar-03 Jun-03 Sep-03 Dec-03 Mar-04 Jun-04 Sep-04 Dec-04 Mar-05 May-05 Aug-05 Nov-05 Feb-06 Jun-06 Sep-06 Dec-06 Mar-07 Jun-07 Sep-07 Dec-07 Apr-08 Jun-08 Sep-08 Dec-08
2010 Annual Winter Reliability Assessment Meeting November 4, Carlos Thillet Manager Gas Supply and Transportation PECO Energy Company
 Pennsylvania Public Utility Commission 2010 Annual Winter Reliability Assessment Meeting November 4, 2010 Carlos Thillet Manager Gas Supply and Transportation PECO Energy Company 2010-11 Reliability Overview
Natural Gas Issues and Emerging Trends for the Upcoming Winter and Beyond
 Natural Gas Issues and Emerging Trends for the Upcoming Winter and Beyond 2013 NASEO WINTER ENERGY OUTLOOK CONFERENCE November 1, 2013 Kevin Petak Vice President, ICF International Kevin.Petak@icfi.com
Outlook for Western U.S. Natural Gas Markets
 Outlook for Western U.S. Natural Gas Markets Summer Energy Outlook Conference April, Contact: Kevin R. Petak Vice President, Gas Market Modeling ICF International 73-1 1-753753 kpetak@icfi.com ICF International.
Power & Natural Gas Planning Taskforce Informational Brief
 Power & Natural Gas Planning Taskforce Informational Brief Gas Scheduling in the Northwest As the Northwest electric system becomes increasingly dependent on natural gas, it is important to understand
An INDEPENDENT energy consulting company since 1996 No affiliation with any marketer, broker, agent, utility, pipeline or producer.
 An INDEPENDENT energy consulting company since 1996 No affiliation with any marketer, broker, agent, utility, pipeline or producer. More than two decades of experience in the natural gas and electric industries
Forecasts and Assumptions for IRP. Prepared for PNM September 2016
 Forecasts and Assumptions for IRP Prepared for PNM September 2016 Answers for infrastructure and cities. Pace Global Disclaimer This Report was produced by Pace Global, a Siemens business ( Pace Global
The Implications of Lower Natural Gas Prices for the Electric Generation Mix in the Southeast 1
 Highlights May 2009 Short Term Energy Outlook Supplement: The Implications of Lower Natural Gas Prices for the Electric Generation Mix in the Southeast 1 This supplement to the Energy Information Administration
November 6, SUBJECT: Update on the Natural Gas Pipeline Rupture in British Columbia
 James Yost Chair Idaho W. Bill Booth Idaho Guy Norman Washington Tom Karier Washington Jennifer Anders Vice Chair Montana Tim Baker Montana Ted Ferrioli Oregon Richard Devlin Oregon November 6, 2018 MEMORANDUM
MARKET COMMENTARY. Energy and Sustainability Solutions Energy Market Roundup. North America. November 20, 2014 MARKET FUNDAMENTALS OIL PRICE UPDATE
 PRICING As unseasonably cold weather and early season snowstorms have blanketed much of the Midwest and Northeast, and natural gas market volatility has reacted predictably. Volatility in the prompt month
NYMEX - Annual Strips
 Weekly Summary: The US EIA came in with a withdrawal of 34 Bcf in their report on Thursday. It was below expectations of 38-42 Bcf and extremely below the 5 year average of 120 Bcf. Last year this week
Analysis of California Natural Gas Market, Supply Infrastructure, Regulatory Implications, and Future Market Conditions. CIEE Subcontract No.
 Analysis of California Natural Gas Market, Supply Infrastructure, Regulatory Implications, and Future Market Conditions CIEE Subcontract No. MNG-07 07-0101 Natural Gas Storage Forum: Modeling of Natural
NYMEX - Annual Strips
 Weekly Summary: The U.S. Energy Information Administration reported that natural gas storage fell by 48 billion cubic feet this week, higher than the expected reduction of 39 Bcf but considerably lower
Virtual Workshop on PJM ARR and FTR Market 2017/2018
 Virtual Workshop on PJM ARR and FTR Market 2017/2018 PJM State & Member Training Dept. Webex February 10, 2017 PJM 2017 Disclaimer: PJM has made all efforts possible to accurately document all information
2012 NATURAL GAS MARKET OUTLOOK
 2012 NATURAL GAS MARKET OUTLOOK Marjorie Schmidt-Pines, Principal Regulatory Economic Advisor Southern California Gas Company and SDG&E Regulatory Affairs January, 2012 This information is provided solely
2011 IRP Public Input Meeting. December 15, Pacific Power Rocky Mountain Power PacifiCorp Energy
 2011 IRP Public Input Meeting December 15, 2010 Pacific Power Rocky Mountain Power PacifiCorp Energy Agenda 2011 IRP schedule update and next steps Resource portfolio development status Supply Side Resources
Why Is Natural Gas Demand Growing? James Osten Principal, Global Insight
 Why Is Natural Gas Demand Growing? James Osten Principal, Global Insight The U.S. Gas Market Survives Recession High natural gas prices, but much higher oil prices Interfuel substitution: Industry is still
Energy Trust Electric and Gas Avoided Cost Update for Oregon for 2018 Measure and Program Planning
 Energy Trust Electric and Gas Avoided Cost Update for Oregon for 2018 Measure and Program Planning August 8, 2017 Energy Trust s estimates of future electric and gas avoided costs are critical assumptions
2011 Integrated Resource Plan
 2011 Integrated Resource Plan Portfolio Evaluation Results Preferred Portfolio Selection February 14, 2011 Pacific Power Rocky Mountain Power PacifiCorp Energy Recap of Portfolio Resource Differences,
The Front Lines of Industrial Energy Management
 The Front Lines of Industrial Energy Management Presented by: Marcus Wilcox, President, P.E. Introduction to Cascade Energy Offices in Oregon, Utah, and Washington Staff of 50 (incl. 35 Engineers) Industrial
Ten Years After Gas & Power in Perspective
 Regional Market Trends Forum Ten Years After Gas & Power in Perspective Richard Levitan, rll@levitan.com May 1, 2014 Agenda 2014 Polar Vortex v. 2004 Cold Snap Northeast Gas & Power 10 Years After Gas
SECTION 8. RISK MANAGEMENT AND MITIGATION
 argue strongly for a systematic purchasing approach such as NWE describes below in its hedging proposals). Actual resource acquisition decisions, while utilizing some perspectives from long-term forecasts,
Plugging Into Natural Gas
 Pacific Northwest Natural Gas System Plugging Into Natural Gas Clay Riding Director, Natural Gas Resources January 25, 2012 Pacific Northwest t Regional Infrastructure t Station 2 Malin Sumas Stanfield
Regional Resource Adequacy Stakeholder Meeting on Straw Proposal
 Regional Resource Adequacy Stakeholder Meeting on Straw Proposal Folsom, CA March 2, 2016 Chris Devon Senior Infrastructure Policy Developer Acronyms BAA Balancing Authority Area CEC California Energy
CHP Managing Commodity Price Risk
 An Introduction to Combined Heat and Power CHP 100 1 Acknowledgements 2 Overview! High and Volatile Natural Gas Prices do not preclude a good CHP project! Managing Commodity Price Risk must be Part of
2009 Integrated Resource Plan. PNUCC Board of Directors Meeting. January 7, Copyright 2010 Portland General Electric. All Rights Reserved.
 2009 Integrated Resource Plan PNUCC Board of Directors Meeting January 7, 2011 1 Copyright 2010 Portland General Electric. All Rights Reserved. IRP Public Process 2 2009 IRP / Boardman Public Process:
NW Natural s 2016 IRP
 NW Natural s 2016 IRP Forward-looking Statements This presentation contains forward-looking statements. Forward-looking statements include statements concerning plans, objectives, goals, strategies, future
ENERGY SERVICES DEPARTMENT 2016 ANNUAL REPORT
 ENERGY SERVICES DEPARTMENT 2016 ANNUAL REPORT SALES STATISTICS ENERGY EFFICIENCY & CONSERVATION STRATEGY TIER 2 POWER SUPPLY DECISION BPA ENERGY CONSERVATION PROGRAM RENEWABLE ENERGY PARK NATURAL GAS MARKETING
Integrated Resource Planning at Tacoma Power. Ahlmahz Negash EE 500E Energy & Environment Seminar University of Washington
 Integrated Resource Planning at Tacoma Power Ahlmahz Negash EE 500E Energy & Environment Seminar University of Washington 11-8-2018 About Tacoma Public Utilities Public, cost-of-service organization; we
ENERGY MARKET UPDATE October 9, 2014
 ENERGY MARKET UPDATE October 9, 2014 Winter is Right Around the Corner Are You Ready? Six months ago one of the most brutal winters on record in the US was winding down. Many energy consumers, who had
EIA Short-Term Energy and Winter Fuels Outlook
 EIA Short-Term Energy and Winter Fuels Outlook NASEO 2015 Winter Energy Outlook Conference Washington, DC by Howard Gruenspecht, Deputy Administrator U.S. Energy Information Administration Independent
Labor to NonLabor and Overheads Ratio Labor NonLabor Ratio Overheads Ratio Except Gas Acq an $633,144 $59,113 $405,663 Law 9.34% 64.
 Brokerage Fee Summary TCAP Gas Purchases Current Brokerage Fee 0.148 cents per therm SoCalGas 2013-15 Core (MTherms) 3,646,701 SDG&E 2013-15 Core (MTherms) 502,042 Proposed Brokerage Fee (SoCalGas+SDG&E)
Appendix F. Capacity Requirements & Peak Day Planning OR IRP Final
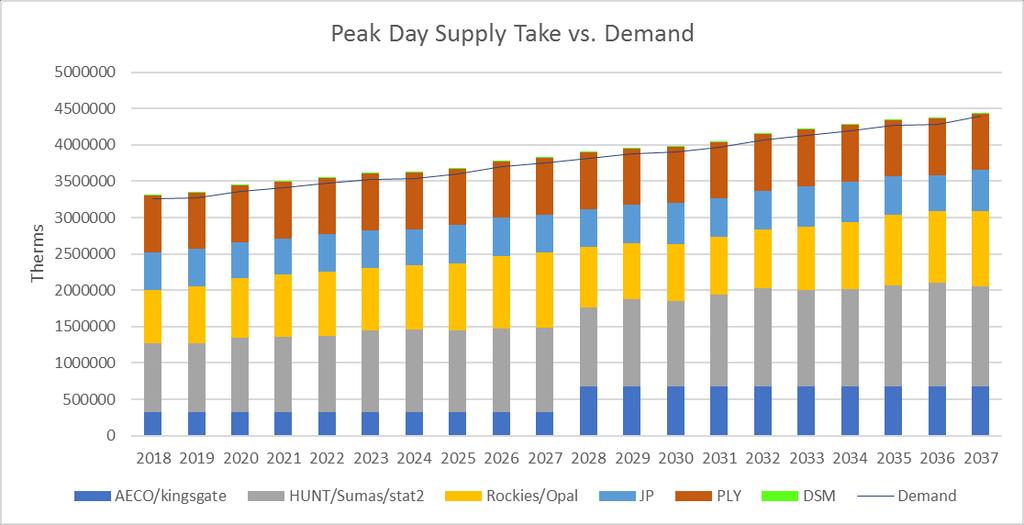
 Capacity Requirements & Peak Day Planning 2018 OR IRP Final Page 2 Capacity Requirements & Peak Day Planning Introduction The purpose of this document is to illustrate the flexibility of Cascade s system,
PECO Gas Supply Winter Planning. Page 1
 PECO Gas Supply Winter Planning Page 1 Topics PECO s Winter Supply Planning Supply Portfolio Winter Pricing Predictions Supply Picture Capacity Availability Damage Prevention Page 2 PECO s s Winter Gas
Markets and Opportunities. Paul Burgener March 2015
 Markets and Opportunities Paul Burgener March 2015 Disclaimer Copyright BP Energy Company. All rights reserved. Contents of this presentation do not necessarily reflect the Company s views. This presentation
Energy Uplift (Operating Reserves)
") Section 4 Energy Uplift Energy Uplift (Operating Reserves) Energy uplift is paid to market participants under specified conditions in order to ensure that resources are not required to operate for the
Section 4 Energy Uplift Energy Uplift (Operating Reserves) Energy uplift is paid to market participants under specified conditions in order to ensure that resources are not required to operate for the
Pennsylvania Public Utility Commission Annual Winter Reliability Assessment Meeting
 Pennsylvania Public Utility Commission Annual Winter Reliability Assessment Meeting Energy Association of Pennsylvania November 4, 2010 Terrance J. Fitzpatrick President & CEO SUPPLY Winter 2010-2011 (all
Program schedule. 6:00 pm Welcome and introductions 6:10 pm Presentations 7:10 pm Break (5 minutes) 7:15 pm Panel discussion 7:45 pm End
 7:15 pm Panel discussion 7:45 pm End") Program schedule 6:00 pm Welcome and introductions 6:10 pm Presentations 7:10 pm Break (5 minutes) 7:15 pm Panel discussion 7:45 pm End Tonight s speakers Joel Baker, Ph.D. Professor, University of Washington
Program schedule 6:00 pm Welcome and introductions 6:10 pm Presentations 7:10 pm Break (5 minutes) 7:15 pm Panel discussion 7:45 pm End Tonight s speakers Joel Baker, Ph.D. Professor, University of Washington
Integrated Resource Plan
 2011 Integrated Resource Plan Addendum Let s turn the answers on. June 27, 2011 For more information, contact: PacifiCorp IRP Resource Planning 825 N.E. Multnomah, Suite 600 Portland, Oregon 97232 (503)
November 9, 2011 Harrisburg, PA
 Pennsylvania Public Utility Commission Annual Winter Reliability Assessment Meeting Remarks by Terrance J. Fitzpatrick President & Chief Executive Officer Energy Association of Pennsylvania November 9,
OVERVIEW OF DESERT SOUTHWEST POWER MARKET AND ECONOMIC ASSESSMENT OF THE NAVAJO GENERATING STATION
 OVERVIEW OF DESERT SOUTHWEST POWER MARKET AND ECONOMIC ASSESSMENT OF THE NAVAJO GENERATING STATION ARIZONA CORPORATION COMMISSION APRIL 6, 2017 DALE PROBASCO MANAGING DIRECTOR ROGER SCHIFFMAN DIRECTOR
2005 North American Natural Gas Outlook Client Presentation
 2005 North American Natural Gas Outlook Client Presentation January 17, 2005 Ron Denhardt Vice President, Natural Gas Services Strategic Energy & Economic Research Inc. 781 756 0550 (Tel) Copyright 2004
ASSESSMENT OF NATURAL GAS COMMODITY OPTIONS FOR CENTRA MANITOBA
 ASSESSMENT OF NATURAL GAS COMMODITY OPTIONS FOR CENTRA MANITOBA Prepared for: CENTRA MANITOBA FINAL REPORT Submitted By: ENERGY AND ENVIRONMENTAL ANALYSIS, INC. 1655 N. Fort Myer Drive, Suite 600 Arlington,
Concepts for Behind-the- Meter Net Generation
 Concepts for Behind-the- Meter Net Generation Pradip Ganesan Donna Pratt New York Independent System Operator Joint Meeting of Installed Capacity, Market Issues and Price Responsive Load Working Groups
April 30, 2013 MEMORANDUM. Council Members. Gillian Charles, Power Planning Division. Update on the Region s Wind Development
 Bill Bradbury Chair Oregon Henry Lorenzen Oregon W. Bill Booth Idaho James A. Yost Idaho Jennifer Anders Vice Chair Montana Pat Smith Montana Tom Karier Washington Phil Rockefeller Washington April 30,
ONTARIO ENERGY REPORT Q1 2015
 ONTARIO ENERGY REPORT Q1 JAN MAR OIL AND NATURAL GAS Regular Gasoline and Diesel Provincial Retail Prices ($/L) Natural Gas Effective Prices ( /m 3 ) Regular Gasoline $0.99 Diesel $1.14 Source: Ministry
Short-Term Energy Outlook and Winter Fuels Outlook
 Short-Term Energy Outlook and Winter Fuels Outlook For NASEO Winter Fuels Outlook Conference Washington, DC By Adam Sieminski, Administrator U.S. Energy Information Administration Independent Statistics
Wyoming Pipelines - The Territory Ahead October 31, 2008 October 15, 2013
 Wyoming Pipelines - The Territory Ahead October 31, 2008 October 15, 2013 1 $ per MMBtu Representative Wyoming Natural Gas Price by Month 10.00 9.00 8.00 7.00 6.00 5.00 4.00 3.00 2.00 1.00 0.00 Jan Feb
Presentation for the Local Government Commission and the Community Environmental Council. July 13, 2007
 Community Choice Aggregation Presentation for the Local Government Commission and the Community Environmental Council July 13, 2007 1 Community Choice Aggregation (CCA) CCA Legislation (AB117) allows cities
California ISO. Q Report on Market Issues and Performance. November 1, Department of Market Monitoring
 California Independent System Operator Corporation California ISO Q3 2018 Report on Market Issues and Performance November 1, 2018 Department of Market Monitoring TABLE OF CONTENTS Executive summary...
Garth Johnson Vice President, Pipeline & Strategic Development
 NORTHWEST GAS ASSOCIATION & PACIFIC NORTHWEST UTILITIES CONFERENCE COMMITTEE Pipeline Briefing April 11, 014 Garth Johnson Vice President, Pipeline & Strategic Development SafeHarbor Statement Some of
EIA Short-Term Energy and
 EIA Short-Term Energy and Winter Fuels Outlook Washington, DC U.S. Energy Information Administration Independent Statistics & Analysis www.eia.gov Overview EIA expects higher average fuel bills this winter
ERCOT Public LTRA Probabilistic Reliability Assessment. Final Report
 ERCOT Public 2016 LTRA Probabilistic Reliability Assessment Final Report November 21, 2016 Contents Summary... 1 Software Model Description... 3 Demand Modeling... 3 Controllable Capacity Demand Response
October 23, 2018 Harrisburg, PA
 Pennsylvania Public Utility Commission Annual Winter Reliability Assessment Terrance J. Fitzpatrick President & Chief Executive Officer Energy Association of Pennsylvania October 23, 2018 Harrisburg, PA
olumbia River Treaty The Columbia by Steve Oliver, Vice President, Generation Asset Management, Bonneville Power Administration 16 Oct
 The Columbia by Steve Oliver, Vice President, Generation Asset Management, Bonneville Power Administration 16 Oct 2006 1 Presentation Outline Geography of the Pacific Northwest Bonneville Power Administration
Platts Natural Gas Storage Conference. January 2012
 Platts Natural Gas Storage Conference January 2012 Changing Storage Landscape Tremendous development and expansion in last 10 years has created excess capacity in the Natural Gas Storage Sector Majority
Draft 2011 Long-term Transmission Plan. Stakeholder Session June 20, 2011
 Draft 2011 Long-term Transmission Plan Stakeholder Session June 20, 2011 Agenda Highlights of draft 2011 Long-term Transmission Plan Discussion of project costs and rate impact Impact of transmission constraints
California ISO. Q Report on Market Issues and Performance. February 10, Prepared by: Department of Market Monitoring
 California Independent System Operator Corporation California ISO Q4 2013 Report on Market Issues and Performance February 10, 2014 Prepared by: Department of Market Monitoring Department of Market Monitoring
Albany, NY December 1, Natural Gas Outlook. Presentation to: Northeast Power Coordinating Council (NPCC) General Meeting
 General Meeting") Albany, NY December 1, 2010 Natural Gas Outlook Presentation to: Northeast Power Coordinating Council (NPCC) General Meeting Stephen Leahy Northeast Gas Association Topics Gas Market Conditions Gas Supply
Albany, NY December 1, 2010 Natural Gas Outlook Presentation to: Northeast Power Coordinating Council (NPCC) General Meeting Stephen Leahy Northeast Gas Association Topics Gas Market Conditions Gas Supply
Hetch Hetchy Integrated Resource Plan Commission Meeting May 23, 2017
 Hetch Hetchy Integrated Resource Plan Commission Meeting May 23, 2017 Today s Presentation 1. Introduction to IRP 2. IRP Applied to Hetch Hetchy Program 3. IRP Approach 4. IRP Results 5. Discussion SFPUC
PNM Integrated Resource Plan SEPTEMBER 2013
 PNM 2014-2033 Integrated Resource Plan SEPTEMBER 20, 2013 SEPTEMBER 2013 Pat O Connell PNM Director, Planning and Resources SLIDE 2 SEPTEMBER 2013 AGENDA TODAY AND SEPTEMBER 26 TH Friday, September 20
Final Flexible Capacity Needs Assessment for 2019
 Final Flexible Capacity Needs Assessment for 2019 May 21, 2018 1 Table of Contents 1. Introduction... 3 2. Summary... 3 3. Defining the ISO System-Wide Flexible Capacity Need... 4 4. Forecasting Minute-by-Minute
Questar Pipeline Current Capacity and Development
 Questar Pipeline Current Capacity and Development Gary A. Schmitt Manager, Marketing and Business Development April 27, 2007 Platts Rockies Gas and Oil Conference 1 Agenda Questar Pipeline Overview Basin
U.S. Historical and Projected Shale Gas Production
 U.S. Historical and Projected Shale Gas Production Phyllis Martin Phyllis Martin, Senior Energy Analyst Office of Petroleum, Gas and Biofuels Analysis U.S. Energy Information Administration phyllis.martin@eia.doe.gov
Expanding Existing Pipeline Capacity to Meet New England s Energy Needs. Mike Dirrane Director, Marketing
 Expanding Existing Pipeline Capacity to Meet New England s Energy Needs Mike Dirrane Director, Marketing January 27, 2015 Spectra Energy s Portfolio of Assets Based in Houston, TX with operations in 30
RESOURCE PLAN DECISIONS
 RESOURCE PLAN DECISIONS Contents: 2-2. ELECTRIC RESOURCE PLAN Capacity Planning Standard Update Regional Resource Configuration Assumptions Resource Additions Summary Electric Results across Scenarios
Residential Energy Consumption: Longer Term Response to Climate Change
 24 th USAEE/IAEE North American Conference July 8-10, 2004, Washington, DC Residential Energy Consumption: Longer Term Response to Climate Change Christian Crowley and Frederick L. Joutz GWU Department
Portland General Electric 2016 Integrated Resource Plan. OPUC Public Meeting December 20, 2016
 Portland General Electric 2016 Integrated Resource Plan OPUC Public Meeting December 20, 2016 Agenda Process and Compliance Approach and Summary Analysis Action Plan Next steps 2 2013 IRP Order Resource
The Impact of Recent Hurricanes on U.S. Gas Markets for the Upcoming Winter
 The Impact of Recent Hurricanes on U.S. Gas Markets for the Upcoming Winter A Study Performed For INGAA by Energy and Environmental Analysis, Inc. Background In early October 2005, INGAA contracted with
Energy Market Outlook
 Kyle Cooper, (713) 248-3009, Kyle.Cooper@iafadvisors.com Week Ending September 7, 2018 Please contact me to review a joint RBN Energy daily publication detailing natural gas fundamentals. Price Action:
Final Flexible Capacity Needs Assessment for 2016
 Final Flexible Capacity Needs Assessment for 2016 May 1, 2015 1 Table of Contents 1. Introduction... 3 2. Summary... 3 3. Defining the ISO System-Wide Flexible Capacity Need... 5 4. Forecasting Minute-by-Minute
CenterPoint Energy Services. Current Market Fundamentals June 27, 2013
 CenterPoint Energy Services Current Market Fundamentals June 27, 2013 CenterPoint Energy is one of the largest combined electric and natural gas delivery companies in the U.S. Asset portfolio CNP Footprint
Meeting Natural Gas Demand Demand Response A New England Perspective
 Meeting Natural Gas Demand Demand Response A New England Perspective W. Robert Keating, Commissioner, Massachusetts 7 th EU-US Energy Regulators Roundtable Nov. 14-16, 2008, New Orleans, LA, USA Canada
June 5, 2018 MEMORANDUM. Council Members. John Fazio, Senior Systems Analyst. SUBJECT: Briefing on Adequacy Analysis and Report BACKGROUND:
 James Yost Chair Idaho W. Bill Booth Idaho Guy Norman Washington Tom Karier Washington Jennifer Anders Vice Chair Montana Tim Baker Montana Ted Ferrioli Oregon Richard Devlin Oregon June 5, 208 MEMORANDUM
Energy Market Outlook
 Kyle Cooper, (713) 248-3009, Kyle.Cooper@iafadvisors.com Week Ending September 14, 2018 Please contact me to review a joint RBN Energy daily publication detailing natural gas fundamentals. Price Action:
Outlook for Natural Gas Demand for Winter
 Outlook for Natural Gas Demand for 2010-2011 Winter Energy Ventures Analysis, Inc. (EVA) Overview Natural gas demand this winter is projected to be about 295 BCF, or 2.5 percent, above demand levels recorded