STATE OF COLORADO DEPARTMENT OF NATURAL RESOURCES DIVISION OF WATER RESOURCES GUIDELINES FOR DAM BREACH ANALYSIS
|
|
|
- Elfrieda Jefferson
- 6 years ago
- Views:
Transcription


 866-3581 1313")

1 STATE OF COLORADO DEPARTMENT OF NATURAL RESOURCES DIVISION OF WATER RESOURCES OFFICE OF THE STATE ENGINEER DAM SAFETY BRANCH GUIDELINES FOR DAM BREACH ANALYSIS February 10, 2010 Telephone (303) Sherman Street Room 818 Centennial Building Denver, Colorado Website:
2
3 Guidelines for Dam Breach Analysis February 10, 2010 Table of Contents List of Variables... ii 1.0 Introduction Purpose and Scope Colorado Dam Breach Analysis Requirements Dam Breach Mechanisms Failure of Rigid Dam Structures Overtopping Failure of Earthen Dams Piping and Internal Erosion of Earthen Dams A Brief History of Dam Breach Analysis Dam Breach Analysis Tools Comparative Analysis Empirical Methods Physically-Based Models Parametric Models Hydrologic Models Hydraulic Models A Tiered Dam Breach Analysis Structure Screening Simple Intermediate Advanced Recommendations for Dam Breach Analysis Breach Parameter Estimation Empirical Methods Piping Failure Considerations with Empirical Methods Spreadsheets Physically Based Models Breach Peak Discharge Estimation Empirical Methods Parametric Models Hydrologic Models Hydraulic Models Parameters Common to Hydraulic and Hydrologic Models Orifice Coefficients (C p ) Weir Coefficients (C w ) Breach Progressions Breach Flood Routing Hydraulics at Critical Locations Limitations Annotated Bibliography List of Appendices Case Study Inventory... A HEC-RAS Example Upstream Storage Area Connected to a Channel with a Dam that Fails... B i
4 February 10, 2010 Guidelines for Dam Breach Analysis List of Variables (See Figures 1&2) H b = Height of breach in feet, which is the vertical distance between the dam crest and breach invert. H w = Maximum depth of water stored behind the breach in feet (usually depth from emergency spillway crest down to breach invert for a full, fair-weather breach) V w = Reservoir volume stored corresponding to H w in acre-feet (AF) BFF (Breach Formation Factor) = H w V w in acre-feet 2 used for MacDonald & Langridge-Monopolis and Washington State methods only. V er = Volume of dam eroded in cubic yards during a breach. Used for MacDonald & Langridge- Monopolis and Washington State methods only. This is the same as B avg W avg for a full breach or D 2 L for a piping only failure (variables defined below). B avg = Average breach width in feet. For a trapezoidal section, this is the width of the breach at the mid-point, H b /2. Z b = Side slopes of breach (Z b Horizontal: 1 Vertical). Z d = slopes of downstream face of the embankment (Z d Horizontal: 1 Vertical). Z u = slope of the upstream face of the embankment (Z u Horizontal: 1 Vertical). Z t = sum of the upstream and downstream embankment slopes, Z u + Z d B b = breach bottom width in feet: B avg H b Z b W avg = Average width of dam in direction of flow (feet). This is the width at the mid-point of H b : T f = breach development time in hours. C = width of the dam crest in feet. g = acceleration due to gravity, which equals 32.2 feet/sec 2 SI= Storage Intensity = V w /H w acre-feet/foot ER = Erosion Rate = B avg /T f feet/hour L = Length of piping hole, feet D = Piping hole height/width (assumed square), feet H p = Height from center of piping hole to dam crest = A s = Surface area of reservoir (acres) at reservoir level corresponding to H w Q = Discharge in cfs Q p = Peak dam break discharge at the dam in cfs Q r = Routed peak discharge in cfs at a certain distance, X, downstream of the dam X = Distance downstream from the dam along the floodplain in miles D 50 = Mean soil particle diameter in millimeters A = Area of the piping hole in square feet: D 2 C p = Piping orifice coefficient C w = Weir coefficient f = Darcy friction factor γ = Instantaneous flow reduction factor = 23.4 A s /B avg K o = Froehlich Failure Mode Factor ii
5 Guidelines for Dam Breach Analysis February 10, 2010 B avg C H b /2 1 Z b H b /2 H w 1 Z u Z d 1 W avg B b Figure 1- Breach Variable Definition Sketch C D D Z H Z d u p 1 1 L Figure 2 Piping Hole Variable Definition Sketch iii
6
7 Guidelines for Dam Breach Analysis February 10, Introduction Simulation of embankment dam breach events and their resulting floods are crucial to characterizing and identifying threats due to potential dam failures. Characterization of the threat to public safety that a dam poses establishes the Hazard Classification of the dam and the associated standard of care to which the dam is held. Among other design parameters, the Hazard Classification of a dam determines the inflow design flood (IDF), which is the basis for spillway sizing. The Hazard Classification also triggers the requirement to prepare an Emergency Action Plan, requiring preparation of inundation maps which accurately predict dam breach flood depths and arrival times at critical locations. When population centers and associated critical sections are located well downstream of a dam, details of the breaching process and the calculated peak discharge may have little effect on the results. In this case, travel time, attenuation, and other routing effects tend to predominate. However, in a growing number of cases, the location of population centers near a dam makes accurate prediction of breach parameters (e.g. breach width, depth, rate of development) crucial to the analysis. If breach parameters cannot be predicted with reasonable accuracy, more conservative assumptions and associated increased costs may be required (from Wahl, 1997). A recent query of the dam safety engineers within the Colorado Dam Safety Branch (Branch) determined that there is currently no consensus nor up-to-date guidance regarding the state-of-the-practice procedures for performing dam breach analyses. A committee of dam safety engineers from within the Branch was therefore assembled to perform a literature review of the current state-of-the-practice, research available methods, and develop a guidance document for use within the Branch and for engineers working on dam safety issues in Colorado. This document was prepared by Colorado dam safety engineers Jeremy Franz, John G. Blair, Matt Gavin and Bill McCormick of the Greeley, Glenwood Springs, Durango and Colorado Springs Offices of the State Engineer, respectively, under the direct supervision of Mark Haynes, Chief, Colorado Safety of Dams Program. 2.0 Purpose and Scope The purpose of this guidance document is to develop a generalized approach for breach analysis to establish consistency throughout the Branch. The procedures and analytical models described herein are intended to serve as a dam breach toolbox. It remains incumbent on the engineer to select the appropriate level and type of analysis based on sound engineering judgment. It is further acknowledged that the development of dam breach analysis techniques is rapidly evolving, and that the recommendations herein are not an exhaustive account of the means and methods available to engineers working in this field. The methodologies described in these guidelines are intended to establish consistency in the analysis and review of dam safety projects in Colorado. The software recommendations are limited to those programs available within the public domain, currently supported and upgraded and widely available to dam safety engineers. Other software not described is available to perform similar analyses. The use of software not described in these guidelines is not prohibited, provided similar results and conclusions can be obtained and verified. This may require the use of an independent third party review if the specific software is not available to the Dam Safety Branch. 1
8 February 10, 2010 Guidelines for Dam Breach Analysis 2.1 Colorado Dam Breach Analysis Requirements Requirements for dam breach analyses are contained in the State of Colorado Rules and Regulations for Dam Safety and Dam Construction (Rules). Specifically, the applicable rules are: Rule 4 Definitions, Rule Hazard Classification Report, and Rule Inundation Mapping. For clarity, pertinent sections of the Rules are contained below. Rule 4 - Definitions "Dam" means a man-made barrier, together with appurtenant structures, constructed above the natural surface of the ground for the purpose of impounding water. Flood control and storm runoff detention dams are included "Jurisdictional Size Dam" is a dam creating a reservoir with a capacity of more than 100 acre-feet, or creates a reservoir with a surface area in excess of 20 acres at the high-water line, or exceeds 10 feet in height measured vertically from the elevation of the lowest point of the natural surface of the ground where that point occurs along the longitudinal centerline of the dam up to the crest of the emergency spillway of the dam. For reservoirs created by excavation, or where the invert of the outlet conduit is placed below the surface of the natural ground at its lowest point beneath the dam, the jurisdictional height shall be measured from the invert of the outlet at the longitudinal centerline of the embankment or from the bottom of the excavation at the longitudinal centerline of the dam, which ever is greatest. Jurisdictional height is defined in Rule The State Engineer shall have final authority over determination of the jurisdictional height of the dam "Non-jurisdictional Size Dam" is a dam creating a reservoir with a capacity of 100 acrefeet or less and a surface area of 20 acres or less and with a height measured as defined in Rules and of 10 feet or less. Non-jurisdictional size dams are regulated and subject to the authority of the State Engineer consistent with sections and C.R.S "Minor Dam" is a jurisdictional size dam that does not exceed 20 feet in jurisdictional height and/or 100 acre feet in capacity (see Figure 1) "Small Dam" is a dam with a jurisdictional height greater than 20 feet but less than or equal to 50 feet and/or a reservoir capacity greater than 100 acre-feet, but less than 4,000 acrefeet (see Figure 1) "Large Dam" is a dam greater than 50 feet in jurisdictional height, and/or greater than 4,000 acre-feet in capacity (see Figure 1). 2

9 Guidelines for Dam Breach Analysis February 10, 2010 Figure 3- Dam Size Determination "Diversion Dam" is a dam constructed for the purpose of diverting water from a natural watercourse into a canal, tunnel, ditch, or pipeline that typically impounds an insignificant volume of water, and for which the impacts of failure are not a significant public safety hazard "Flood Control Dam" is a special purpose dam that is normally dry and has an un-gated outlet structure for the controlled release of water impounded during and subsequent to a flood event. The jurisdictional size and classification of the dam are determined using the height and capacity of the reservoir to the emergency spillway elevation, or using the elevation of the maximum routed water surface elevation if no emergency spillway is provided "Dam Failure Inundation Map" is a map depicting the area downstream from a dam that would reasonably be expected to be flooded in the event of a failure of the dam Hazard Classification of a Dam" is the placement of a dam into one of four categories based on the hazard potential derived from an evaluation of the probable incremental adverse consequences due to failure or improper operation of the dam. Conditions for evaluation are absent flooding, and the reservoir is assumed to be full to the high water line. The hazard potential classification does not reflect the current condition of the dam with regard to safety, structural integrity, or flood routing capacity. (See Rule 5.4, Hazard Classification Study, for a more detailed description of determining which hazard category a given dam shall be placed.) The Hazard Classification evaluation method must be approved by the State Engineer "High Hazard Dam" is a dam for which loss of human life is expected to result from failure of the dam. Designated recreational sites located downstream within the bounds of possible inundation should also be evaluated for potential loss of human life "Significant Hazard Dam" is a dam for which significant damage is expected to occur, but no loss of human life is expected from failure of the dam. Significant damage is defined as damage to structures where people generally live, work, or recreate, or public or private facilities. Significant damage is determined to be damage sufficient to render structures or facilities uninhabitable or inoperable. 3
10 February 10, 2010 Guidelines for Dam Breach Analysis "Low Hazard Dam" is a dam for which loss of human life is not expected, and significant damage to structures and public facilities as defined for a "Significant Hazard" dam is not expected to result from failure of the dam "No Public Hazard (NPH) Dam" is a dam for which no loss of human life is expected, and which damage only to the dam owner's property will result from failure of the dam. Rule 5 Requirements for Construction or Enlargement of Jurisdictional Size Dams or Reservoirs Hazard Classification Report - The hazard classification report shall identify the size and hazard classification category for the proposed dam, or enlarged existing dam. A report is not required for dams that are declared as High Hazard; however, a dam failure inundation map will be required for the Emergency Action Plan pursuant to Rule 16. The report shall include sufficient information regarding assumptions, calculations and data used to develop the dam failure flood hydrograph and an assessment of the impact of the dam failure upon the downstream floodplain. The dam shall be classified according to the definitions of Rule 4. The hazard classification report must be approved by the State Engineer, and shall be in a form that meets the State Engineer s requirements, including, but not be limited to: Dam failure inundation maps are required for all dams classified as High and Significant Hazard. Inundation maps are required for dams classified as Low Hazard unless the dam is located in a remote area where no development exists downstream of the dam; Cross-sections along the watercourse, drawn to scale, showing water surface elevations at critical locations where structures may be impacted by the flood wave. Cross-sections shall show discharge in cubic feet per second, average velocity in feet per second, and structures located in the flooded section. References to all computer programs, data sources and related documents used in the evaluation shall be included; and Supporting documentation and tabulation of assumed parameters, including Manning s n values for the stream channel and the floodplain shall be included. Rule 16 Emergency Action Plans (EAP) Inundation Mapping - A dam failure inundation map is required for High and Significant Hazard dams. The inundation maps should show the stream which will be flooded including urban and rural impacts. Inundation mapping for High and Significant Hazard dams shall contain the following minimum information: High Hazard Dams - Inundation mapping for High Hazard dams shall show the calculated extents of the dam breach flood wave. Include cross sections at critical locations showing lateral and vertical flood extents, flood wave velocity, and flood wave arrival time. Inundation mapping shall be extended downstream to a location where no potential for loss of life and/or no significant property damage exists Significant Hazard Dams - Inundation mapping for Significant Hazard dams shall show the route of the dam breach flood wave, the estimated time of arrival of the flood wave at critical sections and the estimated lateral extent of inundation. The inundation mapping shall be extended downstream to a location where no significant property damage exists. The inundation mapping requirements for Significant Hazard dams may be modified for good cause, with the approval of the State Engineer. 4
11 Guidelines for Dam Breach Analysis February 10, Dam Breach Mechanisms Breach forming mechanisms can be classified into two general categories: (1) Breaches formed by the sudden removal of all or a portion of the impounding structure as a result of some over-stressing of the structure, and (2) breaches formed by erosion of embankment material (MacDonald & Langridge- Monopolis, 1984). Mechanism (1) describes the possible breach of a concrete or other rigid type of dam. Mechanism (2) addresses overtopping and internal erosion failures of embankments. 3.1 Failure of Rigid Dam Structures The failure mode of rigid dams, such as those constructed from concrete or masonry materials, is generally characterized by some sudden structural failure (partial or complete) or catastrophic displacement of the structure. Failure modes include the following: Extreme loading conditions such as overtopping that lead to structural failure of the dam, foundation or abutments. Extreme loading that overloads a drainage system or outright drainage system failure leading to uplift and movement of the structure downstream. Excessive deformation of the structure due to settlement of foundation materials, or structural failure due to loss of support from the foundation or abutments. Breach analysis for rigid structures is generally straightforward. It typically involves the instantaneous removal of a portion of the structure, or, in some cases, the entire structure. Given the simplicity of this type of analysis, it is not specifically addressed in this guidance document. 3.2 Overtopping Failure of Earthen Dams Overtopping failures of earthen dams typically begin with headcutting at the downstream toe and advance upstream until the erosion reaches the dam crest and reservoir surface. A dam failure resulting from an embankment slide can also lead to an overtopping type of failure when the slide encroaches upon the high water line. Once the reservoir is connected to the progressing breach, downcutting of the embankment and lateral erosion occur until the breach expands to its final dimensions. The above process assumes a level dam crest. Uneven dam crest surfaces can result in concentration of flow and erosion of the crest itself, accelerating the process of connecting the reservoir to a progressing breach. 3.3 Piping and Internal Erosion of Earthen Dams The terms piping and internal erosion are often used synonymously. From a strict technical standpoint, McCook, (2004) defines piping as inter-granular seepage that occurs through a soil body which has no preferential flow paths. Piping is also sometimes referred to as backwards erosion piping because the erosion typically occurs from downstream to upstream (analogous to headcutting). McCook (2004) defines internal erosion as a result of water flowing through defects or cracks within a compacted fill, a foundation, or at a contact between a fill and foundation. Internal erosion occurs when the water flowing through the crack or defect erodes the soil from the walls of the crack or defect. If the eroding water has enough velocity to continue to erode the soil in contact with the crack, the crack will enlarge from the erosion. If left unchecked, both internal erosion and piping will progress until the flow path is large enough to empty the reservoir, sometimes in a breaching type event. Although it is acknowledged that the above technical differences exist between internal erosion and piping, for practical reasons the term piping failure will be utilized throughout these guidelines to refer to both. In this document, the 5
12 February 10, 2010 Guidelines for Dam Breach Analysis term piping failure is intended to mean the unchecked internal erosion process that leads to the development of a flow path large enough to result in a rapid discharge of the reservoir contents through the pipe and/or breach, regardless of failure mechanism. 4.0 A Brief History of Dam Breach Analysis Models for predicting the peak discharge from a dam breach have existed since the mid 1960 s. Cristofano (1965), a sediment transport specialist with the U.S. Bureau of Reclamation (USBR), estimated the breach erosion process using the angle of repose of a given soil as the primary input. Harris and Wagner (1967) utilized a parabolic dam breach shape along with assumptions regarding breach dimensions and sediment properties to predict breach flows. In the early 1980 s, computer programs were developed to analyze the dam breaching process. MacDonald & Langridge-Monopolis (1984) indicates that those programs were limited by the accuracy of the breach geometry and failure timing information that was typically used as input. MacDonald & Langridge-Monopolis (1984) performed the first systematic analysis of a database of 42 existing dam failures in order to establish empirical relationships relating reservoir/dam dimensions to breach width, timing and peak discharge. The MacDonald & Langridge-Monopolis equations and others like them are referred to as empirical methods in this document. Similar statistical (regression) analyses were performed by the USBR (1988), Von Thun and Gillette (1990), Dewey and Gillette (1993) and Froehlich (1995a, 1995b) to create their own empirical methods. Many of these studies utilized a common database of dam failures to produce empirical relationships for prediction of breach parameters including time to failure, average breach width, and breach side slope angles. A few empirical methods were also developed to predict breach peak discharge. One example of this is the equation developed for the National Weather Service (NWS) Simplified Dam Break Model (SMPDBK) (Wetmore and Fread, 1984). During the same time frame that empirical methods were being developed, the breach modeling process was also being advanced. Froehlich (1995b) describes two types of breach models: causal and empirical. Causal breach formation models are based on physical laws and empirical relations governing the flow of water and erosion of embankment materials, and are referred to as physically based models in this document. In the empirical approach as defined by Froehlich, breaches are allowed to form in a predetermined manner that is controlled by specified input parameters. Hence, they are referred to as parametric models in this document. These parametric models are easier to apply than physically-based models (Froehlich, 1995b). An example of a physically-based model is NWS BREACH. Examples of parametric models are the breach routines in the US Army Corps of Engineers HEC-1, HEC-HMS and HEC-RAS computer models and the NWS dam break modeling program DAMBRK (Fread, 1988a). Parametric models typically assume the breach process begins as a triangular or trapezoidal shape (cut) in the dam. As time progresses, the breach shape enlarges and extends until it reaches the user-defined final dimensions at the user-specified time. After about 1998, the dam breach regression analysis process had extracted about as much information as possible from a database that included up to a maximum of about 108 actual dam failures. Since that time analysis methods have changed to include more sophisticated multivariate regression analysis of the uncertainty of the parameter predictions provided by the various published equations. The more recent analyses led to further refinement of the Froehlich empirical method (Froehlich, 2008). In the same time frame, more full-scale, physically-based modeling of the dam breach process was being accomplished, including research at the Natural Resources Conservation Service (NRCS) laboratories in Oklahoma and sites in Norway (Vaskinn, 2004). It appears the future of dam breach analysis is being concentrated on improved physically-based modeling of the erosional processes of dam failures. Research is being concentrated toward defining the mathematics of those erosional processes for use in the next generation of numerical models. One quasi- 6
13 Guidelines for Dam Breach Analysis February 10, 2010 private group of dam owners has identified three such models for additional research and development (Wahl, 2008). The Dam Safety Interest Group (DSIG) of CEA Technologies, Inc. (CEATI) has identified SIMBA (NRCS), HR-BREACH (England) and FIREBIRD BREACH (Canada) as models that show promise toward making advances in physically-based numerical modeling of dam failures. The Hydrologic Engineering Center (HEC) of the US Army Corps of Engineers (USACE) is planning to incorporate at least one of these models into future releases of HEC-RAS (Gee, 2009). With these recent and ongoing developments, it is obvious that the state-of-the-art of breach modeling is rapidly changing and there is much about the process that is not fully understood. This underscores the importance of conservatism within any breach analysis. It also reinforces the need to stay abreast of the current research and update the conclusions and recommendations of this document as breach modeling continues to evolve. 5.0 Dam Breach Analysis Tools There are four critical elements of any breach analysis: 1) breach parameter estimation (breach size/shape and time of failure), 2) breach peak discharge and breach hydrograph estimation, 3) breach flood routing, and 4) estimation of the hydraulic conditions at critical locations. The most commonly used approaches for the required elements of the analysis are described briefly as follows. 5.1 Comparative Analysis Perhaps the simplest approach to dam breach flood estimation is comparative analysis. This method compares a given dam of interest with those in a database of well documented dam failure case histories. A given dam geometry, height, slope angles, and reservoir areas and volumes are compared with a list of similar sized dams that have failed. Dam breach parameters and peak discharges reported from the failure case histories of similarly configured dams are then directly applied to the dam being analyzed. 5.2 Empirical Methods Empirical methods are used to predict time to failure and breach geometry, as well as to predict peak breach discharges. The empirical approach relies on statistical analysis of data obtained from documented failures. The four most widely used and accepted empirically derived enveloping curves and/or equations for predicting breach parameters are: MacDonald & Langridge Monopolis (1984), USBR (1988), Von Thun and Gillette (1990), and Froehlich (1995a, 1995b, 2008). These methods have reasonably good correlation when comparing predicted values to actual observed values. The most basic statistical process generally involves plotting data for variables extracted from the dam failure dataset such as volume of embankment removed, volume of water released, height of water behind the dam, and development time of the failure. In some cases products of variables are used to define other factors such as the Breach Formation Factor (BFF). The variables and factors are then plotted against each other on log-log plots and least squares best-fit or envelope curves are developed. Since these curves are based on actual data, they can then be used for prediction of hypothetical dam breach cases. An example of an empirical method is the MacDonald & Langridge-Monopolis method (1984) which uses the reservoir volume and height of water behind the dam to estimate the embankment volume removed, the development time and the peak discharge of a breach. 7
14 February 10, 2010 Guidelines for Dam Breach Analysis 5.3 Physically-Based Models A physically-based model (also referred to as a process or causal model) utilizes generally accepted relationships based on physical principles to establish the framework of a model. The model then attempts to solve those relationships for a given input. This is a relatively simple concept, but it can become very complex when the input is changing with time. In the case of dam breach analysis, both the input and physical constraints are changing with time as the dam erodes and the reservoir evacuates. Although several physically-based models have been reported as being in the development stage for research purposes, the National Weather Service s BREACH program (NWS BREACH or BREACH) is currently the only widely available model. BREACH predicts the development of a breach and the resulting outflow using an erosion model based on principles of hydraulics, sediment transport and soil mechanics. It was initially developed in 1987, but has had several upgrades in 1988, 1991, and The model takes into account several components of a dam and reservoir that are not considered in the empirical methods, such as area versus elevation, dam dimensions, soil properties of the dam, and tailwater effects downstream. It is relatively simple to run and is widely used within the United States. Unfortunately, BREACH is no longer supported by the National Weather Service and significant advances in the understanding of the complex mechanics of a dam failure have not been incorporated (Wahl, 1998). Also, the model has only been calibrated with a very limited number of cases. 5.4 Parametric Models HEC-1, HEC-HMS and HEC-RAS are parametric computer models that estimate the peak discharge and breach hydrographs from dam breaches based on parameters (breach geometry and breach development time) provided by the user. They can also be used to calculate the flood routing of the hydrograph downstream, and, in the case of HEC-RAS, can be used to estimate the hydraulic conditions at critical downstream locations Hydrologic Models Hydrologic routing employs the continuity equation and an analytical or an empirical relationship between storage within the reach and discharge at the end (USACE, 1994). In the absence of significant backwater effects, the hydrologic routing models offer the advantages of simplicity, ease of use and computational efficiency (USACE, 1994). Hydrologic routing models provide attenuated flow hydrographs at locations of interest, but do not provide useful information on water surface elevations or flow velocities. HEC-1 and HEC-HMS are the most widely used hydrologic models for dam safety analysis, and both contain a parametric dam breach routine that calculates the breach hydrograph Hydraulic Models Hydraulic models, in general, are more physically based than hydrologic models since they only have one parameter (the roughness coefficient) to calibrate. The full unsteady flow equations have the capability to simulate the widest range of flow situations and channel characteristics. The basic data requirements for hydraulic routing techniques include: flow data, channel geometry, roughness coefficients, and internal boundary conditions. Hydraulic modeling is further subdivided into steady flow analysis and unsteady flow analysis. In unsteady flow, time dependent changes in flow rate are analyzed explicitly as a variable, while steady flow analysis models neglect time all together (USACE, 1993). Steady flow analysis can determine a water surface elevation and flow velocity at a given cross section for a given flow using Manning s equation under the assumption of gradually varied flow conditions. Unsteady flow analysis can be used to evaluate the downstream attenuation of the flood wave, providing a more accurate 8
15 Guidelines for Dam Breach Analysis February 10, 2010 estimate of flood magnitude and velocity at critical locations. HEC-RAS is the most widely used hydraulic model for dam safety analyses in the United States and can be utilized for steady and unsteady flow analyses. The latest versions of HEC-RAS (since version 3.0) have a parametric dam breach routine that can calculate a breach outflow hydrograph within an unsteady flow simulation. Another hydraulic model that has been widely used for unsteady flow analyses is the NWS DAMBRK model. The BOSS Corporation has added a graphical user interface while keeping the same numeric algorithm to make the model more user-friendly. This version is called BOSS DAMBRK. The model is based upon the same basic unsteady routing hydraulic principles as HEC-RAS, but DAMBRK was specifically developed for modeling dam failures. The cross-section input requirements for routing dam break floods require the same number of points to represent every cross section, which limits its usefulness. 6.0 A Tiered Dam Breach Analysis Structure Given the wide range of conditions that could exist at a dam and in its failure path, and the modeling options available, there are many choices to be made while performing a dam breach analysis for a hazard classification study or to develop inundation maps for emergency preparedness documents. Because dam breach analyses will not always require the most sophisticated tools available, a tiered approach is recommended. The tiered approach matches the appropriate level of analysis with a given situation. The goal is to make the most efficient use of time and available tools while producing results that are appropriately conservative. Table 1 shows a matrix of the tiered dam breach analysis structure. As shown, various tools can be utilized in part or all together, depending on the nature of the analysis that is required. Rows in the table represent the level of analysis and the columns represent a four-step breach analysis process. In general, as the level of analysis increases, so does the level of effort (time) needed to complete it. However, as the analysis increases in complexity, less conservative assumptions can be used, and the results are considered more accurate. 6.1 Screening Assuming that a presumptive determination (by inspection) of hazard classification is not practical, the first level of analysis is Screening. Screening is meant to be a cursory, yet conservative level of analysis that can be performed rapidly. The analysis ignores dam break hydrograph development. The breach parameters determined from empirical methods are calculated and used for input into the SMPDBK peak discharge equation, or an orifice equation assuming instantaneous piping hole formation. Empirical routing equations or nomographs can be used to estimate the attenuation of the flood wave downstream of the dam. One empirical routing equation was developed by the USBR in 1982 Guidelines for Defining Inundation Areas Downstream from Bureau of Reclamation Dams. This equation follows: Where: 10. X = distance in miles downstream of the dam measured along the flood plain. Q r = peak discharge in cfs corresponding to distance X. Q p = peak dam break discharge at the dam in cfs. 9
16 February 10, 2010 Guidelines for Dam Breach Analysis Level of Analysis Table 1 - Tiered Dam Breach Analysis Structure Breach Parameter Estimation (Size/Shape and Failure Time) Breach Hydrograph Estimation Breach Hydrograph Routing Hydraulics at Critical Section(s) Screening Empirical Equations Peak Breach Discharge from SMPDBK Empirical Routing Equations or Nomographs Normal Depth Simple Empirical Equations Parametric Model (HEC-1 or HEC-HMS) Hydrologic Model (HEC-1 or HEC-HMS) Steady-State Hydraulics (HEC-RAS) Intermediate Empirical Equations Parametric Model HEC-1 or HEC-HMS Unsteady Hydraulic Model (HEC-RAS) Peak Water Surface Profile (Unsteady HEC-RAS) Advanced Empirical Equations Parametric Model (HEC-RAS or DAMBRK) Unsteady Hydraulic Model (HEC-RAS) Peak Water Surface Profile (Unsteady HEC-RAS) The hydraulic conditions at critical locations downstream of the dam can usually be determined with normal depth calculations as long as steady, uniform flow is a valid assumption (i.e. no significant backwater effects in the vicinity of the section). Because the screening level of analysis is very conservative, it can be used to determine if further analysis is required. It is expected that, if the hydraulics calculated at critical locations indicate a specific hazard classification with a screening-level analysis, then more sophisticated analyses would not likely result in a higher hazard classification. So if a screening analysis indicates a Low Hazard, no further analysis is required. If the screening analysis indicates High or Significant Hazard, a more accurate, less conservative approach may show a lower hazard classification and additional analysis may be warranted to demonstrate this depending on the situation. Note that the screening level of analysis does not lead to inundation maps which are required for Significant and High Hazard dams. The minimum level of analysis required to develop inundations maps is the next level: Simple. 6.2 Simple The Simple level of analysis is slightly more sophisticated than the screening analysis. Results of the Simple level of analysis may provide the necessary conclusion, or may indicate that the intermediate or advanced approach is warranted. This analysis uses the recommended empirical methods to determine the breach parameters and then uses a hydrologic parametric model (HEC-HMS or HEC-1) to compute a breach hydrograph. The hydrologic tool can then be used to route the flood downstream to critical locations. At that point, a steady-state hydraulic model can be used to calculate the hydraulic conditions where required. 10
17 Guidelines for Dam Breach Analysis February 10, 2010 The Simple approach is considered moderately conservative. In most cases, it is not as conservative as the Screening level because the breach hydrograph typically has a smaller peak due to the parametric modeling of the breach formation, and the hydrologic routing typically results in flood wave attenuation by the time it reaches critical locations. A steady-state hydraulic model can then be used to accurately predict hydraulic conditions at critical locations. The results of the steady-state hydraulic model can be used to create inundation mapping for Emergency Action Plans. If this method results in a borderline situation, it may be necessary to employ a more advanced approach. 6.3 Intermediate The Intermediate approach lies between the simple approach and advanced approach in accuracy and sophistication. Similar to the simple approach, it uses empirical equations to determine the breach parameters (geometry and failure time). Those dimensions are then input into a hydrologic parametric model (HEC-HMS or HEC-1) to calculate the breach flood hydrograph which is then input into a hydraulic model (HEC-RAS) in an unsteady flow simulation to route the flood downstream and calculate the hydraulic conditions at critical locations. This approach may not be as accurate as the advanced approach for piping failures of smaller dams because the usage of HEC-1 and HEC-HMS to develop the dam break hydrographs may not model this process as accurately as HEC-RAS or DAMBRK. However, it may be just as accurate as the advanced approach for overtopping scenarios or for piping failures of larger dams. This approach is a viable option for developing flood inundation mapping for Emergency Action Plans. 6.4 Advanced The Advanced approach is the most rigorous level of analysis. Similar to the Simple approach, it uses empirical equations to determine the breach parameters (geometry and failure time). Those dimensions are then input into a hydraulic parametric model (HEC-RAS or DAMBRK) to calculate the breach flood For DAMBRK the hydrograph is then input into (HEC-RAS) in an unsteady flow simulation to route the flood downstream and calculate the hydraulic conditions at critical locations. For HEC-RAS, the dam failure simulation and downstream routing is performed in the same simulation. The increased accuracy of the Advanced approach comes at the expense of more time required to develop, debug and refine the unsteady hydraulic model. This level of analysis can be time consuming, particularly if the downstream drainage is complex and critical sections are located well downstream. 7.0 Recommendations for Dam Breach Analysis The recommendations presented herein for modeling dam breaches are intended to provide the most realistic dam breach flood estimates while still being appropriately conservative. For the purposes of these recommendations, the term conservative means an analysis that tends to overestimate the magnitude and impacts of the dam breach flood. For example, an increase in the estimate of average breach width for a given development time leads to an increase in the peak breach discharge and associated impacts downstream. Being appropriately conservative at this time is warranted because of the need for better physically-based modeling of the erosion processes of dam failures, which is still in the developmental stage. These recommendations are based on case studies performed on a range of dams within Colorado. A summary of the case study results is presented in Appendix A. 11
18 February 10, 2010 Guidelines for Dam Breach Analysis 7.1 Breach Parameter Estimation Empirical Methods The MacDonald & Langridge-Monopolis (1984), Washington State (2007) and Froehlich (2008) methods are the recommended empirical tools for predicting dam breach parameters within the State of Colorado. The appropriate equations with English units are summarized in Table 2. The MacDonald & Langridge-Monopolis method computes a volume of embankment eroded during breach formation, based on the product of the reservoir volume (V w ) and maximum water depth (H w ). This product, termed the Breach Formation Factor (BFF), loosely represents the erosive potential of the water stored in the reservoir. The breach dimensions are calculated based on the volume of embankment material eroded and the dam geometry. This method considers the dam geometry (height, crest width, and embankment slopes), and the breach development time computed is directly related to the embankment volume eroded. Wahl (1998) provides an equation for this relationship, using an envelope curve of the data, thereby making breach development time estimates conservative. This method also distinguishes between earth-fill dams and rockfill dams. Washington State (2007) took the MacDonald & Langridge-Monopolis method and adjusted it based upon whether the dam is made of cohesionless or cohesive material. Comparing the predicted earth-fill embankment volume eroded, the Washington State cohesionless equation results in a slightly larger eroded volume estimate than the best fit curve estimates of the MacDonald & Langridge-Monopolis method. As would be expected, results from the Washington State cohesive soil equation show less embankment volume eroded than the MacDonald & Langridge-Monopolis method. The Washington State method estimates the breach development time for cohesionless soil using the MacDonald & Langridge-Monopolis method and developed its own equation to estimate breach development time for cohesive soil using a best fit to the midpoint of the data instead of an envelope equation. Discussion in the Washington State Technical Note suggests a minimum breach formation factor (BFF), of 100 ac-ft 2. This method therefore appears more suited to Small or Large dams, while the MacDonald & Langridge- Monopolis method appears to be more appropriate for Minor dams and some small dams with a BFF less than 100 ac-ft 2. The Froehlich (2008) method is dependent only on the volume of the reservoir, height of the breach and the assumed breach side-slope. The method distinguishes between piping and overtopping failures using a variable coefficient termed the Failure Mode Factor, K o. Everything else being equal, an overtopping analysis produces a larger breach section compared to a piping failure analysis. The Froehlich method breach development time does not distinguish between overtopping or piping breach failure modes. The development time estimate is inversely related to the breach height while being directly related to the reservoir volume. This means dams with greater height tend to produce shorter failure times for a given reservoir volume which appears to be a valid conclusion considering the greater head driving the breach formation. 12
19 Guidelines for Dam Breach Analysis February 10, 2010 Table 2 Summary of Recommended Empirical Equations (English Units) MacDonald & Breach Langridge-Monopolis Washington (2007) Froehlich (2008) Parameters (1984) Volume Eroded V er (yd 3 ) Average Breach Width B avg (ft) Breach Side slopes Z b (H:V) Breach Development Time T f (hr) (best fit all data) (rockfill) 2.0: (cohesionless dams) 2.5. (cohesive dams) (cohesionless) (cohesive) K o =1.0 for piping K o =1.3 for overtopping 0.7:1 - piping 1.0:1 - overtopping Suggested Methods to Validate the Parameters Calculated using Empirical Methods: On a case by case basis, judgment is needed with the predicted parameters calculated using the recommended methods presented here. There are a few general tools used to validate the predicted parameters: 1. An estimate of linear erosion rate can be used to check the validity of the failure time. Linear erosion rate (ER) is defined as the B avg /T f. Von Thun and Gillette (1990) suggests the minimum allowable erosion rate related to the height of the water above the breach bottom, can be empirically defined as 4H w and the maximum erosion rate related to the water depth is H w. However, the data set used to develop the empirical parameters suggest a minimum ER of 1.6H w. If the T f, B avg, and H w computed by the empirical methods listed above produces an ER/H w much less than 1.6, then either the T f is too long or B avg is too small and adjustments are needed or a different method selected. Likewise, the maximum ER/H w in the data set was only 21, which is considerably less than upper limit defined by Von Thun and Gillette (1990) (greater than 200). The average ER/H w computed from the database was 6.7. Therefore, if the ER/H w ratio is greater than 21, then the parameters are considered suspect. 2. Von Thun and Gillette (1990) suggests that B avg /H w cannot be less than 2.5. However, the data set, especially for piping, shows B avg /H w less than 2.5 in many instances. In fact, it is near 1.0 in several cases and less than 1.0 in a few instances. The minimum B avg /H w for the data set was 0.6 and the minimum B avg /H b was 0.5. This ratio is highly dependent on storage-intensity (SI = V w /H w ) and with a relatively small reservoir volume relative to the dam height (low storage intensity), the reservoir evacuates quickly and does not allow for the breach to widen. Piping failure of a dam with a very low storage-intensity may evacuate the reservoir through the piping hole without a full rectangular or trapezoidal breach forming. Paquir, et.al, (post 1995) suggested that the piping hole width has to reach 2/3 of the dam height above the bottom of the pipe before the roof of the piping hole collapses 13
20 February 10, 2010 Guidelines for Dam Breach Analysis and the breach transitions into a full breach formation. In any event, it is very possible to have a B avg less than H b. If the ratio of B avg /H b is less than 0.6, then the method is suspect or the reservoir is so small that only a piping hole will form. (See Section for additional discussion on this topic) 3. For dams where two empirical methods may be appropriate, the average flow velocity through the breach may be used to validate one method over another. This technique requires that the average velocity be determined when the breach has reached its final width. The velocity is calculated based on the reservoir level and flow at that time. In theory, since the breach has reached its maximum size, there should not be enough head in the reservoir and/or flow through the breach to cause significantly more erosion to occur. When comparing two methods, the method that yields the smallest velocity at the final breach configuration is probably the most appropriate method. It is necessary to run a parametric model to use this validation technique, but it should help determine which method is most appropriate. The reservoir level, flow and velocity is easily determined with the HEC-RAS model, but can also be estimated from the other models if the reservoir level and the flow through the breach is known. 4. In some cases, the valley geometry is narrow and will control the breach width. One cannot have a B avg wider than the valley at that particular elevation. Also, the breach bottom width and side slopes must be selected to ensure the bottom width of the breach is not wider than the valley width at that elevation. 5. The Federal Energy Regulatory Commission s Dambreak Studies guideline (FERC, 1993) provides a range of reasonable values for breach width, side slope and failure time for earthen embankments. Breach Width typically falls between one to five times the dam height; failure time typically falls within hours; and breach side slopes typically range between 1H:4V to 1H:1V. The same guidelines also have typical breach parameters for other types of dams including arch, buttress, masonry, gravity, monoliths, timber crib and slag/refuse dams. The Froehlich (2008) method is recommended for Small or Large dams with a volume greater than 100 AF, as it yields conservative, but reasonable results. The MacDonald & Langridge-Monopolis (1984) and/or Washington State (2007) methods may also be appropriate for certain situations on a case-by-case basis. The value of storage intensity provides a check for which method is most appropriate (see Table 3 below). For Minor dams and Small dams with a capacity of less than 100 AF, use of the MacDonald & Langridge-Monopolis (1984) method is recommended to estimate volume eroded and breach geometry. Breach development time estimates for Minor and Small dams should be computed by the Washington State method. The MacDonald & Langridge-Monopolis (1984) and Washington State (2007) methods tend to yield a very narrow breach width for Small and Minor dams that have breached due to overtopping. The Froehlich (2008) method appears to give more reliable results and is recommended for all sizes of dams to calculate the breach parameters for an overtopping failure mode. If the dam material is known or can be assumed to be cohesionless, then the Washington State (2007) method can be used outright to calculate V er and T f, but the reasonableness of the results need to be checked. For instance if a small or minor sized dam built with cohesionless soils, produces a B avg /H b value less than 0.6 with the Washington State (2007) method, the Froehlich (2008) method may be more useful. Likewise, the MacDonald and Langridge-Monopolis (1984) method has a specific equation to estimate V er for rockfill dams. 14
21 Guidelines for Dam Breach Analysis February 10, 2010 Erosion rate (ER) guidelines of 1 < ER/H w < 21, where ER=B avg /T f, can be used as check of the methods and the parameters adjusted accordingly. Table 3 summarizes the generally appropriate empirical methods for varying dam sizes and storage intensities. This is only a guide and engineering judgment is needed on a case-by-case basis considering the ER/H w and B avg /H b guidelines mentioned above. Table 3 - Guide of Appropriate Empirical Methods for Various Dam Sizes and Storage-Intensities Storage Intensity SI V w /H w Dam Size Low SI 5 Medium 5 SI 20 High SI 20 Minor *MacDonald & Langridge- Monopolis with Washington State failure time. Froehlich for Overtopping. *MacDonald & Langridge- Monopolis with Washington State failure time. Froehlich for Overtopping. *MacDonald & Langridge- Monopolis with Washington State failure time. Froehlich for Overtopping. Small Large Comments *MacDonald & Langridge- Monopolis with Washington State failure time and possibly Froehlich (case-by-case). Froehlich for Overtopping. Froehlich. The side slopes may need to be adjusted to yield a reasonable bottom width. Parameters likely need to be adjusted with judgment on a case-by-case basis may need to be modeled as piping hole for Small and Minor dams. Froehlich and possibly *MacDonald & Langridge- Monopolis with Washington State failure time (case-by-case). Froehlich and possibly *MacDonald & Langridge- Monopolis with Washington State failure time (case-by-case). Both Froehlich and *MacDonald & Langridge- Monopolis seem to work for Small and Large dams in the middle range of SI. Engineering judgment is needed on a case-by-case basis. Froehlich for geometry and failure time. Froehlich and possibly *MacDonald & Langridge- Monopolis with Washington State failure time (case-by-case). It is important to look at valley and dam constraints as the computed parameters may exceed the valley width and/or dam length. Froehlich (2008) References MacDonald & Langridge-Monopolis (1984) Washington State (2007) * Where the MacDonald & Langridge-Monopolis Method is referenced as a recommendation, this only applies for embankments constructed of cohesive materials. The Washington State Method is preferred for cohesionless earthen embankments Piping Failure Considerations with Empirical Methods For Small and Minor dams with low storage intensities (SI less than 5) that are built with cohesive soils, it is possible that a piping failure could occur and drain the reservoir without fully breaching the dam (i.e. collapsing the crest). This situation is evident when the MacDonald & Langridge-Monopolis and Washington State empirical method for establishing the breach parameters shows that the volume eroded (V er ) results in a corresponding B avg /H b of less than about 0.5. This phenomenon is common for Small dams with a volume less than 100 AF and SI less than about 2.5, and Minor dams when SI is less than about 1.5. When this occurs, it is possible to calculate the maximum piping-hole size (assumed to be square) from the volume of embankment eroded. This piping-only failure mode does not apply to dams 15
22 February 10, 2010 Guidelines for Dam Breach Analysis built with cohesionless soils. If the MacDonald & Langridge-Monopolis and Washington State empirical method produces a B avg /H b value of less than 0.6 for a dam built with cohesionless soils a full breach should be assumed and another empirical method such as the Froehlich 2008 should be used. When the computed maximum pipe dimension, D, is less than 0.6H b then this mode of failure can be modeled using a sluice gate and a square opening with HEC-RAS. The gate is simulated to open fully within the failure time T f computed by the empirical method at a chosen rate. It is easiest to use a linear rate of opening for the gate to simulate the piping hole, but one can make the gate open at any chosen rate by manually entering the gate opening versus time in the unsteady flow data. The method for determining D is described below. Generally, it consists of two algebraic equations and two unknowns: the piping-hole height/width (D) and the length of the piping-hole (L) along the hole s center. L is inversely proportional to D for a given V er. The mathematics involved follows with a sketch of a dam cross-section for clarification: C D D Z H Z d u p 1 1 L Figure 4 - Piping Hole Definition Sketch The following equations can be derived from this geometry: 2 Because L can be represented as a function of D and the dam geometry, substitution yields: 16
23 Guidelines for Dam Breach Analysis February 10, 2010 Reducing this equation yields: ) Separating and grouping by the power yields the final equation with only one unknown, D: 2 This cubic equation is difficult to solve explicitly, so an EXCEL look-up table was formulated to solve for D, which is available from the Colorado Dam Safety Branch with an example. The above method yields the most accurate theoretical piping hole size for the empirical volume eroded. However, an approximate hole size can be calculated easily assuming H p = 0.7 H b and then determining L and D from that with the basic geometry of the dam. This value of H p was found to be close to the theoretical H p for several trials made with different dams Spreadsheets Two spreadsheets have been developed to assist the user with dam breach parameter estimation using the empirical methods recommended above. In addition to calculating breach parameters, both spreadsheets include an estimate of peak breach discharge, which is intended for use at the screening level of analysis. The equation used to estimate peak breach discharge was developed for the Simplified DAMBREAK program (Wetmore & Fread, 1984). This equation is discussed in more detail in Section below. Because the equation is based on the breach geometry, it will provide different results depending on the empirical method chosen. Both spreadsheets include calculations to validate the results based on the discussion in Section above. Macdonald & Langridge-Monopolis and Washington State Spreadsheet The Macdonald and Langridge-Monopolis (1984) calculates dam breach parameters based on the Breach Formation Factor (BFF). The BFF, which is product of reservoir storage volume in acre feet and reservoir depth in feet, is used to calculate the volume of material eroded from the embankment (V er ) during breach development. Breach dimensions are then calculated based on the geometry of the dam. The work of Macdonald and Langridge-Monopolis was later refined by Washington State (2007). The Washington State guidelines proposed new relationships for calculating the eroded volume and breach formation times, depending on the erosion resistance of the material used to construct the embankment. Based on testing the proposed relationships on a wide variety of embankments, the spreadsheet calculations were selected using the preferred relationships as indicated in Table 3. The breach development times (T f ) for all cases are calculated using the relationships proposed by Washington State (2007). Table 4 below summarizes the equations used in the spreadsheet based on the type of embankment. 17
24 February 10, 2010 Guidelines for Dam Breach Analysis Table 4 Summary of Macdonald & Langridge-Monopolis and Washington State Spreadsheet Calculations by Embankment Type Calculation of Breach Embankment Type Embankment Development Volume Eroded Time Reference (V er ) (T f ) Earthen (Cohesive) V er BFF 0.77 T f 0.036V 0.36 er Macdonald and Langridge- Monopolis (1984) & Washington State (2007) Earthen (Cohesionless) V er 3.75 BFF 0.77 T f 0.02V er 0.36 Washington State (2007) Rockfill V er BFF T f 0.02V er 0.36 Macdonald and Langridge- Monopolis (1984) & Washington State (2007) As discussed in Section above, a piping failure may result in reservoir evacuation prior to full breach development. To address this failure mode, the spreadsheet includes a feature to calculate piping hole dimensions. The size of the piping hole, which is assumed to be square, is calculated based on the embankment volume eroded (V er ) and the dam geometry. The peak discharge through the piping hole is then calculated using the orifice equation. The calculation assumes that the piping hole forms instantaneously by applying the head of a full reservoir. This conservative assumption is considered adequate for a screening level analysis. Froehlich 2008 Spreadsheet The Froehlich 2008 spreadsheet was developed according to the relationships proposed by Froehlich (2008). Using this method, breach dimensions are dependant only on the depth and volume of water stored by the dam. This method does not consider dam geometry or the type of soil used to construct the dam. The average breach width (B avg ) and failure time (T f ) are calculated as: Where: K o = Failure Mode Factor H b = Height of breach in feet V w = Reservoir volume stored in acre-feet The spreadsheet automatically selects the K o value based on the user-selected failure mode. The values are 1.0 and 1.3 for piping and overtopping failures, respectively. The spreadsheet allows the user to input the breach side slope ratio, but it should be noted that Froehlich recommended values of 0.7 and 1.0 for piping and overtopping failures, respectively. 18
25 Guidelines for Dam Breach Analysis February 10, Physically Based Models NWS BREACH is currently the most widely used physically based model that can be used to estimate dam breach parameters. Based on Colorado Dam Safety Branch research into the BREACH program for numerous case studies (see Appendix A), the following potential problems have been identified and should be considered when using BREACH to estimate dam breach parameters: 1. Back-calculation of the piping orifice coefficient from BREACH output runs indicate the program may over-estimate this coefficient within BREACH vs. hand-calculated values based on equations developed by Fread (1988b). This problem appears to result in an over-estimation of breach flows for some Small and Minor dams with low storage intensities and an under-estimation of breach flows for dams with higher storage intensities. 2. The program causes the transition from pipe to weir flow to occur when the reservoir level reaches one-half of the pipe height above the top of the pipe. In other words if the piping hole height is 10 feet, then the crest collapses when the reservoir is 5 feet above the top of the piping hole. Based on observed dam failures of minor sized dams, this appears to force the collapse to occur prematurely. When combined with the high piping orifice coefficient, this issue may tend to drain the reservoir too rapidly and result in a smaller final breach configuration (less conservative). 3. After the crest collapses, the breach section gradually erodes laterally until the reservoir is drained enough to halt additional erosion. BREACH does not consider the head-cutting potential, so the lateral erosion may be overly simplified and the erosion rate is slow during this portion of the simulation. This may tend to make the total failure time long (less conservative). 4. The modeling algorithm for an overtopping failure erodes through the downstream slope and crest at the same grade as the downstream embankment slope using a sediment transport equation. Once the crest is eroded, the program starts eroding downward through the upstream slope, which, at the beginning erodes very rapidly straight down to the bottom of the dam without widening. Once the breach is cut through the dam, the program widens the breach at a slow rate. This algorithm ignores the head-cutting erosion process that actually occurs during an overtopping failure and results in a final breach configuration that may tend to be narrow (less conservative). These limitations should be taken into account when BREACH is used for performing hazard evaluations. BREACH appears to be most applicable for Small or Minor dams with low storage intensities since the alternative methods (empirical equations) sometimes yield very small breach dimensions and failure times. Acceptance of this model for hazard classification studies will be allowed with reasonable justification. The results must be validated with the other recommended methods. 7.2 Breach Peak Discharge Estimation Empirical Methods Equations for breach peak discharge estimates were developed for both the MacDonald & Langridge- Monopolis (1984) and Froehlich (2008) methods. Wahl evaluated these equations by comparing predicted peak discharges to actual peak discharges and found significant scatter between observed data and that predicted by the equations. The Froehlich equation had the best correlation, but still could significantly over-predict or under predict the peak flow. The MacDonald & Langridge-Monopolis method is an outlier curve with significant scatter and appears to greatly over predict the peak flow. In several analyses performed with this guideline, it was determined that the MacDonald & Langridge- Monopolis equation produced peak flows significantly greater than that produced by an instantaneous failure to the ultimate breach geometry. In other words, the computed peak discharge using a weir flow 19
26 February 10, 2010 Guidelines for Dam Breach Analysis equation with the final breach configuration and the reservoir level at H w was less than that produced by the MacDonald & Langridge-Monopolis peak discharge equation, which is impossible unless the reservoir is infinitely large. Wetmore and Fread (1984) provide an alternative to the MacDonald & Langridge-Monopolis (1984) and Froehlich (2008) equations for breach peak discharge. This equation was developed as part of the Simplified DAMBRK program (SMPDBK). It is essentially a weir equation of an instantaneous failure with a reduction factor. This reduction factor is dependent upon the reservoir surface area at full storage, the failure time, and H w. As the size of the reservoir increases, this equation appropriately approaches that of an instantaneous failure and the peak flow will never exceed the instantaneous failure value. Because of the weir flow component of this equation, it is more physically based than a pure empirical equation. The breach dimensions can be determined with empirical models, and then those dimensions can be input into this equation to determine a predicted peak discharge. The equation is as follows: Where: 3.1. Q p = Dam break peak discharge in cfs B avg = Average breach width in feet H w = Maximum depth of water stored behind the breach in feet T f = Breach development time in hours γ = Instantaneous flow reduction factor = 23.4 A s /B avg (equivalent to C in Wetmore and Fread (1984)) A s = Surface area of the reservoir in acres corresponding to H w In several of the case studies analyzed in the preparation of this guideline, the predicted Q p using the SMPDBK equation was greater than the actual computed peak flows using HECRAS, but the difference was marginal. As such, the SMPDBK Peak Flow Equation tends to produce reasonably conservative results. These equations provide only peak discharge values as opposed to a hydrograph. In cases where routing of the flow is not considered or predicted empirically, this equation can be used as part of a Screening level analysis and can indicate if a more sophisticated analysis is needed. For instance, if the SMPDBK equation produces a peak discharge that shows the critical structure is clearly not inundated, then the dam can be rated as Low Hazard and further work to determine a High or Significant Hazard rating is not warranted. If the estimated peak discharge from the SMPDBK equation clearly inundates the structure, then the dam should be rated as either High or Significant Hazard unless a more sophisticated analysis shows that a lower hazard class is appropriate. In cases where the piping failure mode is not expected to progress to a full breach, the weir flow assumption of the SMPDBK equation above does not apply. In this case, a theoretical maximum breach discharge can be calculated with the orifice equation assuming that the piping hole opens to its maximum dimensions instantaneously: 2 2 Where: 20
27 Guidelines for Dam Breach Analysis February 10, 2010 Q p = Dam break peak discharge in cfs C p = Piping Orifice Coefficient H w = Maximum depth of water stored behind the breach in feet D = Dimension of square breach hole Parametric Models Hydrologic Models Some hydrology models, including HEC-1 and HEC-HMS, include a parametric dam breach algorithm. Breach parameters must be obtained using other methods and provided as input in the analysis including failure mode (piping or overtopping), breach bottom width, breach side slopes, and breach development time. A breach progression method must also be selected from the list that includes: linear, sine wave, or user defined. In addition, HEC-HMS requires a piping orifice coefficient and starting elevation for the piping failure mode and a weir coefficient for the overtopping failure mode. The HEC models simulate a failure by enlarging a trapezoid-shaped breach with time in accordance with the specific progression and geometry. The reservoir is drained through the breach opening in the duration specified by the development time using the Modified Puls method, thus producing a breach outflow hydrograph. A review of the methodology and results of several case studies (see Appendix A) reveals that this method is adequate for most overtopping failure simulations, but issues regarding the piping mode failure simulation were noted. Review of the HEC-HMS manual indicates that a piping failure is simulated by expanding the piping hole radially outward around the starting elevation until the top of the circle reaches the dam crest, at which time the breach transitions to a trapezoidal shape and continues progressing. Flow through the circular opening is modeled as orifice flow, while the second-stage trapezoidal shape is modeled as a weir. This modeling algorithm raises several concerns that should be considered when using the piping failure mode in HEC-HMS: 1. Changing from a circular shape to a trapezoidal shape creates a discontinuity with the two different methods and results in irregularities in the outflow hydrograph. 2. Having the radial piping hole expand all the way to the dam crest using the orifice flow equation would mean that the reservoir level drops below the top of the orifice (pipe) for a certain amount of time while the orifice equation is still being used. This scenario would be modeled more accurately if the algorithm switched to the weir equation as soon as the water surface dropped below the top of the pipe. The HMS algorithm causes irregularities in the outflow hydrograph including a sudden drop in the flow when the reservoir level drops below the top of the pipe and a sharp increase when the model changes from orifice flow to weir flow. 3. Review of the case study results along with back-calculations show that the piping head used in the orifice flow portion of the model is measured from the designated starting piping elevation for all intervals regardless of the starting reservoir elevation. This situation would be modeled more accurately if the piping head were measured from the center of the piping hole at all times. If the starting piping elevation is set at the bottom of the dam, then the piping head is measured from the bottom of the piping hole as the hole only expands upward radially and the bottom half of the piping hole is ignored (because it is underground). The first two issues described above only cause discontinuities in the shape of the hydrograph and would probably not have a significant impact on a hazard evaluation. However, the third issue, with the starting elevation set at the bottom of the dam, tends to cause an unrealistic increase in flow through the piping portion of the failure by overestimating the piping head as the hole expands. This tends to create a very sharp and high peak outflow within the piping portion of the failure. It also tends to cause a more rapid 21
28 February 10, 2010 Guidelines for Dam Breach Analysis decrease in the reservoir level with higher flows occurring during the piping stage of the failure. As such, the peak of the breach hydrograph usually occurs during the piping mode of failure as opposed to during the weir flow mode. To resolve this issue when modeling a piping failure breach with HEC-HMS, it is recommended that the starting piping elevation should always be set at the mid-point of the final breach height. This will ensure that the head is always measured from the center of the pipe/dam. A comparison of HEC-HMS results (with the starting elevation set at the center elevation of the reservoir) to HEC-RAS results (with a piping failure starting at the bottom of the reservoir) showed similar peaks and time to peaks in the resulting breach hydrographs. The HEC-1 model simulates a dam breach by assuming weir flow through a trapezoidal section that progresses linearly from no breach at the top of the dam to the specified final parameters at the bottom of the breach in the time T f. The piping portion of a failure is not considered and the only progression available is linear. Therefore, the results may not be valid for a piping failure of a smaller reservoir when the piping portion may be significant enough to impact the final hydrograph. Due to the above issues, caution should be exercised when using HEC-1 and HEC-HMS to simulate a piping failure, especially when the final results at a critical location downstream indicate a borderline situation between hazard ratings. However, because of their simplicity and ease of use, both models are valuable for simulating an overtopping breach for a simple or intermediate analysis. Also, for a simple or intermediate analysis of a piping failure, HEC-1 can be useful for a larger reservoir when the piping portion of the failure is not as significant and HEC-HMS can be useful if the starting piping elevation is set at mid-height of the reservoir behind dam Hydraulic Models The latest versions of the HEC-RAS model include algorithms to model both overtopping and piping breaches. HEC-RAS uses hydraulic principles through cross sections upstream and downstream of the dam to define how the reservoir drains during the formation of a dam breach. The dam crest is modeled as an inline weir and either a piping failure or overtopping failure is simulated with enlargement of the breach occurring over time as defined by a specified breach progression. Flow through the piping hole is calculated as orifice flow and flow through the breach is calculated as weir flow. The water surface profile upstream of the dam is back-calculated using unsteady momentum and hydraulic principles for each time step and the resulting drawdown through the hole and/or breach produces an outflow hydrograph. Resulting water levels for each time step downstream of the dam are used to model potential backwater effects and the weir and orifice coefficients are automatically adjusted for submergence, if necessary. HEC-RAS can also model a piping failure that does not progress to the point of collapsing the crest. In this scenario, the piping hole is simulated as a sluice gate. Compared to HEC-HMS, the HEC-RAS program models a dam failure, especially a piping failure, more correctly and accurately for the following reasons: 1. Modeling a dam failure using hydraulic principles is usually more accurate than a hydrologic model because the modeler can more accurately simulate the shape of the reservoir, tailwater effects, and drawdown effects. Put simply, a dam failure is more accurately defined as a hydraulic process than a hydrologic one. HEC-RAS has the capability to model the pipe with an initial piping elevation set at the bottom of the dam (most piping failure situations); the piping hole is modeled as a rectangular hole, which is more consistent with the final trapezoidal shaped breach section, thereby reducing discontinuity. The bottom width of the hole enlarges proportionally to the final bottom width according to the selected progression, as does the height of the hole toward the final breach depth. This will make the hole height/width ratio greater than one if the final breach parameters chosen show 22
29 Guidelines for Dam Breach Analysis February 10, 2010 a bottom width narrower than the dam height, but since the orifice flow is based upon the area of the orifice and not the width versus the height, this is a valid assumption. 2. Once the water level drains down to the top of the enlarging piping hole, the crest is assumed to collapse and the algorithm transitions to weir flow. The bottom width and the top width of the breach continue to enlarge laterally until the final defined width and side slopes are reached. Unlike HEC- HMS, HEC-RAS never assumes orifice flow with a reservoir level below the top of the piping hole. It should be noted that in several modeled case studies, the crest collapses when the height of the piping hole reaches near 0.6H b and the peak flow occurred in the weir flow portion of the failure soon after the crest collapses. This is dependent on the drawdown rate versus the breach progression, and selected final parameters, but helps support the reasonableness of the program. 3. Unlike HEC-HMS, the piping head used in orifice flow is measured from the center of the piping hole at all times regardless of its location and size. 4. One cannot model a non-breaching piping failure in HEC-HMS. This mode of failure occurs when the reservoir volume relative to the dam s size (storage intensity SI) is small enough that the reservoir would drain through the hole before the crest collapses and forms a breach. The specific situations when this would occur are discussed in detail in section , but is a potential situation for tall (say greater than 35 ) Small dams with a volume less than 100AF when SI is less than or equal to 2.5 and Minor dams when SI is less than or equal to 1.5. Instead of using the breach routine, HEC- RAS can be forced to model a progression of this mode of failure using a sluice gate and a square hole while manually entering the gate opening at a chosen rate to the failure time. Unfortunately, with the more accurate HEC-RAS method, more time consuming and detailed input is required as follows: 1. Dam and spillway data are needed to define the dam as an inline weir. HEC-RAS version 4.0 includes the capability to model the dam crest weir flow and breach weir flow with different weir flow coefficients. A weir coefficient of 3.08 is appropriate for the breach section. A weir flow coefficient of 2.6 is appropriate for the dam crest. 2. HEC-RAS must have a base flow to perform an unsteady simulation. For on-stream reservoirs that are normally full and spilling, it is recommended to use an estimate of an average year spring runoff monthly flow extrapolated from nearby gages. As discussed above, the spillway needs to be modeled to pass this flow at the correct normal spring runoff elevation. For off stream reservoirs and/or when the reservoir is not normally above the emergency spillway crest, a fictitious outlet using the sluice gate option needs to be input to pass the base flow without exceeding the emergency spillway elevation. The pipe hole size may be calculated based upon this base flow using the orifice flow equation. In this situation, the base flow can be estimated from normal to peak runoff. The fictitious outlet and base flow may have to be adjusted if there are stability problems in the model. 3. Breach parameters, including the mode of failure (piping or overtopping), breach width, side slopes, and failure time are all similar to the HEC-HMS input data and need to be obtained from other sources. Also, like in HEC-HMS, a breach progression curve (either linear, sine wave, or a user defined curve) along with a piping orifice coefficient and starting elevation for a piping failure and a weir coefficient for overtopping must be specified. The starting water surface elevation may be specified anywhere between the bottom and top of the reservoir and HEC-RAS will enlarge the piping hole and compute the orifice flow. Although the most realistic starting piping elevation is usually around the outlet pipe, a sensitivity analysis sometimes reveals that a different piping elevation may produce the most realistically conservative result. Recommended options for the orifice and weir coefficients along with progressions are discussed later since these parameters are the same for both HEC-HMS and HEC-RAS. 23
30 February 10, 2010 Guidelines for Dam Breach Analysis Detailed instructions on how to build a HEC-RAS model is not within the scope of this document. However, a few Rules of Thumb for establishing a stable working model are provided as follows: 1. The model can simulate a reservoir as either a storage area with a defined stage-storage relationship, or as a series of cross-sections cut through the reservoir. The storage area method has the benefit of accurately modeling the actual storage within the reservoir, but it does not calculate hydraulic losses as water in upper portions of the reservoir travels to the dam breach. 2. The USACE HEC has produced a guidance document for modeling a dam failure with the storage area method. This document is provided in Appendix B (Gee, 2006). 3. As outlined in Appendix B, the HEC-RAS model must contain at least two cross-sections upstream of the dam. The furthest upstream section is connected to the storage area and the downstream section is associated with the dam which is modeled as an in-line structure. Adding a third section between the 2 sections upstream of the dam is also recommended to allow for a better solution of the unsteady flow analysis. In order to add the third section, the section at the upstream toe can be simply copied upstream one foot to provide the connection to the storage area. Then, one section can be interpolated half-way between to generate the third section. It is important to keep the distance between these sections small to prevent inadvertently increasing the storage of the reservoir. 4. Of the two sections upstream of the dam, the downstream section parallels the dam along its upstream toe. It can be defined from known bathymetric data, or it can be easily defined as a simple trapezoid with its top width coinciding with the length of the dam crest and at the crest elevation or slightly higher, and the bottom points coinciding with the toe of the dam at its maximum section. The bottom width of the trapezoid should be equal to or greater than the breach bottom width. This simple section is acceptable because it is not used for hydraulic calculations or to define the storage within the reservoir. The storage is defined by a user-input elevation-storage table. 5. The dam is defined by the crest profile input as an in-line structure. The crest profile is superimposed onto the cross-section immediately upstream of the dam. When simulating a dam breach, the breach geometry is cut into the crest profile with the specified breach geometry and at the user-defined rate. 6. It should also be noted that in HECRAS 4.0, it is necessary to set the bottom elevation of the cross-sections upstream of the dam at or above the minimum elevation of the stage-storage defining the reservoir storage. Any storage input below the minimum elevation of the breach will be treated as dead storage. 7. At least two sections downstream of the dam must be established to model the failure and address tailwater effects. The first one is at, or just downstream of, the dam s downstream toe. The lowest section is then established far enough downstream to help establish the downstream channel slope and tailwater submergence effects. Do not add any more sections downstream until the failure can be modeled satisfactorily. If bathymetric data are available for an oddly-shaped reservoir (long and skinny or very wide), a more accurate way to model the breach would be to cut cross-sections through the bathymetric surface. 1. Define two cross sections upstream of the reservoir, with the second one being set at the highwater line of the reservoir. These sections do not define the reservoir so their configuration is not critical, but they are needed to start the model. 2. When utilizing the cross section method, the sections within the reservoir need to capture significant changes in the ground slope (if known) and shape of the reservoir. Set the overbank stations at the high-water line. The Manning n-values in the reservoir are usually low because of the reservoir depths and a drained reservoir is void of vegetation. However, for steeper and wide reservoirs, it may be necessary to increase the roughness in the basin for model stability as the 24
31 Guidelines for Dam Breach Analysis February 10, 2010 dam fails. It is also advisable to set the bottom of each reservoir cross-section as a point with no width slightly below the invert viewed on the contour lines to help with model stability. 3. The use of interpolated sections within the reservoir basin is usually not necessary. In fact, too many sections may cause stability problems. However, if certain segments of the reservoir are steep, then interpolated sections may be needed. 4. The downstream-most section in the reservoir (which defines the inline weir/dam) is obtained from a section along the upstream toe that parallels the dam. Like other sections in the reservoir, set the bottom of a point slightly lower than the breach bottom at its center for model stability. Since HEC-RAS does not recognize water downstream of this section that lies against the upstream slope, placing this section (distance-wise) half-way between the upstream toe and crest usually helps in establishing the correct volume. The distance to the crest, side slopes of the dam, and distance to the downstream section will have to be reduced to compensate, but this has no influence on the computations or results. The DAMBRK model is mentioned here as an alternative to using HEC-RAS to model a dam failure. It has the capability to model overtopping and piping dam failures with an input of the final breach parameters similar to HEC-RAS. The BOSS version of DAMBRK is much more user friendly than the original NWS DAMBRK model. A significant drawback for using DAMBRK is the cross-sectional input requirements maybe over simplified for routing dam break floods downstream because it requires the same number of points at every cross section and the model seems to have more convergence problems than HEC-RAS. For very long reservoirs, where the hydraulics inside the reservoir basin during a dam failure may have a significant impact on the hydrograph, a different routine within the DAMBRK program allows for defining the reservoir with cross sections. However, due to the convergence and over simplification of the sections, it would probably be better to use HEC-RAS for this situation Parameters Common to Hydraulic and Hydrologic Models Both hydraulic and hydrologic parametric models require additional input beyond the breach parameters discussed so far. These parameters include orifice flow coefficients, weir flow coefficients and breach progressions. Depending on the type of parametric model used (hydraulic or hydrologic) and the mode of failure being modeled (piping or overtopping) the recommendations for some of these parameters may change Orifice Coefficients (C p ) The orifice coefficient defines flow through the piping hole before the models shift to weir flow as 2 Where: H p = Piping head (difference between the water level and the centroid elevation of the pipinghole) C p = Piping Orifice Coefficient A = Cross sectional area of the piping hole. Danny Fread, author of the BREACH program, outlines a method of computing the orifice coefficient, C p, which is dependent on the material of the dam and length and size of the piping hole. This equation is based upon the Darcy friction factor ( f ) where: 25
32 February 10, 2010 Guidelines for Dam Breach Analysis Where: And: D 50 = Average grain size in millimeters for the dam embankment material. D = Piping hole width in feet (assumed to be square). Where: 1 1 L = Length of the piping hole (in feet) along its centerline. C p varies from very small for a long L and small D value, as seen during the initial piping stages, to values approaching 1.0 for very large piping holes and shorter L values. C p is always less than or equal to 1.0. C p is also inversely proportional to the grain size, being larger for smaller D 50 values. This approach seems reasonable, but unfortunately, it appears that BREACH does not use it correctly (see discussion under Physically Based Models ) and both HEC-RAS and HEC-HMS, use a constant C p value. Using an average C p from this equation in both HEC-RAS and HEC-HMS computed for various piping hole sizes appears reasonable and appropriate. Using the orifice coefficient equation for various size dams and varying the potential piping hole sizes from a D = 0.1 ft to 0.6 H b shows that C p varies from 0.1 to The average computed C p values, while uniformly varying D for dams with coarse-grained material and fine-grained material, are shown in Table 5 below. Table 5 - Recommended Orifice Piping Coefficients Based on Dam Height Height of Dam, H w (ft) Average C p for coarse grained soils (D 50 >0.25 mm). Average C p for fine grained clayey soils (D 50 <0.01 mm) Table 5 shows that the average C p is close to 0.7 for all typical dams and it is reasonable to assume this value for most analyses. As the height of the dam gets smaller, a C p of 0.6 can be assumed; for very large dams with fine grained material, a C p of 0.8 can be assumed. Table 5 is for typical dams with 3:1 upstream slope, 2:1 downstream slope, and corresponding typical dam crest widths. For borderline hazard ratings, when more detailed analysis is required and the dam has very coarse grained material or the dam cross sectional varies from the typical section, it may be necessary to use the aforementioned 26
33 Guidelines for Dam Breach Analysis February 10, 2010 equation for different piping hole widths to calculate an average Cp. An EXCEL spreadsheet has been developed for calculating C p and is available from the Colorado Dam Safety Branch. Note that choosing a high C p is not necessarily more conservative than using a low C p. In fact, in many cases, the opposite occurs. A high C p will cause more water to drain through the piping hole before the transition to weir flow and the resulting peak during weir flow may actually be lower. This situation is dependent on several factors and there is no rule of thumb regarding choosing a conservative value for C p. In some borderline cases, a sensitivity analysis of C p may be warranted Weir Coefficients (C w ) Piping Failures After the dam crest collapses, the breach section erodes laterally and outflow through the breach is modeled as weir flow. During a piping mode, the configuration of the weir consists of a flat approach channel through the breach with a vertical drop-off to the tailwater section resulting from head-cutting during both the piping mode and weir flow. For free-flow conditions through the breach (no tailwater effects), critical depth at the drop-off becomes the control and the reservoir level upstream equals the corresponding energy grade line. Back-calculating a corresponding C w for this situation, shows C w = This is supported by King and Brater s Handbook of Hydraulics, which states the maximum allowable weir coefficient for a broad-crested weir is The value of 3.08 is automatically used in HEC-HMS and it is recommended for use for all piping situations in HEC-RAS. Overtopping Failures The weir coefficient is defined with the dam top for both HEC-HMS and HEC-RAS for an overtopping failure. It is not only used to define the flow through the breach during the failure, but is used to define the flow over the dam before failure. In reality, this situation would warrant two different weir flow coefficients, but that capability is not available. During the overtopping phase before failure, the crest acts like a broad crested weir with side slopes. Extrapolating from King and Brater, C w is usually around 2.6 to 2.8 for a typical dam, but can vary from 2.6 to for a broad crested weir. During the breach and after the crest and downstream slope have eroded severely, the crest width is reduced to almost zero and the downstream slope can approach vertical due to head-cutting. This would increase the free-flow C w value to over 3.0. HEC-1 automatically uses 3.1 for an overtopping failure, which appears appropriate for modeling a dam failure assuming no crest and a vertical downstream slope. Note that HEC-RAS will automatically adjust this value for tailwater effects if the weir flow becomes submerged, so the free-flow C w should always be specified. If the user is using earlier versions of HECRAS where only one C w can be specified, the flow during the breaching of the dam after erosion of the downstream slope and crest is more critical than the overtopping flow prior to breaching and it is best to use the C w for the breaching portion. A value of C w = 3.08 should be used for overtopping failures. If it is critical to maintain the water surface elevation overtopping the dam by the defined inflow, the crest profile length can be adjusted to hold the water surface at the same elevation as if a smaller C w were used (i.e. adjust the dam length to control the computed water surface elevation in the reservoir). However, since HEC-RAS version 4.0 includes the capability to model the dam crest weir flow and breach weir flow with different C w values, the crest profile length will not need to be adjusted. 27
34 February 10, 2010 Guidelines for Dam Breach Analysis Breach Progressions Piping Failures A breach progression must be specified for both HEC-HMS and HEC-RAS piping failure analyses. The breach progression defines the rate at which the piping hole or breach width enlarges with time. Both of these models allow the user to choose a linear progression, sinewave progression (starts out slowly, with a more rapid increase in the center of the progression and then ending more slowly), or a user defined (manual) progression. DAMBRK allows the user to choose a linear progression or exponential progression. Generally, it has been observed that breaches progress slowly at the start and end of a failure and more rapidly in the middle of the progression. This leads one to believe that the sinewave progression most accurately models a breach. However, if the hydraulics downstream of the dam create enough tailwater to affect the outflow hydrograph, then a linear progression may be more appropriate if the model used cannot take submergence into account. When using HEC-HMS, there was minimal difference in the results between the linear and sinewave progression methods for the cases studies evaluated for these guidelines and there was no consistency as to which progression produced the larger peak flow. It is hypothesized that this inconsistency is a result of the fact that HEC-HMS cannot account for tailwater effects. It is therefore recommended to check both the linear and sinewave progressions with HEC-HMS and use the one that produces the most conservative results. More sensitivity to the selected breach progression was observed when using the HEC-RAS program for the case studies evaluated for these guidelines. The HEC-RAS results showed that the sinewave progression produced the higher peak flow in all cases. It is hypothesized that HEC-RAS s ability to account for the tailwater effects through its hydraulic calculations may contribute to the lower peak discharges calculated when the linear progression is used. Using the linear progression in HEC-RAS may be similar to accounting for the tailwater effects twice which results in a less conservative peak discharge. Because of this, the sinewave progression is recommended for use in HEC-RAS models using parameters based upon empirical methods. Overtopping Failures Like with piping failures, a breach progression must be specified for both HEC-HMS and HEC-RAS analyses of overtopping failures. Overtopping failures do not have the transition from orifice to weir flow with a crest collapse that a piping failure requires. The breach progression is therefore not as variable and a more uniform progression rate is applicable. In an overtopping failure, the failure time is assumed to start when the upstream slope starts eroding. This may not happen until a significant time period after the dam starts to overtop. Both the linear and sinewave progressions are appropriate in this situation. For both HEC-HMS and HEC-RAS, there was not much difference in the results between the two progression methods for the one overtopping case-study analyzed. HEC-HMS produced peak flows that were within 8% of each other and the HEC-RAS results were within 1%. As discussed above, it is recommended to check both methods and use the most conservative results (i.e. highest peak discharge). Tailwater factors may also have an impact and should be considered where appropriate. 28
35 Guidelines for Dam Breach Analysis February 10, Breach Flood Routing Routing of the dam breach discharge hydrograph is a required step in a hazard evaluation or development of flood inundation mapping for Emergency Action Plans for all but the screening approach. Routing of the breach hydrograph is performed to evaluate the attenuated or reduced peak discharge at critical locations downstream of the dam. In addition to calculating the attenuation, determining the flood wave arrival time and the depth/velocity of flow at those critical locations are also very important parts of the analysis. If required, inundation mapping can also be generated from a hydraulic model of the downstream failure path. There are many references available that cover flood routing in detail. A brief summary of the available methods is provided here. Hydrologic routing employs the continuity equation and an analytical or an empirical relationship between storage within the reach and discharge at the end (USACE, 1994). In the absence of significant backwater effects, the hydrologic routing models offer the advantages of simplicity, ease of use and computational efficiency (USACE, 1994). Hydrologic routing models provide attenuated flow hydrographs at locations of interest, but cannot provide information on water surface elevations or flow velocities. Hydraulic routing employs the continuity equation and both energy and momentum balances to calculate open channel flow profiles. These equations are often referred to as the St. Venant equations or the dynamic wave equations (USACE, 1994). The full unsteady flow equations have the capability to simulate the widest range of flow situations and channel characteristics. Basic data requirements for hydraulic routing techniques include: Flow data (hydrographs), channel cross-sections and reach lengths, roughness coefficients, and internal boundary conditions. Hydraulic modeling is further subdivided into steady flow analysis and unsteady flow analysis. The difference between steady and unsteady models is the treatment of time. In unsteady flow, time dependent changes in velocity are analyzed explicitly as a variable, while steady flow analysis models neglect time all together (USACE, 1993). HEC-RAS can be utilized for both steady and unsteady flow analyses. The HEC-RAS dynamic unsteady flow model is recommended for all situations if the accuracy and detail is needed for determining a hazard rating (e.g. borderline cases). However, if accuracy is not critical and the channel slope is greater than two feet per mile, a hydrologic routing technique may be more appropriate. 7.4 Hydraulics at Critical Locations The final step in a breach analysis is the estimation of the hydraulic conditions at critical locations. This step is required to determine the depth of flooding and flow velocity to determine the appropriate hazard classification. The hydraulic model can also be used to generate inundation mapping if required. There are two general approaches to this step: Steady State and Unsteady. In situations where hydrologic tools are used to route the breach hydrograph to critical locations, but where estimation of flow depths and velocities are still required, a simple normal depth calculation can be used in the absence of backwater effects. Manning s equation is recommended for calculating normal depth because it is widely accepted for uniform open channel flow within the United States. There are numerous tools that can be utilized to solve Manning s equation, including calculation by hand. Hand calculation is usually cumbersome and difficult because the channel geometry tends to be complex at critical sections. In this case, a program such as Flowmaster or HEC-RAS may be used. The input parameters are flow, roughness coefficients and channel slope. If the channel geometry is anticipated to produce backwater effects that invalidate the steady, uniform flow assumptions of normal depth, then a 29
36 February 10, 2010 Guidelines for Dam Breach Analysis HEC-RAS model of the reach should be created and a steady flow simulation run to calculate the hydraulics of the critical location. The fully dynamic unsteady flow analysis model is a single step process that can be used to route the breach hydrograph and calculate the peak water surface profile and flow velocity. Since the model calculates velocity and water surface elevation changes with respect to time, it can also be used to determine the amount of time it takes for the flood wave to reach critical locations anywhere along the flood path, which is required for Emergency Action Plans. National Weather Service models DAMBRK and FLDWAV both model unsteady flow but their use is becoming less frequent since neither model is supported by non-proprietary entities at this time. HEC-RAS is the recommended tool for hydraulic unsteady flow analysis. This free model is continually being upgraded, is supported by the U.S. Army Corps of Engineers, and is widely accepted as the current state-of-the-practice open channel flow hydraulic model within the civil engineering community. 8.0 Limitations Through the course of development of these guidelines, every effort was made to make the recommendations as useable as possible over a broad range of conditions. Each dam is unique, and individual cases may require different modeling approaches than those recommended herein. Different modeling approaches may be appropriate on a case-by-case basis with proper justification provided. Due to unknowns within these analyses and assumptions that must be made, engineering judgment must be applied to the results of all dam breach analyses. In most cases a sensitivity analysis will be required to verify that the assumptions used provide conservative, yet realistic results. 30
37 Guidelines for Dam Breach Analysis February 10, Annotated Bibliography Cristofano, E. A., (1965). Method for Computing Erosion Rate for failure of Earthfill Dams, Unpublished internal document, U.S. Bureau of Reclamation, Denver, CO Summary: A copy of this document was not obtained for this study, but references in other sources provide a general understanding of the content. Cristofano was a sedimentologist with the USBR and looked at the dam breach problem from that perspective, using empirical formulas to estimate removal of the breached materials and angle of repose as a primary input parameter. Harris G.W. and D.A. Wagner, (1967). Outflow from Breached Earth Dams, University of Utah, Salt Lake City, UT Summary: A copy of this document was not obtained for this study, but references in other sources provide a general understanding of the content. Wetmore, J. N. and Fread, D. L. (1984). The NWS Simplified Dam Break Flood Forecasting Model for Desk-top and Hand-held Microcomputers. Federal Emergency Management Agency Summary: Describes a simplified procedure for predicting downstream flooding produced by a dam failure known commonly as the Simplified Dam Break (SMPDBK) Flood Forecasting Model. MacDonald, T.C., and Langridge-Monopolis, J., (1984). Breaching Characteristics of Dam Failures, Journal of Hydraulic Engineering, Vol. 110, No. 5, May, pgs Summary: Study of 42 cases histories of dam failures to develop graphical relationships for predicting breach characteristics for erosion type breaches. Fread, D.L. (1988a). DAMBRK Model Theoretical Background / User Documentation., National Weather Service. June 20, Summary: This document is a description of the algorithm and a user s manual for creating and running simulations with the DAMBRK model. Fread, D.L. (1988b). Breach: An Erosion Model for Earthen Dam Failures. National Weather Service, July Summary: This document is a description of the algorithm and a user s manual for creating and running simulations with the BREACH model. U.S. Bureau of Reclamation, (1988). Downstream Hazard Classification Guidelines, ACER Technical Memorandum No. 11, Denver, CO, December 1988, 57pgs. Summary: This is a USBR developed set of guidelines divided into five parts, (1) Introduction, (2) Safety evaluation of existing dams downstream hazard classification scheme, (3) Estimating inundated area, (4) Identification of Hazards, (5) Concluding remarks. The work is this guideline is referenced frequently in other publications and includes many useful relationships that help the user evaluate the hazard potential and assess the hazard classification at USBR owned dams. Froehlich, D.C., (1990). Dam-Break Flood Modeling, Phd Dissertation, Colorado State University, Ft Collins, CO, Summer, 1990 Summary: The dissertation looks at dam breach analysis using regression methods and flood routing using an advanced mathematical algorithm. To wit; A numerical solution scheme based on the Galerkin finite element method using Hermite cubic basis functions was found to possess 31
38 February 10, 2010 Guidelines for Dam Breach Analysis desirable properties by examining the eigenvalues of a Fourier series solution of the linearized equation set. Von Thun, J.L., and Gillette, A.M., (1990). Guidance on Breach Parameters, Unpublished internal document, U.S. Bureau of Reclamation, Denver, CO, March 13, 1990 Summary: A technical note that uses empirical data to estimate breach parameters for embankment dams. Database used includes 57 dam failures tabulated by Froehlich (1987) MacDonald & Langridge-Monopolis (1984), 37 of which were 30 feet or more in height. Recommendations are primarily for dams over 30 feet in height. Guidance for assumed trapezoidal breach geometry includes side slope angles, breach width at mid-height, and time of failure. Dewey, R.L., and Gillette, A.M., (1993). Prediction of Embankment Dam Breaching for Hazard Assessment, in, Proceedings ASCE Specialty Conference on Geotechnical Practice in Dam Rehabilitation, ASCE Special Pub. 35, Raleigh, N.C., April 25-28, 1993 Summary: This paper presents a practical approach to breach prediction for use in safety evaluations of small to medium-sized embankment dams subject to overtopping. The method described includes determination whether tractive forces are sufficient to begin erosion. If so, the method determines breach geometry and rate using comparison with 60 data sets of dam breach case histories. Federal Energy Regulatory Commission (FERC), (1993). FERC Engineering Guidelines, Appendix II-A, DAMBREAK STUDIES. Washington, D.C., October, Summary: This document provides guidance on performing dambreak studies on dams that fall under the jurisdiciton of the Federal Energy Regulatory Commission. U.S. Army Corps of Engineers, (1993). Engineering Manual EM , River Hydraulics, Department of the Army, Washington, D.C., October 15, 1993, 176 pgs Summary: This manual presents basic principles and technical procedures for analysis of open channel flows in natural river systems. U.S. Army Corps of Engineers, (1994). Engineering Manual EM , Flood-Runoff Analysis, Department of the Army, Washington, D.C., August 31, 1994, 214 pgs Summary: This manual describes methods for evaluating flood-runoff characteristics of watersheds. Froehlich, D. C., (1995a). Peak Outflow from Breached Embankment Dam, Journal of Water Resources Planning and Management, Vol. 121, No. 1, January/February pgs Summary: Analysis of 22 dam failures using multiple regression analysis to develop new empirical expressions for rapidly estimating peak outflow from breached dams. Froehlich, D. C., (1995b). Embankment Dam Breach Parameters Revisited, Water Resources Engineering, Proceedings of the 1995 Conference on Water Resources Engineering, San Antonio, Texas, August 14-18, 1995, pgs Summary: Analysis of 63 embankment dam failures using multiple regression analysis to develop revised empirical expressions for rapidly estimating the average breach width in meters (based on reservoir volume in m 3 and dam height in meters), a side slope ratio is suggested, and an equation for breach formation time in hours is presented. Paquier, A., Nogues, P., Herledan, R., (Post 1995), Model of Piping in Order to Compute Dam-Break Wave, Source unknown, date unknown. 32
39 Guidelines for Dam Breach Analysis February 10, 2010 Summary: This short paper discusses two numerical models: Renard and Rupro. These models can be used to predict hydrographs and peak discharge from piping failures. It appears these are French or European models. Input includes mean diameter of the soil particles in the embankment. A pipe is created and once expanded to 2/3 of the dam height, the pipe collapses and breaching initiates. Walder, J.S., O Connor, J.E., (1997). Method of Predicting Peak Discharge of Floods Caused by Failure of Natural and Constructed Earthen Dams, Water Resources Research, Vol. 33, No. 10, pgs Summary: This paper examines the relationship between reservoir volume, drop in the water level during the breaching and erosion rate to estimate peak discharge. Wahl, T.L., (1997). Predicting Embankment Dam Breach Parameters, A Needs Assessment, XXVIIth International Association of Hydraulic Engineering and Research (IAHR) Congress, San Francisco, CA, August 10-15, Summary: This paper is a precursor to the 1998 Wahl report described below. This paper briefly describes the role, importance and methods for predicting embankment dam breach parameters needed for analysis of potential dam-failure floods. A review of current methods for predicting breach parameters and modeling dam breach events is provided. The paper discusses needs and opportunities for improvements to dam breach simulation. Wahl, T.L., (1998). Prediction of Embankment Dam Breach Parameters, A Literature Review and Needs Assessment, Dam Safety Research Report DSO , Water Resources Research Laboratory, United State Department of the Interior, Bureau of Reclamation, Dam Safety Office, July, 54 pgs. Summary: This report examines the role, importance and methods for predicting embankment dam breach parameters needed for analysis of potential dam-failure floods. A review of current methods for predicting breach parameters and modeling dam breach events is provided. The report also discusses needs and opportunities for improvements to dam breach simulation. The report includes compilation of case histories and a workshop on the State-of-the-Art in dam breach analysis held Feb 10-11, Lecointe, G., (1999?). Breaching Mechanisms of Embankments; An Overview of Previous Studies and the Models Produced Summary: This paper provides an overview of previous studies in dam breaching including review of 15 conceptual models. This is a summary document that lists and describes the data and methods available at the time (1999). Wahl, T.L., (2001). The Uncertainty of Embankment Dam Breach Parameter Predictions Based on Dam Failure Case Studies, prepared for: USDA/FEMA Workshop on Issues, Resolution, and Research Needs Related to Dam Failure Analysis, June 26-28, 2001, Oklahoma City, OK. Summary: This paper uses the Wahl, 1998 database, and subsets thereof, as a basis for an uncertainty analysis. The uncertainty analysis is a complex statistical process that ultimately aides in risk analyses for dams. The uncertainty analysis process also reveals strengths and weakness of the various empirical methods available for estimating dam breach parameters and peak discharges. Atallah, T.A., (2002). A Review on Dams and Breach Parameter Estimation, A MS degree thesis, Virginia Polytechnic Institute and State University, Blacksburg, VA, January, Summary: The thesis presents a review and summary of available breach modeling and estimation methods with references cited through
40 February 10, 2010 Guidelines for Dam Breach Analysis Froehlich, D. C., and Tufail, M., (2004) Evaluation and use of Embankment Dam Breach Parameters and Their Uncertainties, in Proc., Dam Safety 2004, 21 th Annual Conf. of the Association of State Dam Safety Officials, ASDSO, Lexington, KY Summary: This paper is a precursor to the Froehlich, 2008 paper described below. It presents similar statistical methods of analysis include multivariate regression analysis as a way to determine bounds of breach parameter estimates and the associated uncertainties. McCook, D. K., (2004) A Comprehensive Discussion of Piping and Internal Erosion Failure Mechanisms, in Proc., Dam Safety 2004, 21 th Annual Conf. of the Association of State Dam Safety Officials, ASDSO, Lexington, KY Summary: This paper provides detailed definitions and descriptions of the piping mechanisms and internal erosion mechanisms and their differences. The paper discusses that piping is a process that is intergranular following no differential paths, and that internal erosion type flow follows cracks, pipe and other internal boundaries within a soil mass. It is shown that internal erosion is the mechanism most like responsible for piping failures of dams. Miller, A. (2004). HEC-RAS Short Course for the Department of Natural Resources, State of Colorado. Summary: This short course put on by Dr. Miller in Denver on October 16-18, 2004 focused on HEC-RAS for routing dam break floods, but also touched on hydrologic methods that can be used for the same purpose. Handouts from the course are available from some members of the Colorado Dam Safety Branch who attended the course. Vaskinn, K.A., et.al. (2004) Physical Modeling of Breach Formation, Large Scale Field Tests, in Proc., Dam Safety 2004, 21 th Annual Conf. of the Association of State Dam Safety Officials, ASDSO, Lexington, KY Summary: This paper provides a presentation and discussion of tests on embankments up to 6m tall on a river below a dam in Norway. Controlled tests on rockfill, clay and glacial moraine embankments were conducted. An overview of the initial observations and conclusions from the large scale field tests are provided. Goodell, C.R., (2005). Dam Break Modeling for Tandem Reservoirs A Case Study Using HEC-RAS and HEC-HMS, Journal of Hydraulic Engineering. Summary: This paper is a case history of a study performed on two dams in series. The use of HEC-RAS (unsteady mode) hydraulic and HEC-HMS hydrologic models are compared and contrasted. The discussion presents some useful methods for running unsteady HEC-RAS analysis and the pros and cons of unsteady hydraulic vs. hydrologic modeling for dam breach and routing analysis. Gee, Michael (USACE, HEC), (2006). HEC-RAS Example Upstream Storage Area Connected to a Channel with a Dam that Fails, Personal Communication. July, Summary: This document provides step-by-step instructions and an example application of utilizing a storage area within HEC-RAS to model a dam breach. Washington State (MGS Engineering Consultants), (2007). Dam Safety Guidelines, Technical Note 1: Dam Break Inundation Analysis and Downstream Hazard Classification, Washington State Department of Ecology Publication No E (revised), October, 34 pgs. Summary: This technical note provides assistance in conducting dam breach inundation analysis and assessing the downstream hazard posed by dam failure. This report highlights noteworthy methodologies developed by others. It provides equations for estimating peak breach discharges, and charts and tables for estimating attenuation relationships downstream of a failed dam. 34
41 Guidelines for Dam Breach Analysis February 10, 2010 Spreadsheet computations are available to estimate: breach dimensions, time of development, peak discharge, time to peak discharge, dam breach flood hydrograph, flood attenuation, flow velocities and travel time. Texas Commission on Environmental Quality (TCEQ), (2007). Hydrologic and Hydraulic Guidelines for Dams in Texas, Chapter 8 Dam Breach Analysis, Based on work performed by Freeze and Nichols, Inc. under contract to the TCEQ. Summary: These guidelines present a summary of the requirements for H&H studies for dams. Chapter 8 provides the guidelines for breach parameters, dam-breach models, breach inundation lengths, dams in sequence, inundation mapping and simplified breach methods. Interesting concepts include allowing simplified (equation) analysis for proposed and existing small dams and existing intermediate sized dams (defined by Texas). Full analysis is required for proposed intermediate sized dams and large dams. Froehlich, D. C., (2008). Embankment Dam Breach Parameters and Their Uncertainties, Journal of Hydraulic Engineering, Vol. 134, No. 12, May, pgs Summary: Study of data from 74 embankment dam failures was used to develop mathematical expressions for the expected values of final width and side slope of a trapezoidal breach along with its formation time. Variances of the predicted quantities are also calculated. Monte Carlo simulation is used to estimate degree of uncertainty of predicted peak breach flows. Hanson, G.J., Tejral, R.D., Temple, D.M., (2008). Breach Parameter and Simulation Comparisons, in Proc., Dam Safety 2008, 25 th Annual Conf. of the Association of State Dam Safety Officials, Indian Wells, CA, ASDSO, Lexington, KY Summary: This paper discusses the physically based breach simulation model SIMBA (Simplified Breach Analysis) developed as a research tool. SIMBA predictions for failure of dams ranging from 5 to 400 feet in height with varying materials are compared to predictions from the NRCS peak discharge breach equation. Results are discussed. Jamieson, S.L., and Ferentchak. J.A., (2008) Using Erosion Rate to Refine Earth Dam Breach Parameters, in Proc., Dam Safety 2008, 25 th Annual Conf. of the Association of State Dam Safety Officials, Indian Wells, CA, ASDSO, Lexington, KY Summary: Describes a proposed 5-step process relying on erosion rate to minimize subjective judgment when selecting breach parameters. Illustrated case studies of the process are provided to demonstrate the development of realistic breach parameters for earth dams. Macchione, F., (2008a). Model for Predicting Floods due to Earthen Dam Breaching. I: Formation and Evaluation, Journal of Hydraulic Engineering, Vol. 134, No. 12, May, pgs Summary: The aspects and use of a simple, physically based dam breach model is presented. The model output includes peak discharge and the entire outflow hydrograph. The model used a single calibration parameter for ease of use. Comparison of the model results with 12 case histories of dam failures with a discharge range of three orders of magnitude is presented. Macchione, F., and Rino, A., (2008b). Model for Predicting Floods due to Earthen Dam Breaching. II: Comparison with Other Methods and Predictive Use, Journal of Hydraulic Engineering, Vol. 134, No. 12, May, pgs Summary: This is a companion paper to 2008a. The study looks at the sensitivity of the breach side slope and an erosion-velocity parameter input parameter as well as the effect of the reservoir volume curve on the results of the model. The results of the proposed model are compared and contrasted with the results of previously published methods. Equations for prediction of the peak discharge and entire outflow hydrograph are presented. 35
42 February 10, 2010 Guidelines for Dam Breach Analysis Nodolf, J.M., Smith, J.B., Lantz, D., (2008) Sensitivity Analysis of Dam Breach Parameters for an Earthen Dam in Hawaii, in Proc., Dam Safety 2008, 25 th Annual Conf. of the Association of State Dam Safety Officials, Indian Wells, CA, ASDSO, Lexington, KY Summary: This paper presents an intensive analysis that utilized empirical equations, NWS- BREACH and HEC-RAS to define final breaching parameters used in a dam breach study of a 28-foot tall earth dam impounding 10,600 acre-ft of water. Pierce, M. W., Abt, S.R., and Thorton, C.I., (2008) Revision of Embankment Dam Breaching Regression Relationships, in Proc., Dam Safety 2008, 25 th Annual Conf. of the Association of State Dam Safety Officials, Indian Wells, CA, ASDSO, Lexington, KY Summary: Interim report on a study of dam breach equations to update the regression equations utilized to estimate peak outflow from breached embankment dams. Study built on data presented in Prediction of Embankment Dam Breach Parameters (Wahl, USBR DSO ). Preliminary finding presented. Wahl, T.L., et. al., (2008). Development of Next-Generation Embankment Dam Breach Models, Source unknown; appears to part of a larger report titled The Sustainability of Experience Investing in the Human Factor, pgs Summary: The Dam Safety Interest Group DSIG of CEA Technologies, Inc. (CEATI) is an international group of dam owners that pursues collaborative research on dam safety issues. This paper summarizes recent and planned activities of the group. Activities include advancing and improving methods of estimating dam breach discharges. Work is systematically being done to establish a good set of real world data from actual dam failures. These data will be used to verify numerical models. Work is also being performed in the laboratory to gain information on the erosion characteristics of embankment soils. Three numerical models have been identified for future work, SIMBA (NRCS), HR-BREACH (England), and FIREBIRD BREACH (Canada). These models show promise for making advances in physical-based modeling of dam failures. Future work of the group would include integration of new physical based models with HEC- RAS. Gee, D. M., (2009). Use of Embankment Erosion Models to Estimate HEC-RAS Dam Breach Parameters, in Proc., Dam Safety 2009, 26 th Annual Conf. of the Association of State Dam Safety Officials, Hollywood, FL, ASDSO, Lexington, KY Summary: Recent research into the use of embankment erosion process models to estimate breach parameters. Comparisons between process model (NWS-BREACH) outflow hydrographs and parametric model (HEC-RAS) outflow hydrographs are provided. 36
43 APPENDIX A CASE STUDY INVENTORY
44
45 GRASS VALLEY MAIN DAM BARTON PORTER (EAST) GRIZZLY MIDDLE FORK GRASS VALLEY EAST UPPER BLACK CREEK TOPONAS ROCK NOTTINGHAM LOST LAKE HIMMELLAND RODREICK BEAVER 7W GUEST RANCH Dam Name DAMID PIPING PIPING PIPING PIPING PIPING PIPING PIPING PIPING OVERTO P PIPING PIPING PIPING PIPING Failure Mode Minor Small Large ROLLED EARTH ROLLED EARTH ROCK FILL ROCK FILL ROLLED EARTH ROLLED EARTH ROLLED EARTH ROLLED EARTH ROLLED EARTH ROLLED EARTH ROLLED EARTH ROLLED EARTH ROLLED EARTH Construction Reservoir and Embankment Dimensions M & L M WA State Froehlich 1995 Froehlich HEC HMS HEC RAS X Sec Method Empirical Predictions NWS BREACH VERSION USACE HEC PROGRAM HEC RAS Storage Method Reservoir Volume V w AF Reservoir Surface Area A s AC Dam Height H w FT H b FT Crest Width C FT Average Width W avg FT Upstream + Downstream Slope Z u +Z b Breach Formation Factor BFF AF FT Storage Intensity SI AF/FT 0.68* 1.38* * Volume Eroded V er YD Average Breach Width B avg FT Breach Ratio B avg /H b 0.29* 0.43* * Time of Failure T f HR Erosion Rate ER FT/HR ER Ratio ER/H W 1/HR Peak Outflow Q P CFS SMPDBK Peak Outflow Q P SMPDBK CFS Volume Eroded V er YD Average Breach Width B avg FT Breach Ratio B avg /H b Time of Failure T f HR Erosion Rate ER FT/HR ER Ratio ER/H W 1/HR SMPDBK Peak Outflow Q P SMPDBK CFS Average Breach Width B avg FT Side Slopes Z Bottom Breach Width B b FT Breach Ratio B avg /H b Time of Failure T f HR Erosion Rate ER FT/HR ER Ratio ER/H W 1/HR Peak Outflow Q P CFS SMPDBK Peak Outflow Q P SMPDBK CFS Average Breach Width B avg FT Side Slopes Z Bottom Breach Width B b FT Breach Ratio B avg /H b Time of Failure T f HR Erosion Rate ER FT/HR ER Ratio ER/H W 1/HR SMPDBK Peak Outflow Q P SMPDBK CFS Peak Outflow QP CFS Time of Peak Outflow TP HR Top Width of Breach at TP BRW FT Side Slope of Breach Z FT/FT Bottom Width of Breach at TP BO FT Peak Outflow QP CFS Time of Peak Outflow TP HR Top Width of Breach at TP BRW FT Side Slope of Breach Z FT/FT Bottom Width of Breach at TP BO FT Peak Outflow QP CFS Time of Peak Outflow TP HR Top Width of Breach at TP BRW FT Side Slope of Breach Z FT/FT Bottom Width of Breach at TP BO FT Peak Outflow QP CFS Time of Peak Outflow TP HR Top Width of Breach at TP BRW FT Side Slope of Breach Z FT/FT Bottom Width of Breach at TP BO FT Empirical Model Selected for Input to HEC Models M&L M with WA Tf Adjusted M&L M with WA State Tf WA State Froehlich 2008 Froehlich 2008 Input Breach Width FT Input Breach Side Slope Z FT/FT Input Failure Time HR Input Progression Linear Sinewave Linear Sinewave Sinewave Input Piping Elevation FT Bottom Bottom N/A Bottom Bottom Notes Adjusted to Breach Peak Outflow CFS Time to Peak HR Input Breach Width FT 8.5x Input Breach Side Slope Z FT/FT N/A Input Failure Time HR Input Progression Linear Sinewave Linear Sinewave Sinewave Input Piping Elevation FT Bottom Bottom N/A Bottom Bottom Notes Piping Hole Only Peak Outflow CFS Time to Peak HR Input Breach Width FT 8.5x Input Breach Side Slope Z FT/FT N/A Input Failure Time HR Input Progression Linear Sinewave Linear Sinewave Sinewave Input Piping Elevation FT Bottom Bottom N/A Bottom Bottom Notes Piping hole Only Peak Outflow CFS Time to Peak HR *The SI and Breach Ratio for these dams indicates that a piping failure mode will not lead to a full breach as long as they are constructed of cohesive soils. The SMPDBK peak discharge should be ignored Overtopping Failure Overtopping Failure Overtopping Failure
46
47 APPENDIX B HEC-RAS EXAMPLE UPSTREAM STORAGE AREA CONNECTED TO A CHANNEL WITH A DAM THAT FAILS
48
49 !"# $"% &&#""'"&('%)!"%'&* ""+,,"" %-.'"/ "$
50 !"# %" " ""7 8%9&$ : & " ""7 8%9$!%%"% ""7 ++&$.("""" 8'% &&"%; ""7 &$7 +<$ =$# ""7 <8$ ""7 &$7 >81&.$ ""7 18$7 3&7 9""18 +'""1 "'"%&""$ """" "";"&&. '%'"/26'21A"$ B##$?"""7 1<" +&/26!"&"# "%&?"""7 3& %
51 #'()**)+#*)''* 5 %AC< +98&D' ""#E" &&" %8= &&& &&""(?"497 3&7 < 3&" %""( ""$"1 F&"" G"''" "''"D" """G&& $+%"'%! "!&$ G&&&#%!&""&$!
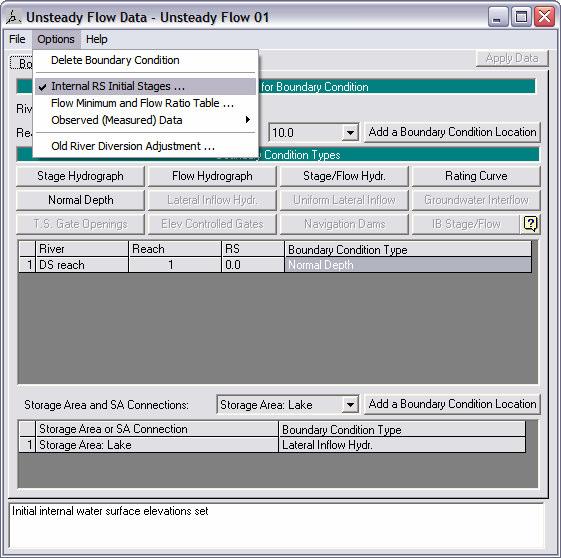
52 =
53 !8%%&! =8%%&%"8' %&&&;" &""""8"!" ;&"F &""*"2(

54 ""$1"" "'F-0HC"

55 "&'"" "'&""%&1&" ''" ($4&'%F ;,(,B(&
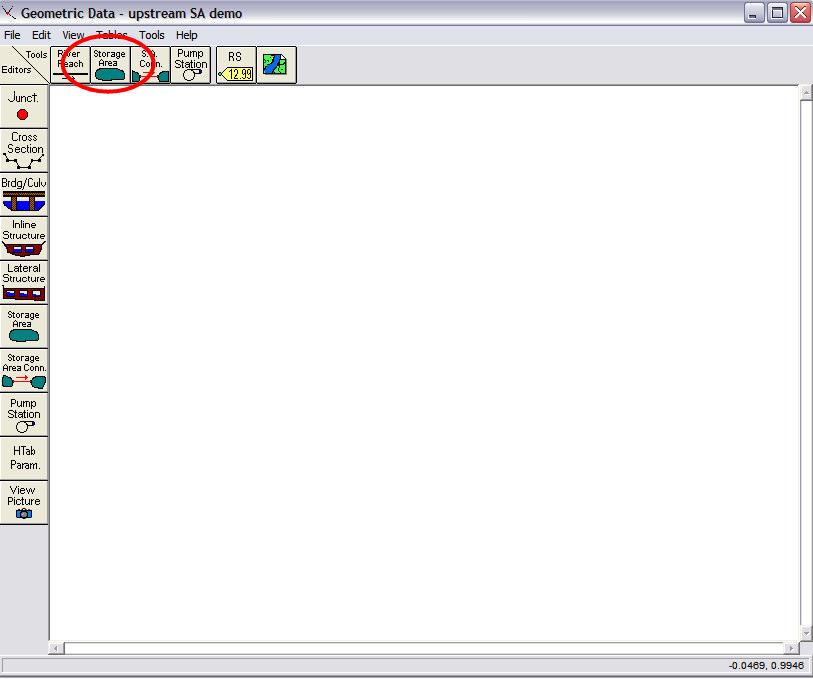
56 % H%%"" B

57 9%"%: & ",

58 !H"%%"%.%"&&%(
59

60 <%"&"$ /+<6"/6%"" 9%""". & ''+ +98%%&""$

61 =1"&!


62 .""$1" ";'! +! $ =
63 1""""""" "";"& &.''%'"/26' 21A"$+&/26" "&"&"# "%&
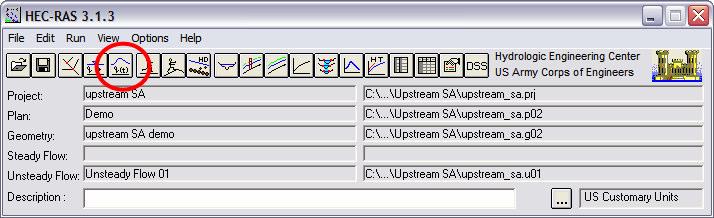

64

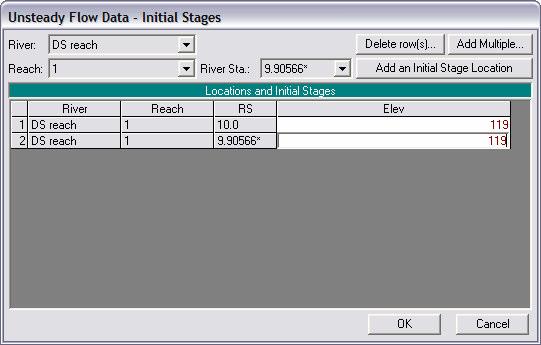
65 @

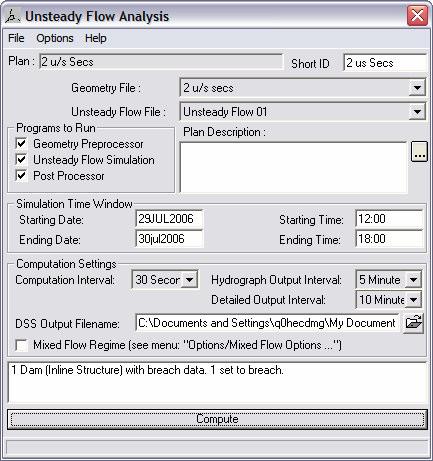
66 @CF"&&% B

67 BC8&""%&% "&%"%&"!"!"!"!"!"!"!",
Dam Break Analysis -A Review
 Dam Break Analysis -A Review 1 S. R. Kulkarni, 2 S. K. Ukarande, 3 Seema A. Jagtap 1 Civil Engineering Department, Yadavrao Tasgaonkar College of Engineering & Management, University of Mumbai, Maharashtra,
Failure Consequence Classification
 Failure Consequence Classification Audience: Dam Safety Officers (DSO) Owners of small dams Community emergency preparedness coordinators Introduction This document provides an overview of failure consequence
Breach Analyses of High Hazard Dams in Williamson County
 Breach Analyses of High Hazard Dams in Williamson County John R. King 1, P.E., Kim Patak 2, P.E., Blaine Laechelin 3, E.I.T. Abstract The Upper Brushy Creek WCID operates 23 dams in the Upper Brushy Creek
Bear Creek Dam and Reservoir NID# OR Douglas County, Oregon
 Bear Creek Dam and Reservoir NID# OR00614 Douglas County, Oregon FINAL Dam Breach Study and Flood Inundation Mapping March, 2009 Prepared for: The City of Drain, Oregon 129 West C Avenue Drain, OR 97435
Dam Breach Study and Flood Inundation Mapping
 Malheur Reservoir and Willow Creek Dam #3 NID# OR00390 Malheur County, Oregon Dam Breach Study and Flood Inundation Mapping February 2010 Prepared for: State of Oregon Water Resources Department 725 Summer
Prepared for Urban Drainage and Flood Control District
 BERM FAILURE TECHNICAL ANALYSES SOUTH PLATTE GRAVEL PIT EVALUATION CRITERIA Prepared for Urban Drainage and Flood Control District Wright Water Engineers, Inc. January 2013 121-030.000 TABLE OF CONTENTS
INFLOW DESIGN FLOOD CONTROL SYSTEM PLAN 40 C.F.R. PART PLANT YATES ASH POND 3 (AP-3) GEORGIA POWER COMPANY
 GEORGIA POWER COMPANY") INFLOW DESIGN FLOOD CONTROL SYSTEM PLAN 40 C.F.R. PART 257.82 PLANT YATES ASH POND 3 (AP-3) GEORGIA POWER COMPANY EPA s Disposal of Coal Combustion Residuals from Electric Utilities Final Rule (40 C.F.R.
INFLOW DESIGN FLOOD CONTROL SYSTEM PLAN 40 C.F.R. PART 257.82 PLANT YATES ASH POND 3 (AP-3) GEORGIA POWER COMPANY EPA s Disposal of Coal Combustion Residuals from Electric Utilities Final Rule (40 C.F.R.
ONE DIMENSIONAL DAM BREAK FLOOD ANALYSIS FOR KAMENG HYDRO ELECTRIC PROJECT, INDIA
 ONE DIMENSIONAL DAM BREAK FLOOD ANALYSIS FOR KAMENG HYDRO ELECTRIC PROJECT, INDIA S. Masood Husain Nitya Nand Rai Director Assistant Director Foundation Engineering & Special Analysis Directorate Central
Case Studies in Hazard Class Reductions Implementation of NY s Guidance for Dam Hazard Classification
 Case Studies in Hazard Class Reductions Implementation of NY s Guidance for Dam Hazard Classification Gregory J Daviero, PhD, PE, Principal Kevin Ruswick, PE, CFM, Associate May 2, 2014 Schnabel Engineering
Modernization of High Hazard Dams in Austin, Texas. TFMA Spring Conference May 23, 2007
 Modernization of High Hazard Dams in Austin, Texas TFMA Spring Conference May 23, 2007 Modernization of High Hazard Dams in Austin, Texas City of Austin Glen Taffinder, P.E. Stormwater Pond Dam Safety
The Texas A&M University and U.S. Bureau of Reclamation Hydrologic Modeling Inventory (HMI) Questionnaire
 Questionnaire") The Texas A&M University and U.S. Bureau of Reclamation Hydrologic Modeling Inventory (HMI) Questionnaire May 4, 2010 Name of Model, Date, Version Number Dynamic Watershed Simulation Model (DWSM) 2002
The Texas A&M University and U.S. Bureau of Reclamation Hydrologic Modeling Inventory (HMI) Questionnaire May 4, 2010 Name of Model, Date, Version Number Dynamic Watershed Simulation Model (DWSM) 2002
Levee Breach Modeling. The HR BREACH, AREBA and EMBREA breach prediction models
 Levee Breach Modeling The HR BREACH, AREBA and EMBREA breach prediction models Jonathan Simm (for Mark Morris) USSD Oakland levee workshop Nov 2015 Three groups of key issues to understand [1] Understanding
DICKINSON BAYOU WATERSHED STEERING COMMITTEE FINAL MEMBER CRITERIA COMPARISON
 DICKINSON BAYOU WATERSHED STEERING COMMITTEE FINAL MEMBER CRITERIA COMPARISON May 25, 2006 INTRODUCTION The Dickinson Bayou Watershed covers approximately 95.5 square miles and stretches from western Brazoria
Application for a Dam Permit Ash Basin No. 1
 Application for a Dam Permit Ash Basin No. 1 for the Sunbury Generating Station Shamokin Dam, Pennsylvania submitted to Commonwealth of Pennsylvania Department of Environmental Protection Bureau of Waterways
Volume II: Hazard Annex Dam Failure
 Volume II: Hazard Annex Dam Failure Causes and Characteristics of Dam Failure Dam Characteristics Dams are impervious structures that block the flow of water in a river or stream, capturing water behind
Ponds. Pond A water impoundment made by excavating a pit, or constructing a dam or an embankment.
 POND SITE SELECTION AND CONSTRUCTION Uses, Planning, & Design David Krietemeyer Area Engineer USDA-NRCS June 20, 2008 Uses Considerations for Location of Commonly Used Terms Pond A water impoundment made
STORM DRAINAGE DESIGN MANUAL
 Appendix I STORM DRAINAGE DESIGN MANUAL by: SUNGATE DESIGN GROUP, P.A. GEN ERAL DESIGN STAN DARDS AN D POLICIES 1. STREET AND LOCAL DRAINAGE Discharge estimates for specified design storms shall be calculated
Dam Break Analysis and Inundation Mapping, Case Study of Fincha a Dam in Horro Guduru Wollega Zone, Oromia Region, Ethiopia
 Science Research 2018; 6(2): 29-38 http://www.sciencepublishinggroup.com/j/sr doi: 10.11648/j.sr.20180602.11 ISSN: 2329-0935 (Print); ISSN: 2329-0927 (Online) Dam Break Analysis and Inundation Mapping,
HY-12 User Manual. Aquaveo. Contents
 Y-12 User Manual Aquaveo Contents Overview...2 Watershed Parameters...3 Channel Parameters...3 Storm Drain Parameters...3 Design of new systems...4 Analysis of existing systems...4 Steady flow...4 ydrographic
RETENTION BASIN EXAMPLE
 -7 Given: Total Tributary Area = 7.5 ac o Tributary Area within Existing R/W = 5.8 ac o Tributary Area, Impervious, Outside of R/W = 0.0 ac o Tributary Area, Pervious, Outside of R/W = 1.7 ac o Tributary
D.E. KARN GENERATING FACILITY BOTTOM ASH POND HAZARD POTENTIAL CLASSIFICATION ASSESSMENT REPORT. Assessment Report. Pursuant to 40 CFR 257.
 Hazard Potential Classification Assessment Report D.E. KARN GENERATING FACILITY BOTTOM ASH POND HAZARD POTENTIAL CLASSIFICATION ASSESSMENT REPORT Essexville, Michigan Pursuant to 40 CFR 257.73 Submitted
Hydraulic and Sediment Transport Modeling Strategy
 Appendix B Hydraulic and Sediment Transport May 2014 Technical Memorandum Channel Capacity Report September 2014 San Joaquin River Restoration Program Hydraulic and Sediment Transport The San Joaquin River
Water Control Structures Selected Design Guidelines Alberta Environment Page 13-1
 Alberta Environment Page 13-1 13.0 DROP INLET SPILLWAYS 13.1 General The drop inlet spillway is commonly used for providing flood protection for earth dams which have smaller reservoirs and/or smaller
III. INVENTORY OF EXISTING FACILITIES
 III. INVENTORY OF EXISTING FACILITIES Within the Growth Management Boundary, the existing storm drainage facilities are largely associated with development that has historically occurred in the ten drainage
Technical Memorandum. Hydraulic Analysis Smith House Flood Stages. 1.0 Introduction
 Technical Memorandum Hydraulic Analysis Smith House Flood Stages 1.0 Introduction Pacific International Engineering (PIE) performed a hydraulic analysis to estimate the water surface elevations of the
APPENDIX G HYDRAULIC GRADE LINE
 Storm Drainage 13-G-1 APPENDIX G HYDRAULIC GRADE LINE 1.0 Introduction The hydraulic grade line is used to aid the designer in determining the acceptability of a proposed or evaluation of an existing storm
Limited Visual Dam Safety Inspections OA Wahiawa Dam. Oahu, Hawaii
 Limited Visual Dam Safety Inspections OA00017 Wahiawa Dam Oahu, Hawaii Prepared by: U.S. ARMY CORPS OF ENGINEERS HONOLULU DISTRICT STATE OF HAWAII DEPARTMENT OF LAND AND NATURAL RESOURCES May 2006 Dam
Appendix F. Flow Duration Basin Design Guidance
 Appendix F Flow Duration Basin Design Guidance Appendix F FINAL REPORT F:\SC46\SC46.31\HMP Mar 05\Appendices\Appendix F FLY_HMP.doc MARCH 2005 Appendix F Flow Duration Basin Design Guidance Prepared by
Project Drainage Report
 Design Manual Chapter 2 - Stormwater 2A - General Information 2A-4 Project Drainage Report A. Purpose The purpose of the project drainage report is to identify and propose specific solutions to stormwater
MVP 17.3 WATER BAR END TREATMENT SIZING AND DETAILS 1/22/18
 MVP 17.3 WATER BAR END TREATMENT SIZING AND DETAILS 1/22/18 The purpose of this detail is to document the methodology developed to size the length of the water bar end treatments to ensure flow leaving
Chapter 11 Culverts and Bridges
 Chapter 11 Culverts and Bridges Contents 1.0 Introduction... 1 2.0 General Design... 1 2.1 Design Criteria... 1 2.2 Design Flows... 1 2.3 Permitting and Regulations... 1 2.4 Aesthetics and Safety... 2
APPENDIX E APPENDIX E ESTIMATING RUNOFF FOR SMALL WATERSHEDS
 APPENDIX E ESTIMATING RUNOFF FOR SMALL WATERSHEDS March 18, 2003 This page left blank intentionally. March 18, 2003 TABLES Table E.1 Table E.2 Return Frequencies for Roadway Drainage Design Rational Method
CCR Rule Design Criteria (a)(2) Periodic Hazard Potential Classification Assessment
(2) Periodic Hazard Potential Classification Assessment") CCR Rule Design Criteria 257.74(a)(2) Periodic Hazard Potential Classification Assessment FGD Pond 5 Naughton Power Plant Kemmerer, Wyoming October 30, 2017 PREPARED FOR PacifiCorp 1407 West North Temple
CCR Rule Design Criteria 257.74(a)(2) Periodic Hazard Potential Classification Assessment FGD Pond 5 Naughton Power Plant Kemmerer, Wyoming October 30, 2017 PREPARED FOR PacifiCorp 1407 West North Temple
Development of a Stage-Discharge Rating for Site Van Bibber Creek at Route 93
 Development of a Stage-Discharge Rating for Site 330 - Van Bibber Creek at Route 93 Prepared for: Urban Drainage and Flood Control District 2480 W. 26 th Avenue Suite 156-B Denver, CO 80211 May 19, 2006
Hydrologic Study Report for Single Lot Detention Basin Analysis
 Hydrologic Study Report for Single Lot Detention Basin Analysis Prepared for: City of Vista, California August 18, 2006 Tory R. Walker, R.C.E. 45005 President W.O. 116-01 01/23/2007 Table of Contents Page
CVEN 339 Summer 2009 Final Exam. 120 minutes allowed. 36 Students. No curve applied to grades. Median 70.6 Mean 68.7 Std. Dev High 88 Low 24.
 CVEN 339 Final Exam 120 minutes allowed 36 Students No curve applied to grades Median 70.6 Mean 68.7 Std. Dev. 13.7 High 88 Low 24.5 Name: CVEN 339 Water Resources Engineering Summer Semester 2009 Dr.
Final Drainage Report
 Thornton Electric Substation Project Final Drainage Report December 14, 2016 DRAFT Prepared for: Xcel Energy, 1800 Larimer Street, Suite 400, Denver, Colorado 80202 Prepared by: 350 Indiana Street, Suite
Appendix VI: Illustrative example
 Central Valley Hydrology Study (CVHS) Appendix VI: Illustrative example November 5, 2009 US Army Corps of Engineers, Sacramento District Prepared by: David Ford Consulting Engineers, Inc. Table of contents
Detention Pond Design Considering Varying Design Storms. Receiving Water Effects of Water Pollutant Discharges
 Detention Pond Design Considering Varying Design Storms Land Development Results in Increased Peak Flow Rates and Runoff Volumes Developed area Robert Pitt Department of Civil, Construction and Environmental
Asst.Prof.Dr. Jaafar S. Maatooq. 1 st Semester HYDRAULIC STRUCTUER, KINDS & FUNCTIONS 1 of 26
 1 st Semester HYDRAULIC STRUCTUER, KINDS & FUNCTIONS 1 of 26 1 st Semester HYDRAULIC STRUCTUER, KINDS & FUNCTIONS 2 of 26 Water is often more useful to people when it is properly controlled, conveyed,
Distribution Restriction Statement Approved for public release; distribution is unlimited.
 CECW-EH-Y Regulation No. 1110-2-1464 Department of the Army U.S. Army Corps of Engineers Washington, DC 20314-1000 Engineering and Design HYDROLOGIC ANALYSIS OF WATERSHED RUNOFF Distribution Restriction
Development of Stage-Discharge Ratings for Site 2240 Bear Creek at Cold Spring
 Development of Stage-Discharge Ratings for Site 2240 Bear Creek at Cold Spring Prepared for: Urban Drainage and Flood Control District 2480 W. 26 th Avenue Suite 156-B Denver, CO 80211 May 19, 2006 (Rev
TABLE OF CONTENTS. 1.0 Background Watershed Description Hydrology - HEC-HMS Models Hydraulics - HEC-RAS Models...
 TABLE OF CONTENTS 1.0 Background... 1 2.0 Watershed Description... 1 3.0 Hydrology - HEC-HMS Models... 2 3.1 Hydrologic Approach... 2 3.2 Drainage Areas... 2 3.3 Curve Numbers... 2 3.4 Lag Times... 3 3.5
Geneva Dam. Design of a Steep, Temporary, Riprap Ramp
 Geneva Dam Design of a Steep, Temporary, Riprap Ramp A Run-of of-river Dam Analysis for Geneva Dam Credit to: Yu-Chun Su, Ph.D., P.E., CFM David T. Williams. Ph.D., P.E, CFM Presentation Purpose History
Spring Forecast Based Operations, Folsom Dam, California
 Spring Forecast Based Operations, Folsom Dam, California Paul E. Pugner, P.E. Chief, Water Management Section Sacramento District U.S. Army 1325 J Street, Room 1126 Sacramento, CA 95814-2922 Tel: (916)
WinTR-55 Small Watershed Hydrology
 WinTR-55 Small Watershed Hydrology Intermediate WinTR-55 Training Modeling Watersheds with Structures SEE NOTES AT CLASS EXERCISE #4. 1 Course Outline Overview Review of Hydrology Terms Modeling Single
Chapter 4. Drainage Report and Construction Drawing Submittal Requirements
 4.0 Introduction The requirements presented in this section shall be used to aid the design engineer or applicant in the preparation of drainage reports, drainage studies, and construction drawings for
Transient Seepage Analyses of Soil-Cement Uplift Pressures During Reservoir Drawdown
 Transient Seepage Analyses of Soil-Cement Uplift Pressures During Reservoir Drawdown Robert J. Huzjak 1, P.E., M. ASCE, Adam B. Prochaska 2, Ph.D., A.M. ASCE, and James A. Olsen 3, A.M. ASCE 1 President,
Distribution Restriction Statement Approved for public release; distribution is unlimited.
 CECW-EH-Y Engineer Regulation 1110-8-2(FR) Department of the Army U.S. Army Corps of Engineers Washington, DC 20314-1000 Engineering and Design INFLOW DESIGN FLOODS FOR DAMS AND RESERVOIRS ER 1110-8-2(FR)
Learning objectives. Upon successful completion of this lecture, the participants will be able to describe:
 Solomon Seyoum Learning objectives Upon successful completion of this lecture, the participants will be able to describe: The different approaches for estimating peak runoff for urban drainage network
CONSTRUCTION PLAN CHECKLIST
 CONSTRUCTION PLAN CHECKLIST The design engineer is responsible for ensuring that plans submitted for city review are in accordance with this checklist. It is requested that the executed checklist be submitted
APPENDIX E ESTIMATING RUNOFF FROM SMALL WATERSHEDS
 ESTIMATING RUNOFF FROM SMALL WATERSHEDS June 2011 THIS PAGE LEFT BLANK INTENTIONALLY. June 2011 TABLES Table E.1 Table E.2 Return Frequencies for Roadway Drainage Design Rational Method Values June 2011
Chapter 6. Hydrology. 6.0 Introduction. 6.1 Design Rainfall
 6.0 Introduction This chapter summarizes methodology for determining rainfall and runoff information for the design of stormwater management facilities in the City. The methodology is based on the procedures
Appendix Q Draft Location Hydraulic Study Report For the State Route 32 Widening Between Fir Street and Yosemite Drive at Dead Horse Slough and South
 Appendix Q Draft Location Hydraulic Study Report For the State Route 32 Widening Between Fir Street and Yosemite Drive at Dead Horse Slough and South Fork Dead Horse Slough in the, California Draft Location
Via October Mr. William Neal, P.E. Technological Specialist DTE Electric Company One Energy Plaza Detroit, MI 48226
 17 October 2016 134 N. La Salle Street, Suite 300 Chicago, Illinois 60602 PH 312.658.0500 FAX 312.658.0576 www.geosyntec.com Via Email Mr. William Neal, P.E. Technological Specialist DTE Electric Company
APPENDIX IV. APPROVED METHODS FOR QUANTIFYING HYDROLOGIC CONDITIONS OF CONCERN (NORTH ORANGE COUNTY)
") APPENDIX IV. APPROVED METHODS FOR QUANTIFYING HYDROLOGIC CONDITIONS OF CONCERN (NORTH ORANGE COUNTY) Hydromodification design criteria for the North Orange County permit area are based on the 2- yr, 24-hr
APPENDIX IV. APPROVED METHODS FOR QUANTIFYING HYDROLOGIC CONDITIONS OF CONCERN (NORTH ORANGE COUNTY) Hydromodification design criteria for the North Orange County permit area are based on the 2- yr, 24-hr
Technical Memorandum
 Tucson Office 3031 West Ina Road Tucson, AZ 85741 Tel 520.297.7723 Fax 520.297.7724 www.tetratech.com Technical Memorandum To: Kathy Arnold From: Greg Hemmen, P.E. Company: Rosemont Copper Company Date:
INFLOW DESIGN FLOOD CONTROL SYSTEM PLAN PLANT GREENE COUNTY ASH POND ALABMA POWER COMPANY
 INFLOW DESIGN FLOOD CONTROL SYSTEM PLAN PLANT GREENE COUNTY ASH POND ALABMA POWER COMPANY Section 257.82 of EPA s regulations requires the owner or operator of an existing or new CCR surface impoundment
Address for Correspondence
 Research Paper DYNAMIC FLOOD ROUTING AND UNSTEADY FLOW MODELLING: A CASE STUDY OF UPPER KRISHNA RIVER 1 Doiphode Sanjay L* 2 Oak Ravindra A. Address for Correspondence 1 M tech Student, Bharati Vidyapeeth
Report. Inflow Design Flood Control System Plan Belle River Power Plant East China, Michigan. DTE Energy Company One Energy Plaza, Detroit, MI
 Report Inflow Design Flood Control System Plan Belle River Power Plant East China, Michigan DTE Energy Company One Energy Plaza, Detroit, MI October 14, 2016 NTH Project No. 62-160047-04 NTH Consultants,
Irrigation System. BWCDD Zanjero Training 2/13/2008
 Irrigation System BWCDD Zanjero Training Session #7 2/13/2008 Irrigation System The (main) intake structure t directs water from the source of supply, such as a reservoir or a river, into the irrigation
Informational Meeting- March 31, Boxelder B-2/B-3 Watershed Planning Study
 Informational Meeting- March 31, 2016 Boxelder B-2/B-3 Watershed Planning Study Agenda Introductions Work Completed to Date Phase 1 Evaluations Alternatives Evaluations Economic Evaluations Draft Watershed
Earth Brickwork Concrete Plain Radial Drum Roller Flap. fixed. Weirs Barrages. mobile. rockfills. Gravity butress Arch Arch-gravuty Cupola.
 Dams type 1 Weirs Barrages fixed mobile Earth Brickwork Concrete Plain Radial Drum Roller Flap embankment Earthfills rockfills Dams Concrete gravity Arch Gravity butress Arch Arch-gravuty Cupola 2 Dams
CHOLLA POWER PLANT BOTTOM ASH POND INFLOW DESIGN FLOOD CONTROL SYSTEM PLAN CH_Inflowflood_003_
 CHOLLA POWER PLANT BOTTOM ASH POND INFLOW DESIGN FLOOD CONTROL SYSTEM PLAN CH_Inflowflood_003_20161017 This Inflow Design Flood Control System Plan (Plan) document has been prepared specifically for the
Basic Design of Replogle Flumes
 ITRC Report No. R 02-010 IRRIGATION TRAINING AND RESEARCH CENTER California Polytechnic State University San Luis Obispo, California 93407 www.itrc.org Basic Design of Replogle Flumes Replogle flumes are
Pajaro River Watershed Flood Prevention Authority. Phase 3 and 4a. Pajaro River Watershed Study
 Pajaro River Watershed Flood Prevention Authority Phase 3 and 4a FEBRUARY 2005 Funding for this project has been provided in full or in part through a contract with the SWRCB pursuant to the Costa-Machado
Analyzing Flood Risk from the I&M Canal s Non-Levee Embankments A Modified Application of FEMA s Natural Valley Procedure
 Analyzing Flood Risk from the I&M Canal s Non-Levee Embankments A Modified Application of FEMA s Natural Valley Procedure Tiffany Coleman, PE Senior Project Engineer Stantec/STARR September 10, 2015 How
HYDRODYNAMIC NUMERICAL MODELLING OF DAM FAILURE AND IMPACTS ASSESSMENT OF SUSU DAM WITH MIKE
 HYDRODYNAMIC NUMERICAL MODELLING OF DAM FAILURE AND IMPACTS ASSESSMENT OF SUSU DAM WITH MIKE MOHD RASHID MOHD SHAH 1, LARIYAH MOHD SIDEK 1, MOHD RUZAIMEI YALIT 1, MOHANADOSS PONRAJ 1 & HIDAYAH BASRI 1
Current U.S. Army Corps of Engineers' Policy and Guidance for Seismic Design of Dams
 Current U.S. Army Corps of Engineers' Policy and Guidance for Seismic Design of Dams by Anjana Chudgar 1 and Enrique E. Matheu 2 ABSTRACT The seismic design of concrete hydraulic structures (concrete dams,
VII - WATER CONTROL PLAN
 VII - WATER CONTROL PLAN 7-01. General Objectives. Regulation of Saylorville Lake in conjunction with Lake Red Rock provides flood control benefits along both the Des Moines and Mississippi Rivers. Additionally,
A Brief History of Dams in Iraq. The Case of Mosul Dam Presented to Al-Diwan, April 10, 2016 by Mosaid Al-Hussaini, Ph.D, PE
 A Brief History of Dams in Iraq The Case of Mosul Dam Presented to Al-Diwan, April 10, 2016 by Mosaid Al-Hussaini, Ph.D, PE Dams in General Definition of a Dam: A dam is a barrier made of soil, concrete
2
 1 2 3 4 5 6 The program is designed for surface water hydrology simulation. It includes components for representing precipitation, evaporation, and snowmelt; the atmospheric conditions over a watershed.
Dam Failure Analysis. Olivotti Lake Dam. Houle Enterprises, LLC. (Final) Oshkosh, Wisconsin. Lincoln County, Wisconsin. Report prepared for
 Oshkosh, Wisconsin. Lincoln County, Wisconsin. Report prepared for") Dam Failure Analysis (Final) Olivotti Lake Dam Lincoln County, Wisconsin Report prepared for Houle Enterprises, LLC Oshkosh, Wisconsin Report prepared by www.meadhunt.com July 2012 Table of Contents Table
Dam Failure Analysis (Final) Olivotti Lake Dam Lincoln County, Wisconsin Report prepared for Houle Enterprises, LLC Oshkosh, Wisconsin Report prepared by www.meadhunt.com July 2012 Table of Contents Table
Conduits through Embankment Dams
 Conduits through Embankment Dams Best Practices for Design, Construction, Problem Identification and Evaluation, Inspection, Maintenance, Renovation, and Repair L-266/September 2005 Introduction Conduits
THE RATIONAL METHOD FREQUENTLY USED, OFTEN MISUSED
 THE RATIONAL METHOD FREQUENTLY USED, OFTEN MISUSED Mark Pennington, Engineer, Pattle Delamore Partners Ltd, Tauranga ABSTRACT The Rational Method has been in use in some form or another at least since
Water Resources Management Plan
 P L Y M O U T H M I N N E S O T A Appendix D: The developed a to analyze and minimize the impact of existing and future development on the City s natural resources. It is important to the City to have
BMP Design Aids. w w w. t r a n s p o r t a t i o n. o h i o. g o v. Equations / Programs
 BMP Design Aids 1 Equations / Programs Outlet Discharge Equations Hydrograph and Pond Routing Programs USGS StreamStats 2 Ohio Department of Transportation 1 Training Intent Introduction and overview of
Appendix J Hydrology and Hydraulics
 Appendix J Hydrology and Hydraulics Marsh Lake Dam Ecosystems Restoration Feasibility Study Hydraulics & Hydrology Appendix January 2011 Contents List of Figures iii List of Tables iii I. General 1 II.
INFLOW DESIGN FLOOD CONTROL SYSTEM PLAN PLANT GASTON GYPSUM POND ALABAMA POWER COMPANY
 INFLOW DESIGN FLOOD CONTROL SYSTEM PLAN PLANT GASTON GYPSUM POND ALABAMA POWER COMPANY Section 257.82 of EPA s regulations requires the owner or operator of an existing or new CCR surface impoundment or
Keywords: Breach width; Embankment dam; Uncertainty analysis, neuro-fuzzy.
 ESTIMATION OF DAM BREACH WIDTHS USING A NEURO-FUZZY COMPUTING TECHNIQUE Lubna S. Bentaher 1 and Hasan G. Elmazoghi 2 1 University of Benghazi, Civil Eng. Dept., Email: lubna.bentaher@benghazi.edu.ly 2
Constructed Wetland Channel T-9
 Description A constructed wetland channel is a conveyance BMP that is built, in part, to enhance stormwater quality. Constructed wetland channels use dense vegetation to slow down runoff and allow time
5/11/2007. WinTR-55 for Plan Reviews Small Watershed Hydrology Overview
 WinTR-55 for Plan Reviews Small Watershed Hydrology Overview 1 Overview Course Outline Historical Background Program Description Model Capabilities and Limitations This is the Overview portion of the training.
SECTION 4 STORM DRAINAGE
 4.01 GENERAL SECTION 4 STORM DRAINAGE These standards shall provide minimum requirements for the design of Storm Drainage and related appurtenances within the City of West Sacramento rights of way and
Hydraulic Design of Highway Culverts HDS 5 September 1985
 Hydraulic Design of Highway Culverts HDS 5 September 1985 Welcome to HDS 5 - Hydraulic Design of Highway Culverts Table of Contents Preface Tech Doc U.S. - SI Conversions DISCLAIMER: During the editing
STUDY AND ANALYSIS OF ASA RIVER HYPOTHETICAL DAM BREAK USING HEC-RAS
 Nigerian Journal of Technology (NIJOTECH) Vol. 36, No. 1, January 2017, pp. 315 321 Copyright Faculty of Engineering, University of Nigeria, Nsukka, Print ISSN: 0331-8443, Electronic ISSN: 2467-8821 www.nijotech.com
INFLOW DESIGN FLOOD CONTROL SYSTEM PLAN. Bremo Power Station CCR Surface Impoundment: North Ash Pond INFLOW DESIGN FLOOD
 INFLOW DESIGN FLOOD CONTROL SYSTEM PLAN INFLOW DESIGN FLOOD CONTROL SYSTEM PLAN Bremo Power Station CCR Surface Impoundment: North Ash Pond Submitted To: Bremo Power Station 1038 Bremo Bluff Road Bremo
Dawson County Public Works 25 Justice Way, Suite 2232, Dawsonville, GA (706) x 42228
 x 42228") Dawson County Public Works 25 Justice Way, Suite 2232, Dawsonville, GA 30534 (706) 344-3500 x 42228 DAWSON COUNTY STORM WATER REVIEW CHECKLIST Project Name: Property Address: Engineer: Fax #/Email: Date:
Dawson County Public Works 25 Justice Way, Suite 2232, Dawsonville, GA 30534 (706) 344-3500 x 42228 DAWSON COUNTY STORM WATER REVIEW CHECKLIST Project Name: Property Address: Engineer: Fax #/Email: Date:
ROLES AND RESPONSIBILITIES Small Pond Approval. SWM MD-378 Pond Checklist Training 10/17/07. Exemptions EMBANKMENT HEIGHT. Height of Dam Weir Wall
 SWM MD-378 Pond Checklist Training 10/17/07 Ken Wolfe Warren Johnson USDA, NRCS Frederick, Maryland ROLES AND RESPONSIBILITIES Small Pond Approval MDE, WMA, Dam Safety Division Authority (COMAR 26.17.04.03)
Coal Combustion Residuals Inflow Design Flood Control System Plan
 gaiconsultants.com I transforming ideas into reality., Coal Combustion Residuals Inflow Design Flood Control System Plan Virginia Electric and Power Company Possum Point Power Station Surface Impoundment
Drop Height For Channel Erosion Control
 Drop Height For Channel Erosion Control James C.Y. Guo, Professor and Director Department of Civil Engineering, U. of Colorado at Denver, Denver, Colorado 8017 E-mail: James.Guo@cudenver.edu Introduction
AMERICAN ELECTRIC POWER (SWEPCO)
") 2016 DAM & DIKE INSPECTION REPORT ASH PONDS GERS-16-163 WELSH POWER PLANT AMERICAN ELECTRIC POWER (SWEPCO) CASON, TEXAS NATIONAL INVENTORY NO. TX4357 PREPARED BY GEOTECHNICAL ENGINEERING AEP SERVICE CORPORATION
2016 DAM & DIKE INSPECTION REPORT ASH PONDS GERS-16-163 WELSH POWER PLANT AMERICAN ELECTRIC POWER (SWEPCO) CASON, TEXAS NATIONAL INVENTORY NO. TX4357 PREPARED BY GEOTECHNICAL ENGINEERING AEP SERVICE CORPORATION
TOWN OF MANCHESTER PLANNING AND ZONING COMMISSION Subdivision Application Minimum Submission Requirements
 TOWN OF MANCHESTER PLANNING AND ZONING COMMISSION Subdivision Application Minimum Submission Requirements This checklist is to be completed and submitted with all Subdivision Applications. The Town reserves
Flood Control District of Maricopa County Dam Safety Program
 2015 Annual ASCE/ASHE State Conference Flood Control District of Maricopa County Dam Safety Program Presented by: Tom Renckly, P.E. Dam Safety Branch Manager PPM Division, FCDMC Powerline FRS 2 Background
INFLOW DESIGN FLOOD CONTROL SYSTEM PLAN 40 C.F.R. Part PLANT MCINTOSH ASH POND 1 GEORGIA POWER COMPANY
 INFLOW DESIGN FLOOD CONTROL SYSTEM PLAN 40 C.F.R. Part 257.82 PLANT MCINTOSH ASH POND 1 GEORGIA POWER COMPANY EPA s Disposal of Coal Combustion Residuals from Electric Utilities Final Rule (40 C.F.R. Part
Lewisville Dam. Draft Dam Safety Modification Environmental Assessment Public Review
 Lewisville Dam Draft Dam Safety Modification Environmental Assessment Public Review Stacy Gray (Project Manager) U.S. Army Corps of Engineers, Fort Worth District 27 September 2016 US Army Corps of Engineers
LDS Technical Guidance
 May 21, 2008 The following was provided to County staff as internal guidance for reviewers in applying the adequate outfall requirements of the Public Facilities Manual (PFM). A number of private sector
The South Florida Water Management
 FWRJ Design of Treatment Wetlands to Improve Everglades Water Quality Fernando Navarrete, Panneer Shanmugam, and Matthew Alexander The South Florida Water Management District (SFWMD) has finalized the
INFLOW DESIGN FLOOD CONTROL SYSTEM PLAN 40 C.F.R. PART PLANT YATES ASH POND B (AP-B ) GEORGIA POWER COMPANY
 GEORGIA POWER COMPANY") INFLOW DESIGN FLOOD CONTROL SYSTEM PLAN 40 C.F.R. PART 257.82 PLANT YATES ASH POND B (AP-B ) GEORGIA POWER COMPANY EPA s Disposal of Coal Combustion Residuals from Electric Utilities Final Rule (40 C.F.R.
INFLOW DESIGN FLOOD CONTROL SYSTEM PLAN 40 C.F.R. PART 257.82 PLANT YATES ASH POND B (AP-B ) GEORGIA POWER COMPANY EPA s Disposal of Coal Combustion Residuals from Electric Utilities Final Rule (40 C.F.R.
Hydrotechnical Design Guidelines for Stream Crossings
 Hydrotechnical Design Guidelines for Stream Crossings Introduction Design of stream crossings and other in-stream highway facilities requires estimation of design highwater elevation and mean channel velocity.
Title Advanced Hydraulic Modeling to Support Emergency Action Plans
 Title Advanced Hydraulic Modeling to Support Emergency Action Plans Abstract Freese and Nichols, Inc. (FNI) developed an Emergency Action Plan (EAP) for a Levee Improvement District (LID) located in a