Breach Analyses of High Hazard Dams in Williamson County
|
|
|
- Sarah Thornton
- 6 years ago
- Views:
Transcription
1
2
3
4 Breach Analyses of High Hazard Dams in Williamson County John R. King 1, P.E., Kim Patak 2, P.E., Blaine Laechelin 3, E.I.T. Abstract The Upper Brushy Creek WCID operates 23 dams in the Upper Brushy Creek Watershed in Williamson County, one of the fastest growing counties in Texas. A variance to the state s dam safety criteria, approved by the TCEQ in 2003, requires the District to perform dam breach analyses and develop flood inundation mappings as part of the emergency action plans for its high hazard dams. The methodology for development of the breach parameters, performance of the breach and flood routing analyses, and mappings of the breach flood waves are discussed for four District high hazard dams. Introduction When the 23 dams in the Upper Brushy Creek Watershed in southern Williamson County were built by the U.S. Soil Conservation Service in the 1960s, they met all dam safety standards for earthen dams in sparsely populated areas. Now the same dams provide flood control for one of Central Texas fastest growing areas. The Upper Brushy Creek Water Control and Improvement District (District) is addressing the dilemma that these low-to-high hazard dams were built to standards designed for rural populations, but are now located in urban areas with rapid development. igure 1 shows the District s boundaries and the location of its 23 dams. Current state dam safety criteria in the Texas Administrative Code (TAC), Title 30, Chapter 299 DAMS AND RESERVOIRS, requires all High hazard potential classified dams to safely pass 100% of the probable maximum flood (PM). With respect to the District s dams, reese and Nichols, Inc. (NI) has interpreted safely pass to mean that the dam does not fail. A 2000 study performed by NI, on behalf of the original WCID, estimated the cost to modernize the dams, or to bring them into compliance with state dam safety regulations (i.e. safely passing 100% of the PM) was cost prohibitive. However, if approved by the TCEQ as a variance, implementing the cafeteria plan approach would result in modernization costs that could be funded by a reasonable ad valorem property tax. This approach was recommended by the TCEQ (formerly TNRCC) Executive Director s Task orce on Dam Safety in The TCEQ approved the variance in 2003 allowing the WCID to implement the cafeteria plan for all its 23 dams. That same year the WCID watershed voters approved a 2 cents ad valorem tax to fund the dam modernization program. 1 Principal, reese & Nichols, Inc., Jollyville Road, Building 4, Suite 100, Austin, Texas 78759, (512) Project Engineer, reese & Nichols, Inc., Jollyville Road, Building 4, Suite 100, Austin, Texas 78759, (512) Graduate Engineer, reese & Nichols, Inc., Jollyville Road, Building 4, Suite 100, Austin, Texas 78759, (512)
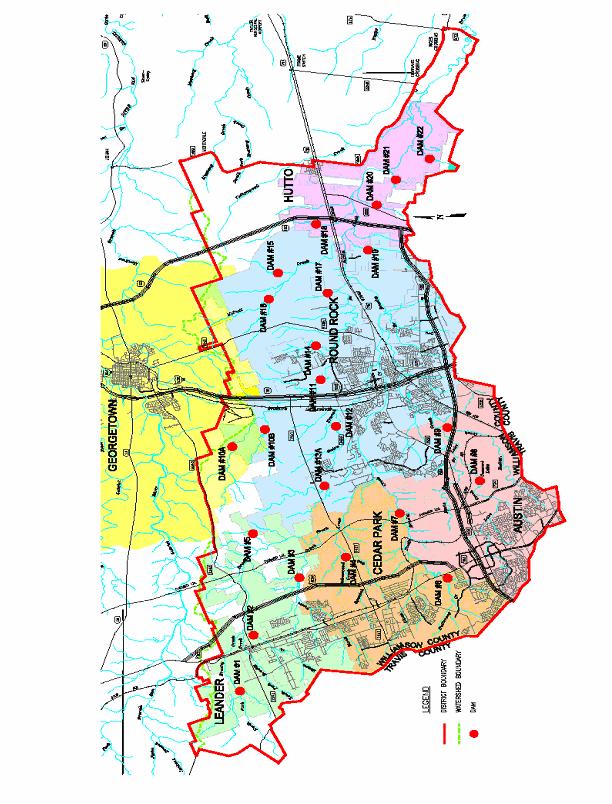
5 IGURE 1 2
6 The TCEQ s approved variance did not specifically detail the design criteria for the cafeteria plan. NI, through a 50/50 grant from the Texas Water Development Board (TWDB), conducted a detailed study of the requirements to implement the cafeteria plan specifically for the District s dam modernization program. The results of the study were approved by the TWDB and the TCEQ, and the final report Programming Study for the upper Brushy Creek WCID Dam Modernization Program, Williamson County, Texas was issued in September of One of the central tenets of the cafeteria plan is to allow a high hazard potential dam to safely pass between 50% to 100% of the PM, rather than 100% of the PM. However, if the hydraulic capacity of the dam is less than 100% of the PM, then a range (i.e. menu) of nonstructural options are to be implemented to mitigate the potential loss of life if the dam breaches, including: The District must install an early warning system (EWS) at the dam. The District must develop an emergency action plan (EAP) for the dam and the downstream floodplain. The District must establish an operation and maintenance program (OMP) for the dam. The District must develop an instrumentation and monitoring program (IMP) for the dam. The District must develop a formal dam safety inspection program for the dam. The District must implement a records keeping system. The District must develop a public information program. A key component of the cafeteria plan for a dam that does not safely pass 100% of the PM is development of the EWS in conjunction with the EAP, in order to provide effective evacuation of the public below the dam. An effective EWS and EAP provides a direct warning to evacuate the public at least 1½ hours before the breach wave reaches the area per U.S. Bureau of Reclamation research. or the EWS and EAP to be effective, one critical element is to provide, as accurately as possible, inundation mapping of the dam breach s floodplain to identify the residential areas that are to be evacuated, the roads to be closed, and the critical infrastructure and service to be protected. The remainder of this paper documents the method used to develop the breach parameters to comply with the TCEQ s variance and with the TWDB s programming study criteria for implementation of the cafeteria plan, and the development of the breach mapping for the PM and sunny-day events. Document Source for Breach Parameters The following two technical sources were used as the basis of deriving the dam breach parameters: Wahl, Tony L., 2004, Uncertainty of Predictions of Embankment Dam Breach Parameters, Journal of Hydraulic Engineering, American Society of Civil Engineering, Vol. 130, No. 5, May 1,
7 Wahl, Tony L., 1998, Prediction of Embankment Dam Breach Parameters, A Literature Review and Needs Assessment, DSO Dam Safety Research Report, Water Resources laboratory, dam Safety office, Bureau of Reclamation, U.S. Department of the Interior, July General Embankment Breach Parameters The embankment overtopping breach condition has four primary input parameters: average width of the ultimate breach configuration top and bottom elevations of the ultimate breach configuration breach side slopes time of breach formation The embankment piping breach condition has five primary input parameters: average breach width of the ultimate breach configuration top elevation of the ultimate breach configuration breach side slopes centerline elevation of initial piping location time of breach formation Specific Embankment Overtopping Breach Parameters General. Tony Wahl (Wahl) used a database of 108 documented dam failures to assess the statistical uncertainty of using four standard methods to develop the average breach width and time of breach formation parameters: Bureau of Reclamation (1998) MacDonald & Langridge-Monopolis (1984) Von Thun & Gillette (1990) roehlich (1995a) Table 1 in the ASCE Hydraulics Journal article summarizes the average breach width equations and the failure time equations of these methods. Table 1 also summarizes the 95% prediction interval around the hypothetical predicted value of 1.0 for these methods. Wahl found: The Bureau of Reclamation s (1988) average breach width equation (B avg = 3h W ) tends to significantly underestimate the observed breach widths and provides the smallest breach widths of the four methods he assessed. The Bureau of Reclamation s failure time equation (t = 0.011B avg (metric), which is roughly 1.7 ft/min of height) also tends to significantly underestimate the breach formation time. Wahl states in his 1998 technical article: 4
8 Reclamation (1988) provided guidance for selecting ultimate breach width and time of failure to be used in hazard classification studies using the SMPDBK model. The suggested values are not intended to yield accurate predictions of peak breach outflows, but rather are intended to produce conservative, upper bound values that will introduce a factor of safety into the hazard classification procedure. In the case study presented by Wahl in the 2004 ASCE Hydraulics Journal article, the Bureau of Reclamation chose not to use its own breach parameters. Because of the data presented by Wahl, NI chose not to use the Bureau of Reclamations equations for average breach width. In lieu of the Bureau of Reclamations equations, NI used research developed by Wahl to develop the breach parameters. Average Breach Width Parameter. Wahl found that the Von Thun & Gillette (1990) and the roehlich (1995a) methods provided the most reasonable predictors of average breach widths with the reservoir at it maximum pool level. The MacDonald & Langridge-Monopolis average breach width equation resulted in unreasonably large breach widths with the reservoir at the topof-flood space scenario. or breach widths less than 30 meters ( approx. 100 feet), Wahl found the Von Thun & Gillette (1990) method provided the best predictor of average breach width. NI chose to average the result of the Von Thun & Gillette (1990) equation with the roehlich (1995a) equation to obtain the average breach width for overtopping breach conditions at the tallest section of the dam. The Von Thun & Gillette (1990) equation was used to calculate average breach widths at the abutments, because the average abutment breach widths were generally less than 100 feet. The Von Thun & Gillette (1990) equation requires only the determination of the hydraulic head, hw, over the final breach bottom elevation (which equals the height of the breach, hb, under barely overtopping conditions) and C b, which is based upon total reservoir storage between the top and bottom of the breach section. The roehlich (1995a) equation requires calculation of the volume of water that is expected to be discharged through the breach section, per the following relationship: Initial volume stored in reservoir above base of breach section + runoff volume = volume discharged through breach section + volume discharge through emergency spillway + volume discharged through the principal spillway Up to the point of overtopping failure, all volume discharged from the reservoir is through the two spillways. After failure is initiated, the remaining volume of inflow will be discharged through the two spillways and the breach section. After an overtopping breach is initiated there will be three discharge regimes: 5
9 (1) With reservoir levels dropping from the top of dam (i.e. immediately upon initiation of an overtopping breach) down to the emergency spillway crest, both spillways and the breach will be discharging. (2) With reservoir levels dropping from the emergency spillway crest down to the bottom of the final breach section, only the breach section will be discharging. (3) With reservoir levels dropping from the principal spillway crest down to the bottom of the final breach section, only the breach section will be discharging. NI made initial assumptions to calculate the flow volumes through the breach section: (1) It was assumed there was relatively little inflow by the time the reservoir level dropped from the principal spillway crest down to the base of the breach; therefore, the breach section discharged 100% of the flood storage volume within that reservoir zone. The volume discharged through the breach section was obtained from the reservoir s stage-storage data; therefore, the configuration of the breach section was not as important. (2) It was assumed there was relatively little inflow by the time the reservoir level dropped from the emergency spillway crest down to the principal spillway crest; therefore, the principal spillway and the breach section discharged 100% of the flood storage volume within that reservoir zone. The configuration of the breach section was roughly calculated using the Von Thun & Gillette equation for average breach width, and its discharge capacity was based upon the broad-crested weir equation 3 2 Q = clh. The discharge from the principal spillway was based upon the reservoir s discharge rating curve. (3) It was assumed that all the remaining inflow volume was discharged through the two spillways and the breach section as the reservoir dropped from the top of dam down to the crest of the emergency spillway. The rough configuration of the breach section, calculated for the previous flow regime was used to calculate the discharge capacity of the breach section at the top of dam. The discharge capacities of the two spillways were from the reservoir s stage-discharge rating data. As a cross-check of the assumptions discussed above, the volume of water discharged through the breach section V w for Dam #13A was calculated using the hydraulic model s final breach discharge hydrograph. The average breach width, b, was recalculated using roehlich s equation using the re-calculated Vw. The re-calculated b was within 96% of the b calculated using Vw derived under the initial assumptions. All further calculations of b per roehlich s equation used the stated assumptions to calculate V w. Breach ailure Time Parameter. In Wahl s 2004 ASCE Hydraulics Journal article he noted that all breach failure time equations tend to conservatively underestimate actual failure times. NI chose for the first two dams assessed (i.e. Dams #13A and #9) to use the breach failure time calculated by using the Von Thun & Gillette (1990) breach failure time equation based upon height, because its value fell close to the average of the failure time values determined by using the Bureau of Reclamation (1988), MacDonald & Langridge-Monopolis (1984), and the Von 6
10 Thun & Gillette (1990) equations. The roehlich (1995a) equation gave a failure time greatly out of proportion to the other equations, so its value was not used in the assessment of failure time. After the first 2 dams, NI chose to calculate the breach failure times by averaging the values calculated by the Bureau of Reclamation (1988), MacDonald & Langridge-Monopolis (1984), and the Von Thun & Gillette (1990) equations. The Von Thun & Gillette (1990) and the Bureau of Reclamation (1988) equations require only the determination of the hydraulic head, h w, over the final breach bottom elevation (which equals the height of the breach, h b, under barely overtopping conditions). The MacDonald & Langridge-Monopolis (1984) equation requires the additional calculation of the volume of water, Vw, discharging through the breach section, which is the same value of Vw used in the roehlich (1955a) equation to calculate average breach width b, as discussed above. Side Slopes Parameter. In Wahl s 2004 ASCE Hydraulics Journal article, he presents the Von Thun & Gillette (1990) suggestion of using breach side slope of 1:1, except for cases of dams with very thick zones of cohesive materials where side slopes of 0.5H:1V or 0.33H:1V might be appropriate. NI chose to use 0.33H:1V side slopes for all breach overtopping configurations; however, a flatter 1:1 side slope was used in the sensitivity analysis for the configuration having the largest average breach width and the longest breach failure time. Because of the short heights of the abutment breach sections (i.e. generally less than 10 feet in height), NI assumed vertical side slopes for the abutment breaches. Abutment Overtopping Breach Parameters: or abutment overtopping breach parameters, the base elevation of the final abutment breach configuration was set to equal the crest grade of the emergency spillway. The Von Thun & Gillette (1990) equation (i.e. b = 2. 5h w + Cb ) was used to calculate the average breach width, and the Von Thun & Gillette (1990) equation for a highly erodible embankment (i.e. t = 0.020hw ) was used to calculate the abutment breach failure time. Vertical side slopes were assumed. Sunny Day Breach Parameters: According to the Tony Wahl (1998) technical article, roehlich s (1995a) equation for average breach width is the best predictor for the cases with observed breach widths less than 50 meters (i.e. 164 feet). Therefore, roehlich s (1995a) equations for both average breach width, b, and for breach failure time, t,, were used to calculate the sunny-day breach parameters, assuming a piping failure. roehlich s breach failure time equation was used for the sunny-day piping condition because it gives a longer failure time than the other methods. According to Wahl s 2004 ASCE Hydraulics Journal article, seepage-erosion failures can take a great deal of time to develop. As shown in Tables 1 through 4 of the article, the roehlich equation results in the longest failure time for the overtopping failure conditions. 7
11 The other two sunny-day breach parameters are the centerline elevation of the beginning of piping and the breach side slope. The centerline of the beginning of piping was taken as the centerline elevations of discharge pipe of the principal spillway at the downstream toe of the dam, because piping was considered most likely to occur around and along the discharge pipe. In Wahl s 2004 ASCE Hydraulic Journal article, he mentions that roehlich (1995a) assumed side slopes of 0.9:1 (horizontal: vertical) for piping failures. NI, therefore, used a side slope of 0.9H to 1.0V for the sunny-day piping breach failure. Sensitivity Analyses. In Wahl s 2004 ASCE Hydraulics Journal article he recommended a range of breach widths and a range of failure times be calculated using Table 1 Prediction Interval Around Hypothetical Predicted Value of 1.0. Tables 2 and 3 in his technical article illustrate the use of the prediction intervals in a case study. NI chose to use the prediction interval values in Table 1 of Wahl s 2004 ASCE Hydraulics Journal article to calculate a range of breach parameters (within the 95% prediction interval) for sensitivity analysis of the overtopping breach at the tallest embankment section. This was done to determine the dam breach s sensitivity to changes in breach failure time, while keeping the parameters within the 95% prediction interval. Once the average breach widths, b, and the breach time of failures, t, were calculated by each method, Wahl s 95% prediction intervals (given in Table 1 of his 2004 ASCE Hydraulics Journal article) were used to calculate a range of values for sensitivity analyses. Breach Parameters Results. Results of the average breach widths, breach failure times, and sensitivity analyses used for analyzing the breach of Dams # 13A, # 9, # 1, and # 6 are summarized respectively in Tables 1 through 4 below. 8
12 Table 1 Dam # 13A Breach Parameters The following table summarizes the PM breach parameters using all four methods: Method USBR Von Thun & Gillette (height) Von Thun & Gillette ( b ) roehlich MacDonald & Langridge-Monopolis PM Breach Parameters at Maximum Height of Dam 95% Prediction 95% Prediction b (ft) t (hrs) Interval (ft) Interval (hrs) to hr 0.08 to 8.5 hr to hr 0.22 to 17.6 hr to hr 0.19 to 9.3 hr to hr 0.48 to 9.2 hr N/A N/A hr 0.17 to 7.6 hr or the PM breach analysis of Dam # 13A, NI selected the following average breach parameters for analyzing the breach at the maximum height of dam: b = 180 t = hrs Slide Slope = 0.33H to 1.0V Top Breach Elevation = el Breach Bottom Elevation = el The following configurations were used as a sensitivity analysis for analyzing the PM breach at the maximum height of dam: b (ft) t (hrs) Side Slope Config. A hrs 0.33H to 1.0V Config. B hrs 0.33H to 1.0V Config. C hrs 1.0H to 1.0V The following parameters were selected to analyze the abutment breach: b = 80 t = hrs Side Slope = vertical Top Breach Elevation = el Breach Bottom Elevation = el or the sunny-day breach analysis of Dam #13A, NI selected the following average breach parameters for analyzing the breach at normal pool height of dam: Centerline elevation of pipe = el b = 33 Side Slope = 0.9H to 1.0V Breach formation time = 0.39 hrs The following configurations were used as a sensitivity analysis for analyzing the sunny-day breach at normal pool height of dam: Centerline of Pipe b (ft) Side Slope Breach formation time (hrs) Config. A el H to 1.0V 0.15 hrs Config. B el H to 1.0V 2.85hrs 9
13 Table 2 Dam # 9 Breach Parameters The following table summarizes the PM breach parameters using all four methods: Method USBR Von Thun & Gillette (height) Von Thun & Gillette ( b ) roehlich MacDonald & Langridge-Monopolis b (ft) PM Breach Parameters at Maximum Height of Dam 95% Prediction t 95% Prediction (hrs) Interval (ft) Interval (hrs) to hr to 9.78 hr to hr to hr to hr to hr to hr to hr N/A N/A 0.86 hr to 9.40 hr or the PM breach analysis of Dam # 9, NI selected the following average breach parameters for analyzing the breach at the maximum height of dam: b = 230 t = hrs Slide Slope = 0.33H to 1.0V Top Breach Elevation = el Breach Bottom Elevation = el The following configurations were used as a sensitivity analysis for analyzing the PM breach at the maximum height of dam: b (ft) t (hrs) Side Slope Config. A hrs 0.33H to 1.0V Config. B hrs 0.33H to 1.0V Config. C hrs 1.0H to 1.0V The following parameters were selected to analyze the abutment breach: b = 77 t = 0.29 hrs Side Slope = vertical Top Breach Elevation = el Breach Bottom Elevation = el Dam #9 is dry during normal pool conditions because of Karst features along the creek channel. Therefore, sunnyday breach parameters were not developed for Dam #9. 10
14 Table 3 Dam # 1 Breach Parameters The following table summarizes the PM breach parameters using all four methods: Method USBR Von Thun & Gillette (height) Von Thun & Gillette ( b ) roehlich MacDonald & Langridge-Monopolis b (ft) PM Breach Parameters at Maximum Height of Dam 95% Prediction t 95% Prediction (hrs) Interval (ft) Interval (hrs) to hr 0.09 to hr to hr 0.24 to hr to hr 0.23 to hr to hr 0.58 to hr N/A N/A 0.90 hr 0.22 to 9.87 hr or the PM breach analysis of Dam # 1, NI selected the following average breach parameters for analyzing the breach at the maximum height of dam: b = 239 t = 0.52 hrs Slide Slope = 0.33H to 1.0V Top Breach Elevation = el Breach Bottom Elevation = el. 998 The following configurations were used as a sensitivity analysis for analyzing the PM breach at the maximum height of dam: b (ft) t (hrs) Side Slope Config. A hr 0.33H to 1.0V Config. B hr 0.33H to 1.0V Config. C hr 1.0H to 1.0V The following parameters were selected to analyze the abutment breach: b = 63 t = 0.29 hrs Side Slope = vertical Top Breach Elevation = el Breach Bottom Elevation = el or the sunny-day breach analysis of Dam # 1, NI selected the following average breach parameters for analyzing the breach at normal pool height of dam: Centerline elevation of pipe = el b = 40 Side Slope = 0.9H to 1.0V Breach formation time = 0.63 hrs The following configurations were used as a sensitivity analysis for analyzing the sunny-day breach at normal pool height of dam: Centerline of Pipe b (ft) Side Slope Breach formation time (hrs) Config. A el H to 1.0V 0.24 hr Config. B el H to 1.0V 4.6 hr 11
15 Table 4 Dam # 6 Breach Parameters The following table summarizes the PM breach parameters using all four methods: Method USBR Von Thun & Gillette (height) Von Thun & Gillette ( b ) roehlich MacDonald & Langridge-Monopolis b (ft) PM Breach Parameters at Maximum Height of Dam 95% Prediction t 95% Prediction (hrs) Interval (ft) Interval (hrs) to hr 0.13 to hr to hr 0.29 to hr to hr 0.23 to hr to hr 0.46 to 8.75 hr N/A N/A 1.05 hr 0.25 to hr or the PM breach analysis of Dam # 6, NI selected the following average breach parameters for analyzing the breach at the maximum height of dam: b = 277 t = 0.60 hrs Slide Slope = 0.33H to 1.0V Top Breach Elevation = el Breach Bottom Elevation = el The following configurations were used as a sensitivity analysis for analyzing the PM breach at the maximum height of dam: b (ft) t (hrs) Side Slope Config. A hr 0.33H to 1.0V Config. B hr 0.33H to 1.0V Config. C hr 1.0H to 1.0V The following parameters were selected to analyze the abutment breach: b = 92 t = 0.35 hrs Side Slope = vertical Top Breach Elevation = el Breach Bottom Elevation = el or the sunny-day breach analysis of Dam # 6, NI selected the following average breach parameters for analyzing the breach at normal pool height of dam: Centerline elevation of pipe = el b = 45 Side Slope = 0.9H to 1.0V Breach formation time = 0.34 hrs The following configurations were used as a sensitivity analysis for analyzing the sunny-day breach at normal pool height of dam: Centerline of Pipe b (ft) Side Slope Breach formation time (hrs) Config. A el H to 1.0V 0.13 hr Config. B el H to 1.0V 2.47 hr 12
16 Breach Analyses The U.S. Army Corps of Engineers HEC-RAS unsteady flow model was used to perform the breach analyses and to route the flows downstream of the dam. The floodplain conveyance characteristics were defined by cross-sectional data and Manning s N data. Sections were cut using the Capital Area Planning Council s (CAPCO) foot topography and aerial photography. The GEO-RAS program was used to cut the sections. The Manning s N values were developed based upon field observations and then increased by 25% to account for turbulence expected under PM and breach flow conditions, as recommended in the TCEQ s 2006 dam safety design guidelines. Road crossing and bridge data was obtained from available construction plans and supplemented with field measurements. The upstream boundary conditions were defined by the pre-breach discharge hydrographs developed by the HEC-1 program. The downstream boundary conditions were defined by tailwater conditions at the confluence of each dam s floodplain with the main channel of Brushy Creek. Two downstream boundary conditions were analyzed to determine the most conservative breach floodplain. These conditions include: (1) normal depth flows at the confluence under the assumption that the water surface levels within the main Brushy Creek channel did not create a backwater effect, and (2) the basin-wide PM flood flows on the main Brushy Creek channel would cause a backwater effect. The second downstream boundary condition created the highest water surface levels at the lower reaches of each dam s floodplain and therefore was considered adequately conservative for flood evacuation mapping purposes. The basin-wide PM hydrologic model was also used to determine local runoff discharging laterally into the floodplains downstream of the dams. The unsteady flow breach routine of the HEC-RAS program was used to assess the peak discharge rates of the average breach parameters and to perform breach sensitivity analyses to identify any necessary changes to the breach parameters before routing the discharge hydrographs downstream of the dams. Tables 5, 6 and 7 summarize the sensitivity analyses of the breach parameters performed for Dams 13A, 1, and 6, respectively. Table 5 Dam #13A Breach Parameter Sensitivity Analyses Breach Parameter* Peak Discharge Rate (cfs) PM Breach at Maximum Height of Dam Average Breach Parameter 48,875 Configuration A 24,380 Configuration B 19,280 Configuration C 9,633 Sunny-Day Breach Average Breach Parameter 680 Configuration A 593 Configuration B 1,534 * Note: See Table 1 for configuration of Dam #13A breach parameters. 13
17 Table 6 Dam #1 Breach Parameters Sensitivity Analyses Breach Parameter* Peak Discharge Rate (cfs) PM Breach at Maximum Height of Dam Average Breach Parameter 85,899 Configuration A 22,247 Configuration B 37,352 Configuration C 10,578 Sunny-Day Breach Average Breach Parameter 2,317 Configuration A 1,299 Configuration B 2,167 * Note: See Table 3 for configuration of Dam #1 breach parameters. Table 7 Dam #6 Breach Parameters Sensitivity Analyses Breach Parameter* Peak Discharge Rate (cfs) PM Breach at Maximum Height of Dam Average Breach Parameter 142,524 Configuration A 52,259 Configuration B 71,214 Configuration C 17,784 Sunny-Day Breach Average Breach Parameter 5,352 Configuration A 2,384 Configuration B 3,723 * Note: See Table 4 for configuration of Dam #6 breach parameters. The breach parameter sensitivity analyses resulted in the following findings: The average breach parameters for the PM breach had the highest peak discharge rate when compared to the other configurations. This configuration also produced the highest downstream water surface depths. Therefore, this configuration was chosen to map the PM breach floodplain for flood evacuation purposes. The average or the configuration B sunny-day breach parameters had the highest peak discharge rate when compared to the other configurations. The configuration that produced the highest downstream water surface depths was chosen to map the sunny-day breach floodplain for flood evacuation purposes. The pre-breach and the breach discharge hydrographs were routed below each dam to the location where the breach water surface level was within one foot of the pre-breach water surface level. The derivation of the breach discharge hydrograph and the routings of the pre-breach and 14
18 breach discharge hydrographs were performed using the unsteady flow routine of the HEC-RAS program. Table 8 summarizes the channel distances below two of the dams within which the breach flood levels have attenuated to within 1 foot of the pre-breach flood levels. Table 8 also summarizes the time it takes the leading edge of the breach wave to reach the end of the attenuation zone. These times indicate that the public will have very little time to react within the breach inundation zones once the dams breach. Table 8 PM Breach Attenuation Lengths Downstream of Dams # 13A and # 1 Dam Attenuation Length (ft) Time for Breach Wave to Travel Attenuation Length (min.) 13A 9, , The zones of inundation produced by the sunny-day and PM breaches were mapped using the Geo-RAS software. The breach inundation mappings confirmed the high hazard potential classifications of the dams. The breach inundation mappings will be included within the emergency action plan (EAP) for each dam to aid local emergency response officials in evacuating the public from at risk areas, in defining safe evacuation routes, and in identifying sections of roadways that are to be closed. igure 2 provides the breach inundation map for Dam # 13A. Summary Remarks Breach analyses were performed on four high hazard potential dams of the Upper Brushy Creek WCID in southern Williamson County. The breach parameters used to perform the PM breach analyses and the sunny-day breach analyses were based upon the recommendations of Tony Wahl with the U.S. Bureau of Reclamation s Dam Safety Office. Up to five methodologies were used to derive breach parameters, and sensitivity analyses were performed to determine the most critical combinations of average breach widths, breach formation times, and breach side slopes. The U.S. Army Corps of Engineers HEC-RAS unsteady flow model was used to model the sunny-day and PM breaches and to route the pre-breach and breach discharge hydrographs along the floodplains downstream of the dams to the locations where the breach flow depths attenuated to within 1 foot of the pre-breach flow depths. The assumed downstream boundary condition of PM backwater from the main Brushy Creek channel created higher breach flood levels than assuming a free flow into the main creek channel. The breach inundation levels impacted by the main channel PM backwater were determined to be the most appropriate conservative conditions for emergency flood/breach evacuation purposes. The breach waves were found to travel at velocities between 3.7 to 8.0 feet per second, thereby not providing sufficient reaction or evacuation time within the breach inundation zones after dam breach occurs. 15
19 igure 2 16
20 References U.S. Bureau of Reclamation, Policy and Procedures for Dam Safety Modification Decision Making, Safety of Dams Program, Denver, Colorado, April Wahl, Tony L., Uncertainty of Predictions of Embankment Dam Breach Parameters, Journal of Hydraulic Engineering, American Society of Civil Engineering, Vol. 130, No. 5, May 1, Wahl, Tony L., Prediction of Embankment Dam Breach parameters, A Literature Review and Needs Assessment, DSO Dam Safety Research Report, Water Resources Laboratory, Dam Safety Office, Bureau of Reclamation, U.S. Department of the Interior, July reese & Nichols, Inc., Programming Study for the Upper Brushy Creek WCID Dam Modernization Program, Williamson County, Texas, Austin, Texas, September U.S. Army Corps of Engineers, Hydrologic Engineering Center, HEC-1 lood Hydrograph Package, version 4.1. U.S. Army Corps of Engineers, Hydrologic Engineering Center, HEC-RAS River Analysis System, version U.S. Army Corps of Engineers, Hydrologic Engineering Center, HEC GEO-RAS GIS Tools for support of HEC-RAS using ArcGIS, version Texas Commission on Environmental Quality, Guidelines for Operation and Maintenance of Dam in Texas, Austin, Texas, November
Bear Creek Dam and Reservoir NID# OR Douglas County, Oregon
 Bear Creek Dam and Reservoir NID# OR00614 Douglas County, Oregon FINAL Dam Breach Study and Flood Inundation Mapping March, 2009 Prepared for: The City of Drain, Oregon 129 West C Avenue Drain, OR 97435
Dam Breach Study and Flood Inundation Mapping
 Malheur Reservoir and Willow Creek Dam #3 NID# OR00390 Malheur County, Oregon Dam Breach Study and Flood Inundation Mapping February 2010 Prepared for: State of Oregon Water Resources Department 725 Summer
STATE OF COLORADO DEPARTMENT OF NATURAL RESOURCES DIVISION OF WATER RESOURCES GUIDELINES FOR DAM BREACH ANALYSIS
 STATE OF COLORADO DEPARTMENT OF NATURAL RESOURCES DIVISION OF WATER RESOURCES OFFICE OF THE STATE ENGINEER DAM SAFETY BRANCH GUIDELINES FOR DAM BREACH ANALYSIS February 10, 2010 Telephone (303) 866-3581
INFLOW DESIGN FLOOD CONTROL SYSTEM PLAN 40 C.F.R. PART PLANT YATES ASH POND 3 (AP-3) GEORGIA POWER COMPANY
 GEORGIA POWER COMPANY") INFLOW DESIGN FLOOD CONTROL SYSTEM PLAN 40 C.F.R. PART 257.82 PLANT YATES ASH POND 3 (AP-3) GEORGIA POWER COMPANY EPA s Disposal of Coal Combustion Residuals from Electric Utilities Final Rule (40 C.F.R.
INFLOW DESIGN FLOOD CONTROL SYSTEM PLAN 40 C.F.R. PART 257.82 PLANT YATES ASH POND 3 (AP-3) GEORGIA POWER COMPANY EPA s Disposal of Coal Combustion Residuals from Electric Utilities Final Rule (40 C.F.R.
INFLOW DESIGN FLOOD CONTROL SYSTEM PLAN PLANT GREENE COUNTY ASH POND ALABMA POWER COMPANY
 INFLOW DESIGN FLOOD CONTROL SYSTEM PLAN PLANT GREENE COUNTY ASH POND ALABMA POWER COMPANY Section 257.82 of EPA s regulations requires the owner or operator of an existing or new CCR surface impoundment
Prepared for Urban Drainage and Flood Control District
 BERM FAILURE TECHNICAL ANALYSES SOUTH PLATTE GRAVEL PIT EVALUATION CRITERIA Prepared for Urban Drainage and Flood Control District Wright Water Engineers, Inc. January 2013 121-030.000 TABLE OF CONTENTS
Informational Meeting- March 31, Boxelder B-2/B-3 Watershed Planning Study
 Informational Meeting- March 31, 2016 Boxelder B-2/B-3 Watershed Planning Study Agenda Introductions Work Completed to Date Phase 1 Evaluations Alternatives Evaluations Economic Evaluations Draft Watershed
Supplemental Watershed Plan Agreement No. 10 for Neshaminy Creek Watershed Core Creek Dam (PA-620) Bucks County, Pennsylvania
 Bucks County, Pennsylvania") Supplemental Watershed Plan Agreement No. 10 for Neshaminy Creek Watershed Core Creek Dam (PA-620) Bucks County, Pennsylvania Project Authorization USDA's Small Watershed Program is carried out under the
Supplemental Watershed Plan Agreement No. 10 for Neshaminy Creek Watershed Core Creek Dam (PA-620) Bucks County, Pennsylvania Project Authorization USDA's Small Watershed Program is carried out under the
INFLOW DESIGN FLOOD CONTROL SYSTEM PLAN 40 C.F.R. PART PLANT BOWEN ASH POND 1 (AP-1) GEORGIA POWER COMPANY
 GEORGIA POWER COMPANY") INFLOW DESIGN FLOOD CONTROL SYSTEM PLAN 40 C.F.R. PART 257.82 PLANT BOWEN ASH POND 1 (AP-1) GEORGIA POWER COMPANY EPA s Disposal of Coal Combustion Residuals from Electric Utilities Final Rule (40 C.F.R.
INFLOW DESIGN FLOOD CONTROL SYSTEM PLAN 40 C.F.R. PART 257.82 PLANT BOWEN ASH POND 1 (AP-1) GEORGIA POWER COMPANY EPA s Disposal of Coal Combustion Residuals from Electric Utilities Final Rule (40 C.F.R.
Drop Height For Channel Erosion Control
 Drop Height For Channel Erosion Control James C.Y. Guo, Professor and Director Department of Civil Engineering, U. of Colorado at Denver, Denver, Colorado 8017 E-mail: James.Guo@cudenver.edu Introduction
HAZARD POTENTIAL CLASSIFICATION REPORT
 HAZARD POTENTIAL CLASSIFICATION REPORT PONDS 1 & 2, JR WHITING PLANT ERIE, MICHIGAN OCTOBER 13, 2016 PREPARED FOR: CONSUMERS ENERGY COMPANY TABLE OF CONTENTS SECTION: PAGE NO.: Certification... i 1.0 Introduction...
INFLOW DESIGN FLOOD CONTROL SYSTEM PLAN PLANT BARRY ASH POND ALABAMA POWER COMPANY
 INFLOW DESIGN FLOOD CONTROL SYSTEM PLAN PLANT BARRY ASH POND ALABAMA POWER COMPANY Section 257.82 of EPA s regulations requires the owner or operator of an existing or new CCR surface impoundment or any
Outlet Structure Modeling
 Watershed Modeling using HEC-RAS Outlet Structure Modeling Jeff Wickenkamp, P.E., CFM, D.WRE Patrick Lach, P.E. Hey and Associates, Inc. Water Resources, Wetlands and Ecology Outline of Presentation Why
INFLOW DESIGN FLOOD CONTROL SYSTEM PLAN 40 C.F.R. PART PLANT YATES ASH POND B (AP-B ) GEORGIA POWER COMPANY
 GEORGIA POWER COMPANY") INFLOW DESIGN FLOOD CONTROL SYSTEM PLAN 40 C.F.R. PART 257.82 PLANT YATES ASH POND B (AP-B ) GEORGIA POWER COMPANY EPA s Disposal of Coal Combustion Residuals from Electric Utilities Final Rule (40 C.F.R.
INFLOW DESIGN FLOOD CONTROL SYSTEM PLAN 40 C.F.R. PART 257.82 PLANT YATES ASH POND B (AP-B ) GEORGIA POWER COMPANY EPA s Disposal of Coal Combustion Residuals from Electric Utilities Final Rule (40 C.F.R.
INFLOW DESIGN FLOOD CONTROL SYSTEM PLAN. Bremo Power Station CCR Surface Impoundment: North Ash Pond INFLOW DESIGN FLOOD
 INFLOW DESIGN FLOOD CONTROL SYSTEM PLAN INFLOW DESIGN FLOOD CONTROL SYSTEM PLAN Bremo Power Station CCR Surface Impoundment: North Ash Pond Submitted To: Bremo Power Station 1038 Bremo Bluff Road Bremo
CHOLLA POWER PLANT BOTTOM ASH POND INFLOW DESIGN FLOOD CONTROL SYSTEM PLAN CH_Inflowflood_003_
 CHOLLA POWER PLANT BOTTOM ASH POND INFLOW DESIGN FLOOD CONTROL SYSTEM PLAN CH_Inflowflood_003_20161017 This Inflow Design Flood Control System Plan (Plan) document has been prepared specifically for the
Appendix VI: Illustrative example
 Central Valley Hydrology Study (CVHS) Appendix VI: Illustrative example November 5, 2009 US Army Corps of Engineers, Sacramento District Prepared by: David Ford Consulting Engineers, Inc. Table of contents
Ponds. Pond A water impoundment made by excavating a pit, or constructing a dam or an embankment.
 POND SITE SELECTION AND CONSTRUCTION Uses, Planning, & Design David Krietemeyer Area Engineer USDA-NRCS June 20, 2008 Uses Considerations for Location of Commonly Used Terms Pond A water impoundment made
Hydrologic Study Report for Single Lot Detention Basin Analysis
 Hydrologic Study Report for Single Lot Detention Basin Analysis Prepared for: City of Vista, California August 18, 2006 Tory R. Walker, R.C.E. 45005 President W.O. 116-01 01/23/2007 Table of Contents Page
III. INVENTORY OF EXISTING FACILITIES
 III. INVENTORY OF EXISTING FACILITIES Within the Growth Management Boundary, the existing storm drainage facilities are largely associated with development that has historically occurred in the ten drainage
Project Drainage Report
 Design Manual Chapter 2 - Stormwater 2A - General Information 2A-4 Project Drainage Report A. Purpose The purpose of the project drainage report is to identify and propose specific solutions to stormwater
STONE OAK DAM: TO BREACH OR NOT TO BREACH, THAT IS THE QUESTION. TFMA Spring Conference 2013
 STONE OAK DAM: TO BREACH OR NOT TO BREACH, THAT IS THE QUESTION TFMA Spring Conference May 23, 2013T F M A Spring Conference 2013 INTRODUCTIONS ALYSHA GIRARD, P.E., CFM Storm Water Program Manager City
DRAFT. Jacob Torres, P.E.; Nick Fang, Ph.D., P.E.
 \ Memorandum SSPEED Center at Rice University Department of Civil & Environmental Engineering 6100 Main MS-317 Houston, Texas 77005-1827 sspeed.rice.edu tel: 713-348-4977 To Andy Yung, P.E. CFM; Lane Lease,
INFLOW DESIGN FLOOD CONTROL SYSTEM PLAN 40 C.F.R. PART PLANT DANIEL ASH POND B MISSISSIPPI POWER COMPANY
 INFLOW DESIGN FLOOD CONTROL SYSTEM PLAN 40 C.F.R. PART 257.82 PLANT DANIEL ASH POND B MISSISSIPPI POWER COMPANY EPA s Disposal of Coal Combustion Residuals from Electric Utilities Final Rule (40 C.F.R.
Lower San Joaquin River Feasibility Study PLAN FORMULATION ADDENDUM
 PLAN FORMULATION ADDENDUM Non-Structural Measure Descriptions Elevate Critical Infrastructure This measure would raise at-risk critical structures above the design inundation level. Elevation would be
TVA Colbert Fossil Facility Ash Disposal Pond 4
 2011 World of Coal Ash (WOCA) Conference May 9-12, 2011 in Denver, CO, USA http://www.flyash.info/ TVA Colbert Fossil Facility Ash Disposal Pond 4 Improving Operations While Preparing for Closure May 10,
Appendix J Hydrology and Hydraulics
 Appendix J Hydrology and Hydraulics Marsh Lake Dam Ecosystems Restoration Feasibility Study Hydraulics & Hydrology Appendix January 2011 Contents List of Figures iii List of Tables iii I. General 1 II.
ROLES AND RESPONSIBILITIES Small Pond Approval. SWM MD-378 Pond Checklist Training 10/17/07. Exemptions EMBANKMENT HEIGHT. Height of Dam Weir Wall
 SWM MD-378 Pond Checklist Training 10/17/07 Ken Wolfe Warren Johnson USDA, NRCS Frederick, Maryland ROLES AND RESPONSIBILITIES Small Pond Approval MDE, WMA, Dam Safety Division Authority (COMAR 26.17.04.03)
December 7, Dr. Christine Pomeroy University of Utah Civil and Environmental Engineering MCE Salt Lake City, UT. Dear Dr.
 December 7, 2012 Dr. Christine Pomeroy University of Utah Civil and Environmental Engineering MCE 2042 Salt Lake City, UT 84112 Dear Dr. Pomeroy, The following document is the final report of the Red Butte
Jacobi, Toombs, and Lanz, Inc.
 Area 5: Blackiston Mill Road at Dead Man's Hollow Flooding Assessment Jacobi, Toombs, and Lanz, Inc. This document summarizes an assessment of drainage and flooding concerns and provides recommendations
Lyon Creek Cedar Way Stormwater Detention Dam Operation and Maintenance Manual
 Lyon Creek Cedar Way Stormwater Detention Dam Operation and Maintenance Manual Prepared by: Mike Shaw Stormwater Program Manager City of Mountlake Terrace January 2010 Section I General Information This
Geneva Dam. Design of a Steep, Temporary, Riprap Ramp
 Geneva Dam Design of a Steep, Temporary, Riprap Ramp A Run-of of-river Dam Analysis for Geneva Dam Credit to: Yu-Chun Su, Ph.D., P.E., CFM David T. Williams. Ph.D., P.E, CFM Presentation Purpose History
City of Katy Flood Protection Study (Meeting 3 of 3) October 23, 2017
 October 23, 2017") City of Katy Flood Protection Study (Meeting 3 of 3) October 23, 2017 Phasing of Meetings April Meeting May Meeting October Review of Tax Day Storm Event and Immediate Actions Taken By City Review of Coordination
City of Katy Flood Protection Study (Meeting 3 of 3) October 23, 2017 Phasing of Meetings April Meeting May Meeting October Review of Tax Day Storm Event and Immediate Actions Taken By City Review of Coordination
Sediment Basin. Fe= (Depends on soil type)
") 3.9 Sediment Control Description: A sediment basin is an embankment with a controlled outlet that detains stormwater runoff, resulting in the settling of suspended sediment. The basin provides treatment
3.9 Sediment Control Description: A sediment basin is an embankment with a controlled outlet that detains stormwater runoff, resulting in the settling of suspended sediment. The basin provides treatment
Informational Meeting- July 21, Boxelder B-2/B-3 Watershed Planning Study
 Informational Meeting- July 21, 2015 Boxelder B-2/B-3 Watershed Planning Study Agenda Introductions Background & History Purpose & Need NRCS Watershed Planning Program Work Completed to Date Longer term
GEOMORPHIC EFECTIVENESS OF FLOODS ON LOWER TAPI RIVER BASIN USING 1-D HYDRODYNAMIC MODEL,HEC-RAS
 GEOMORPHIC EFECTIVENESS OF FLOODS ON LOWER TAPI RIVER BASIN USING 1-D HYDRODYNAMIC MODEL,HEC-RAS Darshan Mehta 1, Raju Karkar 2, Lalji Ahir 3 Assistant Professor, CED, S.S.A.S.I.T, Surat, Gujarat, India
AMERICAN ELECTRIC POWER (SWEPCO)
") 2015 DAM & DIKE INSPECTION REPORT ASH PONDS GERS-15-034 WELSH POWER PLANT AMERICAN ELECTRIC POWER (SWEPCO) CASON, TEXAS NATIONAL INVENTORY NO. TX4357 PREPARED BY GEOTECHNICAL ENGINEERING AEP SERVICE CORPORATION
2015 DAM & DIKE INSPECTION REPORT ASH PONDS GERS-15-034 WELSH POWER PLANT AMERICAN ELECTRIC POWER (SWEPCO) CASON, TEXAS NATIONAL INVENTORY NO. TX4357 PREPARED BY GEOTECHNICAL ENGINEERING AEP SERVICE CORPORATION
DAM INSPECTION CHECKLIST Department of Environmental Protection Bureau of Waterways Engineering Division of Dam Safety
 DAM INSPECTION CHECKLIST Department of Environmental Protection Bureau of Waterways Engineering Division of Dam Safety NAME OF DAM: Milltown Dam DEPDAMNO.: 15-146 LOCATION: Municipality: East Goshen Township
HYDROLOGIC-HYDRAULIC STUDY ISABELLA OCEAN RESIDENCES ISLA VERDE, CAROLINA, PR
 HYDROLOGIC-HYDRAULIC STUDY ISABELLA OCEAN RESIDENCES ISLA VERDE, CAROLINA, PR 1 INTRODUCTION 1.1 Project Description and Location Isabella Ocean Residences is a residential development to be constructed
NEW CASTLE CONSERVATION DISTRICT. through. (Name of Municipality) PLAN REVIEW APPLICATION DRAINAGE, STORMWATER MANAGEMENT, EROSION & SEDIMENT CONTROL
 PLAN REVIEW APPLICATION DRAINAGE, STORMWATER MANAGEMENT, EROSION & SEDIMENT CONTROL") NEW CASTLE CONSERVATION DISTRICT through (Name of Municipality) PLAN REVIEW APPLICATION DRAINAGE, STORMWATER MANAGEMENT, EROSION & SEDIMENT CONTROL Office use only: Received by Municipality: Received by
NEW CASTLE CONSERVATION DISTRICT through (Name of Municipality) PLAN REVIEW APPLICATION DRAINAGE, STORMWATER MANAGEMENT, EROSION & SEDIMENT CONTROL Office use only: Received by Municipality: Received by
Table of Contents. 5-5 Release Rates Year Allowable Release Rate WQCV Release Rate EURV Release Rate...
 Chapter 5 Table of Contents 5-1 Introduction... 1 5-1-1 Stormwater Quality Considerations... 1 5-1-2 Stormwater Volume Considerations... 2 5-1-3 Downstream Impacts... 2 5-2 Requirements... 2 5-2-1 General
2C-12 Detention Basin Outlet Structures
 Iowa Stormwater Management Manual 2C-12 2C-12 Detention Basin Outlet Structures A. Introduction The methods described in Section 2C-9 are used to estimate the volume of the detention storage. The second
Keywords: Breach width; Embankment dam; Uncertainty analysis, neuro-fuzzy.
 ESTIMATION OF DAM BREACH WIDTHS USING A NEURO-FUZZY COMPUTING TECHNIQUE Lubna S. Bentaher 1 and Hasan G. Elmazoghi 2 1 University of Benghazi, Civil Eng. Dept., Email: lubna.bentaher@benghazi.edu.ly 2
Introduction to Storm Sewer Design
 A SunCam online continuing education course Introduction to Storm Sewer Design by David F. Carter Introduction Storm sewer systems are vital in collection and conveyance of stormwater from the upstream
DAM SAFETY PRESENTATION REGULATORY REQUIREMENTS FOR DAM ENGINEERING ASSESSMENTS IN NEW YORK Allan Estivalet, PE
 Lower Hudson Regional Conference Carmel, NY DAM SAFETY PRESENTATION REGULATORY REQUIREMENTS FOR DAM ENGINEERING ASSESSMENTS IN NEW YORK Allan Estivalet, PE July 24, 2015 NEW YORK STATE DAM SAFETY REGULATIONS
ENGINEERING AND CONSTRUCTION BULLETIN
 ENGINEERING AND CONSTRUCTION BULLETIN No. 2017-15 Issuing Office: CECW-CE Issued: 14 Jul 17 Expires: 14 Jul 19 SUBJECT: Managed Overtopping of Levee Systems CATEGORY: Guidance APPLICABILITY: The U.S. Army
Context of Extreme Alberta Floods
 Context of Extreme Alberta Floods Introduction Design of water management and stream crossing infrastructure requires determination of hydrotechnical design parameters. These parameters often consist of
Looking at Dam Safety from a Resiliency Perspective. February 23, 2017
 Looking at Dam Safety from a Resiliency Perspective February 23, 2017 1 Discussion Outline Dam Safety 101 (10 min) Fort Hood Overview (5 min) Resiliency Framework (5 min) Fort Hood Dam Safety Program (15
Presentation Overview
 Little Dry Creek Restoration Deep River Flood Risk Management Final Presentation to LCRBDC June 10, 2015 Presentation Overview Project Overview & Background Information Data Collection Model Development
Lake Houston Dam Comprehensive Evaluation of an Ambursen Dam
 Lake Houston Dam Comprehensive Evaluation of an Ambursen Dam ASDSO September 10, 2008 John Rutledge - Freese & Nichols, Inc. Chuck Easton - Freese & Nichols, Inc. Janis Murphy - Freese & Nichols, Inc.
NOTICE OF PREPARATION
 NOTICE OF PREPARATION Date: June 12, 2014 To: From: Subject: Governor s Office of Planning and Research/State Clearinghouse Unit, Responsible Agencies, Trustee Agencies, and Interested Parties Announcement
PARR HYDROELECTRIC PROJECT PARR HYDRO DEVELOPMENT & FAIRFIELD PUMPED STORAGE FACILITY DEVELOPMENT FERC PROJECT No SC SEPTEMBER 19, 2012
 PARR HYDROELECTRIC PROJECT PARR HYDRO DEVELOPMENT & FAIRFIELD PUMPED STORAGE FACILITY DEVELOPMENT FERC PROJECT No. 1894 - SC SEPTEMBER 19, 2012 PARR AND FAIRFIELD LOCATIONS Lockhart Neal Shoals Monticello
Chapter 11 Culverts and Bridges
 Chapter 11 Culverts and Bridges Contents 1.0 Introduction... 1 2.0 General Design... 1 2.1 Design Criteria... 1 2.2 Design Flows... 1 2.3 Permitting and Regulations... 1 2.4 Aesthetics and Safety... 2
COON CREEK WATERSHED DISTRICT PERMIT REVIEW. Spring Lake Park Schools Westwood Middle School st Avenue NE, Spring Lake Park, MN 55432
 PAN 16-112, Westwood Middle School, Page 1 of 6 COON CREEK WATERSHED DISTRICT PERMIT REVIEW MEETING DATE: August 22, 2016 AGENDA NUMBER: 10 FILE NUMBER: 16-112 ITEM: Westwood Middle School RECOMMENDATION:
Freight Street Development Strategy
 Freight Street Development Strategy Appendix B: Naugatuck River Floodplain Analysis Freight Street Development Strategy DECEMBER 2017 Page B-1 1.0 NAUGATUCK RIVER FLOODPLAIN AT FREIGHT STREET 1.1 Watershed
Gwinnett County Stormwater System Assessment Program
 Gwinnett County Stormwater System Assessment Program Jonathan Semerjian, PE Dept. of Water Resources Stormwater Management Sam Fleming, PE Dewberry Presentation Overview Project Background Drivers Enhanced
IAFSM 2010 Annual Conference. City of Rockford Keith Creek Greenway Flood Mitigation Project
 IAFSM 2010 Annual Conference City of Rockford Keith Creek Greenway Flood Mitigation Project March 10, 2010 Introduction Problem Overview 1890 s Building of homes along Keith Creek 1920 s Home construction
Flood Risk Management on the Elwha: Case Study of the Federal Levee Modification Project
 Flood Risk Management on the Elwha: Case Study of the Federal Levee Modification Project US Army Corps of Engineers Zac Corum, PE, Hydraulic Engineer Travis Ball, PE, CFM, Hydraulic Engineer Seattle District
TECHNICAL MEMORANDUM Summerhill Rd Texarkana, Texas fax
 TECHNICAL MEMORANDUM 5930 Summerhill Rd Texarkana, Texas 75503 903 838 8533 fax 903 832 4700 TO: Becky Griffith, Jon Jarvis FROM Spandana Tummuri SUBJECT: Technical Memorandum on IP Analysis PROJECT: Sulphur
APPENDIX G HYDRAULIC GRADE LINE
 Storm Drainage 13-G-1 APPENDIX G HYDRAULIC GRADE LINE 1.0 Introduction The hydraulic grade line is used to aid the designer in determining the acceptability of a proposed or evaluation of an existing storm
Stormwater Management Studies PDS Engineering Services Division ES Policy # 3-01
 Stormwater Management Studies PDS Engineering Services Division Revised Date: 2/28/08 INTRODUCTION The City of Overland Park requires submission of a stormwater management study as part of the development
Distribution Restriction Statement Approved for public release; distribution is unlimited.
 CECW-EH-Y Engineer Regulation 1110-8-2(FR) Department of the Army U.S. Army Corps of Engineers Washington, DC 20314-1000 Engineering and Design INFLOW DESIGN FLOODS FOR DAMS AND RESERVOIRS ER 1110-8-2(FR)
FINDINGS: Olsson used a three-step analysis strategy to develop a benefit cost ratio that would indicate the relative feasibility of this project.
 EXECUTIVE SUMMARY FINDINGS: Based on the results of this feasibility study, the Platte Republican Diversion Project would be cost-effective. With minimal improvements to the channel, and the existing bridge
Alternative Approaches to Water Resource System Simulation
 US Army Corps of Engineers Hydrologic Engineering Center Alternative Approaches to Water Resource System Simulation May 1972 Approved for Public Release. Distribution Unlimited. TP-32 REPORT DOCUMENTATION
United States Army Corps of Engineers. Addicks and Barker Dam Safety Update
 United States Army Corps of Engineers Addicks and Barker Dam Safety Update COL Richard P. Pannell District Commander, Galveston District U.S. Army Corps of Engineers March 9, 2016 US Army Corps of Engineers
Visual Inspection Checklist
 APPENDIX Q. Visual Inspection Checklist Thispageintentionallyleftblank. VISUAL INSPECTION CHECKLIST CITY OF AUBURN PUBLIC WORKS DEPARTMENT INSPECTION YEAR: TYPE OF INSPECTION: (Informal, Regular, Formal):
Chapter 4. Drainage Report and Construction Drawing Submittal Requirements
 4.0 Introduction The requirements presented in this section shall be used to aid the design engineer or applicant in the preparation of drainage reports, drainage studies, and construction drawings for
HYDROLOGY REPORT HEACOCK & CACTUS CHANNELS MORENO VALLEY, CALIFORNIA NOVEMBER 2005 REVISED APRIL 2006 REVISED AUGUST 2006
 HYDROLOGY REPORT HEACOCK & CACTUS CHANNELS MORENO VALLEY, CALIFORNIA NOVEMBER 2005 REVISED APRIL 2006 REVISED AUGUST 2006 RIVERSIDE COUNTY FLOOD CONTROL AND WATER CONSERVATION DISTRICT TABLE OF CONTENTS
1 n. Flow direction Raster DEM. Spatial analyst slope DEM (%) slope DEM / 100 (actual slope) Flow accumulation
 slope DEM / 100 (actual slope) Flow accumulation") 1 v= R S n 2/3 1/2 DEM Flow direction Raster Spatial analyst slope DEM (%) Flow accumulation slope DEM / 100 (actual slope) 0 = no cell contributing 215 = 215 cell contributing towards that cell sqrt (actual
1 v= R S n 2/3 1/2 DEM Flow direction Raster Spatial analyst slope DEM (%) Flow accumulation slope DEM / 100 (actual slope) 0 = no cell contributing 215 = 215 cell contributing towards that cell sqrt (actual
Hydrologic Calibration:
 Hydrologic Calibration: UPDATE OF EFFECTIVE HYDROLOGY FOR MARYS CREEK October 2010 Agenda Background Hydrologic model Calibrated rainfall Hydrologic calibration 100 year discharges, Existing Conditions
Stormwater Local Design Manual For Houston County, Georgia
 Stormwater Local Design Manual For Houston County, Georgia Adopted November 15, 2005 TABLE OF CONTENTS 1. FORWARD... 1 2. GENERAL LEVEL OF SERVICE STANDARDS... 2 2.1. DETENTION REQUIREMENTS... 2 2.1.1.
UPRR criteria for sizing waterway openings under bridges and through culverts are as follows:
 UNION PACIFIC RAILROAD SCOPE OF HYDROLOGIC/HYDRAULIC DESIGN ENGINEERING AND PERMITTING SERVICES FOR SIZING WATERWAY OPENINGS AT NEW AND REPLACEMENT STRICTURES These flood passage criteria were developed
Appendix G Preliminary Hydrology Study
 Appendix G Preliminary Hydrology Study Preliminary Hydrology Study VESTING TTM 72608 Long Beach, CA Prepared for: The Long Beach Project, LLC 888 San Clemente, Suite 100 New Port Beach, CA May 28, 2014
APPENDIX A HYDROLOGIC AND HYDRAULIC ANALYSIS
 APPENDIX A HYDROLOGIC AND HYDRAULIC ANALYSIS GENERAL The Hydrologic and Hydraulic information presented in this appendix is provided as a supplement to the Dallas Floodway Extension General Re-evaluation
Chapter 12 Storage. Contents. Overview... 1
 Chapter 12 Storage Contents Overview... 1 Implementation of Regional, Sub-regional, and On-site Detention Facilities... 2 Regional Detention... 2 Subregional Detention... 5 Onsite Detention... 6 Detention
Hydrology for Folsom Dam Water Control Manual Update
 Hydrology for Folsom Dam Water Control Manual Update Brian Walker, EIT Civil Engineer, Hydrology Section U.S. Army Corps of Engineers Sacramento District 1325 J Street Sacramento, CA 95816 Tel: (916) 557-7376
MODEL Stormwater Local Design Manual. City of Centerville
 MODEL Stormwater Local Design Manual City of Centerville Adopted December 6, 2005 TABLE OF CONTENTS 1. FORWARD... 1 2. GENERAL LEVEL OF SERVICE STANDARDS... 1 2.1. DETENTION REQUIREMENTS... 1 2.1.1. Discharge
Constructed Wetland Channel T-9
 Description A constructed wetland channel is a conveyance BMP that is built, in part, to enhance stormwater quality. Constructed wetland channels use dense vegetation to slow down runoff and allow time
Index. Page numbers followed by f indicate figures.
 Index Aerodynamic method, 103, 110 111 Algae, 131, 173, 175 Alternate depth, 88 Alternating block method, 132, 140 141 Attenuation, 106, 107f, 118, 120 Page numbers followed by f indicate figures. Baseflow
Stream Reaches and Hydrologic Units
 Chapter United States 6 Department of Agriculture Natural Resources Conservation Service Chapter 6 Stream Reaches and Hydrologic Units Rain clouds Cloud formation Precipitation Surface runoff Evaporation
Phase II Report on Hydrology, Hydraulics, and Low Water Dams
 Phase II Report on Hydrology, Hydraulics, and Low Water Dams Arkansas River Corridor Tulsa, OK May 2005 Submitted To: U. S. Army Corps of Engineers Tulsa District Prepared by: The GUERNSEY Team 5555 N.
Modeling a Complex Hydraulic Environment Using a 1-D Approach Supplemented with Simple 2-D Principles Manas Borah Ed Dickson June 5, 2014
 ASFPM 2014 Annual Conference Modeling a Complex Hydraulic Environment Using a 1-D Approach Supplemented with Simple 2-D Principles Manas Borah Ed Dickson June 5, 2014 Agenda Overview and Background Hydrology
V. DRAINAGE IMPROVEMENTS
 V. DRAINAGE IMPROVEMENTS 5.1 Formulation of Drainage Improvements As indicated in Chapter 4, following the completion of the hydrologic analysis associated with future land use conditions, drainage improvements
2017 ANNUAL DAM AND DIKE INSPECTION REPORT
 2017 ANNUAL DAM AND DIKE INSPECTION REPORT ASH PONDS WELSH POWER PLANT CASON, TEXAS November, 2017 Prepared by: American Electric Power Service Corporation 1 Riverside Plaza Columbus, OH 43215 GERS-17-067
SECTION STORM DRAINAGE DESIGN, GRADING, AND WATER QUALITY TECHNICAL CRITERIA TABLE OF CONTENTS PAGE 402 STORM DRAINAGE DESIGN CRITERIA 400-1
 CITY OF THORNTON Standards and Specifications Revised: October 2012 SECTION 400 - STORM DRAINAGE DESIGN, GRADING, AND WATER QUALITY TECHNICAL CRITERIA TABLE OF CONTENTS PAGE 401 GENERAL PROVISIONS 400-1
CCR Certification: Initial Inflow Design Flood Control System Plan for the
 Submitted to Southern Indiana Gas & Electric Company dba Vectren Power Supply, Inc. (SIGECO) One Vectren Square Evansville, IN 4778 Submitted by AECOM 94 Amberglen Boulevard Austin, Texas 78729 October
Suspended Sediment Discharges in Streams
 US Army Corps of Engineers Hydrologic Engineering Center Suspended Sediment Discharges in Streams April 1969 Approved for Public Release. Distribution Unlimited. TP-19 REPORT DOCUMENTATION PAGE Form Approved
PRELIMINARY HYDROLOGY/HYDRAULICS ANALYSES RESULTS
 PRELIMINARY HYDROLOGY/HYDRAULICS ANALYSES RESULTS Coldstream Park Stream Corridor Restoration and Preservation Consent Decree SEP Prepared for Lexington-Fayette Urban County Government Division of Water
Considerations In Estimating Tailwater Elevations
 Considerations In Estimating Tailwater Elevations by Alphonse (Al) J. Stewart, P.E., President www.suncam.com Page 1 of 39 ************************************************************************ This
Hydraulic Design of Highway Culverts HDS 5 September 1985
 Hydraulic Design of Highway Culverts HDS 5 September 1985 Welcome to HDS 5 - Hydraulic Design of Highway Culverts Table of Contents Preface Tech Doc U.S. - SI Conversions DISCLAIMER: During the editing
Seepage Losses for the Rio Grande Project (Franklin Canal Case Study)
") Seepage Losses for the Rio Grande Project (Franklin Canal Case Study) Zhuping Sheng, Ph.D., P.E. Yaqi Wanyan, M.S., EIT Luis S. Aristizabal Kadambari Reddy, M.S., EIT TAMU, Agricultural Research and Extension
Seepage Losses for the Rio Grande Project (Franklin Canal Case Study) Zhuping Sheng, Ph.D., P.E. Yaqi Wanyan, M.S., EIT Luis S. Aristizabal Kadambari Reddy, M.S., EIT TAMU, Agricultural Research and Extension
Uncertainty in Hydrologic Modelling for PMF Estimation
 Uncertainty in Hydrologic Modelling for PMF Estimation Introduction Estimation of the Probable Maximum Flood (PMF) has become a core component of the hydrotechnical design of dam structures 1. There is
Engineering and legal aspects of a distributed storage flood mitigation system in Iowa
 University of Iowa Iowa Research Online Theses and Dissertations Fall 2011 Engineering and legal aspects of a distributed storage flood mitigation system in Iowa Travis Baxter University of Iowa Copyright
Inflow Design Flood Control System Plan for Louisa Generating Station CCR Impoundment. MidAmerican Energy Company
 Control System Plan for Louisa Generating Station CCR Impoundment MidAmerican Energy Company October 10, 2016 Control System Plan for Louisa Generating Station CCR Impoundment Prepared for MidAmerican
Volume 2, Chapter 10 - Storage
 Volume 2, Chapter 10 - Storage Users Guidance: If a UDFCD Section number in this chapter is skipped: It was adopted as is; please refer to that Section in the corresponding UDFCD Manual, Volume, Chapter
Hydrology and Flooding
 Hydrology and Flooding Background The 1996 flood Between February 4, 1996 and February 9, 1996 the Nehalem reporting station received 28.9 inches of rain. Approximately 14 inches fell in one 48 hour period.
EFFECT OF RAINGAGE DENSITY ON RUNOFF SIMULATION MODELING by ABSTRACT
 EFFECT OF RAINGAGE DENSITY ON RUNOFF SIMULATION MODELING by Ben Urbonas, P.E., D.WRE 1, Michael Paul Jansekok 2, James C.Y. Guo, PhD, P.E. 3 ABSTRACT Rainfall and runoff data for a 3.08 square mile urban
4.1 General Methodology and Data Base Development
 Chapter 4 METHODOLOGY 4.1 General and Data Base Development This report project utilized several computer software models and analysis techniques to create the numeric data on which decisions for this
Fargo-Moorhead Metropolitan Area Flood Risk Management Project
 Fargo-Moorhead Metropolitan Area Flood Risk Management Project 52ND ANNUAL IOWA ASCE ENVIRONMENTAL & WATER RESOURCES CONFERENCE 03 April 2014 Aaron W. Buesing Senior Hydraulic Engineer Corps of Engineers,
SECTION 3 DRAINAGE. 3-1 General. 3-2 Drainage Ordinances and Legal Requirements
 SECTION 3 DRAINAGE 3-1 General All Drainage plans for proposed development shall be prepared by a Professional Engineer registered in Virginia, except as noted below. Further, their seal and signature