Archimer
|
|
|
- Jayson Copeland
- 6 years ago
- Views:
Transcription
1 Please note that this is an author-produced PDF of an article accepted for publication following peer review. The definitive publisher-authenticated version is available on the publisher Web site Journal of Sea Research November 2011, Volume 66, Issue 4, Pages Published by Elsevier B.V. Archimer Modelling spatio-temporal variability of Mytilus edulis (L.) growth by forcing a dynamic energy budget model with satellite-derived environmental data Yoann Thomas a, *, Joseph Mazurié b, Marianne Alunno-Bruscia a, Cédric Bacher c, Jean-François Bouget b, Francis Gohin c, Stéphane Pouvreau a and Caroline Struski d a Ifremer, Laboratoire Physiologie et Écophysiologie des Mollusques Marins, 11 Presqu'île du Vivier, Argenton-en-Landunvez, France b Ifremer, Laboratoire Environnement Ressource Morbihan Pays de Loire, 12, rue des résistants, BP 86, La Trinité/Mer, France c Ifremer, Département Dynamiques de l'environnement côtier, BP 70, Plouzané, France d Ifremer, Laboratoire Environnement Ressource Finistère Bretagne Nord, 2bis, rue Grout St Georges, BP 46, Saint-Malo Cedex, France * Corresponding author :Y. Thomas, address : yothomas@ifremer.fr Abstract: In order to assess the potential of various marine ecosystems for shellfish aquaculture and to evaluate their carrying capacities, there is a need to clarify the response of exploited species to environmental variations using robust ecophysiological models and available environmental data. For a large range of applications and comparison purposes, a non-specific approach based on generic individual growth models offers many advantages. In this context, we simulated the response of blue mussel (Mytilus edulis L.) to the spatio-temporal fluctuations of the environment in Mont Saint-Michel Bay (North Brittany) by forcing a generic growth model based on Dynamic Energy Budgets with satellitederived environmental data (i.e. temperature and food). After a calibration step based on data from mussel growth surveys, the model was applied over nine years on a large area covering the entire bay. These simulations provide an evaluation of the spatio-temporal variability in mussel growth and also show the ability of the DEB model to integrate satellite-derived data and to predict spatial and temporal growth variability of mussels. Observed seasonal, inter-annual and spatial growth variations are well simulated. The large-scale application highlights the strong link between food and mussel growth. The methodology described in this study may be considered as a suitable approach to account for environmental effects (food and temperature variations) on physiological responses (growth, reproduction) of filter feeders in varying environments. Such physiological responses may then be useful for evaluating the suitability of coastal ecosystems for shellfish aquaculture. Research highlights We used satellite data (temperature, Chl-a) with a dynamic energy budget model. The model correctly describes the observed spatio-temporal variability in mussel growth. A large-scale application highlights the strong link between food and mussel growth. The methodology developed may be useful for evaluating the suitability of coastal ecosystems for shellfish aquaculture. Keywords: Mussel; DEB; SeaWifs; Aquaculture; site selection; resource management 1
2 1. Introduction Spatial planning provides a structural framework for activities in coastal areas, but requires support in important aspects of decision-making (Douvere and Ehler, 2009; Halpern et al., 2008). As part of the ecosystem-based approach to aquaculture, several reports have emphasized the interest of applying geographic information systems (GIS) as part of such an approach (Aguilar-Manjarrez et al., 2010; Soto et al., 2008). There is therefore a demand from institutions, especially at the European scale, for tools that can help optimize aquaculture practice, determine ecosystem carrying capacity, monitor water quality, restructure existing shellfish culture areas, assess maximum yield, select new potential sites and/or to assess fishing effort. The implementation of this type of tool requires an in-depth understanding of interactions between cultivated species and their environment (Dowd, 2005) in order to evaluate the carrying capacity of coastal areas, maintain cultivated species production and reduce ecological impacts. During the last decade, an increasing interest has been taken in the carrying capacity of shellfishgrowing areas (McKindsey et al., 2006). Investigations have been conducted through field studies comparing growth capacities in several coastal ecosystems (Waite et al., 2005), or by modelling approaches (Duarte et al., 2003; Jiang and Gibbs, 2005; Sara and Mazzola, 2004). Nevertheless, there is still a need for a generic modelling approach to clarify the response of bivalves to environmental variability, i.e. a model that would be valid and easy to implement at any site, for any species and that could be used over time. Such modelling tools will allow a better understanding of shellfish growth variability, which mainly depends on physico-chemical conditions (e.g. temperature) and food supply. Different bio-energetic models have been developed to explain the growth of bivalves according to the environmental conditions, i.e. temperature and food supply. Most of these are net production models based on the Scope for Growth (SFG) concept (Bayne, 1976); they use a detailed empirical sequence of steps for nutrition and resource allocation, based on allometric relationships, and assume that the assimilated energy is immediately available for maintenance, the remainder being used for growth or stored as reserves (Bacher et al., 1991; Barillé et al., 1997; Grant and Bacher, 1998; Schneider, 1992; Scholten and Smaal, 1998). Other, more mechanistic, models developed for bivalves are based on the dynamic energy budget (DEB) theory (Kooijman, 1986; Kooijman, 2010), which has been successfully applied to several marine species (Bacher and Gangnery, 2006; Bourlès et al., 2009; Cardoso et al., 2006; Casas and Bacher, 2006; Pouvreau et al., 2006; Ren and Ross, 2005; Rico-Villa et al., 2010; Rosland et al., 2009; Ross and Nisbet, 1990; Van Haren and Kooijman, 1993). DEB models do not use empirical allometric relationships, but simply state that feeding is proportional to surface area, whereas maintenance is scaled according to structural body volume. More generally, DEB theory proposes a generic energy budget approach that assumes common physiological processes among species and life stages via a set of parameters, the only difference among species lying in the values of the parameters. These promising arguments and recent successful applications led us to use the DEB model to estimate the growth response of blue mussel Mytilus edulis to a natural trophic gradient observed in a shellfish farming bay in North Brittany. Trophic resources are usually represented by the phytoplankton concentration (expressed as chlorophyll-a or cell concentration), because this resource seems able to explain most of the observed bivalve growth (Bacher and Gangnery, 2006; Bourlès et al., 2009; Pouvreau et al., 2006; Rosland et al., 2009). As an initial approach, chlorophyll-a may therefore be considered as a relevant descriptor of the trophic resource because it correlates with the phytoplankton biomass. The method used in the present study consists of coupling a dynamic energy budget approach with environmental data extracted from satellite images (i.e. chlorophyll-a concentration and temperature). Such data have the advantage over traditional measurements of being inexpensive, spatially extensive, automatically repeated in time and validated, i.e. well-correlated with discrete field measurements. Remote sensing of ocean-colour is a powerful technology, but few applications devoted to aquaculture have yet been developed (IOCCG, 2009a). Since the launch of the Sea-Viewing Wide Field-of-view Sensor (SeaWIFS) in 1997, a considerable data set has been collected from satellites (e.g. chlorophyll-a concentration, temperature and turbidity). These data have been shown to be very useful for phytoplankton monitoring in coastal waters (Gohin et al., 2003; Heim et al., 2005; Rivas et al., 2006). Satellite-derived chlorophyll-a concentration and particulate inorganic matter (PIM) have also been used for forcing and validating a biogeochemical model of the Bay of Biscay (Huret et al., 2007). 2
3 The objective of the present study is to simulate the growth and reproduction of the blue mussel (Mytilus edulis, L.) in response to spatio-temporal fluctuations of the environment (i.e. trophic resources, temperature), using an individual growth model based on Dynamic Energy Budgets (DEB) and integrating satellite-derived chlorophyll-a concentration and temperature data as forcing variables. Mont Saint-Michel Bay, one of the major shellfish aquaculture areas in France, was chosen as a study site. Numerous datasets collected on mussel growth and environmental conditions over many years are available for this site. After a model calibration step based on the monitoring of mussel growth over several years and several different locations, we applied our model to a broader area to assess the spatio-temporal variability of mussel growth and the suitability of new areas for mussel cultivation. 2. Methods 2.1. Study site and mussel culture Mont Saint-Michel Bay (MSMB) is a large sedimentary enclave (500 km² with 240 km² of inter-tidal area), opening on the English Channel ( Figure 1). The mean depth is 12 m. Due to strong tidal currents, the water column is well mixed with no vertical stratification. MSMB supports a high level of shellfish production. More than tons of saleable mussels are produced annually on poles in the bay, in addition to 5000 tons of Pacific oysters (Crassostrea gigas Th.) and 1500 tons of flat oysters (Ostrea edulis L.). The cultivation of mussels on poles follows four successive phases: (1) natural collection of mussel seed on ropes between March and May (no recruitment occurs in MSMB, so seed collection is made in other ecosystems and the seeded ropes are imported); (2) pole stocking with seeded ropes that are wrapped around the poles starting in March; (3) growing period of mussels on poles for ca. one and a half years; and (4) harvest, between June and December of the year following recruitment. In this large rearing area of around 1000 ha ( Figure 1), there are ca poles. Producers are faced with both inter-annual and spatial differences in mussel growth. For instance, growth gradients have been observed from the coast to the open sea and in the west-east direction (Mazurié et al., 2005). While the coast-offshore gradient can be largely explained by the tide inducing a gradient in immersion time (Baird, 1966; Seed, 1976), the west-east gradient in mussel growth is probably explained by differences in food concentration (Cugier et al., 2010a) Mussel growth data Growth data were collected in five sites of the farming area from west (site A) to east (site E) in the bay ( Figure 1). Samples were taken at a constant depth, corresponding to an average immersion time of 95 %, and concerned mussels grown according to two cultivation techniques. From 2003 to 2006, mussels were reared in bags. In 2004 and 2006, data were obtained for both mussels in bags and mussels grown on poles. Thus, data from a total of 23 growth surveys were used in this study ( Table 1). The bag survey provides standardized rearing conditions for mussels, especially with a standardized initial number of mussels per bag. The pole survey represents authentic rearing conditions with uncontrolled densities (i.e. number of mussels per pole), that were probably different between sites, depending on the initial density on ropes, mortality rate or falling during storms. For the bag survey ( ), 200 mussels from a common initial pool were randomly distributed in plastic nets (mesh size: 9 to 15 mm; volume 4 l). At the beginning of each survey, bags were tied to a pole at each station. Every month or two months, one bag was collected, sampled and analyzed. Details on sampling procedures are given in Table 1. For the professional survey in 2004, three poles were totally harvested at each station every two months, and subsamples were then collected and analyzed; in 2006, mussels were directly sampled from the poles. Thirty mussels from the bag surveys were measured for shell length (L, cm) and weighed (dry flesh mass, DFM, g). For the growth surveys on poles, sampling was conducted from April to October 2004 and from April to November Shell length was measured individually on sub-sample of 100 individuals and the mean dry flesh mass was estimated on a pool of 30 mussels. 3
4 2.3. Satellite data For the present work, satellite chlorophyll-a and temperature were collected every day from March 1998 to March 2007 at the scale of the whole of MSMB ( Seawater surface temperature data were obtained from NOAA-18 satellite measurements (night temperatures) at a daily step. Since very low differences were measured between locations, a single profile was used for forcing the DEB model. The SeaWIFS reflectance, or the normalized radiance leaving the water, from which it is derived, was used to estimate the chlorophyll-a (Chl-a) concentration, based on the OC4 algorithm (Gohin et al., 2002; O'Reilly et al., 1998). Chl-a data were extracted daily at midnight from SeaWIFS reflectance data at a 1-km² resolution. Only periods without strong nebulosity contain useful information; a specific merging method was thus applied to extract daily information (Saulquin et al., 2010). Satellite Chl-a concentrations have already been validated against in situ measurements in different locations including the MSMB (Gohin et al., 2008) DEB model The dynamic energy budget model used was developed on the basis of DEB theory (Kooijman, 2010). The dynamics of growth and reproduction can be fully described with equations that describe the dynamics of the energy reserve E, the dynamics of the energy allocated to the structural body volume E V, and the storage and use of the energy allocated to development (complexity acquisition before sexual maturity) and reproduction E R. We only provide the main equations that we used to simulate mussel growth ( Table 2). For a full description of the equations, see Rosland et al. (2009) and van der Meer et al. (2006). The DEB parameters used in the present study come from Rosland et al. (2009). Only the shape coefficient δ V and the half-saturation coefficient X K are calibrated (see 2.6). As a first approximation, spawning was induced by a critical gonado-somatic index (GI, %), defined as the ratio between the gonad mass and the total flesh mass, and a minimal temperature threshold T S. When these two thresholds are attained, the reproductive buffer E R is totally emptied. An average GI and a temperature threshold T S for spawning were adjusted by comparing observed and predicted spawning events. The observations of spawning events were deduced from the losses of dry flesh mass measured during each survey of this study Growth simulations Growth simulations were performed with MatLab software (The MathWorks TM, Inc. USA). Initial values of the state variables were derived from field measurements of seed mussels. Initial L and DFM were 0.75 cm and g, respectively. Due to the very low initial size, the reproductive buffer E R was considered to be empty at the beginning of the simulations. Initial DFM was then distributed between the structural volume E V, and storage E. Energy allocated to these two compartments was firstly constrained by the initial L and then energy allocated to E V was calculated according to equation (10) ( Table 2). The remainder was allocated to E according to equation (9) ( Table 2) Calibration step Calibration was carried out on the 23 available datasets ( Table 1). Mussel growth was simulated over two years starting from 15 March of the year before the growth study started, which corresponds to the date when new seeds are stocked on poles in MSMB. In our experiments, the mussels were reared for one year in site A and dispatched in the 5 sites the second year of rearing. Then, the environmental forcing variables used for the simulations were the same for all sites until the beginning of the second year and correspond to site A conditions. Afterwards, the satellite data points closest to each site were used. Initial conditions are considered to be homogenous and correspond to the seed mussel characteristics described above. The parameters X K and δ V were calibrated on the 23 growth curves, according to the Nelder and Mead simplex (for more details see DEBtool manual index.html in the subdirectory manual of DEBtool at The calibration was performed on both: shell length and DFM. The calibration on length, giving the best adjustment, was retained. The goodness-of-fit of the model was evaluated by linear regression between the observations (X) and 4
5 the simulations (Y), excluding the first values. This model was tested against the model Y = X at an α error threshold of 5 %. The R² coefficient of determination was used to indicate the amount of the variance explained by the model Large scale application As a large-scale application, we made a simulation of mussel growth in the whole of MSMB and an extension northward, outside the existing mussel farming area, up to the Chausey Islands. Growth was simulated at each of the 584 points documented for Chl-a and covering the whole of MSMB at a daily time step. Nine years of growth were simulated from 1998 to 2006, resulting in nine growth profiles. Each simulation started and ended on 15 March, which corresponds to the date when new seeds are stocked on poles in MSMB. Simulations were performed with an immersion time factor of 1 for the oceanic sectors and an immersion factor of 0.95 for intertidal sectors. Initial values of the state variables were derived from field measurements of seed mussels. Initial L and DFM were 0.75 cm and g, respectively. The final shell length and dry flesh mass were averaged over years for the 584 points, giving an indication of the spatial growth variability. Standard deviations (SD) of these averages were calculated in order to estimate the inter-annual variability of mussel growth over the years in the whole MSMB. 3. Results 3.1. Satellite data Seawater temperature fluctuated according to a seasonal pattern between a minimum of 6 C in February and a maximum of 20.4 C in August ( Figure 2). The annual mean was of C with an intra-annual standard deviation (SD) of 4.01 C corresponding to a coefficient of variation (CV = standard deviation / average) of % and an inter-annual SD of 0.26 C (CV = 1.98 %). Only slight differences were observed among sites within the whole area, with a mean SD of 0.17 C corresponding to a CV of 1.27 %. Chl-a generally exhibited a seasonal pattern, with maximum values in spring and minimum values in late autumn and winter ( Figure 2). The annual Chl-a concentration from 1998 to 2007 averaged 1.45 µg L -1 with an intra-annual SD of 1.15 µg L -1 (CV = 79.3 %) and an inter-annual SD of 0.32 µg L -1 (CV = %). The magnitude and timing of blooms appeared quite different among years. For example, the spring bloom reached 20 µg L -1 of Chl-a in 2001 in contrast to 2.5 µg L -1 in Figure 3 shows an example of data extracted from satellite images for May and December A positive geographical gradient could be observed from west to east in the bay with maximum values in the southeast part of the bay, close to the location E. The overall spatial SD averaged 0.54 µg L -1 corresponding to a mean CV of 37.6 %. This spatial distribution in Chl-a concentration may be clearly observed from May to September during the most productive period for primary production (i.e. highest Chl-a concentrations). For the rest of the year, there was no particular gradient. In winter, the measured concentrations revealed a strong homogeneity among locations Calibration step and model performance The calibration step that was performed on the 23 growth profiles gave a X K value of 1.61 µg L -1 and a shape coefficient (δ V ) value of These values were used in all our simulations. The observed mussel growth for both culture methods, i.e. bag and pole surveys, was correctly simulated by the model, both in shell length and dry flesh mass (DFM) ( Figure 4, 5), without any significant difference between observed and simulated growth, i.e. model Y = X ( Figure 6, Table 4). Moreover, there was no difference in the mussel growth between the two rearing methods (bags vs poles). Nonetheless, some dispersion among points appeared in the data, mainly for DFM, which may explain the low values of the determination coefficient, i.e. 49 % for bags and 52 % for poles. The simulated growth in shell length (L) exhibited a seasonal pattern with a period of rapid growth during the warm season from March to September, and a period of (almost) null growth during the cold season ( Figure 4, 5). Except for 2005, the model overestimated L of M. edulis during the first cold season, i.e. before the 15 April, but last part of the growth cycle was well described by the 5
6 model. Spatial and inter-annual variability were also well described by the model. For instance, the year 2003 shows high growth in L and DFM without any marked halt during the cold season. Conversely, the year 2005 exhibited slow growth, during both warm and cold seasons ( Figure 4). The spatial gradient was more pronounced for DFM profiles than for L profiles, with the highest growth found in the eastern part of the bay (site E) and the lowest growth in the western part (site A). The inter-annual growth variability implies a difference in the timing of spawning. As a consequence of the low growth in 2005, no spawning occurred during the first year of growth, whereas all the other annual surveys showed two spawning events, one during the first year and the other during the second year of the mussel growth cycle Large scale application The mean final length and dry flesh mass and their corresponding standard deviations were simulated and mapped over the whole bay ( 0). Both L and DFM showed a clear spatial pattern following a positive gradient from west to east ( 0a and 7b). Final L and DFM ranged, according to the different sectors, from 2.68 to 4.04 cm and from 0.22 to 0.72 g, respectively. The highest growth performances were found in the south-eastern part of the bay close to the river exit, and in a small area, east of the Chausey Islands. The lowest mussel growth was found in a small area in the eastern part of Cancale, in the southwest of the bay ( 0a, 7b). The inter-annual growth variability in L and DFM, expressed by the standard deviation (SD), exhibited specific spatial patterns. The variability in L appears to be independent of the mean, with the largest SD in the centre of the bay and the lowest SD close to the coast ( 0c). This pattern can be explained by the low variability in mussel length, ranging from 0.11 to 0.26 cm. Conversely, the standard deviation for DFM seems to be related to the mean, with a positive west to east gradient showing a large area of high variability covering the eastern half of the bay ( 0d). The dry flesh mass SD ranged from 0.05 to 0.1 g. For both L and DFM, the small area close to the Chausey Islands exhibits the lowest variability while the standardized variation, expressed by the coefficient of variation (CV), shows the same pattern, with low variability close to the coast ( 0e, 7f). Thus, length and dry flesh mass CV range from 2.8 to 8.3 % and from 8.8 to 26.3 %, respectively. 4. Discussion Since Bayne s Scope for Growth paper (Bayne, 1976), numerous studies have been conducted on the energy budget of mussels, Mytilus edulis. Different types of models for energy acquisition and allocation have been proposed for this species (Scholten and Smaal, 1998). In our study, we used the DEB model, which had previously been applied to M. edulis by Ross and Nisbet (1990) and by van Haren and Kooijman (1993). Based on a recent version of the DEB-mussel model developed by Rosland et al. (2009), we used satellite-derived environmental data (i.e. temperature and Chl-a) to describe the mussel growth variability in MSMB. To our knowledge, this is the first time that such a forcing has been made. The calibration step made it possible to validate the capability of the DEB model forced with satellite-derived data to describe spatial and temporal variability in mussel growth as observed on the field. As reported by Riera (2007) in a study with isotopic markers in MSMB, there is a prevalence of the phytoplankton in the mussel diet. Our results, using Chl-a as a food marker, seems to confirm this prevalence. Only two parameters of the model, the half-saturation coefficient X K and the shape coefficient δ V were calibrated. δ V defines how surface areas and volumes, which are linked to acquisition and maintenance processes, respectively, are related to one another. We made the choice of recalibrating δ V due to a systematic under-estimation of mussel DFM when using the value of given by Rosland et al. (2009) for Norwegian sites. We obtained as a new value of δ V for M. edulis in MSMB, which is closer to the δ V value of estimated by van der Veer et al. (2006). This parameter could then be site-specific, related to environmental parameters like hydrodynamics, density or food level, and possibly linked to rearing practices, e.g. cultivation method, rearing density (Alunno-Bruscia et al., 2001; Seed, 1968). The value of the half-saturation coefficient X K was 1.61 µg L -1, which is higher than the value of 1.29 µg L -1 found by Rosland et al. (2009) but still in the range of the confidence interval (0.85 to 2.65 µg L -1 ) provided by these authors. Since X K is likely diet- and environment-specific (Bourlès et al., 2009; Pouvreau et al., 2006; Alunno-Bruscia et al., submitted -this issue), differences between 6
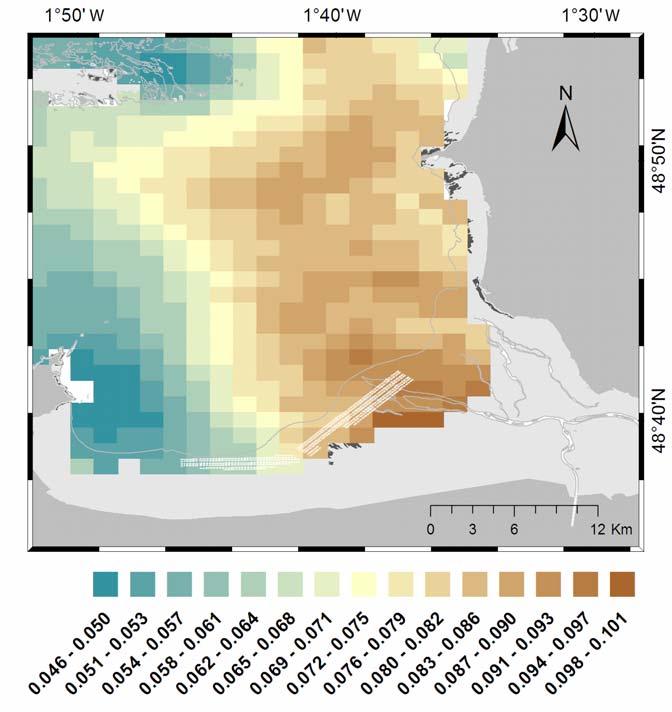
7 sites could be related to differences in the phytoplankton composition. In addition, one of the possible explanations for the difference among half-saturation coefficient values could be the sitespecific silt load, i.e. turbidity (Kooijman, 2006), or other particles rejected as pseudo-faeces. Indeed, compared to the low seston conditions in Norwegian sites, the waters of MSMB present higher phytoplankton concentrations and may contain higher inorganic matter (up to 50 mg L -1, unpublished data) due to the large inter-tidal area influenced by a strong tidal regime. Inorganic seston may be deleterious for suspension-feeding species (Kooijman, 2006; Ren, 2009). Incorporating inorganic matter into the functional response could, therefore, be a potentially useful way of improving our predictions and making it possible to apply the same parameterisation in different locations (Ren, 2009). Since satellite-derived data supply particulate inorganic matter (PIM) concentration the introduction of PIM concentration in the functional response may be an interesting prospect of this study. Nonetheless, it is noteworthy that a single value of X K allowed a good fit of the simulations against observations over a heterogeneous water body of 1000 ha and for 4 successive years. Despite the capacity of the satellite-chl-a signal to explain a large proportion of the mussel growth, the half saturation coefficient does not integrate the temporal variability in the food quality. This could explain some of the differences observed between our simulations and the observations. Energy uptake during spring and summer was under-estimated and, inversely, the energy uptake in autumn and winter was over-estimated ( Figure 4, 5). In coastal ecosystems, phytoplankton composition exhibits a clear diversity, showing a seasonal signal with species succession (Gailhard et al., 2002; Pannard et al., 2008). Some of the species contributing to the fluorescence signal could present morphological characteristics (e.g. size, shape) or toxicity deleterious to mussel ingestion and/or assimilation. Moreover, the carbon (C) to Chl-a ratio clearly shows that seasonal variability depends on nutrients, temperature and light (Cloern et al., 1995; Pridmore and Hewitt, 1984). The amount of energy contained in the same quantity of fluorescence could, therefore, be variable (minimum in winter, maximum in summer). In a recent study on modelling the growth of Crassostrea giga, the use of a variable rather than fixed Chl-a:C ratio allowed simulations to be improved (Grangeré et al., 2009). As long as Chl-a is used as a proxy of trophic resources, therefore, integration of a quality index for the seasonal variability of phytoplankton, might improve growth simulations significantly. In our study, the reproductive cycle of M. edulis has been simplified and the spawning events have been partially adjusted through different gonado-somatic index GI and temperature threshold T S. This simplification of the reproductive cycle could partly explain the poor fit between simulated and observed DFM, mainly during the spawning period. In temperate areas, the mussel M. edulis is well known to present a sexual cycle clearly alternating between a resting phase during summer, with accumulation of glycogen storage, and a gametogenesis phase over the rest of the year (Lubet, 1956; Lubet, 1959). To improve the prediction of sexual cycle dynamics and the date of spawning, a new state variable giving the dynamics of gamete production and gonad shrinking could be incorporated, as developed for C. gigas by Bernard et al. (submitted -this issue). In any case, despite the present lack of precision, our simulations point out the link between the food variability and the reproductive dynamics of M. edulis. The first year spawning appears to be highly determined by the amount of food, as simulated in 2005 when no spawning occurred. In the DEB theory, however, the energy allocated to reproduction usually does not affect the structure compartment and the individual length - at least when food supply is large enough to support maintenance costs (Pouvreau et al., 2006). Any improvement of the reproduction mechanisms would likely not modify length predictions. The large-scale application of the model beyond the current rearing area showed both spatial and temporal variability in mussel growth performances. The overall trend appeared strongly linked to the spatio-temporal variability in Chl-a concentration. A gradient of growth from the coast to the outer part of the bay is demonstrated, mainly in the eastern part of the bay. The inter-annual variability in DFM, expressed by the standard deviation, exhibits a spatial pattern highly linked to the mean DFM gradient: the highest absolute variations were recorded close to the coast. However, due to the lowest magnitude of the variability in shell length, the spatial pattern of its inter-annual variability did not follow the mean pattern, and exhibited higher values in the centre of the bay than close to the coast. For both L and DFM, the standardized variation expressed in terms of coefficient of variation shows the same pattern, with the lowest variability close to the coast. The area close to the coast in the eastern part of the bay, therefore, seems to be a sector with good growth that would be suitable for the extension of mussel farming activities. Enrichment by terrestrial nutrients through rivers located in the southeast of the bay may explain the high growth of M. edulis in this sector. Conversely, the southwest part of 7
8 the bay showed the lowest mussel growth. This may be explained by the filtration pressure of the cultivated (M. edulis, C. gigas and O. edulis) and invasive (Crepidula fornicata) mollusc species, concentrated in the western part of the bay (Cugier et al., 2010a). It is clear that Chl-a concentration reflects the actual interactions between primary production and benthic filter-feeders and would change in relation to variability of nutrient inputs, extension of mussel farming and changes in other competitors (Cugier et al., 2010a, Cugier et al., 2010b). We did not examine longterm changes but very recent work showed that temperature and Chl-a exhibit several patterns of inter-annual variability. Regional climate influences coastal European systems and modifies physical and chemical parameters and Chl-a (Goberville et al., 2010). It has been attributed to temperature, local atmospheric and ocean circulation. In the Bay of Biscay (close to the English Channel), the temperature evolution over the past 40 years has been investigated by using field data completed with satellite data (Michel et al., 2009). A strong warming of 0.2 C per decade has been found over the period from 1965 to This trend is not steady, as a cooling period occurred until the early 1970s, and the temperature increase has been significantly stronger during the last 20 years (0.3 C per decade from 1986 to 2005). The inter-annual variability is also very important. Michel et al. (2009) highlighted the potential implications with respect to species distribution and dynamics of species exploited by fisheries. These effects remain to be assessed, and DEB models are likely to be used in a near future to assess the response of biological traits to environmental changes (Kearney et al., 2010). Again, the combination of DEB models and satellite images offers an excellent opportunity to investigate long term ecosystem changes. Understanding and predicting spatial structures and marine ecosystem dynamics in relation to environmental variability require complementary tools combining models and observations at different scales. This also stands for carrying capacity assessment, and it has been acknowledged that no single tool would address all dimensions of carrying capacity in the frame of Ecosystem Approach to Aquaculture (EAA). The integration of several levels of organisation, e.g. individual, population and ecosystem (Beadman et al., 2002) is a major stake in the EAA (Soto et al., 2008). In a recent paper Nunes et al. (2011) illustrate how assessment tools associated in a multi-method evaluation framework address different scales. At ecosystem scale, the coupling between different types of models (DEB, ecosystem, etc.) has already been successfully implemented to assess the interactions between cultivated species and ecosystem dynamics (Grangeré et al., 2010; Guyondet et al., 2010; Duarte et al., 2003; Cugier et al., 2010a). Our approach lies in between system and local scales issues, since we screen spatial variability of potential mussel growth over a whole ecosystem. The information provided by our model can help local farmers to select sites according to an indicator of potential growth. We suggest that a quantitative indicator of mussel growth improves suitability indices resulting from a combination of several types of information commonly used in the building of suitability indicators. With respect to environmental constraints, Radiarta et al. (2008) only consider qualitative information, e.g. minimum and maximum temperature, salinity and chlorophyll ranges. Ecophysiological models clearly show that, within such suitability domains, a large variation of individual growth is expected. However, it must be kept in mind that this extrapolated growth assumes low densities of mussels. Indeed, this approach neglects the depletion of food density that necessarily results from the establishment of high stock levels, as reported by Cugier et al. (2010a) for the western part of MSMB. A straightforward development would take into account local density effects through the so-called depletion models (Bacher et al., 2003) or farm-scaled models (Nunes et al., 2011). Such models require input data which come from discrete sampling (Bacher et al., 2003) or ecosystem models (Nunes et al., 2011). Alternatively, the use of satellite images will allow to replace scarce input data (temperature, Chl-a) by datasets continuous over time and space. We therefore intend to provide farmers with additional information on suitable density (with respect to farm scale production and environment impact). It would exactly follow the computing steps described by Bacher et al. (2003). Our model may therefore be considered as a suitable method to account for environmental impacts (food and temperature variations) on the response (growth and reproduction) of an organism subject to varying environmental conditions. Such biological responses may also be included in a Geographical Information System describing the potential uses of a coastal area (Kapetsky and Aguilar-Manjarrez, 2007; Radiarta et al., 2008; Salam et al., 2003) and, thus, contribute to spatial planning of coastal ecosystems by addressing three issues: suitability of sites for aquaculture, extension of the aquaculture area, and response of ecosystems to aquaculture. 8
9 5. Conclusion The use of ocean-colour radiometry (OCR) is an appealing option for several reasons - spatial coverage, accuracy of the Ch-a estimation, temporal scales, availability on internet servers. OCR data supply precious information on spatial and temporal variability of environmental parameters, i.e. surface temperature, Chl-a and PIM concentration, surface height and waves, ice cover and (soon) surface salinity. Thanks to the spatial coverage and timeframe of satellite images, it is possible to assess long term variability at a spatial resolution which is consistent with ecological issues - e.g. spatio-temporal variability of phytoplankton in relation with primary production, classification of ecosystem types, detection of harmful algae blooms, assessment of ecosystem changes, indicators of ecosystem health and response to environmental drivers and anthropogenic pressures. IOCCG (2008, 2009b) has published very complete reports on operational uses of OCR in marine areas. The value of satellite data for the management of marine resources has become obvious and is emphasized in a number of recent publications (Aguilar-Manjarrez et al., 2010; IOCCG, 2009a). In our paper we described how the combination of remote sensing and modelling provides a map of biological traits for one species in the context of carrying capacity. The results rely upon very few assumptions and give robust and sensible indicators of mussel growth in various places, which makes the approach very attractive for a wide range of issues, e.g. carrying capacity assessment, responses of biological traits to long term environmental changes, assessment of trophic limitations for filter-feeders. Our work relates to interesting and powerful future analyses and developments along two directions. First, the coupling of DEB and farm models (Rosland et al., accepted -this issue) will be implemented using OCR data as input data (temperature, Chl-a) and will allow to predict local mussel production. Second, the combination of OCR data and DEB models for several documented species can be used to investigate the effect of long term environmental changes on biological traits at regional scales (e.g. the English Channel), with reference to the framework described by Kearney et al. (2010) who aim at linking bioenergetics and niche ecology in order to explain habitat structure and ecosystem functions. Acknowledgments This study was supported by the Programme National Environnement Côtier (PNEC) and the AquaDEB network ( The authors would like to express their gratitude to the mussel producers and to the regional shellfish association (SRC) for their efficient help and support. The authors also thank I. Bernard and J.-Y. Stanisière for their efficient help in the development of MatLab code and for the satellite data extraction, and H. McCombie for her helpful comments and English revision. References Aguilar-Manjarrez, J., Kapetsky, J. M., Soto, D., The potential of spatial planning tools to support the ecosystem approach to aquaculture. FAO/Rome. Expert Workshop November 2008, Rome, Italy. FAO Fisheries and Aquaculture Proceedings. No.17. Rome, FAO., 176p. Alunno-Bruscia, M., Bourget, E., Frechette, M., Shell allometry and length-mass-density relationship for Mytilus edulis in an experimental food-regulated situation. Mar. Ecol. Prog. Ser. 219, Alunno-Bruscia, M. Bourlès, Y., Maurer, D., Robert, S., Mazurié, J., Gangnery, A., Goulletquer, P., Pouvreau, S. Submitted. A single bioenergetics growth and reproduction model for the oyster Crassostrea gigas in six Atlantic ecosystems. J. Sea Res. this issue. Bacher C., Grant J., Hawkins A., Fang J., Zhu M., Besnard M., Modelling the effect of food depletion on scallop growth in Sungo Bay (China). Aquatic Living Resources, 16, Bacher, C., Gangnery, A., Use of dynamic energy budget and individual based models to simulate the dynamics of cultivated oyster populations. J. Sea Res. 56,
10 Bacher, C., Héral, M., Deslous-Paoli, J. M., Razet, D., Modèle énergétique uni-boîte de la croissance des huîtres (Crassostrea gigas) dans le bassin de Marennes-Oléron. Can. J. Fish. Aquat. Sci. 48, Baird, R. H., Factors affecting the growth and condition of mussels (Mytilus edulis L), fishery investigation. Ministry of Agriculture, Fisheries and Food, London, Ser. II 25, Barillé, L., Héral, M., Barillé-Boyer, A. L., Modélisation de l'écophysiologie de l'huître Crassostrea gigas dans un environnement estuarien. Aquat. Living Resour. 10, Bayne, B. L., Marine Mussels: Their Ecology and Physiology. Cambridge University Press, Cambridge, 506 pp. Beadman, H. A., Willows, R. I., Kaiser, M. J., Potential applications of mussel modelling. Helg. Mar. Res. 56, Bernard, I., De Kermoysan, G., Pouvreau, S. Submitted. Effect of phytoplankton and temperature on the reproduction of the Pacific oyster Crassostrea gigas: investigation through DEB theory. J. Sea Res. -this issue. Bourlès, Y., Alunno-Bruscia, M., Pouvreau, S., Tollu, G., Leguay, D., Arnaud, C., Goulletquer, P., Kooijman, S. A. L. M., Modelling growth and reproduction of the Pacific oyster Crassostrea gigas: Advances in the oyster-deb model through application to a coastal pond. J. Sea Res. 62, Cardoso, J., Witte, J. I., van der Veer, H. W., Intra- and interspecies comparison of energy flow in bivalve species in Dutch coastal waters by means of the Dynamic Energy Budget (DEB) theory. J. Sea Res. 56, Casas, S., Bacher, C., Modelling trace metal (Hg and Pb) bioaccumulation in the Mediterranean mussel, Mytilus galloprovincialis, applied to environmental monitoring. J. Sea Res. 56, Cloern, J. E., Grenz, C., Vidergar-Lucas, L., An empirical model of the phytoplankton chlorophyll: carbon ration - the conversion factor between productivity and growth rate. Limnol. Oceanogr. 40, Cugier, P., Struski, C., Blanchard, M., Mazurié, J., Pouvreau, S., Olivier, F., Trigui, J. R., Thiébaut, E., 2010a. Assessing the role of benthic filter feeders on phytoplankton production in a shellfish farming site: Mont Saint Michel Bay, France. J. Marine Syst. 82, Cugier P., Frangoudes K., Blanchard M., Mongruel R., Perez J., Le Mao P., Robin T., Fontenelle G., Mazurie J., Cayocca F., Pouvreau S., Olivier F., 2010b. Impact des facteurs environnementaux et des pratiques conchylicoles sur la baie du Mont Saint-Michel et la production conchylicole. Etude de scenarii par modélisation. Programme Liteau 3. Rapport Final. Douvere, F., Ehler, C. N., New perspectives on sea use management: Initial findings from European experience with marine spatial planning. J. Environ. Manage. 90, Dowd, M., A bio-physical coastal ecosystem model for assessing environmental effects of marine bivalve aquaculture. Ecol. Model. 183, Duarte, P., Meneses, R., Hawkins, A. J. S., Zhu, M., Fang, J., Grant, J., Mathematical modelling to assess the carrying capacity for multi-species culture within coastal waters. Ecol. Model. 168, Gailhard, I., Gros, P., Durbec, J. P., Beliaeff, B., Belin, C., Nezan, E., Lassus, P., Variability patterns of microphytoplankton communities along the French coasts. Mar. Ecol. Prog. Ser. 242, Goberville, E., Beaugrand, G., Sautour, B., Treguer, P., Team, S., Climate-driven changes in coastal marine systems of western Europe. Mar. Ecol. Prog. Ser. 208, Gohin, F., Druon, J. N., Lampert, L., A five channel chlorophyll concentration algorithm applied to SeaWiFS data processed by SeaDAS in coastal waters. Internat. J. Remote Sensing 23, Gohin, F., Lampert, L., Guillaud, J. F. O., Herbland, A., Nezan, E., Satellite and in situ observations of a late winter phytoplankton bloom, in the northern Bay of Biscay. Cont. Shelf Res. 23, Gohin, F., Saulquin, B., Oger-Jeanneret, H., Lozac'h, L., Lampert, L., Lefebvre, A., Riou, P., Bruchon, F., Towards a better assessment of the ecological status of coastal waters using satellite-derived chlorophyll-a concentrations. Remote Sensing Envir. 112, Grangeré, K., Lefebvre, S., Bacher, C., Cugier, P., Ménesguen, A., Modelling the spatial heterogeneity of ecological processes in an intertidal estuarine bay: dynamic interactions between bivalves and phytoplankton. Mar. Ecol. Prog. Ser. 415,
11 Grangeré, K., Ménesguen, A., Lefebvre, S., Bacher, C., Pouvreau, S., Modelling the influence of environmental factors on the physiological status of the Pacific oyster Crassostrea gigas in an estuarine embayment; The Baie des Veys (France). J Sea Res. 62, Grant, J., Bacher, C., Comparative models of mussel bioenergetics and their validation at field culture sites. J. Exp. Mar. Biol. Ecol. 219, Guyondet, T., Roy, S., Koutitonsky, V.G., Grant, J., Tita, G., Integrating multiple spatial scales in the carrying capacity assessment of a coastal ecosystem for bivalve aquaculture. J. Sea Res. 64, Halpern, B. S., Walbridge, S., Selkoe, K. A., Kappel, C. V., Micheli, F., D'Agrosa, C., Bruno, J. F., Casey, K. S., Ebert, C., Fox, H. E. et al., A global map of human impact on marine ecosystems. Science 319, Heim, B., Oberhaensli, H., Fietz, S., Kaufmann, H., Variation in Lake Baikal's phytoplankton distribution and fluvial input assessed by SeaWiFS satellite data. Global Planet. Change 46, Huret, M., Gohin, F., Delmas, D., Lunven, M., Garçon, V., Use of SeaWiFS data for light availability and parameter estimation of a phytoplankton production model of the Bay of Biscay. J. Mar. Syst. 65, IOCCG, Why Ocean Colour? The Societal Benefits of Ocean-Colour Technology. Platt, T., Hoepffner, N., Stuart, V. and Brown, C. (eds.), Reports of the International Ocean-Colour Coordinating Group, No. 7, IOCCG, Dartmouth, Canada. IOCCG. 2009a. Remote sensing in fisheries and aquaculture. Forget, M.-H., Stuart, V. and Platt, T., (eds.), Reports of the international Ocean-Colour Coordinating Group, No. 8, IOCCG, Dartmouth, Canada. IOCCG, 2009b. Partition of the Ocean into Ecological Provinces: Role of Ocean-Colour Radiometry. Dowell, M. and Platt, T. (eds.), Reports of the International Ocean-Colour Coordinating Group, No. 9, IOCCG, Dartmouth, Canada. Jiang, W. M., Gibbs, M. T., Predicting the carrying capacity of bivalve shellfish culture using a steady, linear food web model. Aquaculture 244, Kapetsky, J. M., Aguilar-Manjarrez, J., Geographic information systems, remote sensing and mapping for the development and management of marine aquaculture. FAO Fisheries Technical Paper No Rome, FAO, 125 pp. Kearney M., Simpson S., Raubenheimer D., Helmuth B., Modelling the ecological niche from functional traits. Phil. Trans. R. Soc. B 12, 365, , doi: /rstb Kooijman, S., Energy budget can explain body size relations. J. Theor. Biol. 121, Kooijman, S., Pseudo-faeces production in bivalves. J. Sea Res. 56, Kooijman, S. A. L. M., Dynamic Energy Budget Theory for Metabolic Organisation. Cambridge University Press, 3rd edition, 514 pp. Lubet, P., Cycle sexuel de Mytilus edulis L. et de Mytilus galloprovincialis Lmk. dans le bassin d'arcachon (Gironde). Colloque internationa de biologie marine. Annales de Biologie 33. Lubet, P., Recherche sur le cycle sexuel et l'émission des gamètes ches les Mytilidés et les Pectinidés (mollusques bivalves). Revue des Travaux de l'institue des Pêches Maritimes 23. Mazurié, J., Bouget, J. F., Thomas, Y., Croissance et production mytilicole en Baie du Mont Saint-Michel, après restructuration : compte-rendu final de l étude sur 15 pieux entre avril 2004 et janvier Rapport interne Ifremer RST/LER-MPL/05-10 Septembre 2005 ( McKindsey, C. W., Thetmeyer, H., Landry, T., Silvert, W., Review of recent carrying capacity models for bivalve culture and recommendations for research and management. Aquaculture 261, Michel S., Vandermeirsch F., Lorance P., Evolution of upper layer temperature in the Bay of Biscay during the last 40 years. Aquat. Living Resour. 22, Nunes, J.P., Ferreira J.G., Bricker S.B., O'Loan B., Dabrowski T., Dallaghan B., Hawkins A.J.S., O'Connor B., O'Carroll T., Towards an ecosystem approach to aquaculture: Assessment of sustainable shellfish cultivation at different scales of space, time and complexity. Aquaculture, doi: /j.aquaculture O'Reilly, J. E., Maritorena, S., Mitchell, B. G., Siegel, D. A., Carder, K. L., Garver, S. A., Kahru, M., McClain, C., Ocean color chlorophyll algorithms for SeaWiFS. J. Geophys. Res. 103,
12 Pannard, A., Claquin, P., Klein, C., Le Roy, B., Veron, B., Short-term variability of the phytoplankton community in coastal ecosystem in response to physical and chemical conditions' changes. Estu. Coast. Shelf Sci. 80, Pouvreau, S., Bourlès, Y., Lefebvre, S., Gangnery, A., Alunno-Bruscia, M., Application of a dynamic energy budget model to the Pacific oyster, Crassostrea gigas, reared under various environmental conditions. J. Sea Res. 56, Pridmore, R. D., Hewitt, J. E., Chlorophyll a as an indicator of phytoplankton cell volum in 12 lakes, North-Island, New-Zeland. New Zeal. J. Bot. 22, Radiarta, I. N., Saitoh, S. I., Miyazono, A., GIS-based multi-criteria evaluation models for identifying suitable sites for Japanese scallop (Mizuhopecten yessoensis) aquaculture in Funka Bay, southwestern Hokkaido, Japan. Aquaculture 284, Ren, J. S., Effect of food quality on energy uptake. J. Sea Res. 62, Ren, J. S., Ross, A. H., Environmental influence on mussel growth: A dynamic energy budget model and its application to the greenshell mussel Perna canaliculus. Ecol. Model. 189, Rico-Villa, B., Bernard, I., Robert, R., Pouvreau, S., A Dynamic Energy Budget (DEB) growth model for Pacific oyster larvae, Crassostrea gigas. Aquaculture 305, Riera, P., Trophic subsidies of Crassostrea gigas, Mytilus edulis and Crepidula fornicata in the Bay of Mont Saint Michel (France): A δ13c and δ15n investigation. Estuar. Coast. Shelf S. 72, Rivas, A. L., Dogliotti, A. I., Gagliardini, D. A., Seasonal variability in satellite-measured surface chlorophyll in the Patagonian Shelf. Cont. Shelf Res. 26, Rosland, R., Strand, Ø., Alunno-Bruscia, M., Bacher, C., Strohmeier, T., Applying Dynamic Energy Budget (DEB) theory to simulate growth and bio-energetics of blue mussels under low seston conditions. J Sea Res. 62, Rosland R., Bacher C., Strand Ø., Aure J., Strohmeier T., Accepted. Modelling growth variability in longline mussel farms as a function of stocking density and farm design. J. Sea Res. -This issue. Ross, A. H., Nisbet, R. M., Dynamic models of growth and reproduction of the mussel Mytilus edulis L. Funct. Ecol. 4, Salam, M. A., Ross, L. G., Beveridge, C. M. M., A comparison of development opportunities for crab and shrimp aquaculture in southwestern Bangladesh, using GIS modelling. Aquaculture 220, Sara, G., Mazzola, A., The carrying capacity for Mediterranean bivalve suspension feeders: evidence from analysis of food availability and hydrodynamics and their integration into a local model. Ecol. Model. 179, Saulquin, B., Gohin, F., Garrello, R., Regional objective analysis for merging high resolution MERIS, MODIS/Aqua and SeaWiFS Chlorophyll-a data from 1998 to 2008 on the European Atlantic Shelf. IEEE Transaction on Geoscience and Remote Sensing. Schneider, D. W., A bioenergetics model of zebra mussel, Dreissena polymospha, growth in the Great-Lakes. Can. J. Fish. Aquat. S. 49, Scholten, H., Smaal, A. C., Responses of Mytilus edulis L. to varying food concentrations: testing EMMY, an ecophysiological model. J. Exp. Mar. Biol. Ecol. 219, Seed, R., Factors Influencing Shell Shape in the Mussel Mytilus Edulis. J. Mar. Biol. Ass. U.K. 48, Seed, R., Ecology. In : Bayne, B.L. (Ed.), Marine Mussels : their ecology and physiologie. IBP, vol. 10. Cambridge Univ. Press, Cambridge, pp Soto, D., Aguilar-Manjarrez, J., Hishamunda, N., Building an ecosystem approach to aquaculture. FAO Fisheries and Aquaculture Proceedings, No. 14 Rome, 221P. van der Meer, J., An introduction to Dynamic Energy Budget (DEB) models with special emphasis on parameter estimation. J. Sea Res. 56, van der Veer, H. W., Cardoso, J., van der Meer, J., The estimation of DEB parameters for various Northeast Atlantic bivalve species. J. Sea Res. 56, Van Haren, R. J. F., Kooijman, S., Application of dynamic energy budget model to Mytilus edulis (L.). Neth. J Sea Res. 31, Waite, L., Grant, J., Davidson, J., Bay-scale spatial growth variation of mussels Mytilus edulis in suspended culture, Prince Edward Island, Canada. Mar. Ecol. Prog. Ser. 297,
13 Tables Table to Summary of the 23 mussel growth surveys made in Mont Saint Michel Bay from Starting and last Year Survey Site Sampling frequency dates 2003 Bag test A 1 month March 03 Feb site bag survey A, B, D 2 months April 04 Feb site pole survey A, B, C, D, E 2 months April 04 Jan site bag survey A, B, C, D 2 months March 05 Jan site bag survey A, B, C, D, E 2 months Oct. 05 Feb site pole survey A, B, C, D, E 2 months Jan. 06 Feb. 07 Table 2 Equations describing the energy fluxes in the DEB model. X corresponds to the food concentration (Chl a, µg l -1 ) and T to the water temperature (K). See table 3 for the parameter description. n Flux description Equation (1) Ingestion X p X J Xm X X k V 2/3 ft (2) Assimilation p A A p X (3) Utilization E /V [E p C G ] p Am V 2/3 [ p M ].V [E G ] E /V [E m ] (4) Somatic growth p G p C p M (5) Somatic maintenance p M p M V ft (6) Maturation p R 1 p C p J (7) Maturation maintenance p J minv,v p (8) Temperature effect f T (9) (10) Total dry flesh mass calculation Conversion of structural volume (V) into physical length (L) p M 1 f T exp T A T A 1 exp T AL T 1 T T T AL exp T AH T L T H DFM E E R E V µ E [E G ] (1 ) L V 1/3 V with V E V [E G ] T AH T 1 13
14 Table 3 DEB parameters used for Mytilus edulis in this study. Parameter Symbol Unit Value Ref. Arrhenius temperature T A K 5800 a Max. surf. area-specific ingestion rate p Xm J cm -2 d a Half-saturation coefficient X K µg Chl a l c Assimilation efficiency A a Volume-specific cost of growth E G J cm a Volume-specific cost of maintenance p M J cm -3 d a Maximum energy density E m J cm a Structural volume at sexual maturity V p cm a Fraction of energy used for growth and a Shape ti coefficient i t M c Structural volume density g cm -3 1 b Water content of the flesh ω % 80 b Lower limit of the tolerance range T L K 275 a Upper limit of the tolerance range T H K 296 a Arrhenius temperature at the lower limit T AL K a Arrhenius temperature at the upper limit T AH K a Reference temperature T 1 K 293 a Energy content of food µ E J g b a Rosland et al. (2009), b Pouvreau et al. (2006), c this study Table 4 Comparison between observed and simulated results for length (L) and dry flesh mass (DFM) of Mytilus edulis for the bag and pole surveys in Mont Saint Michel Bay; coefficient of determination (R²), slope of the regression (a) and p value for a = 1 (p slope ). Bags Poles Parameter L DFM L DFM R² a p slope < < < <
15 Figures Figure 1. Geographical position and morphology of Mont-Saint-Michel Bay (MSMB), North Brittany. Identification of the 5 sampling sites (A, B, C, D and E) in the mussel-rearing area. Figure 2. Water temperature ( C) and chlorophyll-a concentration as measured by NOAA- 18 and SeaWIFS satellites, respectively, from January 1998 to December Black lines correspond to the average values calculated over the whole area and grey lines give the corresponding mean +/- standard deviation. Figure 3. Examples of monthly average chlorophyll-a concentrations (µg L -1 ) in (a) May and (b) December 2003, as extracted from the satellite image at the scale of Mont Saint- Michel Bay. Figure 4. Simulations (lines) and observations (symbols) of the shell length (cm) and dry flesh mass (g) for mussels reared in bags in 2003, 2004, 2005 and 2006 at 5 sites A ( ), B ( ---), C ( ), D ( ) and E ( ---) in Mont Saint-Michel Bay. Time begins on 15 March. Figure 5. Simulations (lines) and observations (symbols) of the shell length (cm) and dry flesh mass (g) for mussels reared on poles in 2004 and 2006 at 5 sites A ( ), B ( ---), C ( ), D ( ) and E ( ---). Time begins on 15 March. Figure 6. Simulations plotted against observations of the shell length (cm) and dry flesh mass (g), for mussels cultivated in bags (open circles) and on poles (black circles), data compiled over all years. Maps of the final averaged shell length (cm; a) and dry flesh mass (g; b) simulated by the DEB model. Standard deviations (SD) and coefficient of variation (CV) are given respectively for shell length (SD: c; CV: e) and dry flesh mass (SD: d; CV: f). 15

16 Figure 1 16
17 Figure 2 17


18 a b Figure 3 18
19 Figure 4 19
20 Figure 5 20
21 Figure 6 21


22 a b 0 c d 22

23 0 e f 23

24 0 24
GENERIC : Conception and application of a generic model of growth, reproduction and survival in the Pacific oyster Crassostrea gigas
 GENERIC : Conception and application of a generic model of growth, reproduction and survival in the Pacific oyster Crassostrea gigas by Yves BOURLES 1, 2 Université de La Rochelle Dec 2004 - Dec 2007 PhD
GENERIC Conception and application of a generic model of growth, reproduction and survival in the Pacific oyster Crassostrea gigas
 GENERIC Conception and application of a generic model of growth, reproduction and survival in the Pacific oyster Crassostrea gigas by Yves BOURLES 1, 2 Université de La Rochelle Dec 2004 - Dec 2007 PhD
Applying Dynamic Energy Budget (DEB) theory to simulate growth and bio-energetics of blue mussels under low seston conditions
 theory to simulate growth and bio-energetics of blue mussels under low seston conditions") Please note that this is an author-produced PDF of an article accepted for publication following peer review. The definitive publisher-authenticated version is available on the publisher Web site Journal
Please note that this is an author-produced PDF of an article accepted for publication following peer review. The definitive publisher-authenticated version is available on the publisher Web site Journal
Follow this and additional works at:
 International Congress on Environmental Modelling and Software Brigham Young University BYU ScholarsArchive 5th International Congress on Environmental Modelling and Software - Ottawa, Ontario, Canada
RISK ASSESSMENT OF THE POTENTIAL DECREASE OF CARRYING CAPACITY BY SHELLFISH FARMING
 CASE STUDY 6.2 RISK ASSESSMENT OF THE POTENTIAL DECREASE OF CARRYING CAPACITY BY SHELLFISH FARMING C. Bacher 1 and E. Black 2 1 Manager of IFREMER Program on Dynamics and Health of Coastal and Estuarine
Journal of Sea Research
 Journal of Sea Research 62 (2009) 62 71 Contents lists available at ScienceDirect Journal of Sea Research journal homepage: www.elsevier.com/locate/seares Modelling growth and reproduction of the Pacific
Need & Opportunities for more integrated farming practices in coastal and offshore aquaculture. Patrick Sorgeloos Ghent University, Belgium
 Need & Opportunities for more integrated farming practices in coastal and offshore aquaculture Patrick Sorgeloos Ghent University, Belgium The Ny-Ålesund Symposium 2016 Ny-Ålesund, Svalbard-Norway, September
Models for the assessment of sustainability and risk in fish and shellfish aquaculture
 Models for the assessment of sustainability and risk in fish and shellfish aquaculture TABLE OF CONTENTS LONGLINE ENVIRONMENT CONTEXT & EXPERIENCE FISH FARMING: CREATING A SUSTAINABLE INDUSTRY ACCESS MARKETS
Nutrients, Algal Blooms and Red Tides in Hong Kong Waters. Paul J. Harrison and Jie XU
 Nutrients, Algal Blooms and Red Tides in Hong Kong Waters Paul J. Harrison and Jie XU Division of Environment, Hong Kong University of Science & Technology 1. Introduction The Pearl River is China's second
The nature (peculiarities) of biooptical/biogeochemical. measurements in the context of Argo QC and data management.
 of biooptical/biogeochemical. measurements in the context of Argo QC and data management.") The nature (peculiarities) of biooptical/biogeochemical data and of their measurements in the context of Argo QC and data management Hervé Claustre Prerequisite for Bio-Argo DM: We should follow as much
The nature (peculiarities) of biooptical/biogeochemical data and of their measurements in the context of Argo QC and data management Hervé Claustre Prerequisite for Bio-Argo DM: We should follow as much
Farm. Offshore Aquaculture
 Farm Offshore Aquaculture TABLE OF CONTENTS ABOUT LONGLINE ENVIRONMENT EXECUTIVE SUMMARY FARM AQUACULTURE RESOURCE MANAGEMENT THE APPLICATION OF FARM FARM DESCRIPTION DATA REQUIREMENTS FURTHER INFORMATION
Izabela Zgud, Adam Sokołowski, Maciej Wołowicz
 Preliminary results of experimental study on application of Mytilus trossulus farming to remediate the environmental state of the southern Baltic Sea (Poland) Izabela Zgud, Adam Sokołowski, Maciej Wołowicz
Ecosystem Approach for Sustainable Aquaculture
 Ecosystem Approach for Sustainable Aquaculture ECASA www.ecasa.org.uk/ ECASA Planning Meeting IFREMER Paris 6 th -8 th April 2005 J.G. Ferreira A. Sequeira A. Newton www.ecowin.org/ecasa/ IMAR Portugal
Bioaccumulation of persistant organic contaminants in the common sole (Solea solea)
") Bioaccumulation of persistant organic contaminants in the common sole (Solea solea) Utilisation of contaminants as food tracers eggs ingestion assimilation E reprooduction growth E R V M. Eichinger, V.
Bioaccumulation of persistant organic contaminants in the common sole (Solea solea) Utilisation of contaminants as food tracers eggs ingestion assimilation E reprooduction growth E R V M. Eichinger, V.
State of phytoplankton and. zooplankton in the Estuary and northwestern Gulf of St. Lawrence during Summary. DFO Science
 Fisheries and Oceans Canada Science Pêches et Océans Canada Sciences DFO Science Laurentian Region Stock Status Report C4-18 (2) State of phytoplankton and zooplankton in the Estuary and northwestern Gulf
Satellite data show that phytoplankton biomass and growth generally decline as the
 Oceanography Plankton in a warmer world Scott C. Doney Satellite data show that phytoplankton biomass and growth generally decline as the oceans surface waters warm up. Is this trend, seen over the past
SUMMARY OF THE COPERNICUS MARINE ENVIRONMENT MONITORING SERVICE OCEAN STATE REPORT 2016
 SUMMARY OF THE COPERNICUS MARINE ENVIRONMENT MONITORING SERVICE OCEAN STATE REPORT 2016 C O P E RNICUS M ARINE E NVIRO N MEN T M ONIT ORING SE R VICE OCEAN STATE REPORT No.1, 2016 Journal of Operational
Ocean s least productive waters are expanding
 Click Here for Full Article GEOPHYSICAL RESEARCH LETTERS, VOL. 35, L03618, doi:10.1029/2007gl031745, 2008 Ocean s least productive waters are expanding Jeffrey J. Polovina, 1 Evan A. Howell, 1 and Melanie
OUALIDIA LAGOON HYDRODYNAMIC AND WATER QUALITY MODELLING : PRELIMINARY STUDIES AND TRAINING
 Report Of The Modeling Working Group OUALIDIA LAGOON HYDRODYNAMIC AND WATER QUALITY MODELLING : PRELIMINARY STUDIES AND TRAINING NATO LEMESM experts: Vladimir G. Koutitonsky Georg Umgeisser Ali Erturk
Bio-economic effects of water shortages on shellfish farming. An integrated dynamic modelling approach
 International Congress on Environmental Modelling and Software Brigham Young University BYU ScholarsArchive 5th International Congress on Environmental Modelling and Software - Ottawa, Ontario, Canada
21 st Century Climate Change Impacts on Marine Fisheries
 21 st Century Climate Change Impacts on Marine Fisheries Anne B. Hollowed, NOAA, NMFS, Alaska Fisheries Science Center, Seattle, WA USA International Workshop on Climate and Oceanic Fisheries, Rarotonga,
Extractive Mussel Aquaculture: Balancing Goods, Ecological Services and Impacts
 Extractive Mussel Aquaculture: Balancing Goods, Ecological Services and Impacts Peter Cranford Bedford Institute of Oceanography Dartmouth, Nova Scotia Canada Extractive Aquaculture Science Goal is to
Food web structure in the continental shelf and slope waters of the Korean peninsula: Stable isotope approach and prospects for future research
 PICES XVII End-to-end food webs: Impacts of a changing ocean October 28 28 Food web structure in the continental shelf and slope waters of the Korean peninsula: Stable isotope approach and prospects for
Effluents from land based marine farms: nature, treatment, valorisation, modelisation. Applications to fish and shrimp rearing
 Effluents from land based marine farms: nature, treatment, valorisation, modelisation. Applications to fish and shrimp rearing J. Hussenot, S. Lefebvre and J.-L.M Martin IFREMER Ecology and pond management
Summary. Maritimes Region Ecosystem Status Report 2004/003
 Ecosystem Status Report 2004/003 2002 State of the Ocean: Chemical and Biological Oceanographic Conditions in the Gulf of Maine - Bay of Fundy, Scotian Shelf and the Southern Gulf of St. Lawrence Background
Jeffrey Polovina 1, John Dunne 2, Phoebe Woodworth 1, and Evan Howell 1 Julia Blanchard 3
 Projected expansion of the subtropical biome and contraction of the temperate and equatorial upwelling biomes in the North Pacific under global warming Jeffrey Polovina 1, John Dunne 2, Phoebe Woodworth
Impacts of global warming on bio-products of marine and coastal system Ling TONG Qisheng TANG
 Impacts of global warming on bio-products of marine and coastal system Ling TONG Qisheng TANG Yellow Sea Fisheries Research Institute, CAFS Both environmental and human factors affect the bioproducts in
Ecosystem Approach to Aquaculture
 Ecosystem Approach to Aquaculture V. Kripa Central Marine Fisheries Research Institute Cochin - 682 018, Kerala Traditional eco-friendly farming practices Aquaculture was practiced in several coastal areas
Drones: A New Tool for Water Monitoring
 Drones: A New Tool for Water Monitoring Donglai Gong Carl Friedrichs, Ryan Carnegie Outline What are the goals of water monitoring (from marine scientist s perspective)? Healthy ecosystem? Fisheries /
Assessment and interpretation of temporal or spatial differences in shellfish productivity of typical French ecosystems
 Assessment and interpretation of temporal or spatial differences in shellfish productivity of typical French ecosystems Joseph Mazurié, Patrick Soletchnik Michel Ropert Pierre-Gildas Fleury from Isabelle
Laboratoire de recherche: Conservation et valorisation des Ressources Marine
 Marin Ecosystems Response to the Anthropisation of the Algerian BAsin (MERAALBA) Dr. N. AIT-AMEUR Ecole Nationale Supérieure des Sciences de la Mer et de l Aménagement du Littoral d Alger ENSSMAL Laboratoire
Some EU and US experiences in eutrophication assessment for transitional and coastal waters
 Some EU and US experiences in eutrophication assessment for transitional and coastal waters http://www.eutro.org J.G.Ferreira S.B. Bricker EU Joint Research Centre Assessment of Eutrophication in European
MODELING NUTRIENT LOADING AND EUTROPHICATION RESPONSE TO SUPPORT THE ELKHORN SLOUGH NUTRIENT TOTAL MAXIMUM DAILY LOAD
 MODELING NUTRIENT LOADING AND EUTROPHICATION RESPONSE TO SUPPORT THE ELKHORN SLOUGH NUTRIENT TOTAL MAXIMUM DAILY LOAD Martha Sutula Southern California Coastal Water Research Project Workshop on The Science
Death by Dissolution: bearing organisms in nearshore marine environments in a high CO 2 world.
 Death by Dissolution: The fate of carbonate-bearing bearing organisms in nearshore marine environments in a high CO 2 world. Mark A. Green Green et al. 2004, Limnol. Oceanogr. Green et al., 1993, Limnol.
Environmental impacts of bouchot mussels in Mont-Saint-Michel Bay using LCA Joël Aubin & Caroline Fontaine
 Environmental impacts of bouchot mussels in Mont-Saint-Michel Bay using LCA Joël Aubin & Caroline Fontaine INRA UMR SAS Rennes France Joel.aubin@rennes.inra.fr Goal and Scope Mont Saint Michel: - Abbaye
CARRYING CAPACITY FOR SHELLFISH AQUACULTURE WITH REFERENCE TO MUSSEL AQUACULTURE IN MALPEQUE BAY, PRINCE EDWARD ISLAND
 Canadian Science Advisory Secretariat Gulf Region Science Advisory Report 2015/003 CARRYING CAPACITY FOR SHELLFISH AQUACULTURE WITH REFERENCE TO MUSSEL AQUACULTURE IN MALPEQUE BAY, PRINCE EDWARD ISLAND
Towards a better assessment of the ecological status of coastal waters using satellite-derived chlorophyll-a concentrations
 Please note that this is an author-produced PDF of an article accepted for publication following peer review. The definitive publisher-authenticated version is available on the publisher Web site Remote
Chapter Concepts LIFE IN WATER. The Hydrologic Cycle. The Hydrologic Cycle
 Chapter Concepts Chapter 3 LIFE IN WATER The hydrologic cycle exchanges water among reservoirs The biology of aquatic environments corresponds broadly to variations in physical factors such as light, temperature,
CULTURE PRACTICE VARIATIONS WITHIN EUROPEAN CULTURED FISH SPECIES AND EFFECTS ON MODELLING.
 CULTURE PRACTICE VARIATIONS WITHIN EUROPEAN CULTURED FISH SPECIES AND EFFECTS ON MODELLING. R.A Corner 1*, D. Attwood 2, Roberto Cò 3, J. Johansen 4, D. Israel 5, C. Smith 6, A Loukaidis 7 and J.G. Ferreira
Ocean +50. Ocean Industry Projections and the Future of the Ocean Economy AQUACULTURE. Patrick Sorgeloos & Arne Fredheim
 Ocean +50 Ocean Industry Projections and the Future of the Ocean Economy AQUACULTURE Patrick Sorgeloos & Arne Fredheim Aquatic Products - Seafood Seafood sources million tonnes live weight 100 90 80 70
the future? From the Seattle Post-Intelligencer, October 20, 2005 Assessing the potential impacts of global warming Courtesy of Nate Mantua
 the future? From the Seattle Post-Intelligencer, October 20, 2005 Assessing the potential impacts of global warming Courtesy of Nate Mantua Climate Change: Assessing its Implications for Marine Ecosystems
Why is the Benthos Important? OR Pre- and Post- Salt Pond Restoration Assessment of Benthic Communities in South San Francisco Bay
 Why is the Benthos Important? OR Pre- and Post- Salt Pond Restoration Assessment of Benthic Communities in South San Francisco Bay Jan Thompson and Francis Parchaso Menlo Park, USGS Benthic communities
Production and Life OCEA 101
 Production and Life OCEA 101 Overview Photosynthesis Primary production Phytoplankton biomass Controls on primary production and biomass Food webs Photosynthesis Photosynthesis requires: (i) sunlight (ii)
Coastal studies in Long Term Ecological Research. Dan Reed Santa Barbara Coastal LTER
 Coastal studies in Long Term Ecological Research Dan Reed Santa Barbara Coastal LTER NSF s Long Term Ecological Research Program 24 sites representing a diverse array of biomes Major focus of research
Farmed Fish & Shellfish Sourcing transparency 2017
 Farmed Fish & Shellfish Sourcing transparency 2017 Atlantic Halibut Hippoglossus hippoglossus Norway Near Stavanger Halibut is a high value marine flatfish that is farmed in small volumes by a handful
Assessment of production and water quality impacts of shellfish aquaculture using farm-scale models
 ECosystem Approach for Sustainable Aquaculture ECASA Assessment of production and water quality impacts of shellfish aquaculture using farm-scale models ECASA Stakeholder Conference http://www.ecasa.org.uk/
Copernicus in Africa some initiatives. Antoine Mangin ACRI Provence Alpes Cote d Azur - France
 Copernicus in Africa some initiatives Antoine Mangin ACRI Provence Alpes Cote d Azur - France ACRI Group Since 1989 Turnover 2015: 10,3 M ARCTUS Canada ARGANS UK AdwäisEO Luxemburg ACRI-EC Morocco Sophia
29682 Roscoff cedex, France. roscoff.fr 2 RDT/DMSI, Ifremer Centre de Brest, Plouzané, France
 High frequency measurements of hydrological and biological parameters in the Western English Channel: Evidence for a Karenia mikimotoi bloom in july 2010 P. Morin 1, Y. Aoustin 2, E. Macé 1, P. Jégou 2,
The SAFARI Initiative. Societal Applications in Fisheries & Aquaculture using Remotely-Sensed Imagery
 The SAFARI Initiative Societal Applications in Fisheries & Aquaculture using Remotely-Sensed Imagery Introduction July 2007, request from GEO to assimilate satellite Earth Observation (EO) into fisheries
Environmental flow requirements (EFRs) related to preference of phytoplankton in the Yellow River Estuary (YRE) based on an ecohydrodynamic model
 related to preference of phytoplankton in the Yellow River Estuary (YRE) based on an ecohydrodynamic model") Environmental flow requirements (EFRs) related to preference of phytoplankton in the Yellow River Estuary (YRE) based on an ecohydrodynamic model R. Zhao, Z. F. Yang*, T. Sun State Key Laboratory of Water
Environmental flow requirements (EFRs) related to preference of phytoplankton in the Yellow River Estuary (YRE) based on an ecohydrodynamic model R. Zhao, Z. F. Yang*, T. Sun State Key Laboratory of Water
Assessment of Climate Change for the Baltic Sea Basin
 The BACC Author Team Assessment of Climate Change for the Baltic Sea Basin 4u Springer Contents Preface The BACC Author Team Acknowledgements V VII XIII 1 Introduction and Summary 1 1.1 The BACC Approach
Environmental effects of Atlantic salmon cage culture Modelling of growth and mitigation in IMTA
 Environmental effects of Atlantic salmon cage culture Modelling of growth and mitigation in IMTA Joao G. Ferreira, R.A. Corner, J. Johansen, A.M. Cubillo Universidade Nova de Lisboa, Portugal Donostia,
The FARM model in Long Island Sound: How important is nutrient removal through shellfish harvest?
 The FARM model in Long Island Sound: How important is nutrient removal through shellfish harvest? Suzanne Bricker 1, Joao Ferreira 2, Changbo Zhu 2, Julie Rose 3, Eve Galimany 3, Gary Wikfors 3, Camille
AP Environmental Science
 AP Environmental Science Types of aquatic life zones MARINE Estuaries coral reefs mangrove swamps neritic zone pelagic zone FRESHWATER lakes and ponds streams and rivers wetlands Distribution of aquatic
Monitoring, modelling and management of Irish Sea mussel stocks
 Monitoring, modelling and management of Irish Sea mussel stocks Gavin Burnell Aquaculture and Fisheries Development Centre University College Cork Ireland The Shellfish Association of Great Britain, Annual
HYPOXIA Definition: ~63 µm; 2 mg l -1 ; 1.4 ml l -1 ; 30 %
 HYPOXIA Definition: ~63 µm; 2 mg l -1 ; 1.4 ml l -1 ; 30 % Consequences of hypoxia Reduce habitat for living resources Change biogeochemical processes P released from sediments Denitrification reduced
Assessment of the State of the demersal fish communities in OSPAR Regions II, III, IV and V 1,2
 Assessment of the State of the demersal fish communities in OSPAR Regions II, III, IV and V 1, 1 Introduction and Methods... 1 Regional Assessments... 4 3 Overall Regional Summary... 10 1 Introduction
Calculating transboundary nutrient fluxes in the North Sea and adjacent sea areas
 Calculating transboundary nutrient fluxes in the North Sea and adjacent sea areas 1. Introduction This document provides material to underpin discussion on the determination of transboundary nutrient fluxes
Ecosystem Research Initiative (ERI) in the St. Lawrence Estuary, eastern Canada:
 in the St. Lawrence Estuary, eastern Canada:") Ecosystem Research Initiative (ERI) in the St. Lawrence Estuary, eastern Canada: Testing an approach for science support to ecosystem-based management Boulogne Sur Mer November 5-7, 2008 Outline of the
Ecosystem Research Initiative (ERI) in the St. Lawrence Estuary, eastern Canada: Testing an approach for science support to ecosystem-based management Boulogne Sur Mer November 5-7, 2008 Outline of the
Nutrient Response to Sewage Abatement in Hong Kong
 Nutrient Response to Sewage Abatement in Hong Kong Prof. Paul J. Harrison Atmospheric, Marine & Coastal Environment Program Institute for the Environment HK University of Science & Technology Outline Background
the abdus salam international centre for theoretical physics
 united nations educational, scientific and cultural organization the abdus salam international centre for theoretical physics international atomic energy agency SMR 155-16 WORKSHOP ON THE USE OF RECEPTOR
Nitrogen Cycling, Primary Production, and Water Quality in the New River Estuary. Defense Coastal/Estuarine Research Program (DCERP)
") Nitrogen Cycling, Primary Production, and Water Quality in the New River Estuary Defense Coastal/Estuarine Research Program (DCERP) Introduction: A key theme of the ongoing DCERP program is monitoring
Nitrogen Cycling, Primary Production, and Water Quality in the New River Estuary Defense Coastal/Estuarine Research Program (DCERP) Introduction: A key theme of the ongoing DCERP program is monitoring
Appendix A. Proposal Format. HICO Data User s Proposal
 Appendix A. Proposal Format HICO Data User s Proposal Title of Proposal: A hyperspectral atmospheric correction algorithm to retrieve water-leaving radiance signal from HICO data Principal Investigator
Ecological Aquaculture: The EVOLUTION of the Blue Revolution
 Ecological Aquaculture: The EVOLUTION of the Blue Revolution Barry A. Costa-Pierce, Ph.D., FAAAS Henry L. & Grace Doherty Professor of Marine Sciences Chair, UNE Department of Marine Sciences Director,
The IN-SITU component of the CMEMS Copernicus marine Environment Monitoring Service
 The IN-SITU component of the CMEMS Copernicus marine Environment Monitoring Service Authors: L. Petit de la Villéon (1), S. Pouliquen (2), and CMEMS INSTAC partners (3) (1) Ifremer Plouzané, France. Loic.Petit.de.la.Villéon@ifremer.fr
Approaches to monitoring offshore bivalve aquaculture at Sagres, Portugal
 Approaches to monitoring offshore bivalve aquaculture at Sagres, Portugal John D. Icely* Bruno D.D. Fragoso* *Sagremarisco-Viveiros de Marisco Lda Apartado 21 8650-999 Vila do Bispo Portugal john.icely@gmail.com
Great Lakes Remote Sensing Algorithms
 Great Lakes Remote Sensing Algorithms Status, Comparisons, and Future Directions Robert Shuchman MTRI Mike Sayers MTRI George Leshkevich NOAA/GLERL Barry Lesht JGLR/Assoc. Editor Caren Binding Environment
MARINE SYSTEMS Lecture Dan Cogalniceanu Course content Overview of marine systems
 Department of Environmental Sciences and Policy MARINE SYSTEMS Lecture 1 2009 Dan Cogalniceanu Course content 1. Overview of marine systems 2. Goods and services provided 3. Human impact on marine systems
A Comparison of Two Laboratory Methods for Determining Sediment Organic Carbon Content in PEI Harbours January, 1999
 A Comparison of Two Laboratory Methods for Determining Sediment Organic Carbon Content in PEI Harbours January, 1999 Kendall R. Shaw PEI Department of Technology and Environment Charlottetown, PEI Executive
2 Population dynamics modelling of culturebased fisheries
 2 Population dynamics modelling of culturebased fisheries A population dynamics model for culture-based fisheries has been developed which is conceptually simple, yet able to address all the key management
School of Fisheries, Aquaculture and Aquatic Sciences
 School of Fisheries, Aquaculture and Aquatic Sciences 1 School of Fisheries, Aquaculture and Aquatic Sciences Fisheries science combines a general foundation in chemistry, mathematics and biological sciences
LME 06 Southeast U.S. Continental Shelf
 LME 06 Southeast U.S. Continental Shelf Bordering countries: United States of America, Bahamas LME Total area: 303,029 km 2 List of indicators LME overall risk 2 Productivity Chlorophyll-A 2 2 Primary
5.0 PHYTOPLANKTON PHYSIOLOGY. Luke Twomey Christopher P. Buzzelli Hans W. Paerl. 5.1 Introduction
 5. PHYTOPLANKTON PHYSIOLOGY Luke Twomey Christopher P. Buzzelli Hans W. Paerl 5.1 Introduction Phytoplankon production is the primary source of organic carbon in the water column of the NRE (Matson and
Use of Vollenweider-OECD Modeling to Evaluate Aquatic Ecosystem Functioning
 R. Anne Jones 1 and G. Fred Lee 1 Use of Vollenweider-OECD Modeling to Evaluate Aquatic Ecosystem Functioning REFERENCE: Jones, R. A. and Lee, G. F., Use of Vollenweider-OECD Modeling to Evaluate Aquatic
populations and human systems in marine ecosystem models
 Coupling across individuals, populations and human systems in marine ecosystem models Eileen Hofmann Center for Coastal Physical Oceanography Old Dominion University Outline of Lecture Scales and relevance
Ocean Color System Vicarious Calibration: requirements on in situ data and sites
 Ocean Color : requirements on in situ data and sites G. Zibordi Joint Research Centre, Ispra, Italy Several elements are taken from Requirements and Strategies for In Situ Radiometry in Support of Satellite
Science Mission Directorate Carbon Cycle & Ecosystems Roadmap NACP
 Science Mission Directorate Carbon Cycle & Ecosystems Roadmap NACP Bill Emanuel Program Scientist, Terrestrial Ecology Carbon Cycle & Ecosystems Focus Area Carbon Cycle & Ecosystems Focus Area Program
Eyes Over Puget Sound: Producing Validated Satellite Products to Support Rapid Water Quality Assessments in Puget Sound
 Western Washington University Western CEDAR Salish Sea Ecosystem Conference 2014 Salish Sea Ecosystem Conference (Seattle, Wash.) May 2nd, 10:30 AM - 12:00 PM Eyes Over Puget Sound: Producing Validated
Status of the SeaWiFS Project: with a few thoughts about the future - Gene Carl Feldman
 Status of the SeaWiFS Project: with a few thoughts about the future - Gene Carl Feldman SeaWiFS Project SeaWiFS Overview originally conceived as a follow-on ocean color mission based on the success of
Dead-Zones and Coastal Eutrophication: Case- Study of Chesapeake Bay W. M. Kemp University of Maryland CES Horn Point Laboratory Cambridge, MD
 Dead-Zones and Coastal Eutrophication: Case- Study of Chesapeake Bay W. M. Kemp University of Maryland CES Horn Point Laboratory Cambridge, MD Presentation to COSEE Trends Orientation at UMCES HPL 4 August
The relevance of sediments in eutrophic systems: a comparison of two European coastal lagoons (Óbidos and Lesina)
") The relevance of sediments in eutrophic systems: a comparison of two European coastal lagoons (Óbidos and Lesina) Carlos Vale 1,3, Patrícia Pereira 1, M. João Botelho 1, Elisabetta Ballarini 2 and Athanasios
The relevance of sediments in eutrophic systems: a comparison of two European coastal lagoons (Óbidos and Lesina) Carlos Vale 1,3, Patrícia Pereira 1, M. João Botelho 1, Elisabetta Ballarini 2 and Athanasios
7.8 Trophic Status of Jamaica Bay: Spatial and Temporal Patterns
 7.8 Trophic Status of Jamaica Bay: Spatial and Temporal Patterns Chris Langdon 7.8.1 SUMMARY Oxygen data indicate that there are two periods of intense phytoplankton production during the year. There is
Mortality and oyster herpesvirus infections in Tomales Bay,California, USA
 Mortality and oyster herpesvirus infections in Tomales Bay,California, USA Colleen A. Burge 1, Robyn M. Estes-Strenge 1, Daniel P. Cheney 2, Frederick J. Griffin 3, Kimberly S. Reece 4, Tristan Renault
User Awareness & Training: MARINE. Lisbon, Portugal 13 th -14 th February 2014 Antonio Guarnieri
 User Awareness & Training: MARINE Lisbon, Portugal 13 th -14 th February 2014 Antonio Guarnieri Contents Overview of the Copernicus Marine service Brief History Services (approach, products, users, etc..)
Sustainable Shellfish aquaculture the Ecosystem approach
 Sustainable Shellfish aquaculture the Ecosystem approach Shellfish Growing in Ireland Fish Farmers 1,716 Processing 2,860 Ancillary 1,140 Shellfish 172 million - 4.53 from 4920 tonnes In total in N Ireland
Transport of Total Suspended Matter, Particulate Organic Carbon, Organic Nitrogen and Phosphorus in the Inner Part of Osaka Bay
 Journal of Oceanography, Vol. 53, pp. 365 to 371. 1997 Transport of Total Suspended Matter, Particulate Organic Carbon, Organic Nitrogen and Phosphorus in the Inner Part of Osaka Bay TERUMI TANIMOTO and
increase in mean winter air temperature since 1950 (Ducklow et al, 2007). The ocean
. The ocean") Exploring the relationship between Chlorophyll a, Dissolved Inorganic Carbon, and Dissolved Oxygen in the Western Antarctic Peninsula Ecosystem. Katie Coupland December 3, 2013 Since the start of the industrial
Exploring the relationship between Chlorophyll a, Dissolved Inorganic Carbon, and Dissolved Oxygen in the Western Antarctic Peninsula Ecosystem. Katie Coupland December 3, 2013 Since the start of the industrial
Changes in Arctic Ocean Primary Production from Kevin R. Arrigo G. L. van Dijken
 Changes in Arctic Ocean Primary Production from 1998-2008 Kevin R. Arrigo G. L. van Dijken Department of Environmental Earth System Science Stanford University Background Circulation influenced by both
Bioavailability of anthropogenic radionuclides in mussels along the French Mediterranean coast
 Radioprotection, Suppl. 1, vol. 40 (2005) S47-S52 EDP Sciences, 2005 DOI: 10.1051/radiopro:2005s1-008 Bioavailability of anthropogenic radionuclides in mussels along the French Mediterranean coast H. Thébault
Monitoring and modeling of phytoplankton and marine primary production. Nansen Environmental and Remote Sensing Center, Bergen, Norway
 Monitoring and modeling of phytoplankton and marine primary production Lasse H. Pettersson, Annette Samuelsen and Anton Korosov lasse.pettersson@nersc.no Nansen Environmental and Remote Sensing Center,
ereefsoptical and biogeochemical model. CSIRO OCEANS AND ATMOSPHERE FLAGSHIP
 ereefsoptical and biogeochemical model. CSIRO OCEANS AND ATMOSPHERE FLAGSHIP 2 Presentation title Presenter name BGC state variables: - 10 dissolved - 22 living particulate - 11 non-living part. -6 epibenthic.
Role of Deposit Feeders in Integrated Multi-Trophic Aquaculture A Model Analysis
 Role of Deposit Feeders in Integrated Multi-Trophic Aquaculture A Model Analysis A.M. Cubillo, Joao G. Ferreira, Shawn M.C. Robinson, Christopher M. Pearce Universidade Nova de Lisboa, Portugal San Sebastian,
High Latitude Environment
 9. Habitats: High Latitude Ecosystems High Latitude Environments Seasonal Processes Sea ice Food Fall Reproduction Bentho-pelagic coupling Food Weds Climate Change Effects Dr Rhian G. Waller 26th April
Assessing impacts of shellfish aquaculture on eelgrass (Zostera marina) populations in Eastern Long Island Sound.
 populations in Eastern Long Island Sound.") Assessing impacts of shellfish aquaculture on eelgrass (Zostera marina) populations in Eastern Long Island Sound. Jamie M.P. Vaudrey Department of Marine Sciences, UCONN Tessa Getchis Connecticut Sea Grant
Assessing impacts of shellfish aquaculture on eelgrass (Zostera marina) populations in Eastern Long Island Sound. Jamie M.P. Vaudrey Department of Marine Sciences, UCONN Tessa Getchis Connecticut Sea Grant
SPATIAL AND TEMPORAL VARIATIONS IN SURFACE ZOOPLANKTON BIOMASS DISTRIBUTION IN THE GULF OF AQABA, RED SEA
 SPATIAL AND TEMPORAL VARIATIONS IN SURFACE ZOOPLANKTON BIOMASS DISTRIBUTION IN THE GULF OF AQABA, RED SEA Tariq Al-Najjar Marine Science Station, P.O. Box 195, Aqaba, Jordan tnajjar65@hotmail.com (Received
Exploration of alternative monitoring strategies in relation to water body assessments. Imre Schep
 Imre Schep DID Team Hydro Advise on information and monitoring strategies Advise on instruments and sensors Exploration of alternative monitoring strategies in relation to water body assessments How can
In situ Requirements for Ocean Color System Vicarious Calibration: A Review
 In situ Requirements for Ocean Color System Vicarious Calibration: A Review Background literature G. Zibordi, Ispra, Italy G.Zibordi, F. Mélin, K.J. Voss, B.C. Johnson, B.A. Franz, E. Kwiatkowska, J.P.
Finalizing the Chesapeake Bay Health Index (BHI)
") Finalizing the Chesapeake Bay Health Index (BHI) Part 1: Water Quality Index Part 2: Biotic Index Bill Dennison Ben Longstaff, Michael Williams, Claire Buchanan, Roberto Llansó, and Peter Bergstrom On
Finalizing the Chesapeake Bay Health Index (BHI) Part 1: Water Quality Index Part 2: Biotic Index Bill Dennison Ben Longstaff, Michael Williams, Claire Buchanan, Roberto Llansó, and Peter Bergstrom On
Blue mussel bouchot culture in Mont-St Michel Bay: potential mitigation effects on climate change and eutrophication?
 Blue mussel bouchot culture in Mont-St Michel Bay: potential mitigation effects on climate change and eutrophication? Joël Aubin, Caroline Fontaine, Myriam Callier, Emmanuelle Roque d orbcastel INRA UMR
Northern Adriatic sea ecosystem model: trophic network analysis, time simulation and spatial dynamics
 Northern Adriatic sea ecosystem model: trophic network analysis, time simulation and spatial dynamics Barausse, A., Artioli, Y., Palmeri, L., Duci, A., Mazzoldi, C. Environmental Systems Analysis Lab and