Florida State University Libraries
|
|
|
- Samson Foster
- 6 years ago
- Views:
Transcription


1 Florida State University Libraries Electronic Theses, Treatises and Dissertations The Graduate School 2010 Correlation Between Falling Head and Double Ring Testing for a Full-Scale Infiltration Study Audra H. Hayden Follow this and additional works at the FSU Digital Library. For more information, please contact lib-ir@fsu.edu
2 THE FLORIDA STATE UNIVERSITY COLLEGE OF ENGINEERING CORRELATION BETWEEN FALLING HEAD AND DOUBLE RING TESTING FOR A FULL-SCALE INFILTRATION STUDY By AUDRA H. HAYDEN A Thesis submitted to the Department of Civil and Environmental Engineering in partial fulfillment of the requirements for the degree of Master of Science Degree Awarded: Spring Semester, 2010
3 The members of the committee approve the thesis of Audra H. Hayden defended on November 18, Kamal Tawfiq Professor Directing Thesis Michelle Rambo-Roddenberry Committee Member Wei-Chou V Ping Committee Member Approved: Kamal Tawfiq, Chair, Civil and Environmental Engineering The Graduate School has verified and approved the above-named committee members. ii
4 ACKNOWLEDGEMENTS This project is the result of a combination of over two years of field and laboratory testing as well as numerous hours of research and computations. I would like to take this opportunity to thank those who have made this report possible. First, I would like to thank Dr. Tawfiq for his guidance and support throughout the research process. He has offered numerous hours of support and guidance throughout my collegiate experience. I would also like to thank Dr. Rambo-Roddenberry and Dr. Wei-Chou Virgil Ping for serving on my committee. In addition, I would like to thank my family for offering their support and guidance throughout the thesis project. They have acted as my soundboard for ideas and offered wonderful feedback on my ideas and hypothesis. I would also like to extend a special thank you to my friends who listened during my lengthy discussions on research, and offered me continued support and words of encouragement throughout my graduate career.
5 TABLE OF CONTENTS List of Tables... vi List of Figures... vii List of Equations... viii List of Symbols and Abbreviations... ix Abstract... x 1. Introduction Literature Review Introduction Existing Permeability Correlations Methods for Measuring Permeability Laboratory Methods for Measuring Permeability Field Methods for Measuring Permeability Methods for Measuring Infiltration Field Methods for Measuring Infiltration The Use of Software to Compute Infiltration PONDFLOW MODRET Factors that Affect Infiltration Rates in the Field Procedures Site Information Soil Sample Collection and Collection Field Testing Procedures Laboratory Testing Procedures Results Laboratory Results Soil Classification Results Grain-Size Correlations Falling Head Permeability Test Field Permeability Rates Double Ring Infiltrometer Results Single Ring Infiltration Test Results Computer Analysis Grain-Size Correlations Falling Head Permeability Values iv
6 4.3.3 Double Ring Infiltration Test Values Single Ring Infiltration Test Values Measurement of Actual Infiltration Rates Discussion of Results Conclusions and Recommendations APPENDICES A Grain-Size Correlations B Determination of Permeability Through Seepage Tests C USDA Soil Survey D MODRET Computer Printouts E Computer Simulations REFERENCES BIOGRAPHICAL SKETCH v
7 LIST OF TABLES Table 1: Results from Laboratory Classification Testing Table 2: Falling Head Permeability Results: Silty Fine Sand Table 3: Falling Head Permeability Results: Clayey Sand Table 4: Falling Head Permeability Results: Clayey Fine Sand Table 5: Results from Double Ring Field Test Table 6: Results from Double Ring Field Test Table 7: Results from Single Ring Field Test Table 8: Results from Single Ring Field Test Table 9: Actual Infiltration Rates of a Functioning Stormwater Facility vi
8 LIST OF FIGURES Figure 1: Photograph of Stormwater Management Facility Figure 2: Photograph of Site Location Map Figure 3: Topographic Map of Site Figure 4: Plume Influence with Single Ring Infiltrometer Figure 5: Plume Influence with Double Ring Infiltrometer Figure 6: Photograph of Interior or Double Ring Figure 7: Photograph of Double Ring Testing Equipment Figure 8: Photograph of Permeameter Testing Equipment Figure 9: Photograph of Deaeration Equipment Figure 10: Graphical Representation of Grain-Size Distribution: Feet Figure 11: Graphical Representation of Grain-Size Distribution: Feet Figure 12: Graphical Representation of Grain-Size Distribution: Feet Figure 13: Graphical Representation of Grain-Size Distribution: Feet 33 Figure 14: Graphical Representation of Grain-Size Distribution: Feet 34 Figure 15: Graphical Representation of Grain-Size Distribution: Feet 34 Figure 16: Graphical Representation of DRI Field Test Figure 17: Graphical Representation of DRI Field Test Figure 18: Graphical Representation of SRI Field Test Figure 19: Graphical Representation of SRI Field Test vii
9 LIST OF EQUATIONS Equation 1: Darcy s Equation for Velocity... 3 Equation 2: Equation for Seepage Velocity... 3 Equation 3: Hazen Correlation for Permeability... 4 Equation 4: Effect of Permeability in Centrifuge... 6 Equation 5: Determination of Permeability in Auger Hole Test... 7 Equation 6: Determination of k from Falling Head Test Equation 7: Determination of Infiltration from DRI Equation 8: Green & Ampt Equation to Determine Infiltration viii
10 LIST OF SYMBOLS AND ABBREVIATIONS Wetting Front of Green-Ampt Equation h Head Loss During Falling Head Permeability Test Soils Water Content AASHTO C 2 C u DRI D 10 D 50 D 60 F FDEP i k SRI TMDL T American Association of State and Highway Transportation Officials Coefficient Constant for Permeability Correlation Uniformity Coefficient Double Ring Infiltrometer Percent Passing the Number 10 Sieve Percent Passing the Number 50 Sieve Percent Passing the Number 60 Sieve Volume of Water Being Infiltration of Green-Ampt Equation Florida Department of Environmental Protection Hydraulic Gradient Hydraulic Conductivity (Permeability) Single Ring Infiltrometer Total Mandated Daily Load Test Duration during Falling Head ix
11 ABSTRACT Stormwater management facility design is a branch of engineering that demands a full understanding of soil and permeability and how water infiltrates into the ground. With new residential and commercial developments, holding facilities for rainwater are required. Due to the cost associated with purchasing land for holding water, the idea is to make the pond dimensions as small as possible. With this idea, the engineer will need a precise way to determine the rate at which water will infiltrate into the soil. This research centers on determining how permeability most accurately predicts a stormwater pond s actual infiltration rate. Several estimations for permeability have been evaluated: grainsize correlations, falling head permeameters, double ring infiltrometer tests and single ring infiltrometer tests. For this research, an existing stormwater facility was chosen. At this location, the field tests were conducted and subsurface samples were taken for laboratory analysis. In addition, to measure the actual field infiltration rate, a staff gage was installed and monitored after a precipitation event. The program MODRET was utilized to determine which of the various estimations of permeability yield an infiltration that most closely resembles that of monitored existing conditions. x
12 CHAPTER 1 INTRODUCTION The design of stormwater management facilities involves a close cooperation between the hydraulics/drainage engineer and the geotechnical engineer. This is particularly true for those stormwater management facilities designed to percolate stormwater into the underlying soils. The percolation of stormwater into the underlying soils is the preferred method of treatment for stormwater in Florida by the Florida Department of Environmental Protection (FDEP). Currently, Florida is mandated to reduce its total mandated daily loads (TMDL) of pollutants from runoff of stormwater in the State s rivers and lakes. An attractive way to accomplish this is to reduce the runoff from individual areas through the use of stormwater management facilities or percolation ponds. As available developable land becomes more expensive, there are pressures to reduce the size of the stormwater management facilities and still maintain their intended function. The method of how to determine the rate at which water will seep into the ground is open for debate and varies from area to area. Often the stormwater/drainage engineer and the geotechnical engineer have a different method that he or she believes best estimates the infiltration rate. Often the infiltration rate is confused with the permeability rate of the soil, and the stormwater management facility does not function as intended during periods of high water. This study will identify the relationship between infiltration rate and permeability of the subsoils using grain-size correlations, laboratory testing and both the single and double ring field infiltration test. 1
13 CHAPTER 2 LITERATURE REVIEW 2.1 INTRODUCTION Tallahassee, Florida is located in the subtropics. North Florida s climate is dominated by a combination of warm wet rainy weather. Tallahassee receives over sixty-three inches of rain a year, with over eight of those inches arriving in July (The Weather Channel). When precipitation reaches the earth and overland flow is created, the water is considered stormwater runoff (Miller 1990). With this considerable amount of precipitation, stormwater management becomes a forefront concern. The need arises for management facilities, that can handle and appropriately treat the large amount of stormwater runoff which is being created through increased development of urban and rural land. One of the basic areas needing clarification is the infiltration rate of a stormwater management facility and the permeability of the subsoils. According to Das, permeability is defined as the property of soil that controls the seepage of fluids through its open pore spaces (Das 1997). Permeability is directly related to the physical properties of the soil. Permeability of various soils can vary greatly with values from only feet per day to over 100,000 feet per day (Cedergren 1977) depending on the soil type. Permeability of a soil is affected by various factors including: viscosity of the percolating fluid (usually water), temperature (the viscosity of a fluid is inversely proportional to its temperature), percentage of silts and clay particles, storage capacity of the soil, and its degree of saturation (Chow 1964). The infiltration rate of a soil, on the other hand, concerns the movement of water into the soil mass. Since the description sounds similar to that of permeability, the two terms can be easily confused. Infiltration rate is influenced by factors other than the properties of the subsoils. These properties include volume of stormwater runoff and hydraulic head (Assouline et al. 2007). Like the permeability of the subsoils, the infiltration rate is affected by the fluid s viscosity and the physical properties of the subsoils. However, unlike permeability, the infiltration rate is also affected by vegetation, surface compaction and land use. 2
14 The term infiltration rate was first researched by George P. Marsh in the 1964 publication of his work Man and Nature where he defined infiltration rate as the difference between how much water an area receives and how much surface runoff occurs. While this was reasonable for early work, there are other ways for the water to disappear other than surface runoff and infiltration. These other items are evapotranspiration and normal surface evaporation (Chow 1964). The effects of evapotranspiration and normal surface evaporation are becoming more important as available land for stormwater management facilities becomes more expensive. 2.2 EXISTING PERMEABILITY CORRELATIONS One of the early studies to quantify soil permeability was conducted by Henri Darcy in He conducted experiments on water flow through saturated clean sands and came up with a simple empirical equation for a fluid s velocity through a porous medium. He discovered that the flow of a fluid, or the discharge velocity, was directly proportional to the head loss and was inversely proportional to the thickness of the porous soil media (Chow 1964). While this seems obvious now, this research led to predicting the rate of flow of fluids through soils using Equation 1 (Das 2006). It should be noted that the phrase permeability and hydraulic conductivity have been used interchangeably. However, permeability typically refers to flow caused by a positive head, while hydraulic conductivity typically refers to flow caused by either a positive or a negative head (soil suction). The hydraulic gradient (i) is defined as the head loss ( h) over a length of flow (l). The equation 1, states the discharge velocity, which is the velocity of the water through the cross sectional area of a sample, there is another velocity called the seepage velocity which is the velocity of water through a soil s open pore spaces. The equation for seepage velocity is given below in equation 2. v q k i A v v s Equation 1 Equation 2 One method of estimating the permeability of soil is based on pore size, which is based on the interstitial flow of water within the soil matrix. Since measuring the interstitial pore sizes is difficult, several correlations have been created to equate the permeability to the soil particle size (something that can be readily measured). One of the earliest correlations was developed by Hazen, illustrated below as 3
15 Equation 3. This correlation bases the permeability of a soil on the soil s diameter at which ninety (90) percent of the soil mass is larger than that diameter. This value, denoted as D 10, can be found by a grainsize analysis; it stands for the percent of soil passing the number 10 sieve. The value C 2 is considered a constant and is normally ranges from 1.0 to 1.5. This equation is based on the soil being uniform medium sand; therefore, typically this equation does not produce reliable results for most soils because they are typically mixed grains (Handy and Spangler 2008). 2 k C 2 D 10 Where: k = Coefficient of Permeability (cm/sec) C 2 = Constant (Normally 1.0 to 1.5) D 10 = Diameter of Smallest 10 Percent of Soil Mass (cm) Equation 3 Prugh attempted to compensate for the limited applicability of the Hazen approach by correlating the permeability of a soil to more than D 10. He correlated the permeability of soil to D 50 and the uniformity coefficient (C u ) of the soil (Powers 1980). The graphs used to estimate the permeability of a soil based on its grain-size distribution using the Prugh method have been included in Appendix A and are outlined in Section METHODS FOR MEASURING PERMEABILITY Laboratory Methods for Measuring Permeability Excluding the difficulties of obtaining the samples, the simplest method of determining the permeability of a soil is through laboratory testing. The laboratory testing normally has controlled conditions, excludes of weather problems, and is often less expensive than field testing. The primary drawback to the use of laboratory permeability values is that the laboratory permeabilities are normally only a particular depth, while the values obtained from field-testing include natural variations in density and soil types (Chow 1964). The three most common laboratory testing methods are the constant head test, the falling head test, as well as indirect methods (i.e. consolidation tests). The constant head test is the most common method of 4
16 permeability testing. This test requires the sample to have the same hydraulic water head throughout the duration of the test. The permeability is then computed based on the amount of water that permeates through the sample, the sample geometry, and the time required to permeate the volume of water. The procedures for this test are outlined in the ASTM Standards. This test is recommended for granular soils such as sand. If the material contains too many fines, such as silts and clays, then the time required for the water to pass through the system will be so long that significant evaporation will occur (Das 1997). The procedure should not be used on soils where ten percent or more of the soil passes through the No. 200 sieve (ASTM 2003c). It should be noted that this requirement eliminates most soils encountered at stormwater management facilities, except along the Gulf Coast beaches. The falling head test, which was used in this study, is conducted in a manner similar to the constant head test, except that the hydraulic head is allowed to vary with time. Precautions are necessary with this test to prevent segregation of the fines during the test. As mentioned previously, permeability values are influenced by changes in the soil s void ratio. Therefore, it is important that the density of soil tested match the in situ density of the soils being evaluated. The indirect measurement of permeability through other laboratory testing (i.e. consolidation test) is normally conducted on fine grained soils. Permeation within this test occurs through the application of high pore pressures through the sample. An advantage to this method is that the chance of sidewall leakage is less than in the other tests (Das 2006). Researchers Samaraskera and Sharma studied the effects of obtaining the permeability of a soil using a falling head permeameter placed within a small radius centrifuge. The advantage to using a centrifuge method over the more traditional methods is the speed at which the test can be run. This research used, as its main basis of theory the Darcy s velocity equation. The unit discharge within the centrifuge model was tested at N times the earth s normal gravitational pull and thus the unit discharge was N times the discharge of the prototype (2007). The value N that is listed is a function of how many times larger the centrifuge s acceleration is over that of the earth s acceleration. The equation for the basis of their research can be seen in Equation 4. 5
17 m k m i m k m i m Nv p Nv p Nk p i p Where : v = velocity of fluid through the system k = hydraulic conducitivity of the soil i = hydaulic gradient Equation 4. The advantage of utilizing a centrifuge in measuring the permeability of the soils is the shorter period of time required for the testing and that more uniform pore pressures. The research came to the conclusion that utilizing a centrifuge can be very beneficial; however, the cost of the testing equipment makes this test not practical for most design applications (Sharma and Samarasekera 2007). Research conducted by Indrawan, Leon and Rahardjo studied the effects of drying and wetting characteristics of a two layer soil column. This research utilized the constant head permeability method with several adaptations from the ASTM Standard. Tensiometers were installed throughout the system to measure pore-water pressures throughout the test. The researchers stated they were measuring infiltration through the system; however, it is likely they were measuring the hydraulic conductivity since they were studying non-saturated flow conditions and negative pore pressures. During the experiments, comparisons were made with the measured laboratory results and computed results using the finite element theory. The infiltration results and pore water pressure measurements made in the laboratory compared favorably to those computed. The research indicates that under most circumstances permeability and hydraulic conductivity have very similar results (2007) Field Methods for Measuring Permeability Outside of laboratory testing, another method for physically measuring permeability is through testing the soil in situ, which means traveling to the field and performing the test on site. Very often the prospect of obtaining an undisturbed sample to take from the field and into the laboratory is simply unpractical. In other cases, the project being designed can be of such a scale that it is often impractical to test both the field and the laboratory samples (Das 1997). Some of the in situ testing methods are 6
18 pumping from wells, bore-hole tests, cased-hole tests, double ring infiltration tests, and introducting tracers into the groundwater system. The first method to be mentioned is the auger hole test. This method was introduced and defined by Van Vavel and Kirkham in 1948 (Das 1997). This test consists of installing a single auger hole to a depth that is either ten times the hole diameter or to the first impermeable layer. It should be noted that this method is based on the auger hole reaching the water table. This test is performed by first measuring the elevation of the water table within the auger hole. Water is then pumped out at a uniform rate, thus dropping the water level in the auger hole. The rate at which the water returns to the auger hole is then measured (Chow 1964).. While this test can be very beneficial, there are potential problems, particularly in keeping the auger hole open, especially in sandy conditions below the water table. The advantage to this test is that it is effective in determining permeability when the water table is close to the ground surface (Andreyev 1991). The equation for this field method is given below in equation 5. k r w d h S d d t Where: k = Coefficient of Permeability (cm/sec) r w = radius of the auger hole (cm) S = shape factor d=depth of hole below the water table dh/dt = rate of increase of the water table at depth h measured from bottom of hole Equation 5 Another method for determining permeability is from the drawdown of a pumping test. This test is performed by pumping a well at a constant rate and then noting the change in water in nearby observation wells. While this test can be very useful and is normally highly accurate, it is expensive and time consuming, usually requiring the drawdown test to be conducted a minimum of eight hours (Das 1997). The cased hole test is performed by drilling an auger boring and installing a PVC pipe that has a perforated screen towards the bottom of the pipe. This test, just like others, has advantages and disadvantages. One of the positive advantages is the permeability can be measured from variable depths. The main drawback is the casing can cause reduction in permeability due to clogging of the 7
19 screen. As a result, it is difficult to obtain a duplication of a test result to verify accuracy (Andreyev 1991). The equations for the cased hole have been included within Appendix B. Also included within the figure on Appendix B; three different methods of performing the test are given: a constant head method, variable head method and a basic time lag. For the three different methods, the equations are also given for seven different soil types. A different type of permeability test is through the introduction of tracers. A tracer is a substance that is introduced into the groundwater at a given point upstream. The tracer then travels a given distance, and the time it takes for the tracer to appear downstream is measured as well as the hydraulic gradient. While this method is effective, it is seldom used primarily because it is cost prohibitive. Types of tracers commonly used are dies, electrolytes and radioisotopes. Research has been conducted with the tracer technique to investigate the net infiltration that occurs in desert sandstone. The research utilized the concept of net infiltration which describes the fluid movement that occurs beneath the root zone. This area of the subsoil was chosen to remove the effects of evapotranspiration, which allows an easier analysis of the results. To facilitate the research and to avoid confusion with the concept of permeability, for this research infiltration was described as the percolation flux that passes beneath the depth of the root zone (Heiweil et al. 2007). While this research was thorough, measuring infiltration through this particular field method would not be practical. 2.4 METHODS FOR MEASURING INFILTRATION Field Methods for Measuring Infiltration Field methods for testing infiltration differ from those that measure permeability. The main difference is that infiltration measures the water entering from the surface traveling through the different soil stratums, and eventually entering the water table. Permeability field tests, on the other hand, measure the hydraulic conductivity of a single layer. Even though the units of hydraulic conductivity and infiltration are similar, there is a distinct difference, and they cannot be related due to unknown boundary conditions such as the hydraulic gradient. 8
20 Probably the most common in practice test would be the utilization of the Double Ring Infiltrometer (DRI). This test was the field testing method chosen for this research. The DRI test is conducted with two cylindrical metal rings, twelve and twenty-four inches in diameter, respectively. The smaller ring is centered within the larger ring. This test can be very useful and can give a fairly accurate surface permeability. It should be noted that the DRI test does not measure the infiltration rate, as the infiltration value will be dependent on the depth to the groundwater table. If the water table is close to the surface, groundwater mounding will become a factor, and the test can yield unrealistic results. The DRI test is regulated by the American Standard for Testing Materials (ASTM) under Test Number D As stated within the aforementioned standard, the test has some restrictions of use. It cannot be used when the hydraulic conductivity is greater than 10^-2 and less than 10^6 cm/second. The reason for this is if the water infiltrates too slowly, evaporation can affect the results in which case the covered DRI test should be used. The DRI is said to provide a reasonable initial field infiltration rate at the surface level. It also can be used to find the unsaturated hydraulic conductivity very effectively. A negative aspect to this test is that it does not yield the results of the saturated field infiltration rate, which is a requirement for most engineering infiltration designs (Andreyev 1991). The purpose of the center ring within the DRI test forces the fluid held within the center ring to infiltrate mainly in the vertical direction. Water naturally infiltrates in both the horizontal and vertical directions. Soils in nature are an anisotropic material, which means their permeability in the horizontal direction is different than in the vertical direction. The degree to which soils are anisotropic depends on the soil type, but in general, clayey soils have more of a variation than sandy soils (Das 1997). Despite the use of the outer ring, there is still some quantity of water that will seep laterally below the cylinder (Andreyev 1991). The DRI test is often used for the design of shallow stormwater ponds. The DRI rings should be installed at the depth of the proposed pond bottom. Due to this fact, this test can be impractical to run if the proposed pond bottom is excessively below the existing ground surface as a result of the costs to construct a testing pit. Also, the surface of the ground should represent post construction conditions. Construction pond facilities will cause some compaction of the surface soils thus affecting the results. 9
21 One main problem using the DRI for pond design is that some of the quantity of water will have a lateral diversion. This especially happens in cases where there is a clay layer within the soil stratum. The fluid will infiltrate horizontally to the clay layer, and then be diverted to lateral flow at the clay layer. Because the design of a pond will be significantly larger than that of the twelve (12) and twenty-four (24) inch rings, the result will be an overestimation of the infiltration value (Andreyev 1991). One of the field methods for measuring infiltration are portable rain simulators. This device works basically as described by the name. Nozzles are mounted about six (6) to seven (7) feet above the ground surface, and water is piped through the system, exiting the nozzles to simulate rain on a plot of soil (Chow 1964). An advantage to the rainfall simulator is that you can test variable intensity rainfalls within a short period of time (Gao et al. 2008) The Use of Software to Compute Infiltration PONDFLOW PONDFLOW is a computer software model that is designed to conduct retention recovery simulation. The software was developed by Kuhns in This software is similar to the MODRET software which is described below, with the exception that PONDFLOW uses a finite difference mathematical method to determine how the groundwater fluctuates over time. This method is an approved method for developing ponds within the Tallahassee, Florida area by the local and state regulatory agencies MODRET to Compute Infiltration MODRET is a computer software model originally developed by Andreyev and Wisemen in 1989 for the Southwest Florida Water Management District. A research study published in Special Publication SJ93-SP10 found that MODRET produces unreliable results under several conditions. These conditions, as found in the above-mentioned research, include ponds with relatively large dimensions, such as over one hundred feet on any side. Also results are unreliable if the aquifer is less than five feet thick (Florida Department of Environmental Protection and Northwest Florida Water Management District 2007). 10
22 2.5 FACTORS THAT AFFECT INFILTRATION RATES IN THE FIELD There has been much research conducted to determine the accuracy of the DRI test and the parameters that affect the DRI test. One research conducted by Pan et al. (1997) investigated how deviating from the ASTM standard procedure and changing various parameters of the double-ring infiltrometer affected the results on permeability. The research focused on the effect on infiltration rates of a single versus double ring test as well as the effect on infiltration rate when the size of the infiltration ring has been increased from the standard ASTM specification. The research also investigated the effects on infiltration when a falling head DRI test method is used as opposed to a constant head DRI test. The research concluded that when standard ring sizes are used the infiltration rate utilizing the dual ring method was equal to 80% of the infiltration rate resulting from the single ring test. This decrease in infiltration can easily be associated with the mechanics of water infiltration. When both rings are utilized, the water within the single ring is only allowed to infiltrate vertically. When only a single ring is used, the water is allowed to infiltrate both vertically and horizontally (Pan et al. 1997). An interesting effect on infiltration rates is the relationship between the falling head and the constant head DRI test. The infiltration rate dropped as much as 30% when using the falling head test method (Pan, Robertson and Shouse 772). During the test procedure, the technicians allowed the water to drop from a ponded depth of five (5) centimeters to a ponded depth of one (1) centimeter. It should be noted that this research was not conducted in the field. Instead, numerical models, using finite difference, were created and evaluated. These results were compared with pre-existing equations to simulate steady-state infiltration (Pan et al. 1997). The thirty percent drop in the infiltration rate that was noticed by the research of Pan, et. al. was also confirmed by Dukes et al. (2008). Their research was also conducted to evaluate how changing parameters of the double ring test affect the resulting values. The difference between this research and the previously mentioned research was it involved actual field tests and very little numerical modeling. Dukes et al. discovered a twenty-eight percent drop of the infiltration rate when comparing the constant 11
23 head test results with that of the falling head test results. The difference in the two research groups can be attributed to different types of soils studied. Research conducted by Bird, et al. (2004) evaluated the affect of vegetative roots on the transportation of water into a soil. Their research hypothesized the introduction of the root system to the bulk soil increases the soil s density and this is what is responsible for the change in the hydraulic properties. Their research unfortunately leads to no concrete answers. Research printed within the publication Water Resources Research evaluated the time required for initial ponding to occur under variable rainfall intensities. To determine the time required for ponding one must first know the infiltration rate as well as the depth to the water table. This research chose to examine soils with well known hydraulic properties, thereby avoiding field testing. To evaluate the infiltration rates used within the research, the Green and Ampt (1911) approach was used. This approach was determined useful, but only in homogeneous soils (Assouline et al. 2007). Other research conducted on this topic evaluated the effect of grassed areas on infiltration. This research is applicable to pond design due to the regulatory requirement for dry ponds to remain grassed. Research was conducted to determine how the grass affects infiltration and runoff. The research discovered that the initial infiltration was greatly increased. This was attributed to the open values or cracks created by the root structures. The research concluded that while the initial infiltration rate was increased when grass was present, the final infiltration rate was equal to that of a bare land. The only difference after steady-state has been reached is the amount of run-off that occurs. This research concluded that the runoff quantities decreased due to the presence of the grass which acts as a friction layer and slows down the overland flow movement of water (Fredlund et al. 2007). Research conducted by Oyarzun (1995) compared infiltration and permeability rates to various soil parameters. With this research, the organic content, density, and the percent sand, gravel and silt were evaluated to determine the effect these parameters had on infiltration and permeability rates. Permeability and infiltration measurements were made at various depths using the same piece of equipment, a Guelph permeameter. Oyarzun stated that his lack of repetitive testing takes away from any statistical significance his work can offer. 12
24 One factor that affects infiltration that appears in the research repeatedly is the effect of the construction equipment on the soil during construction. The more vehicles that drive on the land the more the soil will be compacted and the lower the infiltration rate will become. Research conducted by Gao et al. evaluated the effect of a standard farm tractor driving on a sample plot of land. The research was tested over a five year period, and the infiltration was measured using portable rain simulators. At the end of the five year period the researches noticed a forty-five percent decrease in infiltration rates (2008). 13
25 CHAPTER 3 PROCEDURES 3.1 SITE INFORMATION Adequate site characterization is an important aspect in engineering. While it will not define the precise data, it can reveal anticipated problems or predict unacceptable results. Site characterization can be a problematic task for the engineer who has to decide how much testing is necessary to adequately define the problems associated with a site without specifying so much testing that it becomes impractical. For evaluation of the infiltration characteristics of a stormwater management facility, this is particularly difficult because of the varied nature of most subsurface conditions. It is the Geotechnical Engineer s task to infer what the subsurface conditions are beneath a large stormwater management facility based on several small diameter soil borings randomly placed within the area. Casagrande, in 1965, developed the concept of calculated risk where the design should be based on the information available to reduce the risk of failure to an acceptable level. While Casagrande did not define what the acceptable level was, the standard has been set by state agencies and court cases (Dowding 1978). The risks associated with stormwater management facilities typically center around potential flooding and its impact on surrounding structures as well as downstream conditions. Even with the potential for flooding, some clients are not receptive to paying for field testing or subsurface sampling unless it is required by regulations. The fine line between cost and safety must be answered by each Geotechnical Engineer when developing the most appropriate and cost-effective subsurface investigation. For the conduction of the research a site was chosen. The site for this study is a functioning stormwater management facility. This facility was designed to act as a dry retention pond with an overflow pipe to handle any excessive water accumulation greater than the pond s design storm volume. A dry retention pond is a man-made depression created for the purpose of storing stormwater runoff and treating it through infiltration into the underlying soils. A photograph of the stormwater treatment facility is shown in Figure 1. 14

26 Figure 1. Stormwater Management Facility Used In This Study. The reason for using an existing stormwater management facility was to provide a control to check the infiltration predictions developed using both laboratory and field tests against a full-scale structure where actual infiltration measurements could be made. The facility chosen is located between Capital Circle Northeast and Weems Road in southeast Tallahassee, Florida. This facility is located on the property of Environmental And Geotechnical Specialists, Inc. and is typical of stormwater management facilities in North Florida. Permission from the owners of the facility to conduct the testing was received prior to the initiation of this study. A project location map is shown in Figure 2. A review of topographic maps of the area was conducted to initiate the study. This information was helpful in determining the site s elevation relative to surrounding areas and the drainage patterns of the area. In addition, the topographic map was used to evaluate the approximate depth to groundwater by identifying the elevation of adjacent water bodies. 15

27 Figure 2. Site Location Map of Stormwater Management Facility (DeLorme 1999). The topographic map reviewed was taken from the City of Tallahassee/Leon County GIS Data Base and is on two feet contour lines and is included as Figure 3. The general topography of the area slopes to the southwest towards Weems Pond. The approximate elevation of the stormwater pond used in this study is about EL fifty-five feet and is adjacent to a City of Tallahassee s Regional Stormwater Management Facility (Weems Pond). The pond used for testing is outside the one-hundred year flood plain identified on Figure 3 as the hatched area. Another important piece of information is the characteristics of the subsoils as defined for the United States Department of Agriculture (USDA) Soil Survey. The assumption is that soils with similar mechanical properties and origins behave in a similar manner, including the permeability of a soil. Although there are differences, the USDA Soil Survey data for a particular area is often used to define and quantify the infiltration of a stormwater management facility constructed at that location. 16
 A copy of the USDA Soil Survey data for the area of the Stormwater Pond has been included in Appendix A.")
28 Test Location Weems Pond Figure 3. Topographic Map of Project Area (Tallahassee-Leon County GIS. 2009) A copy of the USDA Soil Survey data for the area of the Stormwater Pond has been included in Appendix A. As can be seen in Appendix A, soils in this area are mapped as being predominately Plummer Fine Sand. This soil series is characterized as being fine sand (SM/A-2-4) with organics to a depth of about five feet, where clayey fine sand (SC/A-2-6) exists. The general soil properties for this material, as reported in the USDA Soil Survey for Leon County, are provided in Appendix B. The soils encountered beneath the stormwater management facility were consistent with that reported in the USDA Soil Survey. 3.2 SOIL SAMPLE COLLECTION AND CLASSIFICATION As part of this study, a soil boring was installed within the stormwater management facility using Environmental and Geotechnical Specialists, Inc s BK 51 HD rotary drilling rig. The soil boring was accomplished using a four (4) inch auger coupled with standard penetration tests (SPT) conducted on
29 foot centers to a depth of fifteen feet below the bottom of the stormwater management facility. The SPT tests were conducted in accordance with ASTM Method D The SPT split-spoon is widely used as a tool for collecting disturbed soil samples for the purposes of evaluating the subsurface uniformity and density. The SPT split-spoon is a steel tube that has a hollow interior diameter of 1 3/8 inches and an outside diameter of two inches with a length of eighteen inches. The disturbance of the soil sample being compressed into the hollow tube during the SPT does not affect the results of the basic laboratory tests that are used to determine the physical properties of the soil (Andersland and Al-Khafaji 1992). The depth to stabilized groundwater was determined by allowing the borehole to set open for a period of twenty-four hours after the soil boring was installed. After twenty-four hours, the depth of groundwater, below the bottom of the stormwater management pond, was measured and the borehole was filled with grout. The borehole was grouted shut to eliminate possible short circuiting the infiltrating water through an open borehole. In addition to the SPT samples, two undisturbed samples were collected. The two samples were obtained using a thin walled sampling device referred to as a Shelby tube. This sampling method consists of using the drill rig to hydraulically push a thin-walled steel tube into the ground a distance of 2.5 feet at the desired depth. Once the tubes were removed from the borehole, the ends were sealed to prevent moisture loss and then carefully transported to the laboratory where the soil sample was extracted. The two undisturbed soil samples were collected to measure the in situ density and to have a sample to test for permeability. Each sample was tested for water content, grain-size distribution and plasticity. All soil testing was conducted in accordance with the applicable American Society for Testing Materials (ASTM) Standard. Each of the soil samples was classified in accordance with the American Association of State and Highway Transportation Officials (AASHTO) and Unified (UNIFIED) Soil Classification System. The AASHTO Soil Classification System was developed in the late twenties by the United States Bureau of Public Roads. This system classifies the soils by its suitability for use in roadway construction (Anderson, Dunn and Kiefer 34). The Unified Soil Classification System is the most widely used 18
30 system and was developed by Casagrande in 1940 s for use in military construction by combat soldiers with limited knowledge of soils. This system broadly classifies the soils based on general engineering purposes (40). The Unified Soil Classification System has been adopted by ASTM as the standard classification system. 3.3 FIELD TESTING PROCEDURES The in-situ field testing procedure that was chosen was the double-ring infiltrometer (DRI) test. This test was chosen due to its wide use in today s engineering projects. The ease of conducting this test allows for non-technically skilled personnel to run the test in the field and obtain consistent results. Most regulatory agencies, such as the Florida Department of Environmental Protection (FDEP) and the Florida Water Management Districts, accept the results of the DRI test along with other subsurface data for the design of stormwater management facilities. Despite the acceptance of the test, the results can be misleading. An example is if the water table exists at a depth of about four feet or greater below the bottom of the double ring than the effects of the water table will likely not be reflected in the test results. However, this same depth to the water table may significantly impact the function of the stormwater management facility. This conflict in testing results is due to the scale difference between the volume of water infiltrated through the DRI test and the volume of water infiltrated through the bottom of the stormwater management facility. Research conducted by Nicolas Andreyev for the Southwest Florida Water Management District (1991) concluded that the double ring infiltration test is most useful when conducted at the elevation of the proposed pond bottom, and the field conditions during the test mirror those that will exist after construction of the stormwater management facility. It should be noted that it is nearly impossible to duplicate post-construction conditions (i.e. pond size and depth) during the geotechnical investigation, since the final size may not be accurately known until after the field testing is complete. Andreyev concluded that the DRI test data is most useful to determine the site s initial unsaturated infiltration rate. For the most accurate results, he suggested to use either short testing periods to measure unsaturated flow or long periods of time to measure saturated flow. 19
31 Other research using the DRI tests was conducted by Professional Service Industries (PSI). These tests were conducted to estimate the recovery time of a fully-functioning stormwater facility based on DRI test data. Recovery time of a stormwater management facility refers to the time it takes after a storm event for the water level to return to its pre-storm level. The research evaluated the prior belief that took fifty percent of the double ring infiltration rate as the average infiltration rate a pond experiences during recovery. This research showed that more analysis is needed. During this research the predicted recovery time for a given storm event by the DRI test alone was 0.06 of a day. The actual measured recovery time was 5.3 days. To determine the estimated recovery from the DRI test the researchers took fifty percent of the observed double ring infiltration rate as the average infiltration rate (PSI 1993). There is a note at the bottom of the ASTM standard for the DRI test which states the possibility of inaccurate results. No statement on precision and bias can be made due to the variability in soils tested and in the types of liquids that might be used in this test method. Because of the many factors related to the soils, as well as the liquids that may affect the results, the recorded infiltration rate should be considered only as an index value (ASTM 2003a). The reason that the DRI test uses two separate rings is based on the fact that water flows faster through soil in the horizontal direction then it does in the vertical direction. If the test was run with only one ring than the water would infiltrate faster in the DRI test then that which would infiltrate through the bottom of a stormwater management facility. It should be noted that the effects of lateral flow through the bottom of an actual stormwater management facility become less as the bottom of the stormwater management increases in size. The general flow pattern beneath a single ring infiltration test is shown in Figure 4. A graphical representation of the hydraulic gradient has been included in Appendix C. From the two graphs it is evident that within the double ring values further infiltration occurs in the vertical direction. The single ring test shows the infiltration further in the horizontal direction. 20
32 Water Level Plume Direction of Flow Figure 4. Plume Influence when Testing with a Single Ring Infiltrometer. To account for the three-dimensional effects of the dispersion of water below the infiltration test ring, a second ring was introduced. The second ring is placed directly in the center of the larger ring. The water in the outer ring is allowed to infiltrate laterally, while the water infiltrating below the inner ring is then forced to infiltrate vertically. During the test, the heights of water in the rings are maintained at the same level and the infiltration rate is only measured in the inner ring. The infiltration rate from the larger ring is typically ignored, although there is a method in the ASTM Standard for this test which uses the flow from the outer ring to measure the lateral wetting front. The general flow patterns beneath a double ring infiltration test are shown in Figure 5. Before the test can begin, the test location must be prepared. Preliminary soil testing must be performed, as described above, which confirms that the soil is not too coarse or fine to prevent accurate results. If the water levels within the test fall faster than one has the capability of accurately measuring, then results will be erroneous. Likewise, if the soil contains predominately clay particles, which results in no vertical infiltration, the test results will be erroneous. 21
33 Water Table Plume Direction of Flow Figure 5. Plume Influence when Testing Infiltration with Dual Rings. The equipment for the double ring infiltration test is comprised of two large steel cylinders. The diameters of the outer and inner cylinders or rings are two feet and one foot, respectively. The heights of the rings are both approximately twenty inches. The bottom edges of the steel rings are normally sharpened to reduce soil disturbance. The steel rings are driven into the ground with a sledge hammer. The larger of the rings should be driven to a depth sufficient that water from the outside ring will not seep into the inner ring. The smaller inner ring is than placed directly in the center of the larger ring and also driven with the sledgehammer to a depth of approximately three inches. The depth of this ring is not as crucial, although it needs to be deep enough to prevent water from seeping around the bottom of the ring and reaching the ground surface. Photographs of the two steel rings used in this study are shown in Figures 6 and 7. 22

34 Two separate water tanks are used to measure the amount of water added to each ring during the test procedure. As mentioned previously, only the volume of water added to the inner ring is normally recorded. The volume of the water tanks needs to be sufficiently large as to have adequate capacity to avoid stopping the test to refill the water. The system used in this study had graduated cylinders with rubber tubing that could supply additional water to the tanks as needed without stopping the test. The water supply tubing can be seen in the photograph provided in Figure 7. In this study, the water levels in the rings were monitored using steel rulers clamped to the side of each ring. Figure 6. Interior of DRI Steel Rings After Driven into the Ground. 23

35 Figure 7. DRI Testing Equipment After Driven into the Ground. Preparation of the ground surface where the infiltration test is to be conducted usually consists of removing the surficial soils to a depth of six inches. This depth of soil is removed since it is assumed that the surficial soils contain sufficient organics and /or compacted soils that the results of the test will be adversely affected. In addition, in the construction of most stormwater management facilities at least the top six inches of existing soil are removed. In some cases, if the stormwater management facility is to be constructed with its bottom elevation several feet below the existing ground surface, a pit will be dug and the double ring infiltration test will then be conducted in the bottom of the pit. Once the ground surface is prepared and the testing apparatus has been set up, water is slowly introduced into both rings (to prevent erosion of the soil at the bottom of the ring). The head of water supplied to the rings from the water tanks should be kept between four and six inches. The water head was kept constant at five inches during this study with the water levels in the tanks not allowed to deviate more than 0.2 inchs during the test. 24
36 This testing procedure indicates that the test should not be conducted in direct sunlight, because direct sunlight will result in significant evaporation of the testing water, resulting in higher water infiltration rates. In this study, the double ring test was conducted under umbrellas to shield the equipment water and reduce the temperature of the equipment. The test in this study was performed over a four hour time period. During the first hour, the readings were taken every fifteen minutes; during the remainder of the testing period, readings were taken every thirty minutes. It should be noted that some testing equipment is setup with siphons that can be used to control the level of water in the rings; however, in this study constant supervision of the water supply tanks and double rings was maintained to ensure the water levels in the supply tanks and double rings were properly maintained. The testing for this study using the two (2) ring test procedure was conducted during July and August of The tests were conducted early in the day to avoid the direct heat and to minimize evaporation as much as possible. All tests conducted for this study were started before 8:00 AM and, as mentioned previously, the testing apparatus was kept shaded. The average temperature varied from about eightyeight degrees Fahrenheit at the start of the test to ninety-six degrees Fahrenheit at the end of the tests. All testing was performed in accordance with ASTM Standard D Because part of this study was to compare the test results obtained from a single ring as well as a double ring test, the single ring test was conducted under similar conditions as the double ring test. Two (2) single ring tests were performed in January and February of The temperatures were substantially cooler during this time period. Colder temperatures are known to affect infiltration results by affecting the viscosity of a liquid, and this was considered in analyzing the results. Viscosity and hydraulic conductivity are inversely related: the higher the viscosity, the lower the permeability. The tests for both the double ring and the single ring were run at the same location. Each test was performed twice to check for consistency of the data. For each test, the date, time, temperature and atmospheric conditions were recorded. Results from both the single and the double ring tests are provided in Chapter 4. 25
37 3.4 LABORATORY TESTING PROCEDURES Field tests are always preferable to laboratory testing; however, there are two major disadvantages to field testing. The first disadvantage is the cost associated with field testing, which usually requires mobilization and field time. The second disadvantage is the unpredictability of conditions, including weather, temperature, site conditions and distance from the site. There are also disadvantages in laboratory testing, such as lack of incorporation of soil stratification, sample disturbance and the varying experience of the testing technician. In addition, sandy soils are virtually impossible to collect in an undisturbed state and therefore need to be remolded prior to testing. The laboratory testing procedure chosen for this study was the falling head permeability test. This test was chosen because it is widely used to test fine grained soils. Although there are no current ASTM Testing Standards for this particular test, Das published the widely-used testing procedure in This procedure is run similar to that of the constant head testing method, which is an ASTM Standard Test (ASTM D 2434). The falling head permeability test can be conducted on either undisturbed or remolded soil samples. The advantage of the undisturbed sample is that the determined hydraulic conductivity is likely more representative of in situ soils. An undisturbed sample is difficult to obtain in sandy soils; therefore, a remolded soil sample is often used. The sandier soils typically have less stratification and density variation; therefore, the remolded soil sample is appropriate for the testing of sandy soils. For this study, a Shelby tube of each stratum of the subsurface soil was obtained with the Shelby tube measured and weighed and the natural density of the soil determined. Because of the lack of cohesion in the soil sample, it was not practical to extract the sample from the shelby tube and test it in an undisturbed state. The samples tested in the laboratory for this study were remolded to same density and water content as the in situ soils. A photograph of the test apparatus and the deaeration equipment is provided in Figures 8 and 9, respectively. 26


38 Figure 8. Rigid Wall Permeameter Testing Equipment. Figure 9. Photograph of Deaeration Equipment. 27
39 As mentioned previously, the tests were conducted on soil samples compacted to the same density as that in the field for each strata. It should be noted that there are some areas where error could be introduced during the test. Potential sources of error include the following: particles of soil being tested may have a different orientation from that in the ground, there may be areas in the ground of lessdense or more dense soils, and sidewalls can become smeared which creates a barrier to the flow of water. Another source of laboratory error is water leakage from the apparatus. A leak could occur at the top and bottom of the sample where the plastic tubing enters and leaves the chamber, at the plastic tubing connection points with the apparatus burettes, and around the sample within the chamber. Of the sources of error, the leakage of water around the sample within the chamber is believed to be the largest. The permeability results obtained in this study are believed to be higher than that which actually exists because of the error introduced through sidewall leakage. The only way to prevent this leakage is to use a flexible wall permeameter, which was beyond the scope of services conducted. The test was repeated several times until consistent data was achieved. Distilled water, rather than tap water, was used as the permeating fluid to mitigate any effects that chemicals in the water could have in clogging the porous stones. Longer test intervals were used to help reduce the effects of trapped air in the soil samples, although each specimen was back saturated with deaired water prior to starting the test. Results of each test are provided in section
40 CHAPTER 4 RESULTS The field studies were conducted within a Stormwater Management Facility located at 3154 Eliza Road in Tallahassee, Florida. This facility houses the field offices for Environmental and Geotechnical Specialists, Inc. (EGS). This Site was chosen because the Stormwater Management Facility is shallow and fairly level, boundaries are well defined and the bottom contains a significant amount of vegetation. As discussed previously, the soils in the area are mapped as being Plummer Fine Sand. A photograph of the facility is provided in Figure 1, with the site location identified on Figure LABORATORY RESULTS Soil Classification Results As described previously, samples of the subsoil were collected on one foot intervals and tested for grainsize distribution, Atterberg limits and moisture content. The results of the soil testing are summarized in Table 1. As can be seen in Table 1, the top 2.5 feet consists of a silty fine sandy soil that classifies as an SM in the Unified Soil Classification System and as an A-2-4 in the American Association of State Highway and Transportation Officials (AASHTO) Soil Classification System. This material is characterized as sand with silt, has a low plasticity and is considered a moderately permeable soil. Beneath this layer of silty sand is a layer of clayey sand that classifies as an SC in the Unified Soil Classification System and as an A-6 in the AASHTO Soil Classification System. This material is classified as clayey sand, with a moderately high level of fines and is considered plastic. While this material is not considered impermeable, it has a low coefficient of permeability and often acts as a confining layer. Underlying this layer of clayey sand is a layer of clayey fine sand which also classifies as an SC in the Unified Soil Classification System and as an A-2-6 in the AASHTO Soil Classification System. The difference between the A-6 and the A-2-6 soils is the amount of fines. The A-2-6 has less fines than the A-6 soil; therefore, the A-2-6 is slightly more permeable. 29
41 Based on the results of the laboratory testing, it is likely the stormwater will infiltrate downward until it reaches the clayey sand (A-6) layer and then it will begin to mound up as more water infiltrates causing the water to become perched on this clayey sand layer. At this location, groundwater mounding will not be a problem except after heavy rain events. Table 1. Results from the Laboratory Classification Testing Depth Moisture Mechanical Analysis (% Passing) Atterberg Limits Content Liquid Plastic Limit Limit NP NP NP NP Evaluating the results included in Table 1, the following classifications can be determined: Feet Silty Fine Sand (SM / A-2-4) Feet Clayey Sand (SC / A-6) Feet Clayey Fine Sand (SC / A-2-6) Feet Silty Fine Sand (SM / A-2-4) Grain-Size Correlations One method of estimating the permeability of a soil is through the use of its grain-size distribution curve. This method was discussed previously. A grain-size distribution curve was created for each of the soil samples using the data from Table 1. The grain-size distribution curves represent the percent of soil by weight that passes each sieve size. Based on these grain-size distribution curves a uniformity coefficient (C u ) can be obtained. The Uniformity Coefficient is the diameter at which sixty percent of the soil by weight has a smaller particle 30
42 diameter divided by the particle diameter at which ten percent by weight is smaller. Using the results of the grain-size distribution curves with the graphs provided in Appendix A, the approximate permeability of the soil can be estimated. Based on the correlations in Appendix A, the following average permeabilities were estimated: Feet 2.60 inches per hour (5.10 feet per day) Feet 0.06 inches per hour (0.14 feet per day) Feet 0.85 inches per hour (1.70 feet per day) Feet 3.26 inches per hour (6.52 feet per day) While the results obtained seem reasonable when looking at just this data set, flaws with this method can be seen. One flaw is that if the curves are drawn differently, the permeability value that would result would also be different. The engineer utilizing this method must use judgment to develop the grain-size distribution curves and then to estimate the permeability from those curves. This method seems to be a reasonable estimate and it could be helpful when used in conjunction with other permeability values. The grain-size distribution curves are shown in Figures 10 through
43 Figure 10. Graphical Representation of Grain Size Distribution for the Sample Collected from 0.0 to 1.5 Feet Below Ground Surface. Figure 11. Graphical Representation of Grain Size Distribution for the Sample Collected from 2.4 to 4.0 Feet Below Ground Surface. 32
44 Figure 12. Graphical Representation of Grain Size Distribution for the Sample Collected from 5.0 to 6.5 Feet Below Ground Surface. Figure 13. Graphical Representation of Grain Size Distribution for the Sample Collected from 7.5 to 9.0 Feet Below Ground Surface. 33
45 Figure 14. Graphical Representation of Grain Size Distribution for the Sample Collected from 10.0 to 11.5 Feet Below Ground Surface. Figure 15. Graphical Representation of Grain Size Distribution for the Sample Collected from 13.0 to 15.0 Feet Below Ground Surface. 34
46 4.1.3 Falling Head Permeability Test The permeability test chosen as mentioned in the procedures section was the Falling Head Permeability Test. While this test does not actually have an ASTM Testing Standard designation, it is commonly used by geotechnical engineers. The diameter of the testing cell used was centimeters (cm). The diameter of the standpipe was 1.21 cm, with a thickness of 0.17 cm. The area of the sample was 84.5 cm squared and the area of the standpipe is 0.30 cm squared. A falling head permeability test was conducted on each material type. The soil permeability from the falling head permeability test can be estimated from Equation 6. The values for the equation are the starting head (h 1 ), ending head (h 2 ), length of sample (L), area of sample (A) and area of burette tube (a) (Das 1997). k ( al ) log h 1 At h 2 Equation 6 The falling head permeability testing was conducted on February 20, 2009 on the silty fine sand mixture from the top soil strata. Based on a Shelby tube sample collected of this soil, the test samples were compacted to a dry density of about 94.8 pounds per cubic foot. The length of the test sample was 7.62 cm and the change in head for each test was from 97.2 cm at the beginning of the test to 47.2 cm by the end of the test. For this material, ten separate tests were conducted with all the results in close agreement. The average infiltration rate for this silty fine sand, based on the falling head test, is 2.37 feet per day. Results from these tests is summarized in Table 2. The second set of falling head permeability tests was conducted on February 21, The tests were conducted on the second soil strata, which exists from a depth of 2.5 feet to ten feet below the ground surface. This soil was aclayey sand (SC/A-6). Based on the Shelby tube sample collected of this material, the samples were compacted to a dry density of pounds per cubic foot. The sample length was 10.5 cm. The head of water at the start of each test was 84.9 cm and the head of the water at the completion of the test was 64.9 cm. The time interval between the head readings changed slightly 35
47 between readings. Fourteen tests were conducted, with an average corrected permeability value of feet per day. This value is significantly less than the 2.37 feet per day of the overlying silty fine sand. The test results is summarized in Table 3. The third material was tested on February 22, This soil was the third strata from the ground surface and consisted of a clayey fine sand (SC/A-2-6). Based on the Shelby tube sample collected at a depth of 7.5 feet, the samples were compacted to a dry density of pounds per cubic foot. The sample length was 5.1 cm. The initial hydraulic head of each test was 97.9 cm and the final hydraulic head was 67.9 cm. The average permeability for this clayey fine sand was feet per day based on the falling head permeability test. A summary of the test results is provided in Table 4. The results of the falling head permeability tests seem reasonable. The silty fine sand (SM/A-2-4) had the highest permeability with a value of 2.37 feet per day. The clayey sand (SC/A-6) had the lowest rate with a value of feet per day. The clayey fine sand (SC/A-2-6) had a value significantly less than the silty fine sand (SM/A-2-4) but significantly greater than the clayey sand (SC/A-6). This is consistent with premises that the higher the fines content, the lower the permeability rate. 36
48 Table 2. Infiltration Results from the Second Single Ring Field Test Conducted on February 20, FALLING HEAD LABORATORY TEST #1 SAMPLE DEPTH: MATERIAL TYPE: SILTY FINE SAND (SM/A-2-4) TEST TIME VELOCITY PERM. (K) VISCOSITY PERMEABILITY (K 20C ) NUMBER (T) (Q/AT) (UNCOR.) RATIO (CORRECTED) (sec) (cm/sec) (cm/sec) (cm/sec) (ft/day) (in/hr) E E E E E E E E E E E E E E E E E E E E
49 Table 3. Infiltration Results from the Second Single Ring Field Test Conducted on February 21, SAMPLE DEPTH: FALLING HEAD LABORATORY TEST #2 MATERIAL TYPE: CLAYEY SAND (SC/A-6) TEST TIME VELOCITY PERM. (K) VISCOSITY PERMEABILITY (K 20C ) NUMBER (T) (Q/AT) (UNCOR.) RATIO (CORRECTED) (sec) (cm/sec) (cm/sec) (cm/sec) (ft/day) (in/hr) 1 1, E E , E E , E E , E E , E E , E E , E E , E E , E E , E E , E E , E E , E E , E E
50 Table 4. Infiltration Results from the Second Single Ring Field Test Conducted on February 20, FALLING HEAD LABORATORY TEST #3 SAMPLE DEPTH: MATERIAL TYPE: CLAYEY FINE SAND (SC/A-2-6) TEST TIME VELOCITY PERM. (K) VISCOSITY PERMEABILITY (K 20C ) NUMBER (T) (Q/AT) (UNCOR.) RATIO (CORRECTED) (sec) (cm/sec) (cm/sec) (cm/sec) (ft/day) (in/hr) E E E E E E E E E E E E E E E E E E E E
51 4.2 FIELD PERMEABILITY RATES Double Ring Infiltrometer Results Two double ring infiltration (DRI) tests were conducted in accordance with the procedures outlined in ASTM Standard Testing Procedure D The tests were conducted on July 25, 2008 and August 18, The two DRI tests were conducted at the same location with the steel rings being left in place between the tests to avoid disturbing the soil. The surface of the test location was scraped clean of vegetation prior to installing the steel rings. The DRI test equipment was supplied by the Florida Agricultural and Mechanical University and Florida State University College of Engineering, Civil and Environmental Engineering Department. The first field test was conducted on July 25, 2008 at 8:15 AM to avoid the heat of the day. The temperature at the beginning of the test was 82 degrees and by the completion of the test the outside air temperature raised to a steady 98 degrees. This test was conducted over a four hour period. The results of this DRI test are shown graphically in Figure 16, with the values summarized in Table 5. The infiltration rate began at 5.7 feet per day and slowly dropped and leveled off at approximately 1.6 feet per day. The equation used to compute the infiltration rate is provided in Equation 7 (ASTM 2003a). IIR VIR AIR t Where : I IR : Infiltration rate of Inner Ring V IR : Volume of liquid used during time interval : Area of inner ring A IR t : time interval Equation 7 The second field infiltration test was conducted on August 18, 2008 over a six hour period. The reason for the delay from the first test to the second test was because of unfavorable weather conditions. An attempt was made to run each test under similar conditions. The second test was run for only six hours 40
52 in accordance with the standard ASTM D , even though it appears that it did not totally stabilize. Although the test could have been run longer to get better stabilization, it is likely not a procedure that would be followed under most design conditions. The results of this DRI test are shown graphically in Figure 17, with the values summarized in Table 6. As can be seen in Figure 17 and Table 6, the infiltration rate began at 12.0 feet per day and slowly dropped and leveled off at approximately 1.6 feet per day. The infiltration rate varied significantly from the beginning of the test to the end of the test for both testing procedures. If the beginning infiltration values of either 5.7 feet per day or 12.0 feet per day were used for the design of a stormwater management facility, it would grossly over-estimate the infiltration rate of the subsoils. It is likely that the results of the double ring test do not actually represent the saturated or unsaturated infiltration. 41
53 Double Ring Field Test Field Infiltration Rate (Feet/Day) Test Duration (Hours) Figure 16: Graphical Representation of Field DRI Test Results Conducted on July 25,
54 Double Ring Field Test Field Infiltration Rate (Feet/Day) Test Duration (Hours) Figure 17: Graphical Representation of Field DRI Test Conducted on August 18,
55 Table 5. Results from the Field Double Ring Test Conducted on July 25, Double Ring Field Test 1 INNER CYLINDER TIME Test Period Outer READINGS Volume Infiltration Duration duration Ring Drop Rate (hours) (sec) (ml) (ml) m^3 in^3 (in^3) (ft/sec) (ft/day) 8:15 start E :30 stop E E :30 start E :45 stop E E :45 start E :00 stop E E :00 start E :15 stop E E :15 start E :30 stop E E :30 start E :45 stop E E :45 start E :00 stop E E :00 start E :30 stop E E :45 start E :45 stop E E :45 start E :45 stop E E :45 start E :45 stop E E
56 Table 6. Results from the Second Double Ring Field Test Conducted on August 18, Double Ring Field Test 2 INNER CYLINDER TIME Test Period Outer READINGS Volume Infiltration Duration duration Ring Drop Rate (hours) (sec) (ml) (ml) m^3 in^3 (in^3) (ft/sec) (ft/day) 8:35 start E :50 stop E E :50 start E :05 stop E E :05 start E :20 stop E E :25 start E :40 stop E E :45 start E :15 stop E E :15 start E :45 stop E E :45 start E :45 stop E E :45 start E :45 stop E E :45 start E :45 stop E E :45 start E :45 stop E E
57 4.2.2 Single Ring Infiltration Test Results As part of this study, two field infiltration tests were conducted using only the inner ring of the DRI setup. This test was performed because some geotechnical engineers believe that a single ring infiltration test produces results that are similar to that of a double ring infiltration test and is less confusing to their field technicians. The major difference between the single and double ring infiltration test is that in the double ring infiltration test the water in the inner ring is forced to flow vertically downwards, while in the single ring the water flows both vertically downward and horizontally. Two separate single ring infiltration tests were conducted. The first test was conducted on January 25, Instead of starting the test early in the morning to avoid the heat, the test was started later in the day to avoid the cool temperatures of a January morning. The test was started at 10:00 AM and was run for a period of four hours. The temperature at the beginning of the test was 68 degrees Fahrenheit and rose to around 70 degrees by the completion of the test. The results of the test indicated an infiltration rate of approximately 2.6 feet per day. The results of this test are shown graphically in Figure 18, with the values summarized in Table 7. The second test was conducted on February 9, 2009 and also started at 10:00 AM. This test was run for a period of four hours. The temperature at the beginning of the test was 62 degrees Fahrenheit and rose to around 68 degrees by the completion of the test. Graphical representation of the data is shown in Figure 19, with the data provided in tabular form in Table 8. A steady infiltration rate of approximately 2.3 feet per day was measured in this test. The infiltration rates encountered in both tests were noticeably higher than those measured in the double ring infiltration tests. This was expected, because the flow in the single ring infiltration test is three dimensional compared with only two dimensional flow in the double ring infiltration test. It appears that the infiltration rate obtained from the single ring infiltration test is approximately forty-eight percent higher than that obtained from the double ring infiltration test. This agrees with the testing results obtained by Pan et al (1997). 46
58 Single Ring Field Test Field Infiltration Rate (Feet/Day) Test Duration (Hours) Figure 18. Graphical Representation of Single Ring Infiltrometer Test 1 Performed on January 25,
59 Single Ring Field Test Field Infiltration Rate (Feet/Day) Test Duration (Hours) Figure 19. Graphical Representation of Single Ring Infiltrometer Test 2 Performed on February 15,
60 Table 7. Infiltration Results from the Second Single Ring Field Test Conducted on January 25, SINGLE RING FIELD TEST 1 TIME Test Period INNER CYLINDER READINGS Volume Infiltration Duration duration Drop Rate (hours) (seconds) (ml) m^3 in^3 (in^3) (ft/sec) (ft/day) 9:36 start E :51 stop E E :51 start E :06 stop E E :06 start E :21 stop E E :21 start E :36 stop E E :36 start E :51 stop E E :51 start E :06 stop E E :08 start E :38 stop E E :38 start E :08 stop E E :08 start E :38 stop E E :38 start E :08 stop E E :08 start E :38 stop E E
61 Table 8. Infiltration Results from the Second Single Ring Field Test Conducted on February 15, SINGLE RING FIELD TEST 2 TIME Test Period INNER CYLINDER READINGS Volume Infiltration Duration duration Drop Rate (hours) (seconds) (ml) m^3 in^3 (in^3) (ft/sec) (ft/day) 9:42 start E :57 stop E E :57 start E :12 stop E E :12 start E :27 stop E E :37 start E :52 stop E E :52 start E :22 stop E E :22 start E :52 stop E E :52 start E :22 stop E E :22 start E :52 stop E E :52 start E :22 stop E E :22 start E :52 stop E E
62 4.3 COMPUTER ANALYSIS To compute the infiltration rate of water through the bottom of a stormwater management facility, a computer simulation process is normally required. There are several computer models available, but as discussed previously, the computer program MODRET (ver. 6.1) was used in the study. MODRET is a computer program that is used to calculate infiltration for the design of stormwater ponds; both retention and detention ponds that discharge into an underlying aquifer. It should be noted, MODRET can be used to compute both saturated and unsaturated flow. The software incorporates a finite difference approach using the basic platform of the Computer Program MODFLOW to compute the infiltration rate of the stormwater pond. As discussed previously, the field studies were conducted within the existing Stormwater Management Facility at 3154 Eliza Road in Tallahassee, Florida. The Stormwater Management Facility had the following dimensions: Length: 50 feet Width: 35 feet Area: 1,750 square feet Treatment Volume: 2,625 cubic feet Elevation of Design High Water: EL 53.5 feet Elevation of Pond Bottom: EL 52 feet Elevation of Seasonal High Groundwater: EL 49.5 feet Elevation of Confining Layer: EL 49.0 feet To determine which of the previously given permeability values (grain-size correlation, double ring test, single ring test, falling head permeability test) will more accurately compute the infiltration rate, the software MODRET was utilized. The software incorporates the Green & Ampt infiltration equation for the unsaturated flow, listed below as Equation 8, to determine the infiltration of a stormwater facility. Equation 6 incorporates the suction head at the wetting front ( ), the soil s water content ( ), the hydraulic conductivity (or permeability k) as well as the volume of water being infiltrated (F) at time 51
63 (t) (Engineering Software, Inc.). For this particular research, unsaturated conditions were used (Engineering Software, Inc. 2000). Equation 8. The average effective storage coefficient of soil for unsaturated analysis and the average effective storage coefficient of soil for saturated analysis are computed by the MODRET program. The program evaluates data provided by the Southern Florida Water Management District s data on soil storage curves. This data incorporates the soil storage capacity based on the depth to the water table. The input for the program includes the elevations for all these parameters, resulting in a high degree of confidence about the computed values. The MODRET user manual also suggests that the unsaturated vertical permeability is typically two-thirds of the saturated vertical permeability. Likewise, the saturated horizontal hydraulic conductivity is thirty percent larger than unsaturated vertical hydraulic conductivity (Engineering Software, Inc. 9). For each MODRET analysis, the pond parameters remain the same. The only change was the unsaturated vertical hydraulic conductivity values which correspond to those obtained from grain-size correlations, laboratory falling head permeability tests, the double ring infiltration tests, and single ring infiltration tests. The program was run using both unsaturated and saturated components. The computation was run for a twenty-four Hour design period. Sample calculations of the MODRET computer simulations are provided in Appendix E. In Appendix E, the output from the computer analyses is in cubic feet per second. To convert to feet per day, the instantaneous infiltration rate is divided by the bottom area of the Stormwater Management Facility and multiplied by 43,200 to change from seconds to days Grain-Size Correlations The average saturated permeability value obtained using the grain-size correlations was 5.81 feet per day, which is an estimated saturated horizontal permeability rate. The saturated horizontal permeability is 4.47 feet per day, and the unsaturated vertical estimate is 2.87 feet per day. The MODRET analysis 52
64 indicates that the subsoils become saturated after about 4.14 hours. The saturated infiltration rate was computed to be 1.06 feet per day Falling Head Permeability Values The average vertical saturated permeability value obtained using the results from the falling head permeability test were about 2.37 feet per day. Relating that value to the saturated vertical permeability, the value is 3.08 feet per day. The unsaturated vertical estimate is 1.58 feet per day. The MODRET analysis indicates that the subsoils become saturated after about 6.70 hours. The saturated infiltration rate was computed to be 0.45 feet per day Double Ring Infiltration Test Values The average permeability value obtained using the results from the double ring infiltration tests were about 1.68 feet per day, which was the unsaturated vertical value. The saturated vertical permeability would be 2.52 feet per day. The saturated horizontal estimate was 3.28 feet per day. The MODRET analysis indicates that the subsoils become saturated after about 6.36 hours. The saturated infiltration rate was computed to be 0.49 feet per day Single Ring Infiltration Test Values The average permeability value obtained using the results from the single ring infiltration tests were about 2.45 feet per day, which was the unsaturated vertical value. The saturated vertical permeability would be 3.68 feet per day. The saturated horizontal estimate was 4.78 feet per day. The MODRET analysis indicates that the subsoils become saturated after about 4.66 hours. The saturated infiltration rate was computed to be 0.85 feet per day. 4.5 MEASUREMENT OF ACTUAL INFILTRATION RATES The purpose of the testing is to identify and predict the infiltration of stormwater through the bottom of a full-scale stormwater management facility. On September 10, 2009 a staff gage was set in the bottom of 53
65 the Stormwater Management Facility at 3154 Eliza Road in Tallahassee, Florida. The purpose of the staff gage was to measure the actual infiltration of the stormwater with time through the bottom of the Stormwater Management Facility. In the five days prior to September 17, 2009 this area received about 1.75 inches of rainfall. In addition, on September 17, 2009, an additional 0.55 inches of rainfall fell on the area (Weather Underground, Inc. 2009). At 7:00 AM on September 17, 2009, prior to the initiation of rain event, there was no standing water in the Stormwater Management Facility although the bottom of the facility was damp. The rain began at approximately 10:30 A.M. and continued until approximately 3:30 p.m. At 3:30 p.m. there was 4.0 inches of standing water within the Stormwater Management Facility. Readings on the staff gage began at 3:30 PM and continued until 6:00 PM. This Stormwater Management Facility was chosen to conduct the tests because it is fairly shallow and the bottom is level and flat. In addition, this location is where the single and double ring infiltration tests were conducted. The staff gage readings are summarized in Table 9. As can be seen in Table 9, the infiltration rate started out at approximately 1.0 feet per day (0.5 inches per hour) and decreased to 0.60 feet per day (0.3 inches per hour) after a period of 2.5 hours. This decrease corresponds to the subsoils becoming saturated. A comparison between the filtration rate computed using the Computer Program MODRET and that actually measured in the Stormwater Management Facility is provided in Table 9. As can be seen in Table 9, the infiltration rate computed using the data from the double ring infiltration test and that used from the falling head permeability test gave the results closest to that actually measured. The permeability values obtained from the single ring infiltration test over predicted the infiltration rate, while the values based on the grain-size correlations produced the least accurate results. 54
66 Table 9: Actual Infiltration Rates of a Functioning Stormwater Management Facility Reading Time Reading of Infiltration Infiltration Staff Gage Rate Rate (Hours) (Inches) (feet/day) (Inch / Hour) Start 3: : : :
67 CHAPTER 5 DISCUSSION OF RESULTS Based on the results of this study, the following observations were made: The double ring infiltration test indicated a permeability of the soil that was 41% lower than the same soil tested in the laboratory; and, The single ring infiltration test indicated a permeability of the soil that was approximately the same as that obtained from laboratory testing. Previous studies conducted on the double ring infiltration test, as described in Chapter 2, indicate that double ring infiltration test measures the permeability of the soil in an unsaturated state. The degree to which the soils are saturated likely varies with the material type. For coarse sand where the trapped air can be displaced, the degree of saturation of the soils beneath the double rings is likely closer to being saturated than for a silty to clayey soil where the air in the void is trapped. The permeability measured in the laboratory for this study was conducted on a fully saturated sample. The sample was saturated using a vacuum backpressure saturation method recommended in ASTM. It is well documented that saturation of a soil tested in the laboratory under partial saturation conditions has a lower measured permeability than the same soil tested under fully saturated conditions. The degree to which saturation impacts the permeability is not clearly defined; however, in the field studies conducted by PSI, described in Chapter 2, the unsaturated permeability of the soil is approximately two-thirds or seventy percent of the saturated value for the same soil. The results of these studies support the general relationship. Previously conducted research yielded an equation that stated one could take the results from the double ring infiltrometer and multiply the value by 1.45 to obtain the permeability value obtained within the laboratory. When comparing this equation to my results I found the equation is fairly reasonable. The results I obtained, as can be seen above, show that if the double ring results were to be multiplied by 1.41 then I would obtain the saturated permeability values I obtained in the lab. Despite the difference of.04, I feel the 1.45 multiplier seems very reasonable. If the values obtained where to be incorporated in 56
68 any design, than the required factor of safety for that design would more than account for the 0.03 difference. The correlation between the single ring infiltration test, the double ring infiltration test and the laboratory test is not clear. It would appear that the single ring infiltration test accurately duplicates the values in the laboratory since the permeability of the soil in the laboratory was measured to be 2.32 feet per day and the permeability estimated from the single ring infiltration test was estimated to be 2.45 feet per day. The similar values between the single ring infiltration test and the laboratory may not be the result of good correlation between the testing, but rather just a coincidence. During my research I conducted a finite difference problem that determined the flow patterns beneath both a double ring infiltrometer and a single ring infiltrometer. The results from the finite element problem can be seen in Appendix E. As can be seen in Appendix E, the color pattern shows illustrates the difference in pore water pressure underneath the ground surface. The numerical analysis from the excel data, zoomed in, has also been included. As can be seen, the pore water pressure underneath the single ring only supply pore water pressure values that are substantially less than those underneath the double ring. The lower the pore water pressure values the higher the permeability of the soil will be. This is one numerical example, that indicates the results from the single ring test should yield higher test results than those from the double ring. This corresponds to the data obtained in the field. This thought is based on studies which have reported that the single ring infiltration test produces permeability estimates that are approximately forty percent higher than the double ring infiltration test. This increase in estimated permeability is because of the three dimensional flow component in the single ring infiltration test, which does not exist in the double ring infiltration test. 57
69 CHAPTER 6 CONCLUSIONS AND RECOMMENDATIONS Based on the results of the study and the above discussion, the following conclusions were developed: The double ring infiltration test measures the permeability of the soil at the test location; The infiltration rate of stormwater through the bottom of a stormwater management facility is a function of a number of variables, including the permeability of the subsoils; Neither the double ring infiltration test or the single ring infiltration test can be used to measure the infiltration rate of a stormwater management facility directly; The double ring infiltration test is a better field test to measure the permeability of an in situ soil compared to a single ring infiltration test; The saturated permeability value obtained from a laboratory falling head permeability test is approximately equal to the unsaturated rate measured in the field using a single ring infiltration test; and, Permeability estimates developed using grain-size correlations need to be used with caution, since significant error could exist. The 1.45 multiplier works when groundwater is not a factor, and when the depth to the impermeable layer is not a factor. The following additional study is recommended: The influence of the presence of a confining layer below the bottom of the double ring infiltration test on the infiltration rate; The effect of vegetation on the infiltration rate of a stormwater management facility; The effect of siltation and clogging of the surface with fines over time in a stormwater management facility; and, Further testing and correlations of the laboratory permeability test and the field double ring infiltration test. 58
70 APPENDIX A SOIL GRAIN-SIZE CORRELATION CURVES (Powers 1980) 59
71 60

72 61
73 APPENDIX B DETERMINATIN OF PERMEABILITY THROUGH SEEPAGE TESTS (Fang and Winterkorn) 62
74 63
75 APPENDIX C USDA SOIL SURVEY (United States Department of Agriculture) 64
![N t Legend c::j 41, PlUmmer Fine S3n<l キセ @ "" N ] セ jajmf コオ @ COLLEGE P セ @ ENGINEERING Q Wセ U MN Z X セ W@. U セ ] ᄋ @... Q W s f セ @ COE FAMlJ-FSU COLLEGE OF ENGINEERING ntle: Soil.](/docs-images/76/74371993/images/76-0.jpg "1 digbl イ NMLNZ ッセセッ @ of dl= Co-.:::aty Se:J Suruy :up1 y;b!ilbd by tbo Unitod Snto1 {Iqf セ Z@ of Ap.kult'.")
76 N t Legend c::j 41, PlUmmer Fine S3n<l "" N ] セ jajmf COLLEGE P ENGINEERING Q Wセ U MN Z X セ W@. U セ ] Q W s f COE FAMlJ-FSU COLLEGE OF ENGINEERING ntle: Soil.1 digbl イ NMLNZ of dl= Co-.:::aty Se:J Suruy :up1 y;b!ilbd by tbo Unitod Snto1 {Iqf セ Z@ of Ap.kult'.::ro n N rna セ N エ N c ッセ BGM セ o エャ s セゥオ N@ USDA SOIL SURVEY THESIS FIELD TESTING LOCATION LEON COUNTY. FLORJOA MA3TEA3TKS313 JUNE O& 65
77 66
78 67

79 Leon County. Flo.. ida 131 '1'ASLB L5.--PHYS1 AL AND CHtMT.CAL PROPERT'JKS OF SOILS--Continuea I Kap ケセ ッャ@ and IDeothiClay I Mo13t Q p ョ エケQaカセエャS ャ ャ@ So11 1Snr1nk-awell I aon name I <Z11ml bulle I I llat r I rcactl,onl pot.entlal I I I Oenut. lea aclt I I n e er.. _ll'llhr In 111 L MLM セMQ@ セMQ@ ILl ?elham I26-80il5-351L6o- L80I IO. lo-o. l3j.s-s.s IIO. P1tl> I I I I I I I I I I I I I I I I I I I I I I I I 1n ! o u.)o-t.aot 2.o-6. o Jo.o3-o. o81 il.s-6. o PlWN:I.er 16t-8o o. 6- l.o 1 o. to- O.l311t.s-s. s I I I I I I ll l o.. 6ol IO.o S- 6. o Plwnmor to.lo- O. l3 PI.S-S.S I I I I I I o- 231 <to JL25-t.liOI 6.o-2o t J Rutl ogo <Lo o-2o IO. ol!- o.o8j3. 6- s. o I I I I I I o-ttl JO. o3- o.01lli.s-5. 5 sapelo q_7 ll. $ o.6-2.o Jo.to-0. 15tt.s- s. s lt.lls to.o o 1 o o s--s. s I I I I I I l.SOI $. 0 Surrency I o s. o I I I I I I ' < ip N PR M PNP sis N VMセ M s@ TalQU1n I loi S <6 11., > I I I I I I.tiS ! l l.iis- 1.6$ IO.OS-O.lOJil.S-5. 5 Tr9YP 49. Urbal"' lan!! AP N QPMPNャ Sj q N [ M l-q.. 80I J;-)OI JO I o. 6-2.o I I I I I I I I I I I I I I I I I I I I I I I I 50, l -12ILJIO- L J LS-5.5 Wtagr n I L70 I o. 6-2.o I I I I I I I Yongea I o I I I I I I I I I I IVer)' low i lッセ M MQPNR セ Q@ I I I I I I I I I I I I IVery low S IVery ャッキセMQ P NQUQ@ I I I IVerr l ow IVery low I I I JLow $ ltow I I I ILow ILov I Low /l ILow Q PNRセQ@ I I I ILow ILow I I I ILow ILow ILov I I I IV'!'ry ]n., ILow ( I I I I I I I I I I I I ILow ILow I I I ILow ILOif ILow oo on raeeoraleroal- IOrganlc lbllittl u t ter K I I I I I I I I S I 2 I I I 1 I I see descr1pt1ol1 or the map un1t tor compoa1tton a nti beh&.v!.ot' etllaraote1'18t1os of the ttap u.n1t. 2 3 Ell <2 1- :>
! <2-0:05! P M P セ R セ @ mm}! t1v1tj! <f1elc. セ @ ba r! bar ' ' ' ' ' ' ' ' ' ' ' ' ' ' ' POlhu tl.m a.")
80 ts 69 Sdl &e('1ea ilnd trepchlllorhonl Ver-y icoaraoihodlunl F1ne I Miple numb r l I lcoarae!(l H セᄋセ Z@ Q H セ N RU M A@ 'U.BLB 17.--PM't.SlCAL PROPEiiT1!3 OP SILZC1'ED SO!LS---;ont.lnu.cl Very fino I TOEU lto:lls - 1<< oonduc- ャ ョ Q l/ 10 i 1/)! <2-0:05! P M P セ R mm}! t1v1tj! <f1elc. ba r! bar ' ' ' ' ' ' ' ' ' ' ' ' ' ' ' POlhu tl.m a.nd: I I I I I I I I I I I I I I I C771t. PGWSMP I 6-S lal I o.o I 0. 4 I 7.1 I セtNW@ I u.1 I 5 I 5.9 I 10.5 l I24,JI6. 8 YセSWPMlGャtsMR@ I 5-1ZIA21 I o.o I 1.0 I a.o I 61.3 I U.l I J.j I.,, u. I t. ). 0 #771L-07) lt2-2 11A22 I o.1 I 0.9 I 8.l I I 20.9 I I 5 9 I ).0 I 12.5 I I 6. 2 I 2.0 " ' I 7. 2 I ). 377'L ll lll-261a23 I o.o I I 57.8 I >J,O I 6. 2 I 2., I QT N I 1.61 I 8.7 I a.7 I LZ 811 /l,oo l26- )21BUt.g o.o I 0.6 I,,8 I 1 o. a 1 Q I 0.9 I S17JL r 0.22"' I 0.0 I I lila I I o.o I 32.2 I o., I 1.10 (U ェャNo N snn iセm 0 I 922t.g I o.o I 0. I I li l.ll I r. I 11.2 I I 0. 1 I 1. 7!1 l17-9 I I I A'IJ;tf I R M VセaQ@ I o.1 i 2. ) i 18. 'J i 55.1 i }II,J I i 6. 8 I ).1 I 1.0 i ]2. 0 I 30., p ャオ Q セイセ nne sand: I I I ッMIWPMlセVWsャPᄋR@ I -17 Al2 o.o I 2. 5 I I Iセ I ャ DN lo.a 6.1 I ' ' I 1 I I W N Gセᄋ Q@ 1.5 SJ6P.t.-OU :1-28 Uta I o.o I 2.1 I 21.2 I セR N P@ I 12.6 I 8.5 I 6. 3 I 5. 2 I 8.7 I I &.II I 5. I 2. 0 J16ftt-on-o1o- U8-)61A2t,: I 0.1 I 2 I 20.3 I 53.5 I I 19. I 6. 0 I 6 e. I ) 6. ) I 2. 6 S76PL 'lt60ia2ls 1 o.j I 2. 7 I 20.) I 55.9 I H.) Jl l I ' I 1.7& I 6.& ). 2 I 0. 7 SJ6rL G-6 I 611U)C I 0. 1 I 2. f I 2'0. ) I I 1]. 0 I 9. ) I 8 I 5.9 I - I I -- -I - - ST6l'L-01) i uᄋ ioixrエセ [@ I o.o I 2 " I 1J.6 I 1.8 I U.l I 19 9 I ' 5 I 15.6 I 0. 2 I l 9.7 I 5.9 I I Ru tl se 1oam1 I tlno und: s WtplNPW} M PャセM I o -5 lm i 0 1 i 5.01 i i4.j i セLNY@ i 1,., I D:;. G t I 1 S77Pt l - 2 I Al2 I 0.7 I 5.6 I" ' I ' 5.8 I 16.0 I 87. ) I 9.1 I ).6 i U:.7 i 1.31 j,,8 i 9 9 i ). 6 S77PL Cl I 0.7 I I I 1!). 11 I 89. ' I 7.o I ).6 I 11.5 I QNセV@ I IL2 I ). 0 S77'PL l.-:.. C2 I 1.1 I 6.0 I 11 5 I.8 I 15.'/ I I 5.6 I 5.5 I 1.67 I ll l I I 2. 8 SJT.PL I 1.2 I 6. 7 I I &8. 9 I 15.9 I 90.3 I 5.1 I 0.6 WPMlpSM P Q セ M V@ 1>2-821Cl I 0.9 I 5. 2 I I I 17.2 I 9). 6 I AI.O I I I ッセNs@ r1ne $&nd: I I J I 0 6 lap i 11.1 US M 1 za.o l.t 1-31 i11.1 i 6 -T I 2. \ I I JfP(,.01J.Ol8-) ' オ セ I 10. U. 7 I ;?\, ) lls. l u.s I S!I'I'L !-2 I 0-HI.U 0.2 ).0 I II i ')1 o7 I z-6, \ U 1" ' 577PL-07) ll h o.j 2.1 I L 1.] so.o I er.' ' ' r.s,, l I PL-073-0l 8- S U2-261Bl I J , I ' l,.z I 2:.4 UWQL セ P W SMPQX M V@ 126-3JI0' J,S I Q N gz.o s &.2 QM セ Y@ ll. 8.9 I L m- ou 22 o. ).7 1 オ N 1& l. L 5.6 ). ] 8. 1.$1 Q RP N 14.8 I 4.) WsQ セ P ts M PQX MX@ QP M ᄋ S A '22 o.) ).0 1 u.e!)0.6 2J. AI ' ' S I J, ) S71FL-073-ota '2tg o. ).1 QR N QY 6.0 セ M R@ 0. ) 1.1: I 6.0 I I I 'AJ..UUJl 01-n aanu: I I I ST1PL J- l I O loiap o.o I 1.! o. u.s 1.)8 I s.s ).5 I 1.9 S71FL SIA2 o.o I 0. 2 I 1.) I a o. s I I 7. 9 ).5 I 1.5 S71PL Nlb o.o I 0. 2 I 1.; I : I , 9. ) I 2.1 ST1rt t 121-MIIUb 0.0 I 0. 2 I L ) I 511. $ & I ) 11) I 1.1: STirt.-013-o IC o.o I 0. ) I l.s I o. 6 o. 7 I I 9. 9.o I 0. 9 I I I I I I I I I I I I I I I I i 15 I bar r 8, g, c セ - <>.,
81 APPENDIX D SAMPLE CALCULATIONS - MODRET (MODRET) 70
82 71
83 72
84 73
85 74
86 75
87 76
88 MOD RET TIME RUNOFF INPUT DATA PROJECT NAME: STORMWATER POND - FALUNG HEAD RESULTS I STRESS INCREMENT VOLUME PERIOD OF TIME OF RUNOFF NUMBEIR (hrs) (ft3) Unsat 5.7() , o.oo o.oo il.oo il.oo 77
89 78
90 79

91 80
92 81
93 82
94 83
95 INFILTRATION: STROMWATER POND- DOUBLE RING ANALYSIS ' ' ' セ I J Time (hrs) Total Volume Infiltrated = 954 ft3
96 85
97 @ セPNRU SUMMARY OF UNSATURATED & SATURATED IN PUT PARAMETERS PROJECT NAME : Stormwater Pond Single Ring Field Test IPOLLUTION VOLUME RUNOFF DATA US!ED 1UNSATIJRATED ANALYSIS INCLUDED Pond Bottom Area Pond VDiume between Bottom & DHWL Pond Length to Width Ratio (1./W) Elevation of Effective Aquifer Base Elevatloo of Seasonal High GroundWater Tallie tle'vatloo or :otartlng water Level Elevotlan of Pond Dottom Design High Woter Level Elavatlon Avg. EITective Storage CO'effldent or 5(111 ror AAAiv<l Unsaturated Vertical Hydraulic Conductivity Factor of Safety Saturated Horizontal Hydraulic Conductivity Avg. Eff'ectllle Storage Coefficient of Soli ror Saturated Analysis Avg. Effective Storage Coefficient of Pond/Exfiltratlon Trench 1, tt 2,, ft' It T セNAZ^ u@ ft \ ft ft/d :/d Hydraulic Control Features: Top Bottom Lo:ft REght Groundwater control Fe atu""" Y /N Distance to Edge of Pond Elevarion or water Level Impervious Barrier- Y /N EJevaUon ot Barrier Bottom N N o.oo o.oo 0.00 N N 0.00 o.oo 0.00 " o.oo o.oo N N 0.00 I 86
98 87
 00.00-0.00 49.500 0.000. 0.00 49.500 0.06294 4.66 53.116 0.01716 7.08 53.090 0.00574 9.49 53.059 0.00661 11.91 53.024 0.00734 14.33 52.986 0.00785 16.75 52.946 0.00812 19.")
99 MOD RET SUMMARY OF RESULTS I PROJECT NAME : Stormwater Pond- Single Ring Field Testl CUMULAllVE WATER INSTANTANEOUS TIME ELEVATION INFILTRATION (hrs) (feet) RATE (cfs) AVERAGE INFILTRATION RATE (cfs) CUMULATIVE OVERFLOW (ftl) Maximum Water Elevation: feet hours Time Increment when there is no runoff Maximum Infiltration Rate: 1.9n ft/day Recovery C!l > hours 88

100 INFILTRATION : STORMWATER POND-SINGLE RING FIELD TEST -* _,.. ' '- 89 f セ "' ".. E ::1.g Time (hrs) Total V olume lnfinrated = 1,180 ft"
101 90
102 APPENDIX E EXCEL COMPUTER PRINTOUTS 91

103 @ セ GRAPHICAL REPRESENTATION OF PORE WATER PRESSURE UNDER A DOULBE RING INFILTROMETER 92 1""" <0._ <D._ <0 - N N M セ <D "' <D "' co セ "- <0 "- "" <0 セ PORE W/\TER PRESSURE (LES/J:Tl)

104 93 ) L I 2.6 t I ' < 26.6 la , 2$.7 2S.S 2( !" lb ,. 2 u.s L &.6 2<1. 3 2'3.3 2 '3.4 2 '3.4 2' _ , l S 27., D R セ N W@ ) ! J).3 3( > '3.4 2' '3.4 l_,_, 2'3.4 2< f &.4 _ 27.8 " i , 27.S '.s ;.9 2E U 2E セ T N T@ 312 3l :6.8 2&.8 za :,,, 2,.4 2,.1 ;:ss ! la.e RTN 27.: S.; 2S.S L ' s.ss S t 9.1 IL tl > : > l E , H 232 2> US "\S 1S.? l,.g : 2:0.G 2:1) :2.) 2:2S 2;2:,,(. 1: :2k 22.-t 2;2:,.2. 2LS. 21 1!).0 1G.l 1?.1 1G 1-4,-, "1.),, , : ! U S U.S ! l.L ! ! !9.3 U B !" <J.8 2C U.S H , u.5 2C U <J.1 2C U E b セ N O@ lb.:! lb./ 1/.:1. 1/.b 1ll U.4 :US./ H Qセ N[Q@ Qセ N Qセ ャNセ N O@!!I.IS l::j,is Qセ N Qs@ Qセ NO@ Qセ ャNセ N Q N セ N Q Ill./ Q セN[Q@ 1 1.!1 QO N 1/.1 1b.t 1b.1 Qセ 2FT ID ID ID ID ID ID ID ID ID N N M M W W ro 00 m m
105 94

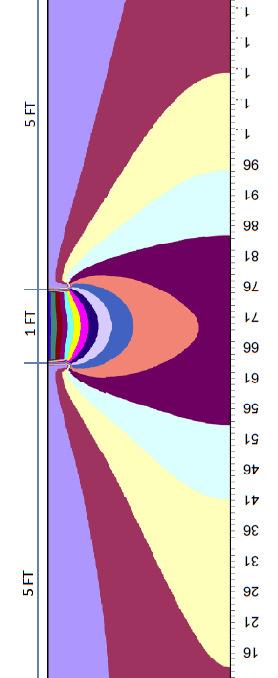

106 95
Determination of Design Infiltration Rates for the Sizing of Infiltration based Green Infrastructure Facilities
 Determination of Design Infiltration Rates for the Sizing of Infiltration based Green Infrastructure Facilities 1 Introduction This document, developed by the San Francisco Public Utilities Commission
August 15, 2006 (Revised) July 3, 2006 Project No A
 July 3, 2006 Project No A") August 15, 2006 (Revised) July 3, 2006 Project No. 01-05-0854-101A Mr. David Reed, P.E. Protean Design Group 100 East Pine Street, Suite 306 Orlando, Florida 32801 Preliminary Soil Survey Report Polk Parkway
August 15, 2006 (Revised) July 3, 2006 Project No. 01-05-0854-101A Mr. David Reed, P.E. Protean Design Group 100 East Pine Street, Suite 306 Orlando, Florida 32801 Preliminary Soil Survey Report Polk Parkway
POROSITY, SPECIFIC YIELD & SPECIFIC RETENTION. Physical properties of
 POROSITY, SPECIFIC YIELD & SPECIFIC RETENTION Porosity is the the ratio of the voids to the total volume of an unconsolidated or consolidated material. Physical properties of n = porosity as a decimal
STORMWATER MANAGEMENT. 158 Attachment 2. Borough of Perkasie
 158 Attachment 2 Borough of Perkasie Appendix B Site Soil Evaluation and Soil Infiltration Testing Source: Pennsylvania Stormwater Best Management Practice Manual, December 2006. SITE SOIL EVALUATION AND
Lecture 20: Groundwater Introduction
 Lecture 20: Groundwater Introduction Key Questions for Groundwater 1. What is an aquifer? 2. What is an unconfined aquifer? 3. What is groundwater recharge? 4. What is porosity? What determines the magnitude
SITE INVESTIGATION. Foundation Engineering
 SITE INVESTIGATION Assist. Prof. Berrak TEYMUR Foundation Engineering Analysis Design Construction As a foundation engineer, you need to consider geotechnical/structural issues (involves geology, subsurface
April 7, Webster Street Sub-Surface Stormwater Storage System Bid No Bid Date: 4/13/17 ADDENDUM NO 1
 PUBLIC WORKS DEPARTMENT David A. Jones, P.E., Director April 7, 2017 Webster Street Sub-Surface Stormwater Storage System Bid No. 2017-022 Bid Date: 4/13/17 ADDENDUM NO 1 Please make the following changes
East Maui Watershed Partnership Adapted from Utah State University and University of Wisconsin Ground Water Project Ages 7 th -Adult
 INTRODUCTION What is groundwater? Water contained in saturated soil and rock materials below the surface of the earth. It is not NEW water, but is recycled water through the hydraulic cycle. The source
Typical Subsurface Profile. November 28, 2016
 November 28, 2016 RSCCD Facility Planning, District Construction and Support Services 2323 N. Broadway, Suite 112, Santa Ana, CA 92706 Attn: Re: Ms. Allison Coburn Facilities Project Manager P: (714) 480-7530
SOURCES OF WATER SUPPLY GROUND WATER HYDRAULICS
 SOURCES OF WATER SUPPLY GROUND WATER HYDRAULICS, Zerihun Alemayehu GROUNDWATER Groundwater takes 0.6% of the total water in the hydrosphere 0.31% of the total water in the hydrosphere has depth less than
Issue paper: Aquifer Water Balance
 Issue paper: Aquifer Water Balance 1. Introduction And Background 1.1. Purpose and Scope The population in Kitsap County has grown rapidly in recent years and is expected to increase substantially in the
Estimating K sat for Infiltration Assessment WSDOT Approach
 Estimating K sat for Infiltration Assessment WSDOT Approach TONY ALLEN, State Geotechnical Engineer May 16, 2017 Presentation Overview Infiltration rate estimation concepts Advantages and disadvantages
URBAN FLOODING: HEC-HMS
 1.0 Introduction URBAN FLOODING: HEC-HMS -Sunil Kumar, Director, NWA All major ancient civilisations were developed in the river valleys because river served as source of water, food, transportation and
Estimating the Seasonal High Water Table: A Mix of Art & Science
 Estimating the Seasonal High Water Table: A Mix of Art & Science PONDS WORKSHOP - SJRWMD Devo Seereeram, Ph.D., P.E. This paper was originally written over 4 years ago & generated a lot of interest. The
Water Budget IV: Soil Water Processes P = Q + ET + G + ΔS
 Water Budget IV: Soil Water Processes P = Q + ET + G + ΔS Infiltration Infiltration capacity: The maximum rate at which water can enter soil. Infiltration capacity curve: A graph showing the time-variation
DRAINAGE DESIGN AND RUTTING PERFORMANACE GUIDELINES FOR PERMEABLE PAVEMENT
 DRAINAGE DESIGN AND RUTTING PERFORMANACE GUIDELINES FOR PERMEABLE PAVEMENT by Su Ling Cao Daryl Poduska Graduate Assistants Dan G. Zollinger Associate Professor Sponsored by The Uni-Group U.S.A. The Department
Effect of the Underlying Groundwater System on the Rate of Infiltration of Stormwater Infiltration Structures.
 Effect of the Underlying Groundwater System on the Rate of Infiltration of Stormwater Infiltration Structures. Presented at: Storm Water Infiltration & Groundwater Recharge A Conference on Reducing Runoff
9. SOIL PERMEABILITY. 9.0 Why is it important to determine soil permeability?
 9. SOIL PERMEABILITY 9.0 Why is it important to determine soil permeability? Soil permeability is the property of the soil to transmit water and air and is one of the most important qualities to consider
Infiltration Testing For Stormwater BMPs: What Would Mickey Mouse Do?
 Infiltration Testing For Stormwater BMPs: What Would Mickey Mouse Do? CCLC Turning A New Leaf November 3, 2017 David J. Hirschman Hirschman Water & Environment, LLC www.hirschmanwater.com dave@hirschmanwater.com
Impact of Compaction State and Initial Moisture on Infiltration Characteristic of Soil
 American Journal of Water Science and Engineering 2015; 1(1): 1-6 Published online September 15, 2015 (http://www.sciencepublishinggroup.com/j/ajwse) doi: 10.11648/j.ajwse.20150101.11 Impact of Compaction
6.0 Runoff. 6.1 Introduction. 6.2 Flood Control Design Runoff
 October 2003, Revised February 2005 Chapter 6.0, Runoff Page 1 6.1 Introduction 6.0 Runoff The timing, peak rates of discharge, and volume of stormwater runoff are the primary considerations in the design
Index. Page numbers followed by f indicate figures.
 Index Aerodynamic method, 103, 110 111 Algae, 131, 173, 175 Alternate depth, 88 Alternating block method, 132, 140 141 Attenuation, 106, 107f, 118, 120 Page numbers followed by f indicate figures. Baseflow
Estimating Streambed and Aquifer Parameters from a Stream/Aquifer Analysis Test
 Hydrology Days 2003, 68-79 Estimating Streambed and Aquifer Parameters from a Stream/Aquifer Analysis Test Garey Fox 1 Ph.D. Candidate, Water Resources, Hydrologic, and Environmental Sciences Division,
Lift irrigation Using man or Animal power Using Mechanical or Electrical Power Flow irrigation a)inundation Irrigation b) Perennial Irrigation Direct
inundation Irrigation b) Perennial Irrigation Direct") Lift irrigation Using man or Animal power Using Mechanical or Electrical Power Flow irrigation a)inundation Irrigation b) Perennial Irrigation Direct irrigation Storage irrigation a)flow irrigation system:
Lift irrigation Using man or Animal power Using Mechanical or Electrical Power Flow irrigation a)inundation Irrigation b) Perennial Irrigation Direct irrigation Storage irrigation a)flow irrigation system:
In preparation for constructing buildings on a property, the builder. Site Preparation CHAPTER
 CHAPTER 3 Site Preparation In preparation for constructing buildings on a property, the builder must consider a number of factors related to code requirements. The buildings must be located according to
Learning objectives. Upon successful completion of this lecture, the participants will be able to:
 Solomon Seyoum Learning objectives Upon successful completion of this lecture, the participants will be able to: Describe and perform the required step for designing sewer system networks Outline Design
November 13, IP3406. Mr. Uriah Sowell Rooney Engineering 115 Inverness Drive East, Suite 300, Englewood, CO 80112
 November 13, 2015 103IP3406 Mr. Uriah Sowell Rooney Engineering 115 Inverness Drive East, Suite 300, Englewood, CO 80112 Subject: Infiltration Testing Hopeland Road Valve Site Sunoco Pennsylvania Pipeline
Stormwater Standards. Clackamas County Service District No. 1. Infiltration Testing Guide
 Stormwater Standards Clackamas County Service District No. 1 APPENDIX E Infiltration Testing Guide Table of Contents Appendix E - Infiltration Testing Guide... Page E.1 General... 1 E.2 Basic Method -
EFFECTIVENESS OF UNSATURATED DRAINAGE LAYER IN WATER DIVERSION UNDER DIFFERENT RAINFALL CONDITIONS
 G2 EFFECTIVENESS OF UNSATURATED DRAINAGE LAYER IN WATER DIVERSION UNDER DIFFERENT RAINFALL CONDITIONS Gambo Haruna Yunusa 1, Azman Kassim 2* Nurly Gofar 3 1,2,3 Department of Geotechnics and Transportation,
Design Guideline for Gravity Systems in Soil Type 1. January 2009
 Design Guideline for Gravity Systems in Soil Type 1 January 2009 This page is intentionally blank. Design Guideline for Gravity Systems in Soil Type 1 January 2009 For information or additional copies
The Borehole Permeameter Approach for Stormwater Infiltration Testing
 The Borehole Permeameter Approach for Stormwater Infiltration Testing AWRA National Conference J. Scott Kindred, PE Kindred Hydro, Inc. November 9, 2017 Topics Covered Borehole permeameter (BP) equation
PE Exam Review - Geotechnical
 PE Exam Review - Geotechnical Resources and Visual Aids Item Page I. Glossary... 11 II. Parameters... 9 III. Equations....11 IV. Tables, Charts & Diagrams... 14 1. Module 1 - Soil Classification... 14
SEWER SYSTEM DESIGN GUIDELINES
 SEWER SYSTEM DESIGN GUIDELINES PART 1 GENERAL 1.1 GENERAL GUIDELINES A. The following sewer system design guidelines are based on Federal, State and Local health requirements, and the Berkeley County Water
November 13, IP3406. Mr. Uriah Sowell Rooney Engineering 115 Inverness Drive East, Suite 300, Englewood, CO 80112
 November 13, 2015 103IP3406 Mr. Uriah Sowell Rooney Engineering 115 Inverness Drive East, Suite 300, Englewood, CO 80112 Subject: Infiltration Testing Gates Road Valve Site Sunoco Pennsylvania Pipeline
GEOTECHNICAL & SOILS LABORATORY PERMEABILITY TEST : CONSTANT HEAD & FALLING HEAD
 GEOTECHNICAL & SOILS LABORATORY PERMEABILITY TEST : CONSTANT HEAD & FALLING HEAD N.B. You are required to keep a full copy of your submission for this laboratory report. Submitted laboratory reports are
NGWA s Water Well Construction Standard: ANSI/NGWA 01-14
 NGWA s Water Well Construction Standard: ANSI/NGWA 01-14 NGWA Standard Development Process as Approved by ANSI What is ANSI? The American National Standards Institute (ANSI), founded in 1918, promotes
Research on Seepage Characteristics of Asphalt Pavement Structure
 Research on Seepage Characteristics of Asphalt Pavement Structure SHEN Weijun 1, LIU Jianjun 2 1. Haijian Urban and Rural Planning & Design Institute of Zhanjiang CO., LTD, China, 524000 2. School of Civil
Chapter 11 Compressibility of Soil
 Page 11 1 Chapter 11 Compressibility of Soil 1. The compression of soil layers as a result of foundation or other loadings is caused by (a) deformation of soil particles. (b) relocation of soil particles.
The following sections provide the approved standard infiltration testing specifications.
 APPENDIX F.2 INFILTRATION TESTING To properly size and locate stormwater management facilities, it is necessary to characterize the soil infiltration conditions at the location of the proposed facility.
This document downloaded from vulcanhammer.net vulcanhammer.info Chet Aero Marine
 This document downloaded from vulcanhammer.net vulcanhammer.info Chet Aero Marine Don t forget to visit our companion site http://www.vulcanhammer.org Use subject to the terms and conditions of the respective
is a possibility of the existence of permafrost as a result
 111.2 CERTAIN ASPECTS OF ALASKA DISTRICT ENGINEERS EXPERIENCE IN AREAS OF MARGINAL PERMAFROST E. L. Long In nearly twenty years of engineering and construction experience in Alaska, the Alaska District
AN EXPERIMENTAL STUDY OF THE OPTIMAL THICKNESS OF A SAND LAYER IN A SAND FILTER WATER QUALITY STRUCTURE. July 1994
 DC WRRC Report No. 178 AN EXPERIMENTAL STUDY OF THE OPTIMAL THICKNESS OF A SAND LAYER IN A SAND FILTER WATER QUALITY STRUCTURE July 1994 D.C. Water Resources Research Center University of the District
Applied GeoScience, Inc Hammond Dr., Suite 6 Schaumburg, Illinois
 AGI Project No. 13-109B Subsurface Investigation Report For the Proposed Roosevelt Middle School Site Improvements 7560 Oak Avenue River Forest, Illinois Prepared for Mr. Jerry Pilipowicz Terra Engineering,
Experimental Study on Infiltration in Guwahati Using Double Ring Infiltrometer
 Experimental Study on Infiltration in Guwahati Using Double Ring Infiltrometer Gayatri Das 1, Mimi Das Saikia 2 M.Tech Student, Department of Civil Engineering, Assam down town University, Panikhaiti,
STRUCTURAL AND HYDROLOGICAL DESIGN OF PERMEABLE PAVEMENTS
 STRUCTURAL AND HYDROLOGICAL DESIGN OF PERMEABLE PAVEMENTS David K. Hein, P.Eng. Vice-President, Transportation dhein@ara.com D.J. Swan, P.Eng. and Lori Schaus, P.Eng. Senior Engineer and Project Engineer
PROJECT NO A. ISSUED: February 29, 2016
 INTERPRETIVE REPORT FOR INFILTRATION SYSTEM DESIGN, PROPOSED VILLA VERONA APARTMENT COMMUNITY, ASSESSOR S PARCEL NUMBERS 311-040-015, 311-040-021, 311-040-024, 311-040-026 AND 311-040-013, LOCATED ON THE
Groundwater Balance Study in the High Barind, Bangladesh. A.H.M.Selim Reza 1, Quamrul Hasan Mazumder 1 and Mushfique Ahmed 1
 Rajshahi University J. of Sci. 39, 11-26 (2011) ISSN 1681-0708 Groundwater Balance Study in the High Barind, Bangladesh A.H.M.Selim Reza 1, Quamrul Hasan Mazumder 1 and Mushfique Ahmed 1 1 Department of
TURF-TEC 6 and 12 INCH INFILTRATION RINGS INSTRUCTIONS (IN7-W & IN8-W)
") TURF-TEC 6 and 12 INCH INFILTRATION RINGS INSTRUCTIONS (IN7-W & IN8-W) Outline of Uses The Turf-Tec Infiltration Rings was specifically designed to give infiltration readings directly on site. It can give
TURF-TEC 6 and 12 INCH INFILTRATION RINGS INSTRUCTIONS (IN7-W & IN8-W) Outline of Uses The Turf-Tec Infiltration Rings was specifically designed to give infiltration readings directly on site. It can give
Please include this addendum in your Bid proposal for the above referenced project. Questions are in black ink, and the answers are in red ink.
 JAHarchitects, LLC PROJECT NO. 393 RIVERCREST CDD 11560 RAMBLE CREEK DRIVE, RIVERVIEW FL ADDENDUM TO BID PROJECT: RIVERCREST CDD MULTI PURPOSE FIELD MAINTENANCE BUILDING & DOG PARK POOL & CABANNA JAH PROJECT
Evaluation of cover soil properties of solid waste dumpsites in Colombo District, Sri Lanka
 J.Natn.Sci.Foundation Sri Lanka 2015 43 (2):189-194 DOI: http://dx.doi.org/10.4038/jnsfsr.v43i2.7946 RESEARCH ARTICLE Evaluation of cover soil properties of solid waste dumpsites in Colombo District, Sri
SPECIFICATIONS FOR PRECAST MODULAR BLOCK RETAINING WALL SYSTEM (revised 5/8/7)
") Page 1 of 7 STONE STRONG SYSTEMS SPECIFICATIONS FOR PRECAST MODULAR BLOCK RETAINING WALL SYSTEM (revised 5/8/7) PART 1: GENERAL 1.01 Description A. Work includes furnishing and installing precast modular
Page 1 of 7 STONE STRONG SYSTEMS SPECIFICATIONS FOR PRECAST MODULAR BLOCK RETAINING WALL SYSTEM (revised 5/8/7) PART 1: GENERAL 1.01 Description A. Work includes furnishing and installing precast modular
The Effect of Surface Texture on Evaporation, Infiltration and Storage Properties of Paved Surfaces
 The Effect of Surface Texture on Evaporation, Infiltration and Storage Properties of Paved Surfaces M. Mansell* and F. Rollet School of Engineering and Science, University of the West of Scotland, Paisley
GRAY WATER RECYCLING SYSTEMS
 GRAY WATER RECYCLING SYSTEMS Note: Section P2601.2 of the International Residential Code requires all plumbing fixtures that receive water or waste to discharge to the sanitary drainage system of the structure.
Subsurface Investigations PDCA Professor s Driven Pile Institute. Loren R. Anderson Utah State University June 25, 2015
 Subsurface Investigations PDCA Professor s Driven Pile Institute Loren R. Anderson Utah State University June 25, 2015 Ralph B. Peck (1962) Subsurface engineering is an art; soil mechanics is an engineering
Infiltration Guidelines
 Appendix E Infiltration Guidelines As a stormwater management method, infiltration means retaining or detaining water within soils to reduce runoff. Infiltration can be a cost-effective method to manage
DISPERSIVE SOILS. Dispersive soils are those in which the clay content has a high percentage of sodium.
 DISPERSIVE SOILS Dispersive soils are those in which the clay content has a high percentage of sodium. This clay fraction readily breaks down to form a suspension in water. 1 Some types of clay minerals
Tillage and Crop Residue Removal Effects on Evaporation, Irrigation Requirements, and Yield
 Proceedings of the 24 st Annual Central Plains Irrigation Conference, Colby, Kansas, February 21-22, 2012 Available from CPIA, 760 N.Thompson, Colby, Kansas Tillage and Crop Residue Removal Effects on
8.4.2 Steady flow: Hooghoudt equation
 8.4.2 Steady flow: Hooghoudt equation As explained in Section 1.1, steady flow does not,. in reality, occur. At the end of tail recession, however, because of a small amount of seepage, the flow of some
Permeability Tests. Geotechnical Engineering, Laboratory 7
 1. General Notes Permeability Tests Geotechnical Engineering, Laboratory 7 Be prepared to get wet. All stations, benches, and tables must be cleaned before your group leaves the lab. Please clean all glassware
REPORT OF SUBSURFACE EXPLORATION AND GEOTECHNICAL ENGINEERING SERVICES
 REPORT OF SUBSURFACE EXPLORATION AND GEOTECHNICAL ENGINEERING SERVICES Addendum No.1 5 th Bay Ocean View Norfolk, Virginia G E T Project No: VB15-342G November 18, 2016 PREPARED FOR: 204 Grayson Road Virginia
Subsurface Investigation Report. Proposed New 1-Story Building 6447 Grand Avenue Gurnee, Illinois
 AGI Project No. -11 Subsurface Investigation Report For the Proposed New 1-Story Building 6447 Grand Avenue Gurnee, Illinois Prepared for Mr. Steve Panko Key Development Partners, LLC North State Street,
EES 1001 Lab 9 Groundwater
 EES 1001 Lab 9 Groundwater Water that seeps into the ground, and is pulled down by gravity through void spaces (*see below) in the soil and bedrock eventually percolates down to a saturated zone, a water-logged
PRACTICE NOTE 1: In Situ Measurement of Hydraulic Conductivity
 CONDITION ASSESSMENT AND PERFORMANCE EVALUATION OF BIORETENTION SYSTEMS PRACTICE NOTE 1: In Situ Measurement of Hydraulic Conductivity Belinda Hatt, Sebastien Le Coustumer April 2008 The Facility for Advancing
This report presents the findings of the subsurface exploration concerning the design of the taxiway rehabilitation. Description
 September 22, 2016 American Infrastructure Development, Inc. 3810 Northdale Boulevard, Suite 170 Tampa, Florida 33624 Attn: Mr. Mohsen Mohammadi, Ph.D., P.E. Senior Consultant Mob: (813) 244-6609 E-mail:
Chapter A-9 GEOTECHNICAL ANALYSIS NORTH KANSAS CITY - LOWER (HARLEM AREA)
") Kansas Citys, Missouri and Kansas Flood Damage Reduction Feasibility Study (Section 216 Review of Completed Civil Works Projects) Engineering Appendix to the Interim Feasibility Report Chapter A-9 GEOTECHNICAL
Kansas Citys, Missouri and Kansas Flood Damage Reduction Feasibility Study (Section 216 Review of Completed Civil Works Projects) Engineering Appendix to the Interim Feasibility Report Chapter A-9 GEOTECHNICAL
Numerical Modeling of Slab-On-Grade Foundations
 Numerical Modeling of Slab-On-Grade Foundations M. D. Fredlund 1, J. R. Stianson 2, D. G. Fredlund 3, H. Vu 4, and R. C. Thode 5 1 SoilVision Systems Ltd., 2109 McKinnon Ave S., Saskatoon, SK S7J 1N3;
Ponds. Pond A water impoundment made by excavating a pit, or constructing a dam or an embankment.
 POND SITE SELECTION AND CONSTRUCTION Uses, Planning, & Design David Krietemeyer Area Engineer USDA-NRCS June 20, 2008 Uses Considerations for Location of Commonly Used Terms Pond A water impoundment made
UNIT HYDROGRAPH AND EFFECTIVE RAINFALL S INFLUENCE OVER THE STORM RUNOFF HYDROGRAPH
 UNIT HYDROGRAPH AND EFFECTIVE RAINFALL S INFLUENCE OVER THE STORM RUNOFF HYDROGRAPH INTRODUCTION Water is a common chemical substance essential for the existence of life and exhibits many notable and unique
Rainwater Harvesting for Irrigation
 Rainwater Harvesting for Irrigation Dotty Woodson, Water Resources Specialist Texas A&M AgriLife Extension d-woodson@tamu.edu Abstract. Many are looking for an affordable alternative water source for landscape
SPECIAL CONDITIONS FOR PIPE JACKING (PJ) October, 2006
 October, 2006") Michigan Department Of Transportation 3703C (11/06) 1 Materials 1.1 Pipe SPECIAL CONDITIONS FOR PIPE JACKING (PJ) October, 2006 Page 1 of 5 The type of pipe used for the pipe jacking method shall be capable
Michigan Department Of Transportation 3703C (11/06) 1 Materials 1.1 Pipe SPECIAL CONDITIONS FOR PIPE JACKING (PJ) October, 2006 Page 1 of 5 The type of pipe used for the pipe jacking method shall be capable
Geotechnical Engineering Report
 Geotechnical Engineering Report Turner Turnpike Widening Milepost 210 to 218 Drainage Structure Pipe Jacking Creek County, Oklahoma July 1, 2016 Terracon Project No. 04165017 Prepared for: Benham Tulsa,
Scientific registration n : 1368 Symposium n : 3 Presentation : poster. HASEGAWA Shuichi
 Scientific registration n : 1368 Symposium n : 3 Presentation : poster Rainfall infiltration into a volcanic ash soil and soil water flux at 1-m depth Infiltration de la pluie dans un sol cendreux volcanique
August 17, DCN Number: ALB07WP001 Revision: 0. Prepared By: 8300 Jefferson NE Suite B Albuquerque, New Mexico 87113
 WORK PLAN ENERGY FUELS RESOURCE CORPORATION URANIUM MILL LICENSING SUPPORT PHASE 1 GEOTECHNICAL INVESTIGATION KLEINFELDER PROJECT NO. 83088 August 17, 2007 DCN Number: 83088.1.4.2-ALB07WP001 Revision:
Mr. Michael Malone CPS Energy 145 Navarro Street San Antonio, Texas Project No
 Environmental Resources Management January 13, 2017 Mr. Michael Malone 145 Navarro Street San Antonio, Texas 78205 Project No. 0352436 CityCentre Four 840 West Sam Houston Parkway North, Suite 600 Houston,
Soil Permeability Demonstration
 Soil Permeability Demonstration Grade Level: 6-12 Subject Area: Soil science, Aquaculture Time: This will take one hour to drill holes in the bucket and acquire the various soils. This will take one hour
Design of a passive hydraulic containment system using FEFLOW modelling
 Design of a passive hydraulic containment system using FEFLOW modelling Rémi Vigouroux remi.vigouroux@arteliagroup.com Florence Lenhardt florence.lenhardt@arteliagroup.com Noëlle Doucet noelle.doucet@arteliagroup.com
APPENDIX G HYDRAULIC GRADE LINE
 Storm Drainage 13-G-1 APPENDIX G HYDRAULIC GRADE LINE 1.0 Introduction The hydraulic grade line is used to aid the designer in determining the acceptability of a proposed or evaluation of an existing storm
HEAP CHARACTERIZATION AND MONITORING WITH ELECTRICAL RESISTIVITY FOR OPTIMIZING SECONDARY LEACHING
 HEAP CHARACTERIZATION AND MONITORING WITH ELECTRICAL RESISTIVITY FOR OPTIMIZING SECONDARY LEACHING Dale RUCKER and Jim FINK hydrogeophysics, Inc., USA ABSTRACT Electrical resistivity geophysics has been
Curriculum Guide to the Sand Tank Groundwater Model
 Curriculum Guide to the Sand Tank Groundwater Model By: Don Lane WV Conservation Agency Figure 1 Components of the Model Note: Do not use the injection wells. Liquid placed in the wells takes too long
Stream Reaches and Hydrologic Units
 Chapter United States 6 Department of Agriculture Natural Resources Conservation Service Chapter 6 Stream Reaches and Hydrologic Units Rain clouds Cloud formation Precipitation Surface runoff Evaporation
Applied GeoScience, Inc Hammond Dr., Suite 6 Schaumburg, Illinois
 AGI Project No. 13-276 Subsurface Investigation Report For the Proposed New Retail Center 9601 South Pulaski Road Evergreen Park, Illinois Prepared for Mr. Feras Sweis FHS Design + Build LLC 2010 West
Hydrology and Water Management. Dr. Mujahid Khan, UET Peshawar
 Hydrology and Water Management Dr. Mujahid Khan, UET Peshawar Course Outline Hydrologic Cycle and its Processes Water Balance Approach Estimation and Analysis of Precipitation Data Infiltration and Runoff
BMP #: Infiltration Basin
 Structural BMP Criteria BMP #: Infiltration Basin An Infiltration Basin is a shallow impoundment that stores and infiltrates runoff over a level, subtle, uncompacted, (preferably undisturbed area) with
CHAPTER 6 COLLECTION SYSTEM HYDRAULIC MODEL
 CHAPTER 6 COLLECTION SYSTEM HYDRAULIC MODEL INTRODUCTION The District developed a hydraulic model of the sanitary sewer system as part the 2000 Wastewater Comprehensive Plan. The output from this model
The Islamic University of Gaza- Civil Engineering Department Sanitary Engineering- ECIV 4325 L5. Storm water Management
 The Islamic University of Gaza- Civil Engineering Department Sanitary Engineering- ECIV 4325 L5. Storm water Management Husam Al-Najar Storm water management : Collection System Design principles The Objectives
Standard Test Method for Permeability of Granular Soils (Constant Head) 1
 1") Designation: D 2434 68 (Reapproved 2000) Standard Test Method for Permeability of Granular Soils (Constant Head) 1 This standard is issued under the fixed designation D 2434; the number immediately following
Designation: D 2434 68 (Reapproved 2000) Standard Test Method for Permeability of Granular Soils (Constant Head) 1 This standard is issued under the fixed designation D 2434; the number immediately following
PERVIOUS PAVEMENT. Alternative Names: Permeable Pavement, Porous Concrete, Porous Pavers
 4.1-a PERVIOUS PAVEMENT Alternative Names: Permeable Pavement, Porous Concrete, Porous Pavers DESCRIPTION Pervious pavement is any system comprised of a load bearing surface that allows for movement of
LANDFILL CLOSURE PLAN ENTERGY ARKANSAS, INC. INDEPENDENCE PLANT CLASS 3N CCR LANDFILL PERMIT NO S3N-R2 AFIN
 LANDFILL CLOSURE PLAN ENTERGY ARKANSAS, INC. INDEPENDENCE PLANT CLASS 3N CCR LANDFILL PERMIT NO. 0200-S3N-R2 AFIN 32-00042 OCTOBER 12, 2016 LANDFILL CLOSURE PLAN ENTERGY ARKANSAS, INC. INDEPENDENCE PLANT
Pennsylvania Stormwater Best Management Practices Manual. Chapter 3. Stormwater Management Principles and Recommended Control Guidelines
 Pennsylvania Stormwater Best Management Practices Manual Chapter 3 Stormwater Management Principles and Recommended Control Guidelines 363-0300-002 / December 30, 2006 Chapter 3 Stormwater Management Principles
LAYING IBSTOCK CLAY PAVERS FOR PERMEABLE PAVEMENTS
 PERMEABLE PAVEMENTS (SUDS) This leaflet highlights the basic requirements for laying Ibstock clay pavers to form a permeable pavement. Ibstock clay pavers are intended for domestic use only i.e. patios
Electrical Conductivity & Hydraulic Profiling. The Combining of Two Subsurface Investigation Methods (With More to Come)
") Electrical Conductivity & Hydraulic Profiling The Combining of Two Subsurface Investigation Methods (With More to Come) How has field work been progressing? Split Spoon and Standard Penetration Testing
Electrical Conductivity & Hydraulic Profiling The Combining of Two Subsurface Investigation Methods (With More to Come) How has field work been progressing? Split Spoon and Standard Penetration Testing
Runoff Volume: The Importance of Land Cover
 Runoff Volume: The Importance of Land Cover Grade Level: 9-12 Time: 1-2 class periods Learning Objectives: - Quantify the volume of water that runs off different land uses in a watershed. - Analyze the
Study of Various Techniques for Improving Weak and Compressible Clay Soil under a High Earth Embankment
 MATEC Web of Conferences 11, 03006 ( 2014) DOI: 10.1051/ matecconf/ 20141103006 C Owned by the authors, published by EDP Sciences, 2014 Study of Various Techniques for Improving Weak and Compressible Clay
OPERATING CONTROLLED DRAINAGE AND SUBIRRIGATION SYSTEMS
 OPERATING CONTROLLED DRAINAGE AND SUBIRRIGATION SYSTEMS Prepared by: Robert Evans, Extension Specialist and Wayne Skaggs,William Neal Reynolds Professor Department of Biological and Agricultural Engineering
Hydrologic Soil Group Knowledge Matrix
 Hydrologic Soil Group Knowledge Matrix Refinement Of Soils Parameter For MPCA s Minimum Impact Design Standards Calculator and Stand-Alone Hydrologic Soil Group Determination Funding for this project was
CHAPTER 2. Objectives of Groundwater Modelling
 CHAPTER 2 Objectives of Groundwater Modelling In the last two decades mathematical modelling techniques have increasingly proved their value in furthering the understanding of groundwater systems and,
Freshwater. 260 Points Total
 9 SURFACE WATER SECTION 9.1 Surface Water Movement In your textbook, read about surface water and the way in which it moves sediment. Complete each statement. (13 points) 1. An excessive amount of water
SECTION RIPRAP, BOULDERS, AND BEDDING
 SECTION 31 37 00 RIPRAP, BOULDERS, AND BEDDING PART 1 GENERAL 1.01 SECTION INCLUDES A. The WORK includes excavation, grading, and installation of riprap, boulders, soil riprap, void-filled riprap, and
22 Tubewell Drainage Systems
 22 Tubewell Drainage Systems WK Boehmer' and J Boonstra2 221 Introduction ' Tubewell drainage is a technique of controlling the watertable and salinity in agricultural areas It consists of pumping, from
SepticDesign.ca Gunnell Engineering Ltd.
 SepticDesign.ca Gunnell Engineering Ltd. Presentation Summary Best Practices Code Context Prior to Attending the Site When on Site Site Assessment Assessing Existing Sewage Systems The Septic Test Pit