Nitrogen Pollution: from the Sources to the Sea
|
|
|
- Bartholomew Singleton
- 6 years ago
- Views:
Transcription

1 Nitrogen Pollution: from the Sources to the Sea C. Driscoll, D. Whitall, J. Aber,, E. Boyer, M. Castro, C. Cronan,, C. Goodale, P. Groffman, C. Hopkinson,, K. Lambert, G. Lawrence, S. Ollinger
2 2. Power plant bills in Congress. S Clean Power Act S Clear Skies Act S. 588 Acid Rain Control Act Public Policy - Air Will NOx emissions reductions be adequate to reduce nitrogen deposition and episodic acidification in sensitive ecosystems? 1. Tailpipe emissions standards at the state and federal levels. EPA Tier 1 & 2 reductions State-based low emission vehicle programs.
3 Public Policy - Water Are there adequate funds, incentives and standards to promote nitrogen removal by treatment plants? EPA 305b report - identifies nutrients from municipal treatment plants and runoff as a source of impairment. EPA Gap Analysis - predicts a shortfall of $ million dollars for operating and capital improvements of publicly owned treatment plants. Water quality standards for total nitrogen do not exist. EPA developing criteria for states. Target for 2004 relaxed.
4 Federal Activity 1. Bills to fund water quality improvements play important role. S Water Quality Financing Act S Water Quality Investment Act S Water Quality Investment Act Includes grant program for nitrogen removal, Section 701. Reduction to 4 mg/l. 2. EPA progress on nutrient criteria would provide greater regulatory guidance.
5 Public Policy - Land Are there appropriate measures to ensure results (e.g. land taken out of production provides net reduction in nitrogen runoff)? Incentives for improved agricultural practices in the U.S. Farm Bill are important here, such as: Conservation Reserve Program EQIP Program
6 Outline Background Inputs of Nitrogen to the northeastern U.S. Effects of Nitrogen Pollution Management Options to Reduce Nitrogen Pollution
 7. Wastewater effluent 8.")
7 Major Sources 1.Power plant emissions 2.Vehicle emissions 3. Septic tank leakage 4. Manure/livestock runoff 5. Agricultural emissions 6.Fertilizer runoff (e.g. lawns and fields) 7. Wastewater effluent 8. Food and feed imports
8 Fertilizer Production NH 3 Feed Animal Nitrogen Cascade NH 3 Atmospheric Effects Atmospheric Deposition NH 3 NO 3 - NO x Energy Production Ozone Formation NO x NO 3 - N 2 to atm. Denitrification N 2 O Forest Effects Human Food Consumption NO - 3 NO 3 - NO 3 - Groundwater Effects NO 3 - NO 3 - Surface Water Effects NO 3 - Human Health/ Plant Damage Drinking water quality Greenhouse Effect Coastal Effects NO 3 - Adapted from Galloway and Cowling, 2002.

9 Study Area
10 Northeast Population and Land Use Trends Population (million) New York 10 5 New England Percent total land area 80% 60% Forest 40% Farmland 20% Other 0% A) U.S. Bureau of Census, 1996; B) USDA 1997, NASS 1999.
11 Critical Questions What are the major inputs of anthropogenic nitrogen? What are the ecological effects of nitrogen inputs? What management options are available to mitigate these effects?
12 Inputs of Anthropogenic Nitrogen Atmospheric deposition (ammonia, nitrate, dissolved organic N) Food imports Fertilizer inputs Feed imports Nitrogen fixation by leguminous crops

13 Atmospheric N Emissions Legend thousand kt N/yr Mobile NO x Point Source NO x Area NO x Ag NH 3 Mobile NH 3 Other NH 3 Source area based on 21 hour back trajectory Driscoll et al In review.

14 Lynch and Grimm, Wet Nitrate Nitrogen Wet Deposition Wet Ammonium kg NO 3- ha -1 yr -1 kg NH 4 + ha -1 yr -1
15 Long Term Precipitation Chemistry At Hubbard Brook, NH

16 Watershed Inputs: In small remote forested watersheds, such as the Hubbard Brook Experimental Forest in New Hampshire, anthropogenic N inputs are typically dominated by atmospheric deposition. Large coastal watersheds have more diverse N sources.
17 Nitrogen in Food Daily Nitrogen Consumption New England and New York, Nitrogen (1000 kilograms) FATS & OILS FRUIT VEGETABLES LEGUMES OTHER DAIRY CHEESE LOWFAT MILK WHOLE MILK GRAIN EGGS FISH POULTRY MEAT Year
18 Application of N fertilizers to major USA crops % of cropland receiving N fertlizer Wheat Cotton Corn Soybeans Source: USDA National Agricultural Statistics Service
19 Anthropogenic N Inputs to Large, Developed Watersheds From Driscoll et al In review.
20 Fate of Nitrogen Inputs Denitrification Biomass storage Soil storage Groundwater storage Exported to estuaries Exported in food and feed From Howarth et. al, 2002.
21 Anthropogenic N Loading to Major Estuaries From Driscoll et al In review.
22 Second Question 1. What are the major inputs of anthropogenic nitrogen to the northeastern U.S.? 2. What are the ecological effects of nitrogen inputs? 3. What management options are available to mitigate these effects?
23 Environmental issues linked to N Ground-level ozone Acid rain and acidification of forests & streams Forest saturation Over-fertilization of coastal waters Haze & reduced visibility Groundwater contamination Climate change

24 Ground-level ozone
25 Ground-level Ozone Formation Ollinger1 HNO 3 OH NO 2 VOCs UV Sunlight OH O 2 RO 2 O 2 O NO RO O 3 Courtesy of Scott Ollinger.

26 Counties with 1 Hour Ozone Standard Non-attainment
27 Figure 6 Estimated Reduction in Forest Growth due to Ozone Estimated Reduction in Forest Growth due to Ozone NY, NY Danbury, CT Ware, MA Chelsea, MA Schenectady, NY Bennington, VT Manchester, NH Portsmouth, NH Syracuse, NY Cape Elizabeth, ME Lake Placid, NY Bangor, ME % Reduction in in NPP Growth From Driscoll et al In review. 58


28 Acid Rain/Forest N Saturation Loss of nitrate to surface waters Episodic acidification of streams Acidification effects on biota
29 From Aber et al In review. Nitrate Deposition vs. Streamwater Nitrate NO3 - (umol/l) Catskills Adirondacks Massachusetts Vermont New Hampshire Maine ANNUAL MEAN NO Estimated N Deposition (kg/ha-yr)

 Note: areas with 8 kg/ha/yr or more tend to show high NO - 3")
30 36% of northeastern forest receives >8 kg N per hectare, per year. Histogram of N deposition for forested areas only # pixels (1 km 2 ) N Deposition (Kg/ha * yr) Note: areas with 8 kg/ha/yr or more tend to show high NO - 3 in stream water.

31 The Effects of Nutrient Over-Enrichment Coastal Eutrophication

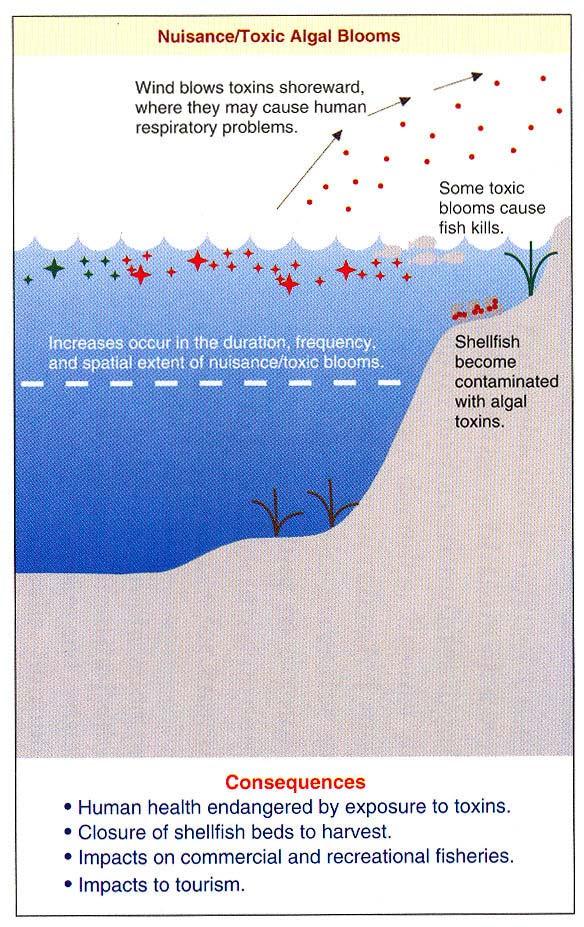
32 The Problem: Symptoms and Consequences of Nutrient Enrichment Nutrient Inputs Primary Secondary Consequences Effects Effects of Symptoms Increased Nitrogen Load Increased Primary Production Loss of Habitat Low D.O. Algal Blooms Fish kills Human health risks Loss of Tourism Closed fishing areas
33 High Eutrophic Conditions High Eutrophic Conditions 44 estuaries exhibit high expression of eutrophic conditions From NOAA s National Estuarine Eutrophication Assessment, Bricker et al., 1999.

34

35 Eutrophication and DO
36 Eutrophication and HAB

37 Eutrophication and SAV
38 Length and Max. Area of Hypoxia in Long Island Sound Length of Hypoxic Event (days) Days Max. Area Maximum area of hypoxia (km 2 ) Courtesy of Connecticut Department of Environmental Protection

39
40 Increasing Occurrence of Harmful Algal Blooms (HAB)


41 Eutrophication of Seagrass Beds Pristine First stage of decline Epiphytes on blades Water column algal blooms
42 Which Nutrients Cause Eutrophication? Long-term changes in sewage N and P content in the Himmerfjarden estuary point to N as the critical nutrient.

43 Which Nutrients Cause Eutrophication? Experiments in estuarine mesocosms in Narragansett Bay showed nutrient limitation by N but not P.
44 Which Nutrients Cause Eutrophication? Major changes in marine biota occurred following P reductions in Laholm Bay, Sweden, indicating N to be the cause of eutrophication

45 Which Nutrients Cause Eutrophication? Low N:P ratios found in most estuaries at the time of peak primary production indicates N limitation. Triangles represents N:P during peak production.

46 Nitrogen Yield from MR Basin
47 Critical Questions 1. What are the major inputs of anthropogenic nitrogen to the northeastern U.S.? 2. What are the ecological effects of nitrogen inputs? 3. What management options are available to mitigate these effects?


48 PnET BGC (Biogeochemical) Model PnET Water balance Photosynthesis Living biomass Litterfall Wet Deposition Dry Deposition Climatic data Solar radiation Precipitation Temperature Net Mineralization Uptake Shallow water flow BGC Aqueous reactions Surface reactions Cation exchange Adsorption Humic binding Aluminum dissolution/precipitation Weathering Deep water flow BGC Surface water Aqueous reactions
49 Modeling Reduced N Inputs to Forested Watersheds Atmospheric deposition is the dominant source of anthropogenic nitrogen in remote forested watersheds. Management options: 1. 75% reduction in electric utility NO x from current levels % reduction in vehicle NO x (EPA Tier 2 regulations). 3. Aggressive vehicle reduction (90% for cars above Tier 2) 4. 34% reduction in agricultural NH 3 emissions by animal waste treatment. Also, run with a concurrent 75% reduction in S emissions
50 PnET Results from Biscuit Brook NO 3 - Deposition (g/m 2 -yr) Without SO 4 2- Controls With SO 4 2- Controls NH 4 + Deposition (g/m 2 -yr) 2 SO 4 - Deposition (wet & dry) (g/m 2 /yr) NO 3 - (µmol/l) CAAA + integrated controls CAAA + aggressive vehicle NOx CAAA + tier II CAAA + additional utility NOx CAAA SO 4 2- (µmol/l) Year
51 PnET Results from Biscuit Brook
52 Inputs N Fertilization N Fixation Atmospheric Deposition Livestock Waste Outputs Crop Harvest Animal Grazing Ammonia Volatilization Denitrification Agricultural Lands (Crops and Pastures) Watershed and Riverine Losses Soil Climate N Fertilization Land Cover Atmospheric Deposition SWAT NPS Runoff Above Fall Line N Inputs WATERSN MODEL Human Population Wastewater N Discharge Point and NPS Septic Systems Below Fall Line N Inputs Atmospheric Deposition Nitrogen Fixation Upland Forests Atmospheric N Deposition Nitrogen Inputs to Estuary
53 Modeling Reduced N loading to Estuaries N inputs to estuaries are characterized by multiple sources. Management options evaluated: 1. Reduced N emissions to atmosphere 75% reduction in utilities NO x EPA Tier 2 reductions in vehicle emissions 90% reduction above Tier 2 in NO x from cars 34% reduction in agriculture NH 3 2. Biological Nitrogen Removal (BNR) for WWTPs 3. Septic system improvements 4. Offshore pumping of waste 5. Agricultural Best Management Practices (33% reduction in runoff N).
54 33% ag WATERSN Results for Long Island Sound and Casco Bay Percent Reduction in N Loading % edge of field ag Basinwide BNR Mobile Tier II Vehicle Tier 2 Integrated Legend Long Island Sound Casco Bay Integrated scenario includes basinwide BNR + enhanced septic +aggressive mobile +aggressive utilities BNR is Biological N Removal in WWTP Driscoll et al In review.


55 Residual N for Long Island Sound and Casco Bay LIS Casco Bay ag runoff forest runoff forest runoff Urban runoff N deposition Urban runoff N deposition Human Waste Human Waste
56 Ecosystem Protection for minimizing N inputs and runoff Wetlands protection. Conservation of forested and non-urbanized areas. Farmland reserve programs to reduce fertilizer and waste inputs in sensitive lands.
57 Conclusions: Inputs Anthropogenic N inputs to upland forested watersheds are dominated by emissions and deposition (~95%). N inputs to large, developed watersheds are diverse and are dominated by food (38-75%), atmospheric deposition (11-36%) and fertilizer (11-32%). N to loading to downstream estuaries is dominated by wastewater inputs (36-81%). Atmospheric deposition (14-35%) and runoff from agricultural (4-20%) and urban lands (<1-20%)are also large.
58 Conclusions: Effects Ground-level N emissions play a primary role in formation of ground level ozone. 26 million people in the study region experience air quality that exceeds the public health standard for ozone. Ambient ozone is projected to reduce forest productivity in the NE from 4-16%. Acid rain Nitrate is an increasing component of the acidity in acid rain. 40% of lakes in the Adirondacks and 15% in New England are still chronic or seasonally acidic. Nitrate is the key contributor to acid episodes that release Al to streams.
59 Conclusions: Effects Forest N saturation 36% of forestland in the NE receive N deposition above levels which result in elevated nitrate leaching an early indication of saturation. Coastal over-fertilization 61% of the estuaries surveyed by NOAA show signs of over-fertilization. Over-fertilization has been shown to cause low-oxygen conditions, loss of habitat and algal blooms in some estuaries.
60 Conclusions: Management PnET Results - Emissions Nitrogen deposition <8 kg/ha-yr is achieved by all options beyond the 1990 CAAA by 2010 for Biscuit Brook and Hubbard Brook. The thresholds for ANC, ph and soil base saturation are not achieved under any N only control scenario. Policies that reduce N and S allow for these thresholds to be approached within 50 years. Seasonal reductions in N emissions may help with summertime ozone, but year-round controls are much more effective in mitigating ecosystem effects.
61 Conclusions: Management WATERSN Results Estuary Loading - Improved wastewater treatment results in the largest reduction in estuarine loading in LIS and Casco Bay (up to 57% for LIS). - Emissions reductions of NO x from utilities and vehicles will have the ancillary benefit of reducing N loading up to 14% for Casco Bay. - An integrated management plan that includes N controls on several sectors achieves maximum reductions.
Habibollah Fakhraei, Charles T. Driscoll Department of Civil and Environmental Engineering, Syracuse University
 Habibollah Fakhraei, Charles T. Driscoll Department of Civil and Environmental Engineering, Syracuse University National Atmospheric Deposition Program Annual Meeting and Scientific Symposium Portland,
Effects of Acid Rain on Sensitive Forest and Freshwater Ecosystems: Is the Problem Solved? By Charles Driscoll Syracuse University
 Effects of Acid Rain on Sensitive Forest and Freshwater Ecosystems: Is the Problem Solved? By Charles Driscoll Syracuse University Acid rain sources and background Effects of acidic deposition on forest
One of the critical challenges for the sustainable
 Nitrogen Pollution in the Northeastern United States: Sources, Effects, and Management Options CHARLES T. DRISCOLL, DAVID WHITALL, JOHN ABER, ELIZABETH BOYER, MARK CASTRO, CHRISTOPHER CRONAN, CHRISTINE
Nitrogen Pollution and its Impacts
 Nitrogen Pollution and its Impacts OUTLINE: Background forms and cycling Sources Cycling, transport dynamics and loadings from watersheds Landuse and N exports Management Options to reduce N Effects and
Chesapeake Bay Nitrogen Assessments
 Chesapeake Bay Nitrogen Assessments May 20, 2010 Workshop on Nitrogen Assessment Science in the USA Thomas E. Jordan Chesapeake Bay Watershed Area=167,000 km 2 Spans 6 states + DC 6 physiographic provinces
Nutrients, Algal Blooms and Red Tides in Hong Kong Waters. Paul J. Harrison and Jie XU
 Nutrients, Algal Blooms and Red Tides in Hong Kong Waters Paul J. Harrison and Jie XU Division of Environment, Hong Kong University of Science & Technology 1. Introduction The Pearl River is China's second
Understanding Nutrients and Their Affects on the Environment
 Understanding Nutrients and Their Affects on the Environment Humans & Ecosystems Humans are just like ecosystems, too much or too little of a nutrient is bad for the system. Nutrient management is a balancing
Overview of the Human Health and Environmental Effects of Power Generation: Focus on Sulfur Dioxide (SO 2 ), Nitrogen Oxides (NO X ) and Mercury (Hg)
, Nitrogen Oxides (NO X ) and Mercury (Hg)") The information presented here reflects EPA's modeling of the Clear Skies Act of 2002. The Agency is in the process of updating this information to reflect modifications included in the Clear Skies Act
The information presented here reflects EPA's modeling of the Clear Skies Act of 2002. The Agency is in the process of updating this information to reflect modifications included in the Clear Skies Act
EVOLVING THE LONG ISLAND SOUND NITROGEN REDUCTION STRATEGY DECEMBER Overview
 Overview Background Hypoxia, defined as dissolved oxygen (DO) levels of less than mg/l, is a common occurrence in Long Island Sound (LIS) bottom waters during the summer, affecting up to half of its area
7.014 Lecture 20: Biogeochemical Cycles April 1, 2007
 Global Nutrient Cycling - Biogeochemical Cycles 7.14 Lecture 2: Biogeochemical Cycles April 1, 27 Uptake Bioelements in Solution Weathering Precipitation Terrestrial Biomass Decomposition Volatile Elements
Technical Document EPA s Draft Report on the Environment Chapter 1 - Cleaner Air 1.2 Acid Deposition 1-25
 Technical Document EPA s Draft Report on the Environment 3 1. Acid Deposition Sulfur dioxide and NO X emissions in the atmosphere react with water, oxygen, and oxidants to form acidic components, also
 Atmospheric Nitrogen Deposition: An increasingly Important Source of new Nitrogen Supporting Coastal Eutrophication H Paerl 1, D. Whitall 2 and R. Dennis 3 1 UNC-CH CH Institute of Marine Sciences, Morehead
Linking Ecosystem Indicators to Ecosystem Services
 Linking Ecosystem Indicators to Ecosystem Services Christine Davis* G. Van Houtven, C. Mansfield, M. Cutrofello, and M. O Neil *Health and Environmental Impacts Division, OAQPS U.S. Environmental Protection
EUTROPHICATION. Student Lab Workbook
 EUTROPHICATION Student Lab Workbook THE SCIENTIFIC METHOD 1. Research Background literature research about a topic of interest 2. Identification of a problem Determine a problem (with regards to the topic)
An Evaluation of Nutrient Trading Programs
 An Evaluation of Nutrient Trading Programs Yuko Ashida Emilia Deimezis Carla Fowler Joe Sambatoro NTRES 318: Environmental Strategies March 3, 2003 Nutrient Loading Nutrient loading -> eutrophication ->
MODELING NUTRIENT LOADING AND EUTROPHICATION RESPONSE TO SUPPORT THE ELKHORN SLOUGH NUTRIENT TOTAL MAXIMUM DAILY LOAD
 MODELING NUTRIENT LOADING AND EUTROPHICATION RESPONSE TO SUPPORT THE ELKHORN SLOUGH NUTRIENT TOTAL MAXIMUM DAILY LOAD Martha Sutula Southern California Coastal Water Research Project Workshop on The Science
TIEE Teaching Issues and Experiments in Ecology - Volume 1, January 2004
 TIEE Teaching Issues and Experiments in Ecology - Volume 1, January 2004 ISSUES FIGURE SET Human Alteration of the Global Nitrogen Cycle Charlene D'Avanzo, School of Natural Sciences Hampshire College,
Consequences of Nitrogen Deposition to Rocky Mountain National Park
 Consequences of Nitrogen Deposition to Rocky Mountain National Park Jill S. Baron, US Geological Survey M.Hartman, D.S.Ojima, K. Nydick, H.M. Rueth B.Moraska Lafrancois, A.P. Wolfe, J. Botte, W.D. Bowman
Restoring the Long Island Sound While Saving Money
 in Connecticut and New York TMDL at a Glance Long Island Sound Nitrogen TMDL (approved April 2001) www.longislandsoundstudy.net/pubs/reports/tmdl.pdf Factors causing impairment Aesthetics, fishing, and
Sewage pollution and eutrophication in Florida s coastal waters: the role of septic tanks
 Sewage pollution and eutrophication in Florida s coastal waters: the role of septic tanks Brian E. Lapointe Florida Atlantic University-Harbor Branch Oceanographic Institute Marine Ecosystem Health Program
Chesapeake Bay Program Models:
 Chesapeake Bay Program Models: A Guide to Better Understanding Modeling and Decision Support Tool Forum Penn State Harrisburg August 1, 2011 1 Mark Dubin Agricultural Technical Coordinator University of
Overview of Critical Loads Efforts in the U.S.
 Overview of Critical Loads Efforts in the U.S. NADP Fall 2007 Technical Symposium Richard Haeuber, Ph.D. Office of Air and Radiation, EPA September 12, 2007 Overview CL Refresher What are critical loads?
The modification of global atmospheric Nitrogen cycling by human activities. David Fowler Centre for Ecology and Hydrology Edinburgh UK
 The modification of global atmospheric Nitrogen cycling by human activities David Fowler Centre for Ecology and Hydrology Edinburgh UK Background The N cycle Global N emissions Oxidised Nitrogen Reduced
Approaches to Reducing Ammonia Emissions in Canada
 Special session on Agriculture and Air Pollution organized for WGSR by the Task Force on Reactive Nitrogen and the Secretariat Approaches to Reducing Ammonia Emissions in Canada Shabtai Bittman Agriculture
Bob Broz University of Missouri Extension
 Bob Broz University of Missouri Extension brozr@missouri.edu 573-882-0085 What is the purpose on the nutrient reduction committee? Reduce nutrient loading into the Mississippi River and into the Gulf of
Jan Willem Erisman, ECN/VU for:
 Reactive Nitrogen in the United States; An analysis of inputs, flows, consequences, and management options: A Draft report of the EPA Science Advisory Board 1 Jan Willem Erisman, ECN/VU for: James N. Galloway,
Nitrogen Cycling, Primary Production, and Water Quality in the New River Estuary. Defense Coastal/Estuarine Research Program (DCERP)
") Nitrogen Cycling, Primary Production, and Water Quality in the New River Estuary Defense Coastal/Estuarine Research Program (DCERP) Introduction: A key theme of the ongoing DCERP program is monitoring
Nitrogen Cycling, Primary Production, and Water Quality in the New River Estuary Defense Coastal/Estuarine Research Program (DCERP) Introduction: A key theme of the ongoing DCERP program is monitoring
Barnegat Bay-Little Egg Harbor: Ecosystem Condition. Michael J. Kennish Institute of Marine and Coastal Sciences Rutgers University
 Barnegat Bay-Little Egg Harbor: Ecosystem Condition Michael J. Kennish Institute of Marine and Coastal Sciences Rutgers University Coastal Lagoons Barnegat Bay- Little Egg Harbor ANTHROPOGENIC EFFECTS*
Pollutants in our Waters
 Pollutants in our Waters CARIWIN Advanced Course in IWRM September 17, 2007 Apurva Gollamudi Brace Centre for Water Resources Management McGill University It isn t the pollution that s harming the environment.
Where the rubber meets the road: What is needed to sustainably manage reactive nitrogen in the US?
 Where the rubber meets the road: What is needed to sustainably manage reactive nitrogen in the US? Jana Compton, Otto Doering, James Galloway, Stephen Jordan, William Moomaw, Anne Rea, Daniel Sobota, Thomas
A Primer on Nitrogen Pollution in the Environment. Kevin D Kroeger USGS Woods Hole Coastal & Marine Science Center Woods Hole, MA
 A Primer on Nitrogen Pollution in the Environment Kevin D Kroeger USGS Woods Hole Coastal & Marine Science Center Woods Hole, MA Beyond the Boundaries We have already overstepped 3 of 9 planetary boundaries
Great Smoky Mountains National Park
 National Park Service U.S. Department of the Interior Great Smoky Mountains National Park Acid Deposition Resource Protection Goal at Great Smoky Mountains National Park EPA Region 4 Grants/Planning Meeting,
Low Dissolved Oxygen HYPOXIA. What is Hypoxia?
 HYPOXIA Low Dissolved Oxygen What is Hypoxia? Hypoxia or low dissolved oxygen has been identified as the most critical issue facing the Sound. Just as we breathe oxygen, the fish and other marine life
Nutrient Cycling and Water Quality on California Rangelands
 Nutrient Cycling and Water Quality on California Rangelands Randy Dahlgren Department of Land, Air and Water Resources University of California - Davis Core Research Team Barbara Allen-Diaz Rob Atwill
Scientific overview: Water quality functions of coastal buffers
 Scientific overview: Water quality functions of coastal buffers Caitlin Chaffee, Coastal Policy Analyst RI Coastal Resources Management Council November 21, 2013 Buffer Zone Setback = Minimum Distance
The Global Environmental Change: Carbon Sequestration
 The Global Environmental Change: Carbon Sequestration Sources of Anthropogenic Greenhouse Gas Emissions Carbon Sequestration The global C politics Summary Sources of Anthropogenic Greenhouse Gas Emissions
Mr. Leach Science Burrillville High School
 Mr. Leach Science Burrillville High School The Clear River subwatershed, is located in northwestern Rhode Island. This subwatershed is a component of the Lower Blackstone River Watershed, the Blackstone
Nitrogen (N) affects in-state and downstream waters in three primary ways:
 affects in-state and downstream waters in three primary ways:") G. Conclusions Concerns with nitrogen in waters Nitrogen (N) affects in-state and downstream waters in three primary ways: 1. Aquatic life toxicity - Aquatic life have been found to be adversely affected
G. Conclusions Concerns with nitrogen in waters Nitrogen (N) affects in-state and downstream waters in three primary ways: 1. Aquatic life toxicity - Aquatic life have been found to be adversely affected
Status of Water Quality in Ohio: The 2018 Integrated Report. April 25, 2018
 Status of Water Quality in Ohio: The 2018 Integrated Report April 25, 2018 Today s Topics Overview of the 2018 Integrated Report Purpose and requirements Assessment overview Differences from the 2016 Integrated
Water Pollution and Water Quality (Nazaroff & Alvarez-Cohen, Sections 6.A and 6.B) (with additional materials)
 (with additional materials)") Water Pollution and Water Quality (Nazaroff & Alvarez-Cohen, Sections 6.A and 6.B) (with additional materials) Water is a basic necessity of nature and humans. We use water for: -drinking - food preparation
Water Pollution and Water Quality (Nazaroff & Alvarez-Cohen, Sections 6.A and 6.B) (with additional materials) Water is a basic necessity of nature and humans. We use water for: -drinking - food preparation
Lawn and Gardening our Way to Hell in a Vegetable Basket
 Lawn and Gardening our Way to Hell in a Vegetable Basket MSU Extension Brad D. Lee, PhD, CPSS Associate Professor and Extension Specialist Department of Plant and Soil Sciences, University of Kentucky
Reducing Agriculture s Nitrogen Footprint: Are New Policy Approaches Needed?
 Reducing Agriculture s Nitrogen Footprint: Are New Policy Approaches Needed? Marc Ribaudo, mribaudo@ers.usda.gov A M B E R WAV E S V O L U M E 9 I S S U E 3 34 Lynn Betts, USDA/NRCS E C O N O M I C R E
Understanding Agriculture And Clean Water
 1 IOWA CHAPTER Understanding Agriculture And Clean Water Clean Water Act Established in 1972, the Clean Water Act (CWA) created the basic structure for regulating discharges of pollutants into water bodies
Chesapeake Bay s Problems
 Environmental Issues for the Chesapeake Bay Russ Perkinson Virginia State Feed Association Conference February 16, 2011 Chesapeake Bay s Problems Congressional appropriation of $27 million for six year
The Effects of Hog Waste on the Environment
 The Effects of Hog Waste on the Environment Viney P. Aneja and William Battye Air Quality Research Group Department of Marine, Earth, and Atmospheric Sciences North Carolina State University Raleigh, NC
An Economic Analysis of the Impacts of Agriculture in the Northeastern U.S.
 An Economic Analysis of the Impacts of Agriculture in the Northeastern U.S. R I G OBERTO A. LO P EZ D I R EC TO R O F T H E Z W I C K C E N T ER F O R F O OD A N D R ESOURC E P O L I CY P R O F ES S OR
Ocean Water Buoyancy and Hypoxia in the Gulf of Mexico. Definitions. Hypoxia in the Headlines. Joe Smith. ExxonMobil Upstream Research Company
 Ocean Water Buoyancy and Hypoxia in the Gulf of Mexico Joe Smith ExxonMobil Upstream Research Company Joe Smith 2004 Hypoxia NOAA Coastal Data Development Center Definitions Hypoxia is a term meaning low
Unit 3: Ecology II Section 1: Environmental Systems and Nutrient Cycling
 Unit 3: Ecology II Section 1: Environmental Systems and Nutrient Cycling Systems in the Environment are not Independent of one Another Central Case Study: The Vanishing Oysters of the Chesapeake Bay Chesapeake
Buffer Zone = Area of Undisturbed Vegetation
 Scientific overview: Water quality functions of coastal buffers Caitlin Chaffee, Coastal Policy Analyst RI Coastal Resources Management Council November 29, 2012 Buffer Zone Setback = Minimum i Distance
Water Quality indicators and How Human Activities Affect Water Quality
 Water Quality indicators and How Human Activities Affect Water Quality Name: Online Assignment: Period: Date: Purpose: to learn how to evaluate water quality and how pollution can make water unavailable
Water Resources on PEI: an overview and brief discussion of challenges
 Water Resources on PEI: an overview and brief discussion of challenges Components: Components and links Atmospheric water Surface water (including glacial water) Groundwater Links: Precipitation (atm(
Some Modeling Approaches and Issues for Nitrogen
 Some Modeling Approaches and Issues for Nitrogen Susquehanna River basin workshop June 23, 2004 Robert W. Howarth Department of Ecology & Evolutionary Biology Cornell University Two models: ReNuMa (based
Nitrogen Deposition Reduction Plan for Rocky Mountain National Park. Presentation to the Fall 2007 NADP Technical Meeting and Scientific Symposium
 Nitrogen Deposition Reduction Plan for Rocky Mountain National Park Presentation to the Fall 2007 NADP Technical Meeting and Scientific Symposium September 12, 2007 Air Quality Issues at Rocky For Rocky
pk g = 1.41 pk 1 = 6.35 pk 2 = ph of pure water? ph of rain
 Acid Rain Acid deposition consists of delivery of acid substances or precursors, principally sulfur and nitrogen oxides, acids, and salts, from the atmosphere to the earth surface (Schwartz 1989) Wet deposition-
Ecosystems: Nutrient Cycles
 Ecosystems: Nutrient Cycles Greeks, Native Peoples, Buddhism, Hinduism use(d) Earth, Air, Fire, and Water as the main elements of their faith/culture Cycling in Ecosystems the Hydrologic Cycle What are
Appendix X: Non-Point Source Pollution
 Appendix X: Non-Point Source Pollution Sources Nonpoint source of pollution, unlike pollution from industrial and sewage treatment plants, comes from many different sources. Nonpoint source pollution is
Nutrient Reduction Strategy and Best Management Practices
 Nutrient Strategy and Best Management Practices Matthew Helmers Dean s Professor, College of Ag. & Life Sciences Professor, Dept. of Ag. and Biosystems Eng. Iowa State University Situation Increasing concern
Nitrogen For Corn Production
 Nitrogen For Corn Production John Sawyer Professor and Soil Fertility Extension Specialist Department of Agronomy Iowa State University Why Nitrogen Is Applied For Corn Corn Yield Response Corn Yield,
Objectives: Define the term biogeochemical cycles. Compare and contrast how carbon, phosphorus, nitrogen, and water cycle through the environment.
 Objectives: Define the term biogeochemical cycles. Compare and contrast how carbon, phosphorus, nitrogen, and water cycle through the environment. Explain how human impact is affecting biogeochemical cycles
Non Point Nitrogen Sources and Transport in the Great Bay Watershed
 Non Point Nitrogen Sources and Transport in the Great Bay Watershed Michelle (Daley) Shattuck, Jody D. Potter, Ania Kobylinski, Charlie French, Steve Miller, Chris Keely, John Bucci, William H. McDowell
Department of Environmental Conservation. Fiscal Year 2015 Performance Outcomes and Measures
 Department of Environmental Conservation Fiscal Year 2015 Performance Outcomes and Measures Department of Environmental Conservation Fiscal Year 2015 Performance Outcomes and Measures Department of Environmental
Septic Improvement Program FAQs
 Septic Improvement Program FAQs Where does our waste go after we flush the toilet? Thanks to the simple push of a lever, waste remains out of sight and out of mind. According to the US EPA, about one-third
Captiva Water Quality Assessment Project Update Supported by TDC s Beach & Shoreline Program through the Captiva Community Panel
 Captiva Water Quality Assessment Project Update Supported by TDC s Beach & Shoreline Program through the Captiva Community Panel Mark Thompson & Loren Coen Marine Laboratory, Sanibel-Captiva Conservation
Targeting Best Management in Contrasting Watersheds
 Targeting Best Management in Contrasting Watersheds Andrew Sharpley, Tommy Daniel, Sheri Herron & Bil Gburek University or Arkansas, BMP s Inc. & USDA-ARS ARS Today s s P Cycle is Fragmented Grain P Manure
The Nitrogen Cycle: Connections to the Neuse River Estuary
 1 The Nitrogen Cycle: Connections to the Neuse River Estuary Alexandria G. Hounshell Doctoral Student Department of Marine Sciences University of North Carolina-Chapel Hill E-mail: alexgh@live.unc.edu
1. Where are nutrients accumulated or stored for short or long periods?
 Use with textbook pages 68 87. Nutrient cycles Answer the questions below. Comprehension 1. Where are nutrients accumulated or stored for short or long periods? 2. Name a biotic process and an abiotic
Trout Lake Big Lake Lake Balance NO 3
 1. You are a limnologist studying several lakes in northern Ontario. The lakes have little input of nutrients from streams. You measure the concentrations of nitrate and phosphate every two months, and
Strategies for nitrate reduction: The Cedar River Case Study
 2010 Integrated Crop Management Conference - Iowa State University 195 Strategies for nitrate : The Cedar River Case Study Matthew J. Helmers, associate professor, Agricultural and Biosystems Engineering,
An Evaluation of Nitrogen Loading into Upper Narragansett Bay
 An Evaluation of Nitrogen Loading into Upper Narragansett Bay NEWEA Conference January 26, 2010 Catherine Walker & Christine Comeau Narragansett Bay Commission Providence, RI Narragansett Bay Commission
Little Bay Water Quality Report Card Spring 2014
 Little Bay Water Quality Report Card Spring 2014 Little Bay is a small, semi-enclosed estuary located in the heart of Rockport, Texas. Estuaries, where freshwater from rivers and streams mixes with salt
Understanding Nutrients in the Chesapeake Bay Watershed and Implications for Management and Restoration the EASTERN SHORE
 Understanding Nutrients in the Chesapeake Bay Watershed and Implications for Management and Restoration the EASTERN SHORE Scott W. Ator and Judith M. Denver Guest presented by Joel Blomquist A summary
Ecology and Animal Health
 Ecosystem Health and Sustainable Agriculture 2 Ecology and Animal Health Editors: Leif Norrgren and Jeffrey M. Levengood CSD Uppsala. Centre for sustainable development Eutrophication 6 Lennart Gladh World
Acidity and Alkalinity:
 Evaluation of Pollution Sources to Lake Glenville Quarterly Report December 2018 Kimberlee K Hall, PhD Environmental Health Program, Western Carolina University Summary Chemical and microbial analysis
Nutrient Response to Sewage Abatement in Hong Kong
 Nutrient Response to Sewage Abatement in Hong Kong Prof. Paul J. Harrison Atmospheric, Marine & Coastal Environment Program Institute for the Environment HK University of Science & Technology Outline Background
Current and estimated future atmospheric nitrogen loads to the Chesapeake Bay Watershed
 Current and estimated future atmospheric nitrogen loads to the Chesapeake Bay Watershed Jesse O. Bash, Kyle Hinson, Patrick Campbell, Norm Possiel, Tanya Spero, Chris Nolte 1 Outline Background of historic
Climate Change Water Implications for Michigan Communities, Landsystems and Agriculture
 Climate Change Water Implications for Michigan Communities, Landsystems and Agriculture Distinguished Senior Research Specialist Department of Geography Institute of Water Research Climate Change Summary
Evaluation of the Use of Critical Loads to Mitigate Effects of Acidic Deposition to Forest Ecosystems in the Northeastern U.S.
 Evaluation of the Use of Critical Loads to Mitigate Effects of Acidic Deposition to Forest Ecosystems in the Northeastern U.S. Critical loads are a tool used to guide air quality management to protect
Carrying Capacity and Economic Considerations for Shellfish Aquaculture
 Carrying Capacity and Economic Considerations for Shellfish Aquaculture Hauke Kite-Powell Marine Policy Center Woods Hole Oceanographic Institution Hauke L. Kite-Powell WHOI Marine Policy Center May 8,
Role of Soils in Water Quality. Mike Marshall Extension Associate Texas A&M-Institute of Renewable Natural Resources
 Role of Soils in Water Quality Mike Marshall Extension Associate Texas A&M-Institute of Renewable Natural Resources Water Quality in Texas Water is a finite resource that can be impaired by pollution from
Fact Sheet. Chesapeake Bay Water Quality
 Fact Sheet Chesapeake Bay Water Quality Water quality is a critical measure of the Chesapeake Bay s health. For the Bay to be healthy and productive, the water must be safe for people and must support
Trout Lake Big Lake Lake Balance NO 3
 1. You are a limnologist studying several lakes in northern Ontario. The lakes have little input of nutrients from streams. You measure the concentrations of nitrate and phosphate every two months, and
WWF SHRIMP AQUACULTURE DIALOGUE Effluent impact assessment:water quality monitoring vs nutrient budget
 WWF SHRIMP AQUACULTURE DIALOGUE Effluent impact assessment:water quality monitoring vs nutrient budget Stanislaus Sonnenholzner FUNDACION CENAIM-ESPOL GUAYAQUIL - ECUADOR INTRODUCTION Shrimp aquaculture
Slide 1: Welcome to today s The Nitrogen Cycle presentation, where we ll be talking to you about the importance of nitrogen in our environment.
 Slide 1: Welcome to today s The Nitrogen Cycle presentation, where we ll be talking to you about the importance of nitrogen in our environment. 1 Slide 2: Barnegat Bay, like many coastal areas in the country,
Human perturbations to the global Nitrogen cycle
 Human perturbations to the global Nitrogen cycle Lecture for Biogeochemistry and Global Change Edzo Veldkamp The pace of human caused global change has increased in modern history, but none so rapidly
Stormwater Runoff & Pesticides What Monitoring Done Elsewhere May Suggest for South Portland
 Stormwater Runoff & Pesticides What Monitoring Done Elsewhere May Suggest for South Portland South Portland City Council Workshop 8/8/16 Fred Dillon Stormwater Program Coordinator Stormwater 101 What stormwater
Viewing Great Bay from a Nitrogen. (and Watershed) Perspective
 Perspective") Viewing Great Bay from a Nitrogen (and Watershed) Perspective Michelle L. Daley and Dr. William H. McDowell UNH Dept. Natural Resources & the Environment NH Water Resources Research Center Bay Views Hugh
Viewing Great Bay from a Nitrogen (and Watershed) Perspective Michelle L. Daley and Dr. William H. McDowell UNH Dept. Natural Resources & the Environment NH Water Resources Research Center Bay Views Hugh
COUPLED PHYSICAL BIOGEOCHEMICAL MODELS
 COUPLED PHYSICAL BIOGEOCHEMICAL MODELS Upwelling CONCEPTUAL MODEL OF EUTROPHICATION IN THE COASTAL OCEAN Nutrient/ Acid Deposition Local Emissions HABs! Phytoplankton Blooms Senesce and Settling Respiration:
Factsheet: Town of East Lyme Water Quality and Stormwater Summary
 79 Elm Street Hartford, CT 06106-5127 www.ct.gov/deep Affirmative Action/Equal Opportunity Employer Factsheet: Town of East Lyme Water Quality and Stormwater Summary This document was created for each
Biogeochemical Cycles
 Biogeochemical Cycles Biogeochemical Cycles refers to the cycling of materials between living things and the environment. Text Pages 50 51, 62 69 1 The Oxygen Cycle the movement of oxygen between the atmosphere
ACES Session 47 Governance barriers and opportunities for integrating ecosystem services into estuary and coastal management
 ACES Session 47 Governance barriers and opportunities for integrating ecosystem services into estuary and coastal management This session will present examples of science-governance partnerships for developing
Cycling and Biogeochemical Transformations of N, P, S, and K
 Cycling and Biogeochemical Transformations of N, P, S, and K OCN 401 - Biogeochemical Systems 24 September 2013 Reading: Schlesinger & Bernhardt, Chapter 6 1. Nitrogen cycle Soil nitrogen cycle Nitrification
Some Random Thoughts on Limnology
 Some Random Thoughts on Limnology T.J. Sullivan E&S Environmental Chemistry, Inc. USDA Forest Service Western Lakes Workshop March 2 nd 4 th, 2010 Skamania Lodge Stevenson, WA STUDY DESIGN 2 Major Issues
The Global Nitrogen Cycle
 OCN 401 The Global Nitrogen Cycle (11.30.10) Fig. 12.2. Units are 10 12 g N/yr (Tg) Role of N in Biogeochemistry Bioavailability of N (and/or P) can limit NPP on land/oceans; controls size of biomass N
Dead-Zones and Coastal Eutrophication: Case- Study of Chesapeake Bay W. M. Kemp University of Maryland CES Horn Point Laboratory Cambridge, MD
 Dead-Zones and Coastal Eutrophication: Case- Study of Chesapeake Bay W. M. Kemp University of Maryland CES Horn Point Laboratory Cambridge, MD Presentation to COSEE Trends Orientation at UMCES HPL 4 August
Factsheet: Town of Hamden Water Quality and Stormwater Summary
 79 Elm Street Hartford, CT 06106-5127 www.ct.gov/deep Affirmative Action/Equal Opportunity Employer Factsheet: Town of Hamden Water Quality and Stormwater Summary This document was created for each town
Nitrogen cycling on five headwater forested catchments in Mid-Appalachians of Pennsylvania
 Dynamics and Biogeochemistry of River Corridors and Wetlands (Proceedings of symposium S4 held during the Seventh IAHS Scientific Assembly at Foz do Iguaçu, Brazil, April 2005). IAHS Publ. 294, 2005. 29
The influence of climate on average nitrogen export from large watersheds in the Northeastern United States
 ---,- Biogeochemistry (2006) DOl 10.1007/sl0533-006-9010-1 79:163-186 Springer 2006 The influence of climate on average nitrogen export from large watersheds in the Northeastern United States R.W. HOWARTH
Protecting Utah s Water Resources. Nutrient Issues
 Protecting Utah s Water Resources Nutrient Issues Nutrient Issues Questions What are they? Why are they important? Nationally Locally What are the impact on my community Costs Timing What are Nutrients?
Estuarine and Coastal Biogeochemistry
 Estuarine and Coastal Biogeochemistry OCN 623 Chemical Oceanography 9 April 2013 Reading: Seitzinger & Mayorga (2008) 2013 Frank Sansone 1. Global coastal zone Outline 2. Nutrient loading in estuaries