Impact of the U.S. Consumer Propane Industry on U.S. and State Economies in 2015
|
|
|
- Annabelle Washington
- 5 years ago
- Views:
Transcription

1 Impact of the U.S. Consumer Propane Industry on U.S. and State Economies in 2015 September, 2017 Prepared for the Propane Education & Research Council (PERC) COPYRIGHT 2017 Propane Education & Research Council All rights reserved.
2 Prepared for: Roy W. Willis President and Chief Executive Officer Propane Education & Research Council Suite Connecticut Ave. NW Washington, DC Prepared by: ICF 9300 Lee Highway Fairfax, Virginia Tel. (703) PRIMARY AUTHORS This report documents the results of a study conducted for PERC by a team from ICF. The effort was coordinated by Michael Sloan, Director of ICF s Gas, NGL, and Oil Advisory Consulting practice. The primary authors for the report include: Eric Kuhle, ICF (Eric.Kuhle@ICF.com) Michael Sloan, ICF (Michael.Sloan@ICF.com)
3 Table of Contents 1. Introduction and Summary Introduction Key Changes from 2012 to Economic Added Value from the Retail Propane Sector Growth of Domestic Propane Production and Exports Methodology and Scope of Analysis Production Midstream Downstream Summary of Results Findings Employment and Wages in the Odorized Propane Industry Direct Employment Economic Impact of the Odorized Propane Industry Direct Economic Impact Upstream Midstream Downstream Indirect Economic Impact Supported Industries and Employment Maps of National Level Overview Propane Heated Households by State Odorized (Retail) Propane Employment by State Odorized (Retail) Propane Wages ($ Thousands) by State Total Propane Employment by State Total Propane Wages ($ Thousands) by State Total Employment from Natural Gas Liquids and Propane by State Total Wages ($ Thousands) from Natural Gas Liquids and Propane by State Direct Added Value from Odorized (Retail) Propane by State Indirect and Induced Added Value from Odorized (Retail) Propane by State Total Added Value from Odorized (Retail) Propane by State Total Added Value from Propane by State Odorized Propane Industry s Impact on the U.S. Economy by State Odorized Propane s Impact on Total U.S. Economy Odorized Propane s Impact on Total U.S. Economy Odorized Propane's Impact on Alabama Economy Odorized Propane s Impact on Alaska Economy Odorized Propane s Impact on Arizona Economy Odorized Propane s Impact on Arkansas Economy... 63
4 4.7. Odorized Propane s Impact on California Economy Odorized Propane s Impact on Colorado Economy Odorized Propane s Impact on Connecticut Economy Odorized Propane s Impact on Delaware Economy Odorized Propane s Impact on District of Columbia Economy Odorized Propane s Impact on Florida Economy Odorized Propane s Impact on Georgia Economy Odorized Propane s Impact on Hawaii Economy Odorized Propane s Impact on Idaho Economy Odorized Propane s Impact on Illinois Economy Odorized Propane s Impact on Indiana Economy Odorized Propane s Impact on Iowa Economy Odorized Propane s Impact on Kansas Economy Odorized Propane s Impact on Kentucky Economy Odorized Propane s Impact on Louisiana Economy Odorized Propane s Impact on Maine Economy Odorized Propane s Impact on Maryland Economy Odorized Propane s Impact on Massachusetts Economy Odorized Propane s Impact on Michigan Economy Odorized Propane s Impact on Minnesota Economy Odorized Propane s Impact on Mississippi Economy Odorized Propane s Impact on Missouri Economy Odorized Propane s Impact on Montana Economy Odorized Propane s Impact on Nebraska Economy Odorized Propane s Impact on Nevada Economy Odorized Propane s Impact on New Hampshire Economy Odorized Propane s Impact on New Jersey Economy Odorized Propane s Impact on New Mexico Economy Odorized Propane s Impact on New York Economy Odorized Propane s Impact on North Carolina Economy Odorized Propane s Impact on North Dakota Economy Odorized Propane s Impact on Ohio Economy Odorized Propane s Impact on Oklahoma Economy Odorized Propane s Impact on Oregon Economy Odorized Propane s Impact on Pennsylvania Economy Odorized Propane s Impact on Rhode Island Economy Odorized Propane s Impact on South Carolina Economy Odorized Propane s Impact on South Dakota Economy Odorized Propane s Impact on Tennessee Economy Odorized Propane s Impact on Texas Economy Odorized Propane s Impact on Utah Economy Odorized Propane s Impact on Vermont Economy Odorized Propane s Impact on Virginia Economy
5 4.50. Odorized Propane s Impact on Washington Economy Odorized Propane s Impact on West Virginia Economy Odorized Propane s Impact on Wisconsin Economy Odorized Propane s Impact on Wyoming Economy Household Heating Fuels, By State and Division A. Appendix: NAICS Codes and Definitions B. Appendix: Acronyms C. Appendix: Major Public Data Sources
6 List of Figures Figure Odorized Propane s Total Direct Value Added by Value Chain Component... 4 Figure 2. Odorized Propane s Total (Direct & Indirect) Added Value by U.S. Census Region... 4 Figure 3. Monthly U.S. Propane Export Capacity and Actual Exports... 6 Figure 4: Value Chain for Odorized Propane (C 3 H 8 ), 2015 (Million Dollars) Figure 5: Volume Chain for Odorized Propane (C 3 H 8 ), 2015 (Thousand Gallons) Figure 6: Value Chain for All Purity Propane (C 3 H 8 ), 2015 (Million Dollars) Figure 7: Volume Chain for All Purity Propane (C 3 H 8 ), 2015 (Thousand Gallons) Figure 8: Value Chain for Butanes (C 4 H 10 ), 2015 (Million Dollars) Figure 9: Volume Chain for Butanes (C 4 H 10 ), 2015 (Thousand Gallons) Figure 10: Value Chain for Ethane (C 2 H 6 ), 2015 (Million Dollars) Figure 11: Volume Chain for Ethane (C 2 H 6 ), 2015 (Thousand Gallons) Figure 12: Value Chain for All NGLs and LRGs, 2015 (Million Dollars) Figure 13: Volume Chain for All NGLs and LRGs, 2015 (Thousand Gallons) Figure 14. Propane Heated Households by State Figure 15. Odorized (Retail) Propane Employment by State Figure 16. Odorized (Retail) Propane Wages ($ Thousands) by State Figure 17. Total Propane Employment by State Figure 18. Total Propane Wages ($ Thousands) by State Figure 19. Total Employment from Natural Gas Liquids and Propane by State Figure 20. Total Wages ($ Thousands) from Natural Gas Liquids and Propane by State Figure 21. Direct Added Value from Odorized (Retail) Propane by State Figure 22. Indirect and Induced Added Value from Odorized (Retail) Propane by State Figure 23. Total Added Value from Odorized (Retail) Propane by State Figure 24. Total Added Value from Propane by State... 55
7 List of Tables Table 1. Comparison of 2009, 2012 and 2015 Propane Production and Consumption... 3 Table 2: National Value Summary for Odorized Propane (C 3 H 8 ), Table 3: National Value Summary for All Purity Propane (C 3 H 8 ), Table 4: National Value Summary for Butanes (C 4 H 10 ), Table 5: National Value Summary for Ethane (C 2 H 6 ), Table 6: National Value Summary for Total NGL and LRG, Table 7: National Summary of Direct Employment and Wages Associated with Odorized Propane 26 Table 8: Employment and Wages in Odorized Propane and Related Industries, Table 9: Odorized Propane (C 3 H 8 ) Employment and Wages Summary, Table 10: Propane (C 3 H 8 ) Employment and Wages Summary, Table 11: Total NGLs / LRGs Employment and Wages Summary, Table 12. National-Level Odorized Propane Consumption by Sector Table 13: State Value Added, Employment, and Wages for Odorized Propane, Table 14: State Production attributed to Odorized Propane (C 3 H 8 ), Table 15: State Level Value Summary for Odorized Propane (C 3 H 8 ), Table 16: State Level Value Summary for Propane (C 3 H 8 ), Table 17: State Level Value Summary for Total NGLs / LRGs, Table 18: Primary Space Heating Fuel, by Household, by Census Region, Table 19: Primary Space Heating Fuel, by Household, by State, Table 20. NAICS Codes and Definitions
8 1. Introduction and Summary 1.1. Introduction Propane is the third most widely used fuel in the U.S. by the number of households, second to electricity and natural gas. All told, propane is used in roughly 50 million American households, with 7.8 million households using propane for in-home heating, 5.5 million of which depend on propane as their primary space heating fuel. 1 In addition, 4.6 million homes use propane for water heating and over 42 million homes use propane for outdoor grilling activities. 2 In addition to the significant role propane plays in the residential sector, the propane industry directly serves about 900,000 commercial customers, 168,000 industrial customers, and 320,000 agricultural customers. 3 Propane also continues to be the most common internal combustion fuel for forklifts and has rapidly become the third most common fuel for school buses. U.S. internal combustion demand accounts for 10 percent of domestic retail consumption, and ICF estimates that in the U.S. nearly 143,000 vehicles used propane as fuel in In recognition of the important role propane plays in the U.S. energy marketplace, the Propane Education & Research Council (PERC) has commissioned ICF to perform what is now the fourth analysis of the impact of the odorized propane industry on the national and state economies. Previous iterations of the report were released in 2004 (reporting estimates for 2002), in 2011 (reporting estimates for 2009), and in 2014 (reporting estimates for 2012). 5,6,7 As with past releases, the focus of this report is to estimate the aggregate GDP impacts due to propane industry activity, as well as the contribution of the odorized propane industry to employment and wages both on the national level and from a state-by-state perspective. Following record cold weather experienced during the 2013/14 winter Polar Vortex, 2015 was the second warmest year recorded in the U.S. Lower 48, second only to The warm weather impacted consumption across all sectors, with particularly pronounced declines in consumption in the residential sector for space heating, and in the agricultural sector for grain drying. As a result, 1 American Community Survey year estimates, U.S. Census Bureau, Washington, DC, October Residential Energy Consumption Survey (2015), Energy Information Administration, Washington, DC, February Sales of Natural Gas Liquids and Liquefied Industrial Gases, American Petroleum Institute, Washington, DC January Alternative Fuel Vehicle Data (2011), Energy Information Administration, Washington, DC, April Harry Vidas, Bruce Henning, and Bob Hugman, Study of the Propane Industry s Impact on U.S. and State Economics, Energy and Environmental Analysis, Inc., Arlington, VA, November Wilczewski, Warren; Sloan, Michael, Propane Industry Impact on U.S. and State Economies, ICF, Fairfax, VA, November Wilczewski, Warren; Sloan, Michael, Propane Industry Impact on U.S. and State Economies, ICF, Fairfax, VA, March is Earth s warmest year by widest margin on record, National Oceanic and Atmospheric Administration, Washington, DC. Available at: 1 P age
9 2015 resulted in the second lowest consumer propane sales in over a decade, with only 2012 sales being lower. Overall, API reported odorized propane sales increased 9.2 percent between 2012 and 2015, from 7.7 billion gallons to just over 8.4 billion gallons. Roughly 71 percent of this increase can be attributed to increases in residential consumption, primarily driven by colder weather, with some growth in the number of propane heated households in the U.S. Northeast. Total employee count attributed to the odorized propane industry increased 7.6 percent, while payroll expanded 8.4 percent Key Changes from 2012 to 2015 The odorized propane industry s direct economic impact increased to $46.2 billion in 2015 an increase over the 2012 impact of $40.5 billion. This increase was primarily supported by three key factors: 1. Growth of domestic propane supplies, 2. Increased retail margins of propane retailers, and 3. An increase in total propane consumption. The growth in the domestic component of the odorized propane market, which is the amount of the propane consumed in the U.S. that was also produced domestically, experienced an increase in value increased from $38.8 billion in 2012 to $45.2 billion in Over this same time, there was a 44.4 percent increase in domestic propane production. From 2012 to 2015, the retail margins for propane retailers increased. This increase in retail margins was due to the combination of both a recovery in sales volumes, reducing per-unit fixed costs, as well as retail prices falling at a slower pace than underlying wholesale costs. For instance, from 2012 to 2015 Mont Belvieu propane prices declined 54.8 percent, from 100 /gallon in 2012 to 45.3 /gallon in While compared to 2012, the EIA s reported 2015 residential heating oil prices averaged 215 /gallon, 9 only a 13% decline from the 247 /gallon average in Using the EIA SHOPP data, ICF estimates the average retail price of propane in 2015, which accounts sales in other categories and sales during the summer months, averaged 185 /gallon. 10 From 2012 to 2015 there was a 9.2 percent increase in retail consumption, from 7.74 billion gallons in 2012 to 8.45 billion gallons in Weather was the dominant factor influencing annual perhousehold consumption and accounts for the majority of the 505 million gallon increase in residential consumption between 2012 and In fact, 2015 was the second warmest year on 9 The EIA s State Heating Oil and Propane Price (SHOPP) survey reports weekly propane prices for the heating season from October to March. In 2014 the EIA added 16 new states to the SHOPP survey, which may impact direct national residential pricing estimates. 10 The 2015 average residential includes January to March of the 2014/15 winter season and October to December of the 2015/16 winter season. ICF utilizes the residential SHOPP data to estimate prices in other demand sectors of the retail propane industry 2 P age
10 record for the continental U.S., second only to In fact, temperatures in 2015 were 5.8 percent warmer than the 20-year average, while in 2012 they were 13.1 percent warmer. 11 Other factors have also impacted overall consumption levels from 2012 to These include things such as improvements in energy efficiency and fuel switching technologies, which reduce per-household fuel use due to increases in the average fuel efficiency for in-home appliances. The agricultural sector experienced a modest increase from 2012 to 2015, growing by 1.3%, with a reduction in demand from crop drying partially offsetting the growth in demand from other agricultural applications. Demand from internal combustion increased by 7.1% from 2012 to New propane engine applications and growth of on-road vehicle sales helped to support this sector s growth, which is expected to be one of the retail propane industry s key growth driver in the coming years. Table 1. Comparison of 2009, 2012 and 2015 Propane Production and Consumption (Million Gallons) Change from 2012 to 2015 Domestic Propane Production 12,830 15,154 21, % Propane Imports 1,933 1,303 1, % Propane Exports 1,299 2,625 9, % Propane Consumption 9,598 7,739 8, % Residential 5,565 4,074 4, % Commercial 1,499 1,482 1, % Industrial % Agricultural % Internal Combustion 1, % Resell % Heating Degree Days (Annual) 4,423 3,792 4, % Mont Belvieu Propane Price ( /gallon) % Source: ICF, EIA, API, Bloomberg, NOAA 1.3. Economic Added Value from the Retail Propane Sector In 2015 the odorized propane sector contributed $14.6 billion in direct added value to the nation s economy. In 2015, roughly 53 percent of the total added value of the odorized propane industry was attributed to the retail portion of the sector, or $7.8 billion, which averaged 92 /gallon sold. This was a 37 percent increase from 2012 levels. The wholesale sector also experienced an increase in the direct value added to the national economy, also supported by increased sales volumes, contributing $2.4 billion to the U.S. economy 11 As defined by the National Oceanic and Atmospheric Administration (NOAA), a heating degree day (HDD) is a quantitative index demonstrated to reflect demand for energy to heat houses and businesses. Heating degree days are summations of negative differences between the mean daily temperature and the 65 F base;. For more information, see NOAA s explanation page at 3 P age
11 in 2015, or 21 /gallon sold. The direct added value of the supply segment of the odorized propane sector experienced a 29 percent decline from 2012 levels, contributing $4.4 billion to the U.S. economy. Figure Odorized Propane s Total Direct Value Added by Value Chain Component $Billions Source: ICF Propane Value Study (2015) On a geographic basis, the total direct value of the odorized propane sector increased from 2012 to 2015 most dramatically in the Northeast and Midwest regions, with a small increase in the Western U.S. The Southern U.S. experienced a minor decline in the direct economic contribution from the odorized propane sector, which was driven primarily by declines in Texas due to the reduced economic contribution of the supply segment from lower propane prices. New England saw the added economic value from propane increase 62.3 percent between 2012 and 2015, while the South Atlantic and Middle Atlantic census regions both experienced gains in excess of 40 percent. Due to the decline in value added from propane supply activities such as propane production, processing, and fractionation, the West South Central and Mountain census regions experienced declines in the value contributed from the Odorized (Retail) propane sector. Figure 2. Odorized Propane s Total (Direct & Indirect) Added Value by U.S. Census Region Supply Wholesale Markup Retail Markup $Billions East North Central East South Central Middle Atlantic Mountain New England Pacific South Atlantic West North Central West South Central Source: ICF Propane Value Study (2015) 4 P age
12 1.4. Growth of Domestic Propane Production and Exports One key factor to the increase in added value of propane to the U.S. economy is due to the expansion of domestically produced and sourced propane, which has also resulted in the U.S. becoming the largest propane exporter in the world. Propane production in the U.S. has increased markedly with the increases in shale gas and associated gas production from U.S. tight oil plays. Additionally, increased oil production from new tight oil plays also has increased the volumes of propane produced from domestically sourced crude oil. Domestic propane production from gas plant processing has grown 60 percent from 2012 to 2015 to a total of 17.5 billion gallons in While propane produced from domestic crude oil grew 39 percent, reaching 2.6 billion gallons in U.S. produced crude in the country s refinery feedstock increased from 43 percent in 2012 to 56 percent in 2015 as a result of growing domestic oil production. As a result of the growing domestic propane supply, the domestic contribution to the odorized propane industry continues to grow even as imported propane remained relatively stable. The value added from U.S. sourced propane increased from 87 percent in 2012 to 93 percent in Including Canada, value added in the odorized propane industry attributable to North American labor and resources increased from 92 percent in 2012 to 97 percent in The share of the volumes of odorized propane consumed in the U.S. produced from U.S. resources increased from 74 percent in 2012 to 82 percent in When imports of Canadian purity propane and refining and gas plant feedstock are included, North American contribution to volumes increased from 89 percent in 2012 to 94 percent in 2015, with the remaining propane volume derived from imported crude oil. Following this rise in propane supply, exports have grown substantially to become the largest source of demand. In 2015, over 9.4 billion gallons of propane were exported, which marked the first year that propane exports have exceeded retail propane consumption. Propane exports are expected to continue to increase both in volume and in the share of domestic production that they support, bolstered by several new major propane export terminals coming online in 2016 that have increased the total U.S. export capacity to 23.3 billion gallons per year. Despite the projected longterm increases in propane exports that these facilities will support, it is expected that there will be significant underutilized capacity in the near-term as markets adjust to changing supply and demand conditions. 5 P age
13 Figure 3. Monthly U.S. Propane Export Capacity and Actual Exports 2,000 1,800 Million Gallons per Month 1,600 1,400 1,200 1, Jan-12 Mar-12 May-12 Jul-12 Sep-12 Nov-12 Jan-13 Mar-13 May-13 Jul-13 Sep-13 Nov-13 Jan-14 Mar-14 May-14 Jul-14 Sep-14 Nov-14 Jan-15 Mar-15 May-15 Jul-15 Sep-15 Nov-15 Jan-16 Mar-16 May-16 Jul-16 Sep-16 Nov-16 Jan-17 Mar-17 U.S. Propane Exports U.S. Propane Export Capacity Source: EIA, ICF 1.5. Methodology and Scope of Analysis To perform a detailed value-chain analysis for odorized propane at the state level ICF took a twostep approach: one, to identify all points along the pathway from the wellhead to the burner tip where value is added; and two, to allocate these values to individual states. The primary source of propane production and inventory data is the Energy Information Administration (EIA). Because data reported by the EIA is primarily available only at the PADD 12 level, or in some cases at the refining district level 13, the data reported by the EIA was allocated to the state level by ICF. For this task, ICF employed a number of sources, both proprietary and public. The comingling of various natural gas liquids (NGLs) at several levels of production and transport, as well as the lack of data on the individual components of the NGL-mix, resulted in the need to perform a full sector analysis that evaluated the volume and value chains of all NGL purity products. Through this process ICF was able to arrive at detailed estimates of both the share of total gallons and the share of value attributable to odorized propane. As a result, this study includes value tables for the total NGL complex, as well as the subsets of all propane, odorized propane, butanes, and ethane. By evaluating the full value chain for all liquids and the propane component in particular, the analysis resulted in estimates of the economic impact of odorized propane at the three stages of 12 The Petroleum Administration for Defense Districts (PADDs) are geographic aggregations of the 50 States and the District of Columbia into five districts: PADD 1 is the East Coast, PADD 2 the Midwest, PADD 3 the Gulf Coast, PADD 4 the Rocky Mountain Region, and PADD 5 the West Coast. Due to its large population, PADD 1 is further divided into sub-padds, with PADD 1A as New England, PADD 1B the Central Atlantic States, and PADD 1C comprising the Lower Atlantic States. (Energy Information Administration, available at: 13 Refining Districts are PADD sub-regions, also defined by the Department of Energy. For a detailed description of refining districts, see: 6 P age
14 the supply chain: production, wholesale transport and storage, and retail. That impact, measured in terms of employment, wages, and gross domestic product (GDP) is then allocated at the state level. 1 Production This study is focused solely on natural gas liquids purity products. 14 This approach, a result of ICF s in-house analysis and the employment of newly-available data sources, allows for a more accurate representation of the impact of the natural gas liquids industry on the U.S. economy. The result is a study that is both more useful to the propane industry and better able to report the value and volume chains of the butanes component of the NGL mix. Leveraging more accurate and complete data sources also allows for a more accurate tracking of product imports into the country, in terms of both quantities of products and ports of entry. The analysis of propane production includes volumes produced from natural gas feedstocks via gas processing plants and fractionators as well as those produced as byproducts of the crude oil refining process. ICF calculations represent the volumes and values of natural gas liquids in the gas processing sector at a more detailed level than in previous studies, primarily by better applying data from both the EIA and internal sources on the raw gas quality produced in the various regions of the country. This approach more accurately credits natural gas liquids (NGLs) entrained in raw gas to those states where production takes place. A similar approach has also been employed to Liquefied Refinery Gases (LRGs) produced in refineries out of domestic and imported crudes. Crudes of varying qualities are credited with different shares of liquids yields, both by U.S. state, and for imported crudes. This data was not available in prior years, and its inclusion again provides for a more accurate assessment of where propane volumes and values are generated at the state level. 2 Midstream ICF estimates for Midstream contribution to the value added generated by natural gas liquids include all activity in the transportation, storage, and wholesale stage of the value chain. These estimates are based on reported transportation costs of purity and mixed NGLs, reported volumes of product moved on all modes of transportation, and estimates of transport required within states in both upstream production activities and downstream retail activities. These costs are then allocated to the various purities, to propane specifically, and in the end to the odorized propane component of the market. Values allocated to the states include: All inter- and intra-state pipeline, surface, and water-borne transport of natural gas liquids. Both gathering lines that carry liquids entrained in raw natural gas and pipelines that move unfractionated raw NGLs are included. Special accounting is also made of liquids moved in dense phase along with natural gas along the Alliance pipeline. All activities associated with the shipment of purity propane from production regions to wholesale markets, such as Mont Belvieu and Conway, and on to the consumption centers. Accounting is also made of value added by wholesale activities. Value is also allocated to the market balancing services provided by storage operators. 3 Downstream The retail sector is the largest source of employment directly attributable to the odorized propane industry. It also generates 64 percent of all value added for the retail propane sector and 42 percent for the entire propane sector. LPG dealers are responsible for 98 percent of all value at the retail 14 Natural Gas Liquids purity products include Ethane, Ethylene, Propane, Propylene, Normal Butane, Iso- Butane, Butylene, and Pentanes Plus. 7 P age
15 level, with gasoline stations contributing the remainder, due to their propane sale volumes. Total GDP impact of the retail sector is calculated as the difference between the value of propane at wholesale that is attributed to the odorized propane industry and the value of that same propane at the point of delivery to the customer. The total contribution of the retail industry is then allocated to the states depending on a) that state s share of total gallons sold, and b) the total gallons of propane sold at the consumer level through gasoline stations (this includes gallons attributed to the motor vehicle market as well as propane cylinder sales done through gasoline stations). Update to Retail Prices Methodology One key update to the methodology in the 2015 Value Study compared to prior studies is related to assumption and information used to estimate the odorized propane sector s average retail pricing. These differences have been primarily driven by changes in the availability of data. ICF has expanded the use of pricing information from the EIA s State Heating Oil and Propane Price (SHOPP) pricing data for information on residential and wholesale prices. The EIA s SHOPP service reports weekly residential and wholesale propane prices over the winter heating season (October to March). In 2014, 16 states were added to the survey, increasing the total number of states reported to 38 state, and providing additional coverage to calculate regional and national prices based on propane consumption at the state level. Prior ICF Propane Value studies has relied on EIA reported retail propane pricing information by each consumption sector (Residential, Commercial, Industrial, Resell), however, this reporting program was suspended in Due to the fact that this sector level pricing information is now several years out of date, ICF has estimated the retail pricing for each sector based on the underlying SHOPP information for Residential prices and analysis of shipping costs and margin expectations for each of the other retail propane sectors. 8 P age
16 1.6. Summary of Results The basic results of the ICF analysis are shown in a series of value-chain and volume-chain diagrams. The detailed results, including volumes, value and prices for each step in the value chain are shown in Figure 4 through Figure 13. Explanation of Value/Volume Chain Diagrams Each of the ten value/volume chain diagrams illustrates the flow of values or volumes for one of the product categories considered: (Odorized Propane, Propane, Propane/Propylene, Ethane, and Total NGLs/LRGs). These diagrams depict the total product supply process, from the wellhead to the burner tip. They are organized horizontally by supply source, with crude oil and refining at the left, natural gas and natural gas processing and fractionation in the center, and imports and inventory changes at the right. Vertically, the diagrams start upstream, indicating the value/volume of inputs. Thus, the top left box contains the value/volume in domestically-produced crude converted to product shown. The diagrams split out the contribution to the value/volume chain from Canadian resources. Thus, the second box down shows the value in Canadian crude/ wet natural gas imported into the U.S. and converted to the product shown in the diagram, and the box below sums up domestic and Canadian inputs into a North America total. The fourth box down then adds in non-north American crude to sum up to total value/volume of crude converted to product. LNG imports from outside North America are not processed for NGL extraction. The column on the right shows the import/export balance. The top box shows the total value/ volume of product exported from the United States. The second box in the Product Imports/ Exports column shows the value/volume of product imports from Canada. Third box down shows the total imports from outside North America, with the box below netting out imports and exports to arrive at the total net imports of product into the U.S. Net inventory changes for the year, calculated as the difference in inventory levels between January 1 st and December 31 st of 2015, are not shown. Positive numbers indicate net storage withdrawals, which add to total supply, and therefore to total value/volume contributed to the economy in that year. The processing, or midstream, section of the diagram shows value added in the refining, natural gas processing, and fractionating stages of NGL/LRG production (the volume chain diagrams do not show Processing and Market Services sector contributions, as these do not add to volume). For refining, this value represents the difference between the Refiner Acquisition Cost of Crude (RACC) and the wholesale value of product on a $/MMBtu basis. A negative number indicates a discount, on a Btu basis, of product to crude price for the year. The processing and fractionation value is the total value added by the natural gas processing industry in the processing of both domestic and Canadian gas (at the Aux Sable plant in Illinois). Below the processing sector is the market services section, which adds in the value of wholesaling services and retail markup. For wholesaling services, the total is the difference between the supply and wholesale pricing points. Retail services are the final component of the value chain, and represent the difference between the wholesale value of the product and the total retail value at the ultimate point of consumption. Both the value chain analysis diagram and the volume chain diagram to its right show at bottom the share of domestic and North American value/volume contribution to the total product consumption in the 9 Page United States.
, 2015 (Million Dollars)")
17 Figure 4: Value Chain for Odorized Propane (C3H8), 2015 (Million Dollars) 10 P age
18 Figure 5: Volume Chain for Odorized Propane (C3H8), 2015 (Thousand Gallons) 11 P age

 12")
19 Figure 6: Value Chain for All Purity Propane (C3H8), 2015 (Million Dollars) 12 P age
, 2015 (Thousand Gallons) 13")
20 Figure 7: Volume Chain for All Purity Propane (C3H8), 2015 (Thousand Gallons) 13 P age

")
21 Figure 8: Value Chain for Butanes (C4H10), 2015 (Million Dollars) 14 P age

")
22 Figure 9: Volume Chain for Butanes (C4H10), 2015 (Thousand Gallons) 15 P age

")
23 Figure 10: Value Chain for Ethane (C2H6), 2015 (Million Dollars) 16 P age
, 2015 (Thousand Gallons) 17 P")
24 Figure 11: Volume Chain for Ethane (C2H6), 2015 (Thousand Gallons) 17 P age


25 Figure 12: Value Chain for All NGLs and LRGs, 2015 (Million Dollars) 18 P age

")
26 Figure 13: Volume Chain for All NGLs and LRGs, 2015 (Thousand Gallons) 19 P age
27 Table 2: National Value Summary for Odorized Propane (C3H8), P age
, 2015 21 P")
28 Table 3: National Value Summary for All Purity Propane (C3H8), P age
, 2015 22 P")
29 Table 4: National Value Summary for Butanes (C4H10), P age
30 Table 5: National Value Summary for Ethane (C2H6), P age
31 Table 6: National Value Summary for Total NGL and LRG, P age
32 2. Findings 2.1. Employment and Wages in the Odorized Propane Industry Direct Employment This study assesses the level of employment in the propane industry by state for While no single, comprehensive classification under the North American Industrial Classification System (NAICS) captures all employment and wage data associated with the natural gas liquids industry or especially with the retail propane industry in particular ICF has identified those industrial segments where the employees working in the propane industry would be classified, including in the production, transportation, and distribution of propane, and has allocated employment in these industries accordingly, based on the contribution of the propane industry within each segment. Current analysis of total employment and wages attributable to the retail propane industry includes data obtained from the Bureau of Labor Statistics (BLS), the main source for labor-related data in this report. As of the writing of this report, the most recent year for which a full set of employment and wages data was available is 2016, but 2015 data was used for consistency with other reported values that did not have final 2016 values. The BLS s Quarterly Census of Employment and Wages (QCEW) served as the primary source of labor and wage statistics for all Propane Industry Economic Impacts studies performed by ICF, including the 2004, 2009, and 2012 reports, as well as the current report based on 2015 data. The Bureau of Labor Statistics defines the census as a comprehensive tabulation of employment and wage information for workers covered by state unemployment insurance (UI) laws and federal workers covered by the Unemployment Compensation for Federal Employees (UCFE) program. This definition in effect covers 98 percent of the U.S. legal labor force outside of the agricultural sector. The QCEW therefore serves as the primary data source for employment statistics across the U.S. economy, with statistics reported down to the county and metropolitan area level on a quarterly and annual basis, with monthly estimates. Due to a number of data gathering and release restrictions, including the withholding of values to protect the anonymity of large employers, employment and wages data may not be available for all geographies in all periods. ICF attempts to account for these data disclosure restrictions by estimating state level data based on the national totals, which are given for all categories in the data series, and other data that is available at the state level. In the second quarter of 2011 the NAICS codes for Heating Oil Dealers and LPG Dealers were merged, and all economic statistics for these two classifications are now summed and reported under the Fuel Dealers classification. ICF accounted for this data reporting issue by attributing employment and wages to each category based on a combination of state-level historical trends, including total gallon sales, customer numbers, and sales per account for both propane and Fuel Oil usage. ICF also considered other reported propane employment reports, including the LP Gas Top 50, and macro-level economic drivers in its determination of state-level wage and employment data. For the 2015 report, ICF also includes a total of 11 different employment and wage industry classifications. A full listing and description of these 11 NAICS categories can be found in Appendix A. For the purposes of this study, the three stages of the value chain and their associated NAICS categories are identified as follows: 25 P age
, Refined Petroleum Product Pipelines (48691), Natural Gas Pipelines (4862), and Wholesale Petroleum Trade (4247) Retail (Distribution): Gasoline Stations (447),")
33 Production: Oil and Gas Extraction (NAICS Code ), NGL Extraction (211112), Drilling Oil and Gas Wells (213111), Support Activities for O&G Operations (213112), and Petroleum Refining (32411) Transportation: Crude Pipelines (4861), Refined Petroleum Product Pipelines (48691), Natural Gas Pipelines (4862), and Wholesale Petroleum Trade (4247) Retail (Distribution): Gasoline Stations (447), Fuel Dealers (45431), and LPG Dealers (454312) In order to disaggregate employment in the odorized propane industry from the broader categories reported in the QCEW data, ICF quantified the share of value component attributed to each output along the production chain, estimating the share of employees and wages coming from: 1) the total NGLs industry; 2) propane industry as a whole; and lastly 3) the odorized propane industry. Total wages for the 11 classifications in 2015 were nearly $105 billion, compared to nearly $100 billion in Growth in wages was again concentrated primarily in the upstream and midstream segments of the overall industry (See Table 7). Of the total wages for these industries, production accounts for two thirds, followed by 19 percent from the retail sector and 13 percent in the transportation sectors. Wages attributed to the odorized (retail) propane sector, the retail component accounts for the majority of wages with a total of 61 percent, followed by the production sector with 33 percent and 6 percent in the transportation sector. From 2012 to 2015, wages attributable to the odorized (retail) propane sector increased by 7.3 percent to $3.3 billion. The indirect and induced wages and employees supported by the odorized propane sector total $4.1 billion. 15 Table 7 below summarizes the employment and wages directly associated with the odorized propane industry at every step in the value chain. For state-by-state details, see Table 9 through Table 11. Table 7: National Summary of Direct Employment and Wages Associated with Odorized Propane 15 Indirect employment are employees or workers that do not directly produce the goods and services directly related to that sector and are not readily available, but indirectly support the workers in that industry. Induced employment are the jobs that are created from that sector s employees spending their money in the economy. 26 P age
34 Accounting for odorized propane industry s contribution to total value, an estimated total of 53,963 full time employment positions are directly attributable to the production, transportation, and distribution of odorized propane, accounting for 3.1 percent of all employees in the eleven industrial categories. The majority of these jobs (78 percent) are on the retail, or distribution, side of the industry Direct Wages For this study, data on wages by NAICS category was also sourced from the Bureau of Labor Statistics Quarterly Census of Employment and Wages. ICF estimated the total 2015 wages per sector attributable to NGLs, purity propane, and odorized propane using the same total-value-toodorized-propane-value ratios used to allocate employment. The share of employment attributable to the product categories was estimated individually for each of the eleven NAICS codes included in the study. These estimates are found in Table 8 below. Summary totals for each product by industry segment are shown in Table 7 above. More detailed state-level estimates of national-level wages by NAICS code are shown in the rightmost columns of Table 8, while state-level data for total Production, Transportation, and Retail can be found in Table 9 through Table 11. As shown in Table 8 on the following page, direct wages generated by the odorized propane industry totaled $3.2 billion in 2015, representing 2.7 percent of all wages generated by the eleven employment categories included in the odorized propane value chain, and employees 2.8 percent of the total employment for the eleven categories. This close relationship between odorized propane industry s share of total labor and total wages reflects the impact the industry has along the full value chain. Within the sector, however, there are wide disparities in wages per employee, with annual income in the supply segment on average double the wages in the retail segment. Relative to 2012, per-employee average wages in the propane industry increased roughly 1 percent in nominal terms, from $59,600 in 2012 to $60,260 in The average per-employee wage in the retail segment of the odorized propane sector increased to $46,428 per year, which was well above the growth in wages reported for all labor categories covered by the Bureau of Labor Statistics QCEW, which reported average U.S. worker wages increased in nominal terms from $49,300/yr in 2012 to $52,900/yr in 2015 an increase of 8.9 percent over three years, more than doubling the cumulative inflation during the same period. 16 The fastest wage growth was observed in the upstream segment of the propane value chain, as the tightening labor market in oil and gas drilling caused wage escalation well above the national trend. 16 Consumer Price Index Chained Consumer Price Index, Series Id: SUUR0000SA0, Bureau of Labor Statistics, Washington, DC. Available at: 27 P age
35 2.1.3 Indirect and Induced Employment and Wages The odorized propane industry has an impact on the economy beyond the direct employment and wages it generates. As companies in the production, transportation, and distribution segments of the value chain employ services that supply their operations (indirect economic impacts), or as the workers directly employed in the odorized propane industry spend their income and create demand for goods and services (induced economic impacts), the benefits of their spending lead to further employment throughout the U.S. economy. ICF estimates that for 2015, in addition to the 53,964 jobs directly created by the odorized propane industry, another 37,775 indirect and induced full time jobs can be attributed to the industry, with indirect and induced wages adding another $4.1 billion to the total wages that can be attributed to the odorized propane industry in addition to the $3.2 billion from direct wages. 28 P age
36 Table 8: Employment and Wages in Odorized Propane and Related Industries, P age

")
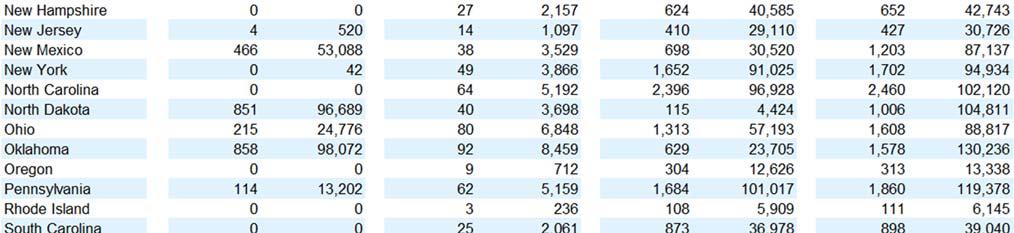
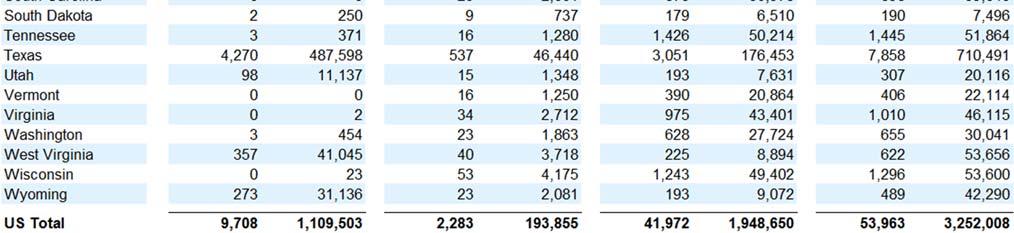
37 Table 9: Odorized Propane (C3H8) Employment and Wages Summary, P age

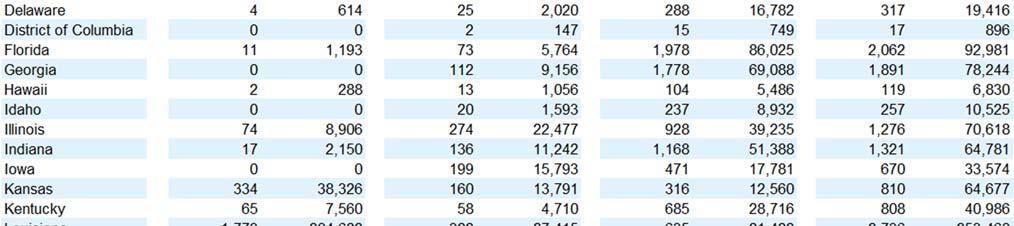
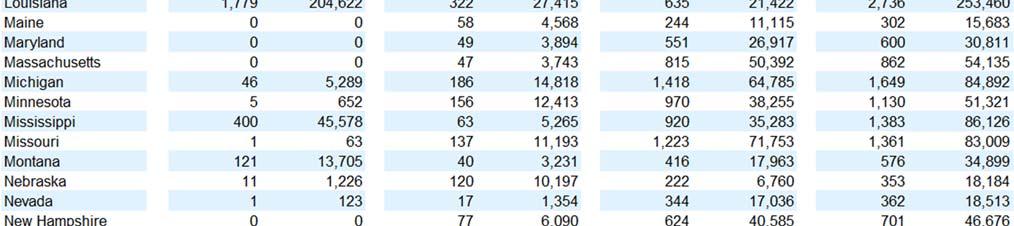
38 Table 10: Propane (C3H8) Employment and Wages Summary, P age

39 Table 11: Total NGLs / LRGs Employment and Wages Summary, P age
40 2.2. Economic Impact of the Odorized Propane Industry Direct Economic Impact The study of the impact of the U.S. consumer propane industry on the national and state economies is based upon a bottom-up approach to economic value assessment. Because the odorized propane industry sources its product from total U.S. purity propane supply, and because that purity propane is the product of both the refining and gas processing industries output of natural gas liquids (NGLs) and liquid refinery gasses (LRGs), ICF s approach to value calculation for the odorized propane industry attempts to trace the flow of all NGLs through the economy from the wellhead to the burner tip across all sources of production. To estimate the state level direct economic impact of the odorized propane industry, ICF uses API s reported totals for 2015 odorized propane sales by sector, 17 to allocate the national direct economic impacts volumes among the states. A national summary of the sector specific retail propane consumption for 2015 is shown in table 12 below. Table 12. National-Level Odorized Propane Consumption by Sector Retail Sector Consumption (Million Gallon) Percent of Total Consumption Residential 4, % Commercial 1, % Sales to Resellers % Internal Combustion % Industrial % Agricultural % Total U.S. Odorized Propane Demand 8,451 Source: American Petroleum Institute, 2015 Sales of Natural Gas Liquids and Liquefied Refinery Gases, ICF Various data sources are also used to estimate the value of these gallons across the federal and state economies. These include data reported by Bloomberg, industry publications on wholesale and regional rack prices for propane, EIA reported retail prices for the heating season, and ICF s modeled estimates for retail propane prices at the state level for all months and sectors not reported by the EIA. This comprehensive approach to volume and price aggregation allows for the estimation of not only the total value of odorized propane on the U.S. market, but also of all purity propane, ethane, butanes, and pentanes plus. National-level estimates for total value along the full production chain for odorized propane and purity NGLs are found in Table 2 through Table 6. Detailed estimates of the impact of the odorized, total purity propane industry, and all NGLs are found in Table 15, Table 16, and Table Upstream Tracing the value added by the propane industry in the upstream sector begins by accounting for crude oil and natural gas inputs into refining and gas processing facilities. ICF used EIA data in combination with in-house proprietary information, such as gas and crude oil quality and transport infrastructure (pipelines, barges, rail, etc.) capacity, to estimate production of crude oil, lease condensate, and natural gas at the state level (see Table 14). This data was then combined with Sales of Natural Gas Liquids and Liquefied Refinery Gases, American Petroleum Institute, January Page
41 information on the composition of gas produced and refinery yields from various crudes to estimate total quantities and values of natural gas liquids and subsequently odorized propane - produced at the state level. ICF estimates the total value of natural gas liquids (also referred to as Liquefied Refinery Gasses) coming from domestic crude at nearly $4.2 billion, with odorized propane s share of LRGs in domestic crude at $725 million. We estimate the value of NGLs produced from U.S. natural gas production at nearly $10.7 billion, with odorized propane s share of NGLs in raw domestic gas at $1.3 billion. The total value of imported NGLs and LRGs from imported crude oil commodities is estimated at $3.6 billion, with $1.4 billion from imported Canadian crude oil and $2.2 billion from imported crude oil from the rest of the world. Odorized propane accounted for $249 million of Canadian crude import value and $376 million from other crude oil imports. The total Imported Product Value of NGLs is estimated to at $3 billion, with $2.3 billion imported from Canada. This value does not include the value of NGLs present in imported natural gas, which is estimated at $456 million. Odorized propane accounts for $576 million of the imported product value and $48 million of the NGLs included in the imported natural gas, which is processed at the gas processing plant Aux Sable in Illinois. 2 Midstream Accounting for value added generated by the midstream sector includes estimates for the economic contribution from the refining and gas processing sectors, fractionation sector, and pipeline and other transportation, storage, and wholesale market activities. As with upstream values, ICF s calculations begin with an accounting of the total value produced by the natural gas liquids complex, a value subsequently apportioned first to individual purity products, and finally from purity propane to odorized propane. The share of refining revenues generated by natural gas liquids, and by propane, and odorized propane, specifically, continues to fall, resulting in declining value added from the refining sector. From 2012 to 2015, U.S. oil prices declined nearly 50 percent to an average of $48 per barrel, while propane prices fell 54.5 percent over the same time period to average $45.7 /gallon. Propane s share of total refinery output (measured in retail value) declined slightly, from 1.14 percent in 2012 to 1.01 percent in 2015, while the share of production from refineries declined from 2.4 percent in 2012 to 2.3 percent in For gas processors and fractionators the continued low natural gas prices mean liquids produced out of the raw natural gas provided a significant uplift to dry gas prices, with the notable exception of ethane. Due to an over-supplied market, ethane traded near parity with natural gas in Despite this anomaly, overall declines in the value of crude oil and related petroleum products relative to natural gas resulted in the value added from gas processing generating 56.8 percent of the value in NGLs produced from natural gas in 2015, down from 69 percent in The majority of this value was generated from heavier NGLs, specifically butanes and pentanes, accounting for $10.8 billion in added value. Propane accounted for $3.3 billion of all value added generated by the gas processors in 2015, while $2.4 billion, or 22 percent of the total, can be attributed to odorized propane. The trend of an increasingly higher share of value from natural gas production generated from the liquids extracted continues to favor natural gas development to more NGL rich areas of production. There has also been a dramatic increase in associated gas production from expanding development of U.S. tight oil resources, such as the Bakken and Eagle Ford shales and Permian 34 P age
42 region. Associated gas production contains high levels of NGLs within the natural gas production stream, which has supported the dramatic increase in domestic NGL production from gas processing. This expansion in NGL production has facilitated an increase in value despite a reduction in the price for NGL prices. The industry s focus on the development of NGL rich gas resources has also occurred in Canada, resulting in higher NGLs production, bolstered by the development of the Montney tight gas resources and Duvernay shale. Total NGL imports from Canada increased from 2,163 million gallons in 2012 to 2,239 million gallons in 2015, including those of propane, which rose from 1,497 million gallons in 2012 to 1,643 million gallons in The value of odorized propane imported from Canada was $414 million in 2015, down sharply from the $742 million in This decline in imported propane attributed to occurred despite the fact that total propane imports only declined by 12% from 2012 to 2015, the increase in propane exports relative to retail propane demand results in fewer imported propane gallons from Canada being attributed to the odorized propane sector. ICF used in-house data on pipeline capacity and throughput, pipeline tolls, and estimates of total transportation costs for wet natural gas and natural gas liquids to calculate the value added by the transportation sector. These estimates consider value added throughout the entire transportation sector, which includes gathering lines, intra- and inter-pad pipelines moving various grades of NGLs from producers and fractionators to wholesalers and distributors, and terminaling services offered at export and import facilities throughout the country. ICF estimates midstream value added for all NGL products to be $13.7 billon, including: $10,885 million for storage and wholesaling services of NGLs, including $2,410 million for wholesaling services attributed to odorized propane. $1,648 million for long-distance transportation of NGLs, including $135 million for longdistance transport attributed to odorized propane. $1,081 million for intra-pad transportation of NGLs, including $139 million for intra-pad transport attributed to odorized propane. 3 Downstream The total retail value for odorized propane is calculated based on total volumes of propane delivered to final consumers, by category of consumer, as well as the prices paid by those consumers, based on consumer type and geography. For this study ICF based volumes of odorized propane sold in the consumer market on the American Petroleum Institute s 2015 Sales of Natural Gas Liquids and Liquefied Refinery Gases survey. For those states and customer types where API withholds data to avoid disclosure of individual company data, ICF estimated values based on inhouse modeling using the Propane Database and Forecast Model (PDFM). 18 Pricing information for odorized propane is drawn from the Energy Information Administration s database of retail prices by region 19 and industry, wholesale and rack prices reported on Bloomberg, state heating fuel pricing 18 The Propane Database and Forecast Model (PDFM) is a proprietary model that ICF utilizes to forecast all sectors of the U.S. retail propane sector, including Residential, Commercial, and Industrial, Agricultural, Resell, and Internal combustion demand. The PDFM utilizes multiple data sources and regressions to forecast annual and monthly propane consumption based on a variety of forecast metrics, including economic growth, weather, energy efficiency, economic growth, housing trends, and the adoption of propane engines across multiple uses. 19 The EIA suspended publishing retail propane prices (Residential, Commercial, etc) by state in ICF has utilized historic relationships between sectors, Mont Belvieu wholesale propane prices, winter residential propane prices from EIA s State Heating Oil and Propane Price (SHOPP) state and regional Rack propane prices to estimate retail propane prices by sector and state. 35 P age
43 reports, as well as ICF s own estimates of retail prices based on in-house modeling and market data. The total value added attributable to the retail segment of the value chain is then calculated as the difference between the value of product at the wholesale level and the value of that product at the point of delivery to the ultimate consumer. For 2015, value added by the retail sector totals just under $7.8 billion dollars a 37 percent increase over the 2012 value. This increase in the added value attributable of the odorized propane sector was due to the combination of increased sales volumes from 2012 to 2015 and an increase in the retail margin of propane retailers. Propane retailer margins benefited from the combination of increased sales volumes allowing for a lower per-unit fixed cost basis and a lower decline in retail pricing relative to wholesale prices. On a per-gallon basis, average retail markup across all consumer groups increased from an estimated $73 /gallon in 2012 to $92 /gallon in As a percentage of total added value the contribution of the odorized propane segment, the added value from the retail portion as a percent of total added value increased from 39.8 percent in 2012 to nearly 53 percent in Indirect Economic Impact In addition to the direct impact an industry has on the economy, indirect impacts are generated that affect employment and wages, as well as value added that can be attributed back to that industry. The natural gas liquids industry indirectly impacts the U.S. economy through several channels. These include the inputs it procures, the taxes paid by the industry and its employees, and the activity generated by the products it sells, as well as any positive impact the industry generates further down the value chain in terms of demand spurred by the wages it pays and services it buys (generally referred to as induced impact). ICF s estimates for the indirect and induced value-added generated by the odorized propane industry can be found in Table 13 below. The 2015 ICF study used national level estimates of indirect and induced value added, and allocated this value throughout the U.S. economy at the state level. For odorized propane, the indirect and induced contribution to national GDP is estimated at over $30.6 billion. Including the $14.6 billion in direct added value from the odorized propane sector, the total economic contribution to the U.S. GDP is estimated at nearly $45.2 billion for The increase in the added value from the odorized propane sector, which experienced a 17 percent increase relative to 2012, is largely due to the three factors. These factors include 9 percent increase in gallons sold between 2012 and 2015, the increase in the margin and profitability of propane retailers, and the increased percentage of domestic propane production relative to total consumption Supported Industries and Employment The retail propane industry supports multiple domestic industries and jobs associated with the manufacturing, distribution, and sales of propane-related equipment, in addition to the direct and indirect/induced employment. The types of companies supported by the retail propane sector include companies that sell, distribute and manufacture residential and commercial appliances, engines, fireplaces, and barbeques, varied agricultural equipment used by the nation s farmers, and multiple types of internal combustion engines and generators used in personal, commercial and industrial applications. There are over 150 original equipment manufacturing companies that directly supply propane appliances or propane-fueled engines. These companies have offices, manufacturing facilities, and 36 P age
44 distribution outlets in nearly every state across the country. While it is not possible to explicitly quantify the total number of employees directly related to the retail propane sector, ICF believes that there are a large number of U.S. manufacturing, sales, and distribution jobs that are depend on the sales of propane related equipment. Original equipment manufacturers supporting the retail propane sector include traditional residential and commercial appliances such as space heaters, water heaters, clothes dryers, and indoor gas ranges. However, the retail propane sector also supports manufacturing jobs and companies outside of these more traditional sectors. Several additional manufacturing areas are highlighted below. Outdoor Propane Appliances Most Americans are familiar with propane through the use of propane-fueled grills or outdoor fireplaces. Of the 50 million U.S. households that use propane, over 42 million of those households have a propane-fueled grill or other type of outdoor propane equipment. 20 The proliferation of outdoor propane appliances supports U.S. jobs in manufacturing facilities, distribution and sales offices, and retail stores. One example of a U.S. company that is in part supported by the retail propane sector is Empire Comfort Systems. This company manufactures indoor and outdoor fireplaces, grills, and outdoor heating systems, including brands such as American Hearth, White Mountain Hearth, Empire Heating System, and Broilmaster Premium Grills. The company manufactures its products at two facilities located in Belleville, Illinois and has over 200 product distribution facilities across the country. Other equipment manufacturers include companies such as R.H. Peterson, Bull Outdoor Products, Woodland Direct, and Travis Industries. Propane-Fueled School Busses In recent years there has been a marked increase in the manufacturing and adoption of propanefueled school busses. There are currently three bus manufacturers offering propane-fueled options: Thomas Built Bus, IC Bus, and Blue Bird. The leading manufacturer of propane-fueled school busses is Blue Bird. The company primarily produces gasoline and diesel-fueled school busses, but they have recently experienced large growth from alternative fuel busses, including propane, that now account for 41% of its company s sales. Blue Bird has over 1,500 employees and its primary manufacturing facility is located in Fort Valley, Georgia. Blue Bird also has a parts distribution center located in Delaware, Ohio, and additional distribution offices across the country. The company has manufactured over 10,000 propane school busses through Propane Engines and Generators The Propane Education & Research Council and the retail propane industry have made investments in recent years to improve the quality and selection of propane fueled engines and electric generators. These efforts have been successful in increasing the penetration of propane engines in applications as far ranging as portable agricultural irrigation engines, forklift engines, commercial lawn mowers, and portable electric generators. Additionally, propane as an internal 20 Energy Information Agency 2015 Residential Energy Consumption Survey 21 Blue Bird Annual Report 37 P age
45 combustion fuel has made headway in various vehicle engines, including off-road engines, and small-, medium-, and heavy-duty on-road vehicles. In 2015, there were over 40,000 propane engines and over 3,500 propane generators sold in the U.S. 22 The companies active in this sector include large multinational companies, such as Siemens, Yanmar, and U.S. based manufacturers like Briggs & Stratton Corp, JD North America, and Power Solutions International. Agricultural Products (non-engine) Propane is used on over 800,000 farms across multiple sectors of agricultural industry. 23 While propane is used to fuel engines by the agricultural sector, such as irrigation engines, propane is more commonly used in non-engine applications. Non-engine agricultural products include grain drying equipment, forced air heaters and radiant heat brooders for swine and poultry facilities, greenhouse heaters and horticulture heating systems, and handheld propane torches for pest control and weed clearing. There is a large and robust sector of U.S. based companies operating manufacturing facilities domestically to supply equipment to the agricultural sector. Several examples of leading original equipment manufacturers of propane-fueled equipment include firms like GSI, Matthews Company, L.B. White, Detroit Radiant Products, and the Sukup Manufacturing Company. GSI is one of the world s leading manufacturers of agricultural equipment and is based in Assumption, Illinois. The company makes several different types of propane-fueled tower dryers used for grain storage and is the largest manufacturer of agricultural storage equipment. Matthews Company, which is also based in Illinois, and Sukup Manufacturing Company both manufacture propane-fueled grain drying and storage equipment. L.B. White manufactures various agricultural heating appliances, including forced air heaters, radiant heat brooders, and portable heaters, while Detroit Radiant Products specializes in portable space heating equipment. 22 Propane Education & Research Council 23 Propane Education & Research Council 38 P age


46 Table 13: State Value Added, Employment, and Wages for Odorized Propane, P age

47 Table 14: State Production attributed to Odorized Propane (C3H8), P age


48 Table 15: State Level Value Summary for Odorized Propane (C3H8), P age


,")
49 Table 16: State Level Value Summary for Propane (C3H8), P age


50 Table 17: State Level Value Summary for Total NGLs / LRGs, P age
51 3. Maps of National Level Overview The maps on the following pages present a state by state visual representation of the economic and employment impacts from the entire propane sector, the retail propane sector, and the entire NGL value chain. The data for these maps is derived from the tables presented in Section 2 of this report and is intended to present this information in an easy to understand format. The title of each map refers to the information being presented and includes the propane heated households, employment, wage, and the economic impacts. Each map includes a legend at the bottom that separates the states into roughly five equal groupings of states. 44 P age
52 3.1. Propane Heated Households by State Figure 14. Propane Heated Households by State 45 P age
53 3.2. Odorized (Retail) Propane Employment by State Figure 15. Odorized (Retail) Propane Employment by State 46 P age
54 3.3. Odorized (Retail) Propane Wages ($ Thousands) by State Figure 16. Odorized (Retail) Propane Wages ($ Thousands) by State 47 P age
55 3.4. Total Propane Employment by State Figure 17. Total Propane Employment by State 48 P age
56 3.5. Total Propane Wages ($ Thousands) by State Figure 18. Total Propane Wages ($ Thousands) by State 49 P age
57 3.6. Total Employment from Natural Gas Liquids and Propane by State Figure 19. Total Employment from Natural Gas Liquids and Propane by State 50 P age
58 3.7. Total Wages ($ Thousands) from Natural Gas Liquids and Propane by State Figure 20. Total Wages ($ Thousands) from Natural Gas Liquids and Propane by State 51 P age
59 3.8. Direct Added Value from Odorized (Retail) Propane by State Figure 21. Direct Added Value from Odorized (Retail) Propane by State 52 P age
60 3.9. Indirect and Induced Added Value from Odorized (Retail) Propane by State Figure 22. Indirect and Induced Added Value from Odorized (Retail) Propane by State 53 P age
 Propane by State 54 P age")
61 3.10. Total Added Value from Odorized (Retail) Propane by State Figure 23. Total Added Value from Odorized (Retail) Propane by State 54 P age
62 3.11. Total Added Value from Propane by State Figure 24. Total Added Value from Propane by State 55 P age
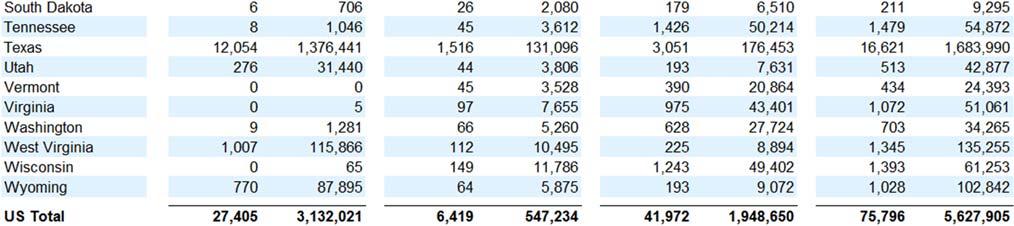
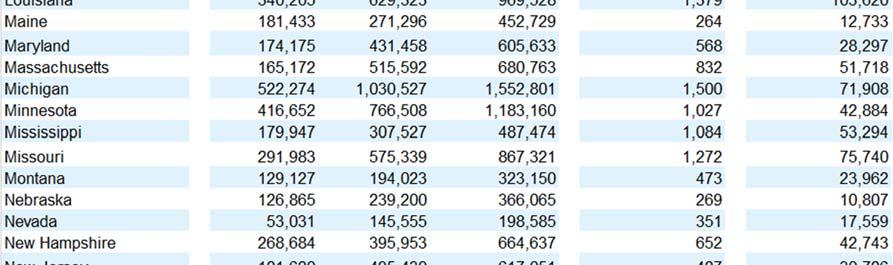
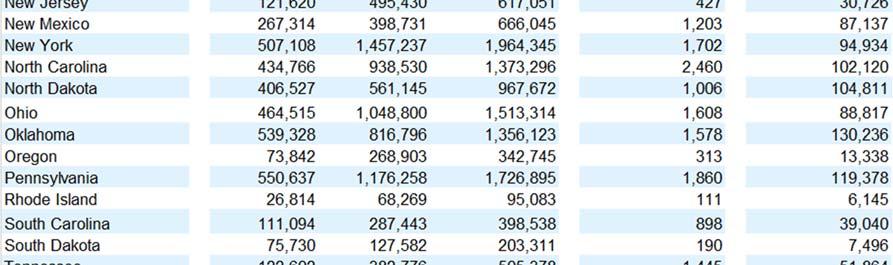
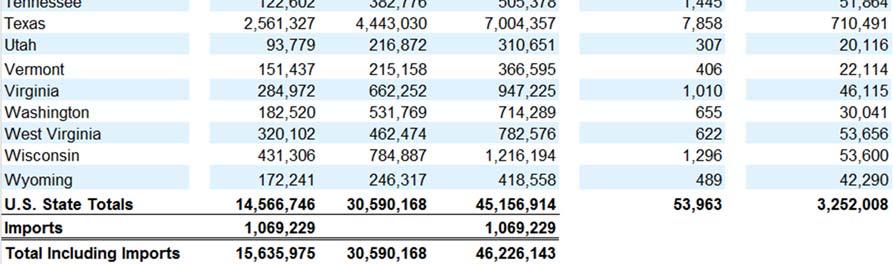
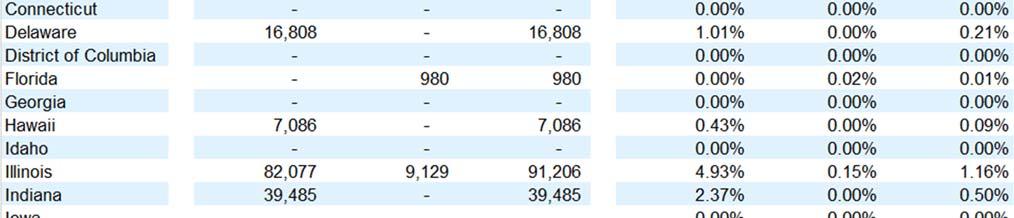
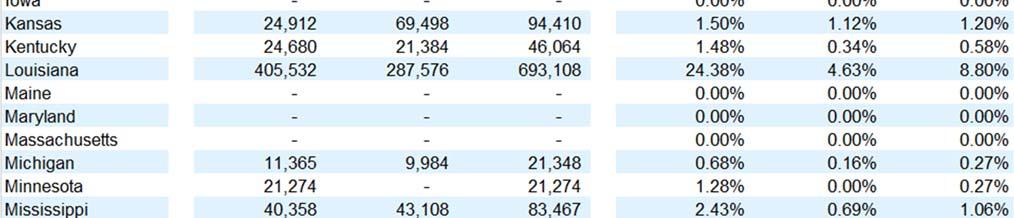
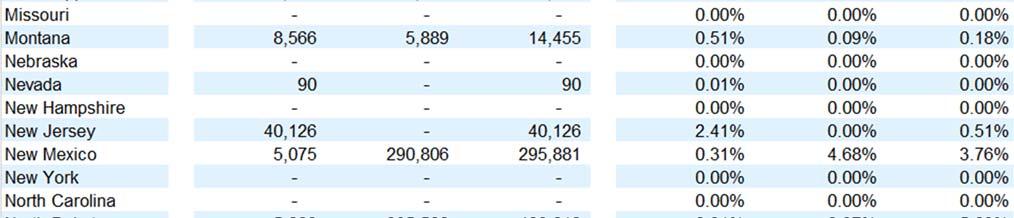
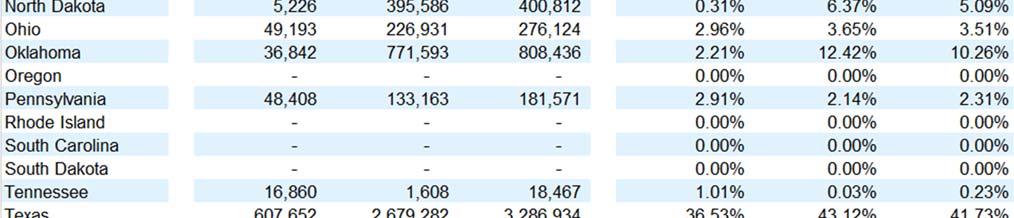
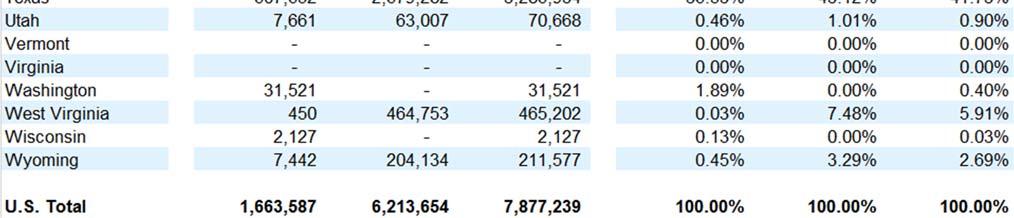
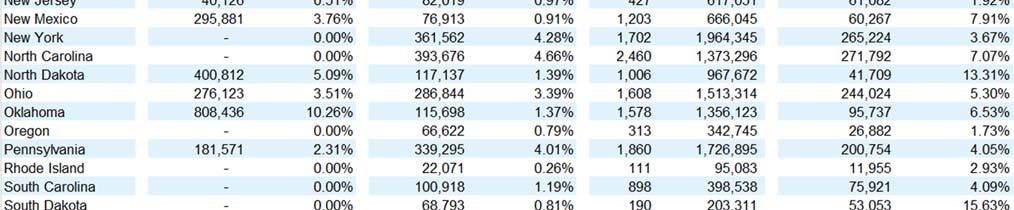
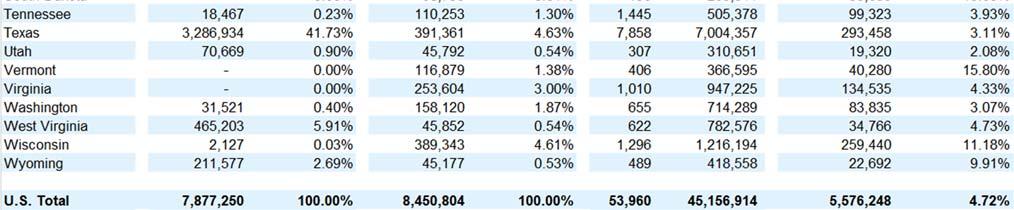
63 4. Odorized Propane Industry s Impact on the U.S. Economy by State The tables on the following pages present the detailed findings of the value chain analysis at the national and state level. The top left table on each page shows total odorized propane sales for the region (numbers may not add to total due to independent rounding). These sales are split by end use, with the total number of households using propane for primary space heating shown below. The top right table shows the odorized propane industry s total contribution to GDP. For the national total, this includes a calculation for domestic and imported direct value. At the state level, the difference between the top-line Total Market Value and the Total Direct Value Added is the difference between in-state propane production and odorized propane brought in from, or sent out to, other states. The final two lines in the table show the indirect and induced value added, as calculated by ICF and allocated to the state level, and the total contribution to national/state/district GDP. The two boxes in the middle of the page show total employment and wages attributed to odorized propane, allocated by sector. In addition, the first page, showing the U.S. total, shows ICF s estimates for indirect and induced labor and wages at the national level. The box at the bottom of the page shows production details. At the state level, only refinery and gas processing plant production is shown. For each state, that state s contribution to total U.S. odorized propane production is also shown. Nationally, production is further split into the share of odorized propane coming from domestic and imported feedstock, including Canadian and non-north American crude as well as Canadian wet natural gas. The two right-most boxes on the U.S. total table show for every source of odorized propane the share produced from domestic and North American feedstock, including the final share at the bottom. As illustrated in the Total U.S. table below, odorized propane consumed in the United States is primarily a North American energy resource. Over 80 percent of the product used in the retail propane segment is sourced domestically, with 12 percent imported from Canada, and the remaining 6 percent of propane supply sourced from imported crude oil. As a result of the sharp increase in domestic propane supplies from natural gas production the U.S. now has a much higher 56 P age
64 degree of domestically supplies propane relative to crude oil, the feedstock for gasoline and distillate, which still imports over 40 percent of the domestic consumption. End-Use Categories, as defined by API Residential Propane sold for use in private households primarily for use in space heating, water heating, and cooking. Sales for RV use also included in this category. Commercial Sales for use in commercial establishments such as motels, churches, restaurants, and laundries, primarily for use in commercial space heating, water heating, and cooking. Sales to Retail Dispensers (Cylinder) Include sales to bottle fillers and for cylinder exchange programs, campgrounds, hardware stores, and so on. Internal-Combustion Engine Fuel Propane used in highway vehicles, non-agricultural forklifts, oil-field drilling and production equipment, and so on. Industrial Include propane sold to manufacturing plants for such purposes as standby fuel, space heating, flame cutting, and metallurgical furnaces. Agricultural Propane used in the production, harvesting, and processing of agricultural products. 57 P age


65 4.1. Odorized Propane s Impact on Total U.S. Economy Source: Total Home Heating Market Share for Propane includes Single and Multi-Family Housing, as well as Boats, RVs, and other Full-time Residences. 58 P age


66 4.2. Odorized Propane s Impact on Total U.S. Economy 59 P age


67 4.3. Odorized Propane's Impact on Alabama Economy 60 P age
68 4.4. Odorized Propane s Impact on Alaska Economy 61 P age
69 4.5. Odorized Propane s Impact on Arizona Economy 62 P age
70 4.6. Odorized Propane s Impact on Arkansas Economy 63 P age
71 4.7. Odorized Propane s Impact on California Economy 64 P age
72 4.8. Odorized Propane s Impact on Colorado Economy 65 P age
73 4.9. Odorized Propane s Impact on Connecticut Economy 66 P age
74 4.10. Odorized Propane s Impact on Delaware Economy 67 P age
75 4.11. Odorized Propane s Impact on District of Columbia Economy 68 P age
76 4.12. Odorized Propane s Impact on Florida Economy 69 P age
77 4.13. Odorized Propane s Impact on Georgia Economy 70 P age
78 4.14. Odorized Propane s Impact on Hawaii Economy 71 P age
79 4.15. Odorized Propane s Impact on Idaho Economy 72 P age
80 4.16. Odorized Propane s Impact on Illinois Economy 73 P age
81 4.17. Odorized Propane s Impact on Indiana Economy 74 P age
82 4.18. Odorized Propane s Impact on Iowa Economy 75 P age
83 4.19. Odorized Propane s Impact on Kansas Economy 76 P age

84 4.20. Odorized Propane s Impact on Kentucky Economy 77 P age
85 4.21. Odorized Propane s Impact on Louisiana Economy 78 P age
86 4.22. Odorized Propane s Impact on Maine Economy 79 P age
87 4.23. Odorized Propane s Impact on Maryland Economy 80 P age
88 4.24. Odorized Propane s Impact on Massachusetts Economy 81 P age
89 4.25. Odorized Propane s Impact on Michigan Economy 82 P age
90 4.26. Odorized Propane s Impact on Minnesota Economy 83 P age
91 4.27. Odorized Propane s Impact on Mississippi Economy 84 P age
92 4.28. Odorized Propane s Impact on Missouri Economy 85 P age
93 4.29. Odorized Propane s Impact on Montana Economy 86 P age
94 4.30. Odorized Propane s Impact on Nebraska Economy 87 P age


95 4.31. Odorized Propane s Impact on Nevada Economy 88 P age
96 4.32. Odorized Propane s Impact on New Hampshire Economy 89 P age
97 4.33. Odorized Propane s Impact on New Jersey Economy 90 P age
98 4.34. Odorized Propane s Impact on New Mexico Economy 91 P age
99 4.35. Odorized Propane s Impact on New York Economy 92 P age
100 4.36. Odorized Propane s Impact on North Carolina Economy 93 P age
101 4.37. Odorized Propane s Impact on North Dakota Economy 94 P age
102 4.38. Odorized Propane s Impact on Ohio Economy 95 P age
103 4.39. Odorized Propane s Impact on Oklahoma Economy 96 P age
104 4.40. Odorized Propane s Impact on Oregon Economy 97 P age
105 4.41. Odorized Propane s Impact on Pennsylvania Economy 98 P age

106 4.42. Odorized Propane s Impact on Rhode Island Economy 99 P age
Knowledge Exchange Report
 Knowledge Exchange Report February 2016 The Economic Impact of a Minimum Wage Increase on New York State Agriculture New York State is considering a minimum wage increase from $9.00 to $15.00 statewide.
ANNEX E: Methodology for Estimating CH 4 Emissions from Coal Mining
 1 1 1 1 1 1 1 1 0 1 0 1 ANNEX E: Methodology for Estimating CH Emissions from Coal Mining The methodology for estimating methane emissions from coal mining consists of two distinct steps. The first step
Industrial Energy Efficiency as a Resource by Region
 Industrial Energy Efficiency as a Resource by Region Garrett Shields and Robert D. Naranjo, BCS Incorporated Sandy Glatt, U.S. Department of Energy ABSTRACT The energy intensity of specific manufacturing
Energy and Regional Economics
 Energy and Regional Economics Michael Carliner International instability and possible war affect the overall US economy, and economic conditions in different regions, in a variety of ways. Changes in energy
2009 Propane Market Outlook
 2009 Propane Market Outlook Assessment of Key Market Trends, Threats, and Opportunities Facing the Propane Industry Through 2020 Presented By: Regional Market Outlook Appendix Prepared for the Propane
EIA Winter Fuels Outlook
 EIA Winter Fuels Outlook For Washington, D.C. By Adam Sieminski, Administrator, U.S. Energy Information Administration U.S. Energy Information Administration Independent Statistics & Analysis www.eia.gov
2012 Distribution Best Practices Benchmarking Company Profile Data Packet
 American Gas Association January 2012 Company Name: DOT Operating ID(s): Person Completing Form: Phone Number: Email Address: Required Fields Deadline for data submittal in BESS, http://www.aga.org/research/bess/
Knowledge Exchange Report. Economic Impact of Mandatory Overtime on New York State Agriculture
 Farm Credit East Knowledge Exchange Report September, 2014 Economic Impact of Mandatory Overtime on New York State Agriculture The New York State Legislature and Governor Andrew Cuomo are considering legislation
Data and Analysis from EIA to Inform Policymakers, Industry, and the Public Regarding Power Sector Trends
 Data and Analysis from EIA to Inform Policymakers, Industry, and the Public Regarding Power Sector Trends for Power Sector Trends in the Eastern Interconnection Atlanta, GA by Howard Gruenspecht, Deputy
2016 Propane Market Outlook: Driving Change in Consumer Propane Markets
 0 2016 Propane Market Outlook: Driving Change in Consumer Propane Markets NPGA Southeastern Convention & International Propane Expo April 8, 2016 Presented by: Michael Sloan ICF International 9300 Lee
Updated State-level Greenhouse Gas Emission Coefficients for Electricity Generation
 Updated State-level Greenhouse Gas Emission Coefficients for Electricity Generation 1998-2000 Energy Information Administration Office of Integrated Analysis and Forecasting Energy Information Administration
Kathryn Tippey University of Alabama. Randy Beavers University of Alabama
 Monitoring Climate Variability s Impact on Residential Energy Consumption in the United States: Approach to the Disaggregation of Heating Fuel Consumption Kathryn Tippey University of Alabama Randy Beavers
The Economic Impact of Mandatory Overtime Pay for New York State Agriculture
 Farm Credit East Report The Economic Impact of Mandatory Overtime Pay for New York State Agriculture Legislation has been introduced in the New York State Senate and Assembly that would require agricultural
Short-Term Energy Outlook and Winter Fuels Outlook
 Short-Term Energy Outlook and Winter Fuels Outlook For NASEO Winter Fuels Outlook Conference Washington, DC By Adam Sieminski, Administrator U.S. Energy Information Administration Independent Statistics
Economic Impact Study
 Economic Impact Study U.S.- Based Scrap Recycling Industry 2017 Prepared for the Institute for Scrap Recycling Industries, Inc. Executive Summary Scrap recycling is a major U.S.-based industry dedicated
Trends in. U.S. Delivered Coal Costs: July 2012
 Trends in U.S. Delivered Coal Costs: 2004-2011 July 2012 By Teresa Foster, William Briggs and Leslie Glustrom Version 1.1 Inquiries or corrections to info@cleanenergyaction.org 1 2 Table of Contents INTRODUCTION...
Emission Factors and Energy Prices. for Leonardo Academy s. Cleaner and Greener Program
 Emission Factors and Energy Prices for Leonardo Academy s Cleaner and Greener Program Prepared by Leonardo Academy Inc. For the Multiple Pollutant Emission Reduction Reporting System (MPERRS) Funding for
Benchmarking Standards, Model Codes, Codes and Voluntary Guidelines on the HERS Index
 Benchmarking Standards, Model Codes, Codes and Voluntary Guidelines on the HERS Index Importance of Benchmarking Quantifying energy efficiency programs and codes helps: Consumers understand the performance
JAN-SAN MRO DATA ESTIMATED END-USER DEMAND BY REGION & END-MARKET
 $1,995.00 2014 U.S. MARKET ANALYSIS: JAN-SAN MRO DATA ESTIMATED END-USER DEMAND BY REGION & END-MARKET e l p m a S researched & produced by: www.imidata.com www.mdm.com 2014 by Gale Media Inc. All rights
Summer Fuels Outlook. Gasoline and diesel. April 2018
 April 2018 Summer Fuels Outlook This outlook focuses on prices and consumption of gasoline, diesel, and electricity (see Summer Fuels Outlook motor gasoline table and electricity table). The use of these
Facts on Direct-to-Consumer Food Marketing
 United States Department of Agriculture Agricultural Marketing Service May 2009 Facts on Direct-to-Consumer Food Marketing Incorporating Data from the 2007 Census of Agriculture Written by: Adam Diamond
CALCULATING THE SUPPLEMENTAL NUTRITION ASSISTANCE PROGRAM (SNAP) PROGRAM ACCESS INDEX: A STEP-BY-STEP GUIDE FOR 2013
 PROGRAM ACCESS INDEX: A STEP-BY-STEP GUIDE FOR 2013") Food and Nutrition Service January 2015 CALCULATING THE SUPPLEMENTAL NUTRITION ASSISTANCE PROGRAM (SNAP) PROGRAM ACCESS INDEX: A STEP-BY-STEP GUIDE FOR 2013 Introduction The Program Access Index (PAI)
Food and Nutrition Service January 2015 CALCULATING THE SUPPLEMENTAL NUTRITION ASSISTANCE PROGRAM (SNAP) PROGRAM ACCESS INDEX: A STEP-BY-STEP GUIDE FOR 2013 Introduction The Program Access Index (PAI)
HOW BIG IS AFRICA? Rules. recommended grades: 3-6
 AFRICA HOW BIG IS AFRICA? recommended grades: 3-6 time needed: 25 MINUTES Description Students develop a sense of scale by using their bodies and other tools to measure the length and width of Africa.
The Economic Impact of Privately-Owned Forests in the United States
 The Economic Impact of Privately-Owned Forests in the United States The Economic Impact of Privately-Owned Forests in the United States Prepared for: National Alliance of Forest Owners Contact: Gretchen
Idaho s Forest Products Business Sector:
 Policy Analysis Group College of Natural Resources Report No. 26 August 2006 Idaho s Forest Products Business Sector: Jobs, Wages and Salaries, Direct and Indirect Effects Linkages, Multipliers, and Economic
How Much Do Exports Matter?
 Evaluating the Economic Contributions of U.S. Grain Exports on State and Congressional District Economies Prepared For: April 2016 Table of Contents I. EXECUTIVE SUMMARY... 1 II. INTRODUCTION... 2 III.
April June Labor Market Outlook. Published by the Society for Human Resource Management. Labor Market Outlook Survey Q (April June)
") April June 2009 Labor Market Outlook Published by the Society for Human Resource Management Labor Market Outlook Survey Q2 2009 (April June) LABOR MARKET OUTLOOK SURVEY Q2 2009 (April June) OPTIMISM ABOUT
April June 2009 Labor Market Outlook Published by the Society for Human Resource Management Labor Market Outlook Survey Q2 2009 (April June) LABOR MARKET OUTLOOK SURVEY Q2 2009 (April June) OPTIMISM ABOUT
Asphalt Pavement Mix Production Survey On Reclaimed Asphalt Pavement, Reclaimed Asphalt Shingles, And Warm-mix Asphalt Usage:
 Asphalt Pavement Mix Production Survey On Reclaimed Asphalt Pavement, Reclaimed Asphalt Shingles, And Warm-mix Asphalt Usage: 2009-2010 Appendix A Purpose The National Asphalt Pavement Association is working
Milk Production. January Milk Production up 2.7 Percent
 Milk Production ISSN: 9-557 Released February, 07, by the National Agricultural Statistics Service (NASS), Agricultural Statistics Board, United States Department of Agriculture (USDA). January Milk Production
Accelerating Energy Efficiency in Texas
 Accelerating Energy Efficiency in Texas Southwest Partnership for Energy Efficiency As a Resource Houston, Texas August 5, 2014 Jim Lazar RAP Senior Advisor The Regulatory Assistance Project 50 State Street,
CALCULATING THE SUPPLEMENTAL NUTRITION ASSISTANCE PROGRAM (SNAP) PROGRAM ACCESS INDEX: A STEP-BY-STEP GUIDE FOR 2015
 PROGRAM ACCESS INDEX: A STEP-BY-STEP GUIDE FOR 2015") Food and Nutrition Service January 2017 CALCULATING THE SUPPLEMENTAL NUTRITION ASSISTANCE PROGRAM (SNAP) PROGRAM ACCESS INDEX: A STEP-BY-STEP GUIDE FOR 2015 Introduction The Program Access Index (PAI)
Food and Nutrition Service January 2017 CALCULATING THE SUPPLEMENTAL NUTRITION ASSISTANCE PROGRAM (SNAP) PROGRAM ACCESS INDEX: A STEP-BY-STEP GUIDE FOR 2015 Introduction The Program Access Index (PAI)
Chapter TRI Data and Trends (Original Industries Only)
") Chapter 3 1999 TRI Data and 1995 1999 Trends (Original Industries Only) Chapter 3 1999 TRI Data and 1995 1999 Trends (Original Industries Only) INTRODUCTION This chapter summarizes information reported
Chapter 3 1999 TRI Data and 1995 1999 Trends (Original Industries Only) Chapter 3 1999 TRI Data and 1995 1999 Trends (Original Industries Only) INTRODUCTION This chapter summarizes information reported
Watershed Condition Framework
 US Forest Service - Watershed Condition Classification Maps http://www.fs.fed.us/publications/watershed/ Page 1 of 2 1/9/2013 Watershed Condition Framework The Forest Service has released the first national
Q October-December. Jobs Outlook Survey Report. Published by the Society for Human Resource Management
 Q4 2011 October-December Jobs Outlook Survey Report Published by the Society for Human Resource Management JOBS OUTLOOK SURVEY REPORT Q4 2011 (October-December) OPTIMISM ABOUT JOB GROWTH IN Q4 2011 (OCTOBER-DECEMBER)
Labor Market Outlook. Labor Market Outlook Survey Q (October December) Published by the Society for Human Resource Management
 Published by the Society for Human Resource Management") October December 2009 Labor Market Outlook Published by the Society for Human Resource Management Labor Market Outlook Survey Q4 2009 (October December) LABOR MARKET OUTLOOK SURVEY Q4 2009 (October December)
October December 2009 Labor Market Outlook Published by the Society for Human Resource Management Labor Market Outlook Survey Q4 2009 (October December) LABOR MARKET OUTLOOK SURVEY Q4 2009 (October December)
Milk Production, Disposition, and Income 2011 Summary
 United s Department of Agriculture National Agricultural Statistics Service Production, Disposition, and Income 2011 Summary April 2012 ISSN: 19491506 Contents Summary... 4 Cows and Production of and
SAMPLE REPORT. Competitive Landscape for Wholesale Distribution: Fasteners $ RESEARCHED & PRODUCED BY:
 $295.95 2015 Competitive Landscape for Wholesale Distribution: Fasteners ANNUAL MARKET DATA, TRENDS AND ANALYSIS FOR THE NORTH AMERICAN WHOLESALE DISTRIBUTION INDUSTRY 2015 by Gale Media, Inc. All rights
Q October-December. Jobs Outlook Survey Report. Published by the Society for Human Resource Management
 Q4 2013 October-December Jobs Outlook Survey Report Published by the Society for Human Resource Management JOBS OUTLOOK SURVEY REPORT Q4 2013 (October-December) OPTIMISM ABOUT JOB GROWTH IN Q4 2013 (OCTOBER-DECEMBER)
Fatal Occupational Injuries in Maine 2004
 Fatal Occupational Injuries in Maine 2004 BLS 732 D EPARTMENT OF LABOR B UREAU OF LABOR S TANDARDS 45 STATE HOUSE STATION AUGUSTA, MAINE 04333-0045 LAURA A. FORTMAN COMMISSIONER JOHN ELIAS BALDACCI GOVERNOR
EIA Winter Fuels Outlook
 EIA 2018 19 Winter Fuels Outlook U.S. Energy Information Administration Independent Statistics & Analysis www.eia.gov The main determinants of winter heating fuels expenditures are temperatures and prices
Fatal Occupational Injuries in Maine, 2008
 MAINE DEPARTMENT OF LABOR Fatal Occupational Injuries in Maine, 2008 An Annual Report September 2009 By: Ann Beaulieu D EPARTMENT OF L ABOR B UREAU OF L ABOR STANDARDS 45 STATE HOUSE STATION AUGUSTA, MAINE
Milk Production, Disposition, and Income 2014 Summary
 United s Department of Agriculture National Agricultural Statistics Service Milk Production, Disposition, and Income 04 Summary ISSN: 949-506 April 05 Contents Summary... 4 Milk Cows and Production of
Production per cow in the 23 major States averaged 1,891 pounds for January, 17 pounds above January 2013.
 Milk Production ISSN: 19-1557 Released February 20, 2014, by the National Agricultural Statistics Service (NASS), Agricultural Statistics Board, United States Department of Agriculture (USDA). January
Meat Animals Production, Disposition, and Income 2011 Summary
 United States Department of Agriculture National Agricultural Statistics Service Meat Animals Production, Disposition, and Income 2011 Summary April 2012 ISSN: 0748-0318 Special Note Sheep: Monthly sheep
Case Study: market growth strategy. - Selection of slides
 Case Study: market growth strategy - Selection of slides 1 Objective of the collaboration Situation: The Client, global AC player, would like to enhance its positioning in the USA In this sense, the overall
Milk Production. January Milk Production up 1.8 Percent
 Milk Production ISSN: 9-557 Released February, 08, by the National Agricultural Statistics Service (NASS), Agricultural Statistics Board, United States Department of Agriculture (USDA). January Milk Production
Streamflow of 2013 Water Year Summary
 Streamflow of 23 Water Year Summary U.S. Geological Survey Reston, Virginia January 24 23 Statewide Streamflow Ranks (93 23) Introduction National Overview Regional Patterns Seasonal Characteristics High
ENERGY STAR Oil Furnaces Product List
 ENERGY STAR Oil Furnaces Product List Below are currently qualified ENERGY STAR models available for sale in the U.S. and Canada * Air Leakage data was not collected under the Version 3.0 ENERGY STAR Program
Labor Market Outlook. Labor Market Outlook Survey Q (October December) Published by the Society for Human Resource Management
 Published by the Society for Human Resource Management") October December 2010 Labor Market Outlook Published by the Society for Human Resource Management Labor Market Outlook Survey Q4 2010 (October December) LABOR MARKET OUTLOOK SURVEY Q4 2010 (October December)
October December 2010 Labor Market Outlook Published by the Society for Human Resource Management Labor Market Outlook Survey Q4 2010 (October December) LABOR MARKET OUTLOOK SURVEY Q4 2010 (October December)
Potential Impacts to Texas of EPA s Clean Power Plan. Brian Tulloh Austin Electricity Conference April 9, 2015
 Potential Impacts to Texas of EPA s Clean Power Plan Brian Tulloh Austin Electricity Conference April 9, 2015 Luminant Is Texas Largest Competitive Power Generator 15.4 GW of generation capacity: 8.0 GW
MAINE STATE LEGISLATURE
 MAINE STATE LEGISLATURE The following document is provided by the LAW AND LEGISLATIVE DIGITAL LIBRARY at the Maine State Law and Legislative Reference Library http://legislature.maine.gov/lawlib Reproduced
API Industry Outlook. Third Quarter R. Dean Foreman, Ph.D. Great Plains and EmPower ND Energy Conference October 8, 2018.
 API Industry Outlook Third Quarter 2018 R. Dean Foreman, Ph.D. Chief Economist American Petroleum Institute Great Plains and EmPower ND Energy Conference October 8, 2018 American Updated Petroleum September
Internet Appendix for The Impact of Bank Credit on Labor Reallocation and Aggregate Industry Productivity
 Internet Appendix for The Impact of Bank Credit on Labor Reallocation and Aggregate Industry Productivity John (Jianqiu) Bai, Daniel Carvalho and Gordon Phillips * June 4, 2017 This appendix contains three
U.S. Drought Monitor, August 28, 2012
 University of Nebraska - Lincoln DigitalCommons@University of Nebraska - Lincoln US Ag in Drought Archive Drought -- National Drought Mitigation Center 8-28-2 U.S. Drought Monitor, August 28, 2 Brian Fuchs
U.S. Drought Monitor, September 4, 2012
 University of Nebraska - Lincoln DigitalCommons@University of Nebraska - Lincoln US Ag in Drought Archive Drought -- National Drought Mitigation Center 9--12 U.S. Drought Monitor, September, 12 Brian Fuchs
U.S. Drought Monitor, October 2, 2012
 University of Nebraska - Lincoln DigitalCommons@University of Nebraska - Lincoln US Ag in Drought Archive Drought -- National Drought Mitigation Center -2-12 U.S. Drought Monitor, October 2, 12 Anthony
Meat Animals Production, Disposition, and Income 2015 Summary
 United States Department of Agriculture National Agricultural Statistics Service Meat Animals Production, Disposition, and Income 2015 Summary ISSN: 0748-0318 April 2016 Contents Summary... 5 Meat Animals
U.S. Drought Monitor, July 31, 2012
 University of Nebraska - Lincoln DigitalCommons@University of Nebraska - Lincoln US Ag in Drought Archive Drought -- National Drought Mitigation Center -3-2 U.S. Drought Monitor, July 3, 2 Mark D. Svoboda
Comparison of CAIR and CAIR Plus Proposal using the Integrated Planning Model (IPM ) Mid-Atlantic Regional Air Management Association (MARAMA)
 Mid-Atlantic Regional Air Management Association (MARAMA)") Draft Report Comparison of CAIR and CAIR Plus Proposal using the Integrated Planning Model (IPM ) Prepared for Mid-Atlantic Regional Air Management Association (MARAMA) Prepared by ICF Resources, L.L.C.
Draft Report Comparison of CAIR and CAIR Plus Proposal using the Integrated Planning Model (IPM ) Prepared for Mid-Atlantic Regional Air Management Association (MARAMA) Prepared by ICF Resources, L.L.C.
SOYBEANS: SURPLUS GROWS, ACREAGE TO DECLINE
 SOYBEANS: SURPLUS GROWS, ACREAGE TO DECLINE JANUARY 2007 Darrel Good 2007 NO. 2 Summary The 2006 U.S. soybean crop was a record 3.188 billion bushels, but was 16 million smaller than the November 2006
Winter U.S. Natural Gas Production and Supply Outlook
 Winter 2012-13 U.S. Natural Gas Production and Supply Outlook Prepared for Natural Gas Supply Association by: ICF International Fairfax, Virginia September, 2012 Introduction This report presents ICF s
Q October-December. Jobs Outlook Survey Report. Published by the Society for Human Resource Management
 Q4 2012 October-December Jobs Outlook Survey Report Published by the Society for Human Resource Management JOBS OUTLOOK SURVEY REPORT Q4 2012 (October-December) OPTIMISM ABOUT JOB GROWTH IN Q4 2012 (OCTOBER-DECEMBER)
EIA Short-Term Energy and Winter Fuels Outlook
 EIA Short-Term Energy and Winter Fuels Outlook NASEO 2015 Winter Energy Outlook Conference Washington, DC by Howard Gruenspecht, Deputy Administrator U.S. Energy Information Administration Independent
Survey of Mineral Admixtures and Blended Cements in Ready Mixed Concrete
 Survey of Mineral Admixtures and Blended Cements in Ready Mixed Concrete A survey of concrete producers to quantify the use of cement, admixtures and blended cements in ready mixed concrete. October 2000
Honey Final Estimates
 United States Department of Agriculture National Agricultural Statistics Service Honey Final Estimates 200-2012 September 201 Statistical Bulletin Number 3 Contents Honey Price by Color Class United States:
An Assessment of Parcel Data in the United States 2005 Survey Results
 An Assessment of Parcel Data in the United States 2005 Survey Results May 2006 Prepared by David Stage and Nancy von Meyer for the Federal Geographic Data Committee s Subcommittee on Cadastral Data Overview:
FREIGHT POLICY TRANSPORTATION INSTITUTE. Spatial Patterns in Household Demand for Ethanol Hayk Khachatryan, Ken Casavant and Eric Jessup
 FREIGHT POLICY TRANSPORTATION INSTITUTE Spatial Patterns in Household Demand for Ethanol Hayk Khachatryan, Ken Casavant and Eric Jessup Spatial Patterns in Household Demand for Ethanol Hayk Khachatryan,
SOYBEANS: HIGHEST PRICES IN OVER SEVEN YEARS. January 2004 Darrel Good 2004 NO. 2
 SOYBEANS: HIGHEST PRICES IN OVER SEVEN YEARS January 2004 Darrel Good 2004 NO. 2 Summary At 2.418 billion bushels, the 2003 U.S. soybean crop was 34 million bushels smaller than the USDA s November forecast
General Manager: Front Desk Manager: Front Desk/Shift Supervisor: Housekeeping or Environmental Services Manager: Housekeeping Supervisor/Inspector:
 1 Report Summary WageWatch, Inc. has partnered with AAHOA to provide its members with a Hospitality Salary Survey Report for limited/select service hotels twice a year. This is the first report and is
Welcome to the BPA Brand Report
 Welcome to the BPA Brand Report You are looking at the contemporary design that has replaced BPA s traditional green sheets and pink sheets. No longer called a Circulation Statement, the BPA Brand Report
North American Midstream Infrastructure Through 2035 A Secure Energy Future. Press Briefing June 28, 2011
 North American Midstream Infrastructure Through 2035 A Secure Energy Future Press Briefing June 28, 2011 Disclaimer This presentation presents views of ICF International and the INGAA Foundation. The presentation
State CO2 Emission Rate Goals in EPA s Proposed Rule for Existing Power Plants
 State CO2 Emission Rate Goals in EPA s Proposed Rule for Existing Power Plants Jonathan L. Ramseur Specialist in Environmental Policy July 21, 2014 Congressional Research Service 7-5700 www.crs.gov R43652
Methodology. Respondents. Survey Process
 Methodology The 2011 ABA Compensation & Benefits Survey was designed to meet the needs of banks across the nation. The survey was administered by enetrix, A Division of Gallup, Inc., and an invitation
PIl82-, ESS-'12 \J.S~FAHM POPULATION', 1980, / VERA J.BANKS,' ET AL. E,CONQM'~
 PIl82-,105990 ESS-'12 \J.S~FAHM POPULATION', 1980, / VERA J.BANKS,' ET AL. E,CONQM'~ ICSAND STATISrJ:CS 'servrq; WASHINGTON,. DC. ECONOMIC DEVELOPME.NT DI,. V. '"JUN 81 5P IJi 'IIII'~ I~I~ I~, L.~... ~
Government Spending and Air Pollution in the US
 Government Spending and Air Pollution in the US ONLINE APPENDIX Asif M. Islam* University of Maryland 2106 Symons Hall College Park, MD 20740 (651) 246 4017 aislam@arec.umd.edu Ramón E. López University
Arkansas Propane Market
 Arkansas Propane Market November 2016 Prepared for the Propane Education and Research Council Presented by: Michael Sloan ICF International 9300 Lee Hwy Fairfax, VA 22031 Overview of Arkansas Propane Markets
October U.S. Energy Information Administration Winter Fuels Outlook October
 October 2017 Winter Fuels Outlook EIA forecasts that average household expenditures for all major home heating fuels will rise this winter because of expected colder weather and higher energy costs. Average
August 4, The Honorable Donald J. Trump President 1600 Pennsylvania Avenue, NW Washington, DC Dear Mr. President:
 August 4, 2017 The Honorable Donald J. Trump President 1600 Pennsylvania Avenue, NW Washington, DC 20500 Dear Mr. President: On behalf of the more than 200 organizations representing rural communities,
Honey. United States Honey Production Down 16 Percent
 Honey ISSN: 1-12 Released March 30, 2012, by the National Agricultural Statistics Service (NASS), Agricultural Statistics Board, United States Department of Agriculture (USDA). United States Honey Production
The Contributions of Insulation to the U.S. Economy in 2016
 The Contributions of Insulation to the U.S. Economy in 2016 Economics & Statistics Department American Chemistry Council February 2017 TABLE OF CONTENTS EXECUTIVE SUMMARY... 2 THE INSULATION INDUSTRY IN
https://aba2.issi.net/team/admin/wizard/survey/loadinstance.asp?formid=208&instanc...
 https://aba2.issi.net/team/admin/wizard/survey/loadinstance.asp?formid=208&instanc... Page 1 of 1 Print Last edited by Vicki Osman on Mar 28 2016 8:54AM Marketplace 2017 Associate Profile Page 1/1 Please
U.S. Drought Monitor, August 14, 2012
 University of Nebraska - Lincoln DigitalCommons@University of Nebraska - Lincoln US Ag in Drought Archive Drought -- National Drought Mitigation Center 8-4-2 U.S. Drought Monitor, August 4, 2 Michael J.
THE VW SETTLEMENT HANDBOOK: Overview, Timeline, and Actions
 THE VW SETTLEMENT HANDBOOK: Overview, Timeline, and Actions Table of Contents: What is the VW Settlement?... 2 Why Do We Care About NOx and Transportation?... 3 The Environmental Mitigation Trust... 4
BRAND REPORT FOR THE 6 MONTH PERIOD ENDED JUNE 2018
 BRAND REPORT FOR THE 6 MONTH PERIOD ENDED JUNE 2018 No attempt has been made to rank the information contained in this report in order of importance, since BPA Worldwide believes this is a judgment which
Capacity of Refrigerated Warehouses 2017 Summary
 United States Department of Agriculture National Agricultural Statistics Service Capacity of Refrigerated Warehouses 07 Summary ISSN: 996 January 0 Contents Refrigerated Warehouses Capacity Highlights...
A Study of United States Hydroelectric Plant Ownership
 INL/EXT-06-11519 A Study of United States Hydroelectric Plant Ownership Douglas G. Hall, INL Project Manager Kelly S. Reeves, NPS June 2006 The INL is a U.S. Department of Energy National Laboratory operated
Legislative Trends: Upcoming Increases to Minimum Wage Round-up 2018
 Legislative Trends: Upcoming Increases to Minimum Wage Round-up 2018 While the last federal minimum wage increase was on July 24, 2009, when it rose from $6.55 to $7.25 per hour, many state and local governments
Farms and Land in Farms
 United States Department of Agriculture National Agricultural Statistics Service Farms and Land in Farms 2017 Summary February 2018 ISSN: 1995-2004 2 Farms and Land in Farms 2017 Summary (February 2018)
Land Values 2013 Summary
 United States Department of Agriculture National Agricultural Statistics Service Land Values 2013 Summary August 2013 ISSN: 19491867 Contents Agricultural Land Values Highlights... 4 Farm Real Estate,
SOYBEANS: SMALLER STOCKS, MORE ACRES, AND EARLY WEATHER WORRIES
 SOYBEANS: SMALLER STOCKS, MORE ACRES, AND EARLY WEATHER WORRIES APRIL 2000 Darrel Good Summary March 1, 2000 stocks of soybeans were estimated at 1.397 billion bushels, 60 million less than on the same
Economic Contribution of the US Tugboat,
 www.pwc.com/us/nes Economic Contribution of the US Tugboat, Towboat, and Barge Industry Economic Contribution of the US Tugboat, Towboat, and Barge Industry May 10, 2017 Prepared for the American Waterways
BRAND REPORT FOR THE 6 MONTH PERIOD ENDED JUNE 2017 (Including Supplementary Data)
") BRAND REPORT FOR THE 6 MONTH PERIOD ENDED JUNE 2017 (Including Supplementary Data) No attempt has been made to rank the information contained in this report in order of importance, since BPA Worldwide
BRAND REPORT FOR THE 6 MONTH PERIOD ENDED JUNE 2017 (Including Supplementary Data) No attempt has been made to rank the information contained in this report in order of importance, since BPA Worldwide
Hawaii Competitiveness: Creating a State Economic Strategy
 Hawaii Competitiveness: Creating a State Economic Strategy Professor Michael E. Porter Harvard Business School March 20, 2012 For further material on regional competitiveness and clusters: www.isc.hbs.edu/econ-clusters.htm
Honey. United States Honey Production Down 1 Percent
 Honey ISSN: 199-192 Released March 18, 2013, by the National Agricultural Statistics Service (NASS), Agricultural Statistics Board, United States Department of Agriculture (USDA). United States Honey Production
NEAUPG Annual Fall Meeting
 NEAUPG Annual Fall Meeting 1 Presentation Overview What does it mean to be Sustainable? What asphalt technologies are considered Sustainable and why? Why do we need to quantify our impact? What tools are
All cows and heifers that have calved, at 39.1 million, were down 2 percent from the 40.0 million on January 1, 2011.
 Cattle ISSN: 1948-90 Released January 27, 2012, by the National Agricultural Statistics Service (NASS), Agricultural Statistics Board, United States Department of Agriculture (USDA). January 1 Cattle Inventory
Ross Stores, Inc. Investor Overview August 2018
 Ross Stores, Inc. Investor Overview Disclosure of Risk Factors Forward-Looking Statements: This presentation contains forward-looking statements regarding expected sales, earnings levels, new store growth
U.S. Drought Monitor, August 7, 2012
 University of Nebraska - Lincoln DigitalCommons@University of Nebraska - Lincoln US Ag in Drought Archive Drought -- National Drought Mitigation Center -- U.S. Drought Monitor, August, Mark D. Svoboda
Do you have staff reviewing formation filings for name availability purposes or is this done electronically?
 Topic: Developing an Online Filing System Question by: Allison Clark Jurisdiction: Ohio Date: 2 February 2011 Jurisdiction Question(s) Manitoba Corporations Canada Alabama Alaska Arizona Arkansas California
VOTER REGISTRATION REMAINS CHALLENGING FOR MANY NEW YORKERS
 : Good for Democracy and Sound Fiscal Sense February 11, 2019 VOTER REGISTRATION REMAINS CHALLENGING FOR MANY NEW YORKERS who may not know how or where to register to vote, or whose minor errors on voter