Construction. Analysis. Hydrographs
|
|
|
- Gwendolyn Greene
- 5 years ago
- Views:
Transcription
1 Construction And Analysis Of Hydrographs
2 Hydrographs Special graphs that show a changes in a river s discharge over a period of time, usually in relation to a rainfall event. River Discharge Is the amount of water passing a particular point in the river at any given time (basically the amount of water in the river).
3 Why Construct & Analyse Hydrographs? To find out discharge patterns of a particular drainage basin Help predict flooding events, therefore influence implementation of flood prevention measures
4 Construction Of Storm (flood) Hydrographs
5 Discharge (m /s) Basin lag time Peak flow 1 4 mm Overland flow Through flow Base flow Hours from start of rain storm
6 Discharge (m /s) Hours from start of rain storm
7 Discharge (m /s) Rainfall shown in mm, as a bar graph 1 4 mm Hours from start of rain storm
8 Discharge (m /s) 1 4 mm Discharge in m /s, (cubic metres per second) as a line graph Hours from start of rain storm
9 Discharge (m /s) 1 4 mm The rising discharge or rising flood water in the river Hours from start of rain storm
10 Discharge (m /s) Peak flow Peak flow Maximum discharge in the river 1 4 mm Hours from start of rain storm
11 Discharge (m /s) Peak flow Falling flood water in the river 1 4 mm Hours from start of rain storm
12 Discharge (m /s) 1 4 Basin lag time mm Peak flow Basin lag time Time difference between the peak of the rain storm and the peak flow of the river Hours from start of rain storm
13 Discharge (m /s) Basin lag time Peak flow Base flow Normal discharge of the river 1 4 mm Base flow Hours from start of rain storm
14 Discharge (m /s) Basin lag time Peak flow Overland flow + Through flow mm Overland flow = Storm Flow 1 4 Through flow Base flow Hours from start of rain storm

15 Overland flow Volume of water reaching the river from surface run off Through flow Volume of water reaching the river through the soil and underlying rock layers
16 Discharge (m /s) Basin lag time mm Overland flow Peak flow Annotate your blank hydrograph to show the main features 1 4 Through flow Base flow Hours from start of rain storm
17
18 Analysis
19 Discharge (m /s) Interpretation of Storm You need to refer to: Rising Limb Recession Limb Lag time Rainfall Intensity Hydrographs Basin lag time Hours from start of rain storm Peak flow compared to Base flow Recovery rate, back to Base flow 1 4 mm Overland flow Peak flow Through flow Base flow
20 Exam Question Using your annotated hydrograph, explain the changes in the discharge of the river over the period of time shown?
21 Writing Frame Say what the discharge is like to start with (give amount). Explain why. Say that the river is supplied by baseflow at this point. Explain this. Say when the rainfall starts and when it peaks (what is the peak amount?). What happens to discharge as a result (comment on the rising limb)? When is the river supplied by throughflow and overland flow? Why do these processes happen? When does the discharge peak and what is the amount? What is the lag time? (difference in hours between peak rainfall and peak discharge). Explain the time delay. When does the discharge start to fall? (comment on the recession limb). Why has it decreased? At what time does the discharge return to its original base flow level?
22 A Model Answer!!!! To begin with the river discharge is relatively low, below1m /s. This is caused by the lack of rainfall in the drainage basin. The main source of water in the river at this point is that supplied by base flow which means that water is filtering into the river as groundwater flow. After 6 hours there is heavy rainfall in the drainage basin, reaching a maximum (peak rainfall) of 4.5 mm hours later. This rainfall causes a corresponding increase in discharge levels, as shown by the steep rising limb. As discharge levels rise above 1m /s the water in the river is supplied by throughflow as the groundwater is already saturated. As levels rise further (from 1.5 to m /s) overland flow becomes the main source of water transfer to the river as no further water can soak into the soil. The peak discharge is.5m /s and occurs 4 hours after the start of the rainfall event. The basin lag therefore is 16 hours. The time delay is caused by the time taken for water to infiltrate the soil and percolate into the groundwater. As rainfall decreases the discharge of the river falls, noted by the recession limb. Overland flow stops and 48 hours after the storm, the river is supplied by water throughflow and baseflow. After 60 hours throughflow also stops, returning discharge levels to normal (below 1m /s) and supply of water comes only from baseflow.
23 Your turn!

24 Mark scheme
25 Another example Describe and account for the changes in discharge levels of the river over the time period shown.
26 Factors Affecting The Shape of Flood Hydrographs (collect spider diagram)
27 Area Large basins receive more precipitation than small therefore have larger runoff Larger size means longer lag time as water has a longer distance to travel to reach the trunk river Area Rock Type Drainage Density Shape Soil Precipitation / Temp Slope Land Use Tidal Conditions
28 Shape Elongated basin will produce a lower peak flow and longer lag time than a circular one of the same size Area Rock Type Drainage Density Shape Soil Precipitation / Temp Slope Land Use Tidal Conditions
29 Slope Channel flow can be faster down a steep slope therefore steeper rising limb and shorter lag time Area Rock Type Drainage Density Shape Soil Precipitation / Temp Slope Land Use Tidal Conditions
30 Rock Type Permeable rocks mean rapid infiltration and little overland flow therefore shallow rising limb Area Rock Type Drainage Density Shape Soil Precipitation / Temp Slope Land Use Tidal Conditions
31 Soil Infiltration is generally greater on thick soil, although less porous soils eg. clay act as impermeable layers The more infiltration occurs the longer the lag time and shallower the rising limb Area Rock Type Drainage Density Shape Soil Precipitation / Temp Slope Land Use Tidal Conditions
32 Land Use Urbanisation - concrete and tarmac form impermeable surfaces, creating a steep rising limb and shortening the time lag Afforestation - intercepts the precipitation, creating a shallow rising limb and lengthening the time lag Area Rock Type Drainage Density Shape Soil Precipitation / Temp Slope Land Use Tidal Conditions
33 Drainage Density A higher density will allow rapid overland flow Area Rock Type Drainage Density Shape Soil Precipitation / Temp Slope Land Use Tidal Conditions
34 Precipitation & Temperature Short intense rainstorms can produce rapid overland flow and steep rising limb If there have been extreme temperatures, the ground can be hard (either baked or frozen) causing rapid surface run off Snow on the ground can act as a store producing a long lag time and shallow rising limb. Once a thaw sets in the rising limb will become steep Area Rock Type Drainage Density Shape Soil Precipitation / Temp Slope Land Use Tidal Conditions
35 Remember these influencing factors will: Influence each other Change throughout the rivers course
36 Task: Glue the spider diagram of factors affecting hydrographs into your folder, then use it to complete the questions below: 1) Explain how the following will affect the rising limb, lag time and discharge of a hydrograph: a) Planting trees in a drainage basin b) Laying concrete in a drainage basin c) a drainage basin consisting of permeable rocks d) a drainage basin containing impermeable rocks. ) Glue in the diagrams of the drainage basins and respective hydrographs for Drainage Basins A and B (Fig 17.6). Now DESCRIBE and EXPLAIN the differences between them (Fig 17.7 in Blue Wider World will help you).
37 Check Your answers Drainage basin A has a steeper rising limb than Basin B. This is because it has more streams in it, therefore water is collected quickly and transferred into the main river much faster than basin B which has a lower density of streams. Basin A also has steep slopes, whereas B s slopes are more gentle. This speeds up the run-off time in A, giving a steeper rising limb and shorter lag time ( hours) than B (51 hours). Basin B contains forest which means more Interception and therefore a delay in water reaching the river, hence the longer lag time. This also explains the lower discharge of the river, as there is more potential for water storage. The soil in A is very thin, which results in less infiltration than B which has deeper soil. This is another reason why the rising limb is steeper and lag time shorter in A where water transfer is more likely to be by run-off. Also, the impermeable rock in Basin A prevents percolation of water down through the soil and rocks, so again increases speed of water transfer to the River, compared to B which has permeable rocks.
38 Example exam question explain
39 Mark scheme No diagram = no full marks
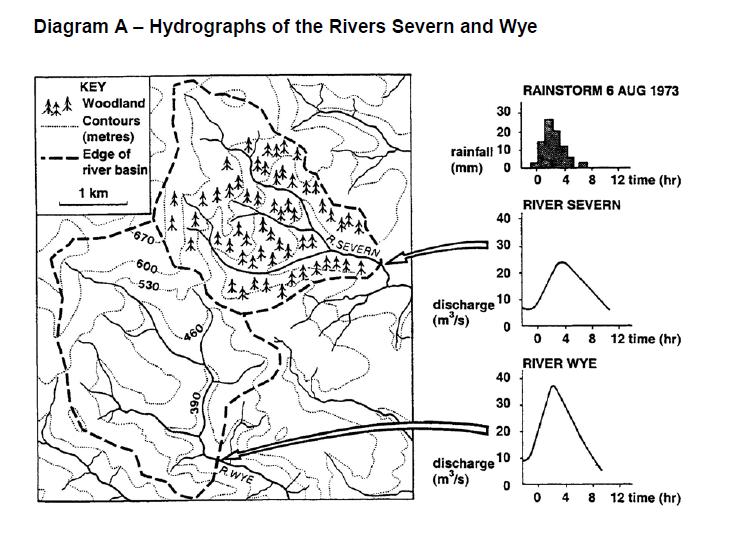
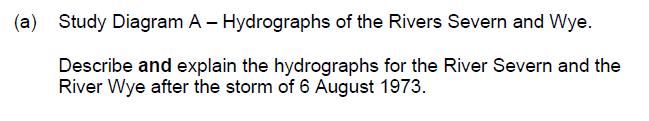
40 (b)
41

42 Mark Scheme
The Drainage Basin System
 The Drainage Basin System These icons indicate that teacher s notes or useful web addresses are available in the Notes Page. This icon indicates that the slide contains activities created in Flash. These
River Channel Characteristics
 River Channel Characteristics Storages and Transfers in Drainage Basins Precipitation Evapotranspiration SURFACE STORAGE INTERCEPTION STORAGE CHANNEL STORAGE Soil Moisture Storage Aeration Zone Storage
Definitions 3/16/2010. GG22A: GEOSPHERE & HYDROSPHERE Hydrology
 GG22A: GEOSPHERE & HYDROSPHERE Hydrology Definitions Streamflow volume of water in a river passing a defined point over a specific time period = VxA discharge m 3 s -1 Runoff excess precipitation - precipitation
Introduction, HYDROGRAPHS
 HYDROGRAPHS Sequence of lecture Introduction Types of Hydrograph Components of Hydrograph Effective Rainfall Basin Lag or Time Lag Parts of Hydrograph Hydrograph Analysis Factors Affecting Hydrograph Shape
Page 1. Name:
 Name: 7574-1 - Page 1 1) The diagram below shows the result of leaving an empty, dry clay flowerpot in a full container of water for a period of time. The water level in the container dropped to level
The Water Cycle. 1. The diagram below is a cross-sectional view of rain falling on a farm field and then moving to the water table.
 1. The diagram below is a cross-sectional view of rain falling on a farm field and then moving to the water table. Which word best describes the movement of the rainwater through zone A? A. runoff B. saturation
Module 8: Weathering, Erosion, and Groundwater Topic 5 Content: The Water Cycle Presentation Notes. The Water Cycle
 The Water Cycle 1 Imagine taking a trip around the water cycle as a single drop of water. This cycle has no beginning or ending point, so it does not matter where the trip starts. Since over 70% of the
The Water Cycle and Water Insecurity
 The Water Cycle and Water Insecurity EQ1: What are the processes operating within the hydrological cycle from global to local scale? 6 & 8 markers = AO1. 12 & 20 markers = AO1 and AO2 larger weighting
Global Water. Globally, 1.2 billion people live in areas with water supply.source:internationalwater
 Water Resources Global Water Globally, 1.2 billion people live in areas with water supply.source:internationalwater inadequate How sustainable are freshwater resources? 80 countries with 40% of world pop.
Wisconsin s Buried Treasure: Groundwater Basics. Kevin Masarik Center for Watershed Science and Education
 Wisconsin s Buried Treasure: Groundwater Basics Kevin Masarik Center for Watershed Science and Education Groundwater is Valuable to Wisconsin 95% of Wisconsin Communities 75% of Wisconsin Citizens rely
Unit 2: Weather Dynamics Chapter 1: Hydrological Cycle
 UNIT 2 Chapter 1: Inquiring about Weather Unit 2: Weather Dynamics Chapter 1: Hydrological Cycle Science 10 Mrs. Purba Importance of H 2 O From the beginning of time when water first appeared, it has been
Water Budget III: Stream Flow P = Q + ET + G + ΔS
 Water Budget III: Stream Flow P = Q + ET + G + ΔS Why Measure Streamflow? Water supply planning How much water can we take out (without harming ecosystems we want to protect) Flood protection How much
Water Budget III: Stream Flow P = Q + ET + G + ΔS
 Water Budget III: Stream Flow P = Q + ET + G + ΔS Why Measure Streamflow? Water supply planning How much water can we take out (without harming ecosystems we want to protect) Flood protection How much
Hydrologic cycle, runoff process
 Hydrologic cycle, runoff process Motivation of hydrological modelling What happens at the catchment and in the stream when it rains? How does the increased/decreased runoff affect (not only) the landowners
Water Budget III: Stream Flow P = Q + ET + G + ΔS
 Water Budget III: Stream Flow P = Q + ET + G + ΔS Why Measure Streamflow? Water supply planning How much water can we take out (without harming ecosystems we want to protect) Flood protection How much
Water Budget III: Stream Flow P = Q + ET + G + ΔS
 Water Budget III: Stream Flow P = Q + ET + G + ΔS Why Measure Streamflow? Water supply planning How much water can we take out (without harming ecosystems we want to protect) Flood protection How much
General Groundwater Concepts
 General Groundwater Concepts Hydrologic Cycle All water on the surface of the earth and underground are part of the hydrologic cycle (Figure 1), driven by natural processes that constantly transform water
Stream Hydrology. Watershed 8/29/13. Area that contributes water to a point on a stream Scale is user-defined Other names: Catchment Drainage basin
 Stream Hydrology Watershed Area that contributes water to a point on a stream Scale is user-defined Other names: Catchment Drainage basin http://warnercnr.colostate.edu/geo/front_range/poudre.php# 1 Basics
Chapter 1 Introduction
 Engineering Hydrology Chapter 1 Introduction 2016-2017 Hydrologic Cycle Hydrologic Cycle Processes Processes Precipitation Atmospheric water Evaporation Infiltration Surface Runoff Land Surface Soil water
RUNNING WATER AND GROUNDWATER
 NAME RUNNING WATER AND GROUNDWATER I. Introduction In this exercise we will investigate various features associated with streams and groundwater. Our drinking water ultimately comes from either streams
Inputs. Outputs. Component/store. Section of a system where material or energy is held. Something that enters the system (material or energy)
") .. Inputs Something that enters the system (material or energy) Outputs Something that leaves the system (material or energy) Component/store Section of a system where material or energy is held Transfer/flow
.. Inputs Something that enters the system (material or energy) Outputs Something that leaves the system (material or energy) Component/store Section of a system where material or energy is held Transfer/flow
Introduction. Welcome to the Belgium Study Abroad Program. Courses:
 Introduction Welcome to the Belgium Study Abroad Program Courses: AGSM 335: Soil and Water Management BAEN 460: Principals of Environmental Hydrology BAEN 460 / AGSM 335 Combined lecture and HW sessions
A damming report Why are some strategies for flood management more sustainable than others?
 A damming report Why are some strategies for flood management more sustainable than others? Instructions Record your answers in this booklet for revision you are not allowed to have anything in the exam
Chapter 3 Stream Discharge
 Chapter 3 Stream Discharge - Introductory Level Volunteer Water Quality Monitoring Training Notebook - What is Discharge (Flow)? Discharge, also called flow, is the amount of water that flows past a given
What is runoff? Runoff. Runoff is often defined as the portion of rainfall, that runs over and under the soil surface toward the stream
 What is runoff? Runoff Runoff is often defined as the portion of rainfall, that runs over and under the soil surface toward the stream 1 COMPONENTS OF Runoff or STREAM FLOW 2 Cont. The types of runoff
Groundwater Level and Movement
 Groundwater Level and Movement Infiltration and Recharge Infiltration Entry of rain water into the ground. Recharge Addition of infiltrated water to the aquifer. Two types of Recharge- 1. Natural 2. Artificial
The Hydrological Cycle
 Hydrological Cycle The Hydrological Cycle What is the Hydrological Cycle? Hydrological cycle = The Water cycle What is precipitation, evaporation and condensation? Evaporation = Liquid to Gas (gains energy)
Topic 3, Subtopic A of Review Handbook or Chapter 10 of Earth Science Book. 97% of Earth s water is found as saltwater in Earth s oceans.
 Topic 3, Subtopic A of Review Handbook or Chapter 10 of Earth Science Book Groundwater 97% of Earth s water is found as saltwater in Earth s oceans. That leaves only 3% for freshwater! But 90% of the freshwater
Runoff Processes. Daene C. McKinney
 CE 374 K Hydrology Runoff Processes Daene C. McKinney Watershed Watershed Area draining to a stream Streamflow generated by water entering surface channels Affected by Physical, vegetative, and climatic
Computation of excess stormflow at the basin scale. Prof. Pierluigi Claps. Dept. DIATI, Politecnico di Torino
 Computation of excess stormflow at the basin scale Prof. Pierluigi Claps Dept. DIATI, Politecnico di Torino Pierluigi.claps@polito.it losses include: interception, evapotranspiration, storage infiltration,
NREM 407/507 WATERSHED MANAGEMENT Day 2
 NREM 407/507 WATERSHED MANAGEMENT 1-15-09 - Day 2 1. Review Hydrologic Cycle Terminology/Model 2. Summarize Differences Cropfield vs Perennial Watershed 3. Tues Lab Develop International River PPT bring
Timing Key Narrative Snapshots a) 00:44 How does groundwater recharge occur? How do streams form?
 00:44 How does groundwater recharge occur? How do streams form?") Module 4 Narration: Runoff and Recharge Timing Key Narrative Snapshots a) 00:44 How does groundwater recharge occur? How do streams form? These processes are closely linked. Lets first investigate how
Module 4 Narration: Runoff and Recharge Timing Key Narrative Snapshots a) 00:44 How does groundwater recharge occur? How do streams form? These processes are closely linked. Lets first investigate how
CHAPTER 4 DISCUSSION. Total Flow. For the study watershed, the water budget equation is defined as inflow equals
 CHAPTER 4 DISCUSSION Total Flow For the study watershed, the water budget equation is defined as inflow equals outflow minus any losses. Inflow consists of precipitation. Outflow consists of stream flow
Watershed hydrology and catchment response
 Watershed hydrology and catchment response Motivation Studying stream response to water input events (catchment response) is important for: Water supply: Precipitation falling in the ground and then moving
Analysis of Runoff Reduction and Hydrologic Cycle Utilizing LID Concepts
 Maine Stormwater Conference (Portland, ME, 2015) Analysis of Runoff Reduction and Hydrologic Cycle Utilizing LID Concepts Park Jongpyo, Lee Kyoungdo: HECOREA. INC Shin Hyunsuk: Busan National University
Read p.4 Activity. Class Discussion (The many ways people use water) P. 5. Read p.6 Read pp. 8-9
 P. 5. Read p.6 Read pp. 8-9") Grade 8 Science Read p.4 Activity Class Discussion (The many ways people use water) P. 5 Read p.6 Read pp. 8-9 Water exists everywhere on Earth, and covers 70% of its surface. 97% of this water is found
Grade 8 Science Read p.4 Activity Class Discussion (The many ways people use water) P. 5 Read p.6 Read pp. 8-9 Water exists everywhere on Earth, and covers 70% of its surface. 97% of this water is found
FAST WATER / SLOW WATER AN EVALUATION OF ESTIMATING TIME FOR STORMWATER RUNOFF
 FAST WATER / SLOW WATER AN EVALUATION OF ESTIMATING TIME FOR STORMWATER RUNOFF Factors Affecting Stormwater Runoff: Rainfall intensity % Impervious surfaces Watershed size Slope Soil type, soil compaction
FACT FLASH. 5: Groundwater. What is groundwater? How does the ground store water? Fact Flash 5: Groundwater
 FACT FLASH 5: Groundwater What is groundwater? Groundwater is fresh water (from rain or melting ice and snow) that soaks into the soil and is stored in the tiny spaces (pores) between rocks and particles
SOUTHEAST TEXAS CONTINUING EDUCATION
 EXAM No. 118 FLOOD - RUNOFF ANALYSIS 1. Information gained from flood - runoff analysis includes which one: A. Stage, discharge, volume. B. Measure depth, volume. C. Velocity, depth, storm occurrence.
Hydrogeology of Prince Edward Island
 Hydrogeology of Prince Edward Island General Characteristics and Groundwater on Prince Edward Island General Characteristics and Key Issues Issues PEI Dept. of Environment, Energy and Forestry 9/29/2009
This PowerPoint presentation can be downloaded from Ditch_10.asp. Slide 1. Slide 2
 Slide 1 This PowerPoint presentation can be downloaded from http://ei.cornell.edu/watersheds/ditches/ Ditch_10.asp. Roadside Ditches A Watershed Curriculum Module Rebecca Schneider, Nancy Trautmann, &
Introduction to Urban Drainage. Scott Arthur. Civil Engineering at the School of the Built Environment. [Class 1 - Into+ 1]
![Introduction to Urban Drainage. Scott Arthur. Civil Engineering at the School of the Built Environment. [Class 1 - Into+ 1]](/thumbs/83/87690376.jpg "Introduction to Urban Drainage. Scott Arthur. Civil Engineering at the School of the Built Environment. [Class 1 - Into+ 1]") Introduction to Urban Drainage Scott Arthur s.arthur@hw.ac.uk Civil Engineering at the School of the Built Environment [Class 1 - Into+ 1] Do we even need a drainage system? [Class 1 - Into+ 2] Greenfield
Introduction to Urban Drainage Scott Arthur s.arthur@hw.ac.uk Civil Engineering at the School of the Built Environment [Class 1 - Into+ 1] Do we even need a drainage system? [Class 1 - Into+ 2] Greenfield
CHAPTER FIVE Runoff. Engineering Hydrology (ECIV 4323) Instructors: Dr. Yunes Mogheir Dr. Ramadan Al Khatib. Overland flow interflow
 Instructors: Dr. Yunes Mogheir Dr. Ramadan Al Khatib. Overland flow interflow") Engineering Hydrology (ECIV 4323) CHAPTER FIVE Runoff Instructors: Dr. Yunes Mogheir Dr. Ramadan Al Khatib Overland flow interflow Base flow Saturated overland flow ١ ٢ 5.1 Introduction To Runoff Runoff
Engineering Hydrology (ECIV 4323) CHAPTER FIVE Runoff Instructors: Dr. Yunes Mogheir Dr. Ramadan Al Khatib Overland flow interflow Base flow Saturated overland flow ١ ٢ 5.1 Introduction To Runoff Runoff
Effect of Land Surface on Runoff Generation
 Effect of Land Surface on Runoff Generation Context: Hydrologic Cycle Runoff vs Infiltration Infiltration: Process by which water on the ground surface enters the soil Runoff: Water (from rain, snowmelt,
Freshwater. 260 Points Total
 9 SURFACE WATER SECTION 9.1 Surface Water Movement In your textbook, read about surface water and the way in which it moves sediment. Complete each statement. (13 points) 1. An excessive amount of water
MODULE 1 RUNOFF HYDROGRAPHS WORKSHEET 1. Precipitation
 Watershed MODULE 1 RUNOFF HYDROGRAPHS WORKSHEET 1 A watershed is an area of land thaaptures rainfall and other precipitation and funnels it to a lake or stream or wetland. The area within the watershed
The soil is a very. The soil can. The manure. Soil Characteristics. effective manure treatment system if manures are applied at the proper rate.
 The soil is a very effective manure treatment system if manures are applied at the proper rate. The soil can filter pollutants and prevent them from reaching groundwater. The manure application rate should
QU: How do human activities disrupt drainage basin processes. AIM: To example and explain the above through examining human uses of the Amazon basin.
 QU: How do human activities disrupt drainage basin processes. AIM: To example and explain the above through examining human uses of the Amazon basin. ST: Answer the How many countries is the basin part
5/11/2007. WinTR-55 for Plan Reviewers Small Watershed Hydrology Hydrology Terms and Definitions
 WinTR-55 for Plan Reviewers Small Watershed Hydrology Hydrology Terms and Definitions 1 Course Outline Overview Review of Hydrology Terms and Definitions Modeling Single Sub-area Watersheds Multiple Sub-area
Module 3. Lecture 4: Introduction to unit hydrograph
 Lecture 4: Introduction to unit hydrograph (UH) The unit hydrograph is the unit pulse response function of a linear hydrologic system. First proposed by Sherman (1932), the unit hydrograph (originally
Introduction to Hydrology, Part 2. Notes, Handouts
 Introduction to Hydrology, Part 2 Notes, Handouts Precipitation Much of hydrology deals with precipitation How much? How frequently/infrequently? What form? How quickly? Seasonal variation? Drought frequency?
BS8582, Code of Practice for Surface Water Management for Development Sites
 BSI Draft Review BS8582, Code of Practice for Surface Water Management for Development Sites Code of Practice for Surface Water Management Comment: The introduction of a specific British Standard which
Geologic description of the Pocatello Aquifer
 Geologic description of the Pocatello Aquifer The upper layers of the aquifer are the most permeable (water flows through most easily), and are formed from gravels deposited during and after the catastrophic
5/25/2017. Overview. Flood Risk Study Components HYDROLOGIC MODEL (HEC-HMS) CALIBRATION FOR FLOOD RISK STUDIES. Hydraulics. Outcome or Impacts
 CALIBRATION FOR FLOOD RISK STUDIES. Hydraulics. Outcome or Impacts") HYDROLOGIC MODEL (HEC-HMS) CALIBRATION FOR FLOOD RISK STUDIES C. Landon Erickson, P.E.,CFM Water Resources Engineer USACE, Fort Worth District April 27 th, 2017 US Army Corps of Engineers Overview Flood
HYDROLOGIC MODEL (HEC-HMS) CALIBRATION FOR FLOOD RISK STUDIES C. Landon Erickson, P.E.,CFM Water Resources Engineer USACE, Fort Worth District April 27 th, 2017 US Army Corps of Engineers Overview Flood
Hydrosphere: Water Distribution
 Hydrosphere: Water Distribution 1.Think About It Why is it that the water in your bottle could have been drunk by George Washington? 2. The Hydrosphere: An Overview The hydrosphere is ALL the water on/in/over
Water Resources. The Water Cycle. Section 1. Key Terms surface water river system watershed groundwater aquifer porosity permeability recharge zone
 Water Resources The next time you drink a glass of water, think about where the water came from. Did you know that some of the water in your glass may have been part of a rainstorm that pounded Earth long
4/28/17. Size of Floods - Hydrograph Depicts flood data from gaging station; Hydrographs usually show Q vs. time
 GEOL 118 Final Exam Format similar to exams 1 and 2 Covers Lectures #27 40 (Global Climate Change I - Meteorite Impacts III) #35 Floods - II (Size, Prediction, Urbanization, Mitigation) 8:00, Thursday,
CIVE22 BASIC HYDROLOGY Jorge A. Ramírez Homework No 7
 Hydrologic Science and Engineering Civil and Environmental Engineering Department Fort Collins, CO 80523-1372 (970) 491-7621 CIVE22 BASIC HYDROLOGY Jorge A. Ramírez Homework No 7 1. Obtain a Unit Hydrograph
Presented by: Peter Spal, IBI Group. OECS Regional Engineering Workshop October 1, 2014
 Presented by: Peter Spal, IBI Group OECS Regional Engineering Workshop October 1, 2014 Presentation Topics Principles of Hydrology rational formula, unit hydrograph Modeling Methods SWMMHYMO Synthetic
Climate Change Water Implications for Michigan Communities, Landsystems and Agriculture
 Climate Change Water Implications for Michigan Communities, Landsystems and Agriculture Distinguished Senior Research Specialist Department of Geography Institute of Water Research Climate Change Summary
Understanding Hydrologic Process for Better Stormwater Management
 Understanding Hydrologic Process for Better Stormwater Management Scott A. Brown, P.E. Larry A.J. Fennessey, Ph.D., P.E. Gary W. Peterson, Ph.D., P.E. Civil and Environmental Engineering GOAL to project
Lecture 11: Water Flow; Soils and the Hydrologic Cycle
 Lecture 11: Water Flow; Soils and the Hydrologic Cycle Water Flow in Soils Types of Water Flow in Soil Saturated flow: Soil pores completely filled with water; controlled by the hydrostatic potential After
Porous Pavement Flow Paths
 POROUS PAVEMENT MODELING Clear Creek Solutions, Inc., 2010 Porous pavement includes porous asphalt or concrete and grid/lattice systems (nonconcrete) and paving blocks. The use of any of these types of
Understanding Stormwater Pollution Prevention Plans (SWPPPs) (SWPPPS)
 (SWPPPS)") Understanding Stormwater Pollution Prevention Plans (SWPPPs) (SWPPPS) Definitions SWPPP: Storm Water Pollution Prevention Plan BMP: Best Management Practice(s) to control pollution IDNR: Iowa Department
Understanding Stormwater Pollution Prevention Plans (SWPPPs) (SWPPPS) Definitions SWPPP: Storm Water Pollution Prevention Plan BMP: Best Management Practice(s) to control pollution IDNR: Iowa Department
Lecture 9A: Drainage Basins
 GEOG415 Lecture 9A: Drainage Basins 9-1 Drainage basin (watershed, catchment) -Drains surfacewater to a common outlet Drainage divide - how is it defined? Scale effects? - Represents a hydrologic cycle
Cumulative Precipitation
 Problem 1: Hyetograph Construction (4 pts) Use the rainfall information below to construct both the cumulative (inch) and incremental (in/hr) hyetographs. Note: the incremental hyetograph must be formatted
NAME: Log onto YouTube and search for jocrisci channel.
 NAME: Log onto YouTube and search for jocrisci channel. ENERGY (Videos 7.1 & 7.2 ESRT 1e, 14c) 1. You must know the differences between the three ways energy is transferred: a. What is conduction? i. Give
Matt Lundsted Principal Comprehensive Environmental Inc.
 Matt Lundsted Principal Comprehensive Environmental Inc. Traditional Development vs. LID Application of LID to New and Redeveloped Sites Standard Engineering Practice Q = CIA Minimum velocity of 3 ft/sec.
1.6 Influence of Human Activities and Land use Changes on Hydrologic Cycle
 1.6 Influence of Human Activities and Land use Changes on Hydrologic Cycle Watersheds are subjected to many types of changes, major or minor, for various reasons. Some of these are natural changes and
Highway Drainage 1- Storm Frequency and Runoff 1.1- Runoff Determination
 Highway Drainage Proper drainage is a very important consideration in design of a highway. Inadequate drainage facilities can lead to premature deterioration of the highway and the development of adverse
Water is a solid, liquid, & gas. 71% of earth s surface is water. Our body is two-thirds water. Fresh water water that is not salty and has little or
 Water is a solid, liquid, & gas. 71% of earth s surface is water. Our body is two-thirds water. Fresh water water that is not salty and has little or no taste, color, or smell. Salt water water that contains
Wisconsin s Buried Treasure
 Wisconsin s Buried Treasure Kevin Masarik Center for Watershed Science and Education Through the University of Wisconsin-Extension, all Wisconsin people can access University resources and engage in lifelong
1 THE USGS MODULAR MODELING SYSTEM MODEL OF THE UPPER COSUMNES RIVER
 1 THE USGS MODULAR MODELING SYSTEM MODEL OF THE UPPER COSUMNES RIVER 1.1 Introduction The Hydrologic Model of the Upper Cosumnes River Basin (HMCRB) under the USGS Modular Modeling System (MMS) uses a
Water exists everywhere on Earth, and covers 70% of its surface. 97% of this water is found in the oceans.
 10.1 Distribution of Water Water exists everywhere on Earth, and covers 70% of its surface. 97% of this water is found in the oceans. w Another 2% is ice and snow, leaving only 1% as fresh water found
Stream hydrographs. Stream hydrographs. Baseflow. Graphs of river stage or discharge at a single location as a function of time
 Stream hydrographs Graphs of river stage or discharge at a single location as a function of time Hydrologic og budget Discharge: units? How is it measured? Show fluctuating water levels in response to
Hydrologic Engineering Center Hydrologic Modeling System (HEC-HMS) Sunil KUMAR Director, National Water Academy
 Sunil KUMAR Director, National Water Academy") Hydrologic Engineering Center Hydrologic Modeling System (HEC-HMS) Sunil KUMAR Director, National Water Academy 22 April 2015 NWA, Pune Exercise Objective: To determine hydrological Response of the given
Hydrologic Engineering Center Hydrologic Modeling System (HEC-HMS) Sunil KUMAR Director, National Water Academy 22 April 2015 NWA, Pune Exercise Objective: To determine hydrological Response of the given
WHAT IS SOIL? soil is a complex system of organic and inorganic (mineral) compounds Soil properties depend on formation process particle size climate
 compounds Soil properties depend on formation process particle size climate") Lecture 5, Soil water and infiltration WHAT IS SOIL? soil is a complex system of organic and inorganic (mineral) compounds Soil properties depend on formation process particle size climate THE IMPORTANCE
Lecture 5, Soil water and infiltration WHAT IS SOIL? soil is a complex system of organic and inorganic (mineral) compounds Soil properties depend on formation process particle size climate THE IMPORTANCE
Thanks to Bill Elliot, Research Leader U.S. Department of Agriculture Forest Service
 Thanks to Bill Elliot, Research Leader U.S. Department of Agriculture Forest Service To present an overview Forest Soil Erosion Processes 2 Precipitation or melting snow Evapotranspiration Infiltration
Chapter 3 Physical Factors Affecting Runoff
 Chapter 3 Physical Factors Affecting Runoff Copyright 2003 David G Tarboton, Utah State University CHAPTER 3: PHYSICAL FACTORS AFFECTING RUNOFF The general climatic regime controls the total volume of
Chapter 6. The Empirical version of the Rational Method
 Chapter 6 The Empirical version of the Rational Method The Empirical version is named because the parameters it uses (apart from rainfall data) are arbitrary and are generally based on experience or observation
LAKE COUNTY HYDROLOGY DESIGN STANDARDS
 LAKE COUNTY HYDROLOGY DESIGN STANDARDS Lake County Department of Public Works Water Resources Division 255 N. Forbes Street Lakeport, CA 95453 (707)263-2341 Adopted June 22, 1999 These Standards provide
Uncertainty in Hydrologic Modelling for PMF Estimation
 Uncertainty in Hydrologic Modelling for PMF Estimation Introduction Estimation of the Probable Maximum Flood (PMF) has become a core component of the hydrotechnical design of dam structures 1. There is
CHAPTER ONE : INTRODUCTION
 CHAPTER ONE : INTRODUCTION WHAT IS THE HYDROLOGY? The Hydrology means the science of water. It is the science that deals with the occurrence, circulation and distribution of water of the earth and earth
ENGINEERING HYDROLOGY
 ENGINEERING HYDROLOGY Prof. Rajesh Bhagat Asst. Professor Civil Engineering Department Yeshwantrao Chavan College Of Engineering Nagpur B. E. (Civil Engg.) M. Tech. (Enviro. Engg.) GCOE, Amravati VNIT,
This document consists of 20 printed pages.
 Cambridge International Examinations Cambridge International Advanced Subsidiary and Advanced Level GEOGRAPHY 9696/11 Paper 1 Core Geography MARK SCHEME Maximum Mark: 100 Published This mark scheme is
The drought mystery lesson
 The drought mystery lesson This is a thinking skills lesson, with extension questions, to deepen students understanding of the issues involved in a drought. This lesson could be used after the KS3 or KS4
HYDROLOGIC CONSIDERATIONS. 22 nd Annual Nonpoint Source Pollution Conference Saratoga Springs, NY
 LOW IMPACT DEVELOPMENT HYDROLOGIC CONSIDERATIONS 22 nd Annual Nonpoint Source Pollution Conference Saratoga Springs, NY May 18, 2011 PRESENTATION AGENDA Introduction Definitions Discuss Impacts to Hydrologic
Paraprofessional Training Session 1
 Paraprofessional Training Session 1 Part 2: Stormwater Basics November 26, 2012 Rutgers University, Cook Campus Christopher C. Obropta, Ph.D., P.E. Extension Specialist in Water Resources Associate Professor
2
 1 2 3 4 5 6 The program is designed for surface water hydrology simulation. It includes components for representing precipitation, evaporation, and snowmelt; the atmospheric conditions over a watershed.
Engineering Hydrology. Class 16: Direct Runoff (DRO) and Unit Hydrographs
 and Unit Hydrographs") Engineering Hydrology Class 16: and s Topics and Goals: 1. Calculate volume of DRO from a hydrograph; 2. Complete all steps to develop a. Class 14: s? HG? Develop Ocean Class 14: s? HG? Develop Timing
Engineering Hydrology Class 16: and s Topics and Goals: 1. Calculate volume of DRO from a hydrograph; 2. Complete all steps to develop a. Class 14: s? HG? Develop Ocean Class 14: s? HG? Develop Timing
Issue paper: Aquifer Water Balance
 Issue paper: Aquifer Water Balance 1. Introduction And Background 1.1. Purpose and Scope The population in Kitsap County has grown rapidly in recent years and is expected to increase substantially in the
HYDROLOGICAL IMPACTS OF URBANIZATION: WHITE ROCK CREEK, DALLAS TEXAS. Julie Anne Groening Vicars, B.A. Thesis Prepared for the Degree of
 HYDROLOGICAL IMPACTS OF URBANIZATION: WHITE ROCK CREEK, DALLAS TEXAS Julie Anne Groening Vicars, B.A. Thesis Prepared for the Degree of MASTER OF SCIENCE UNIVERSITY OF NORTH TEXAS December 25 APPROVED:
Site Development for Hoop Barns. Richard R. Brunke P. Eng. Regional Agricultural Engineer Manitoba Agriculture and Food
 Site Development for Hoop Barns Richard R. Brunke P. Eng. Regional Agricultural Engineer Manitoba Agriculture and Food Introduction: In discussing site development, we must understand how to determine
Numerical Integration of River Flow Data
 Numerical Integration of River Flow Data CVEN 3 9 1 Introduction River streamflow data contain important information both about stormwater runoff and groundwater baseflow. Stormwater runoff generally consists
Review for Chapter 1 Introduction. 1. Sketch the hydrologic cycle and label the location and movement of water.
 Review for Chapter 1 Introduction 1. Sketch the hydrologic cycle and label the location and movement of water. 2. Describe the hydrologic cycle (use a graph to support your description) 3. Define the science
56 JOURNAL OF THE ALABAMA ACADEMY OF SCIENCE
 Reprinted from the Journal of the Alabama. Academy of Science, Volume 29. October 1, 1957. SECTION IV EFFECTS OF LAND USE ON STREAMFLOW By DONALD E. WHELAN Coweeta Hydrologic Laboratory, Dillard, Georgia
Engineering Hydrology
 Engineering Hydrology 040454 Introduction Instructor: Dr. Zeyad Tarawneh Course Contents Introduction, watershed and flow: Definition, hydrologic cycle, water balance, watersheds, statistical methods in
Review of Chapter 1. Taken from: Check Your Understanding sections p. 13, 21 and 33
 Review of Chapter 1 Taken from: Check Your Understanding sections p. 13, 21 and 33 In case you were curious: Henry Hudson The Last Voyage of Henry Hudson, 1611 Painted in 1880 by: John Collier Today Hudson
LECTURE #19: Floods & Flooding Hazards
 GEOL 0820 Ramsey Natural Disasters Spring, 2018 LECTURE #19: Floods & Flooding Hazards Date: 29 March 2018 I. Flooding Hazards: what is a flood? o damaging floods result when the volume of river flow exceeds