Georgica Pond Progress: Executing a Sustainable Plan for Remediation. Christopher J. Gobler, PhD
|
|
|
- Giles Johns
- 5 years ago
- Views:
Transcription

1 Georgica Pond Progress: Executing a Sustainable Plan for Remediation Christopher J. Gobler, PhD
2 Outline of presentation Background on Georgica Pond 2016 status and trends Options for improving the conditions in Georgica Pond
3 What has been ailing Georgica Pond?


4 Georgica Pond, blue green algae


5 Dangers of cyanotoxins Anabaena Microcystin Anatoxin


6 Temporal dynamics of blue green algae, 2015


7 Microcystin congeners, 2015 *Data in collaboration with Dr. Paul Zimba, Texas A&M


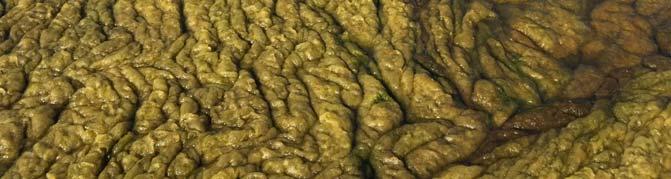


8 Macroalgae


9 Low oxygen, death of wildlife

10 Nitrogen and phosphorus are promoting algal blooms. How much nitrogen and phosphorus is entering Georgica Pond? Where is it coming from?

11 Homes (>2,000) within the Georgica Pond watershed

12 Independent, hybrid nitrogen loading model Lawn fertilizer Wastewater 1% Geese, swans 1% 4% Atmospheric deposition 4% 17% 50% 22% Sediment flux Agricultural fertilizer


13 Independent, hybrid phosphorus loading model Run off Lawn fertilizer Wastewater 11% Geese, swans 6% 6% 9% Atmospheric deposition 1% 2% 4% 61% Sediment flux Agricultural fertilizer

14 2016?
15 2016 general overview Cut was open to the ocean through late March. Upon closing in midspring, the cut has remained close. In 2015, the cut was open for the first six months of the year.
16 Salinity, 2016 ocean salinity is 31 Salinity (kg/g) Salinity fell below 15 by late April Currently 5 < 10 is ideal for blue green algae >15 is inhospitable for blue green algae Lower salinity also brings more nutrients of other algae


17 Algal blooms, 2016 Algal pigment (ug/l) Total algae pigment Blue green algae, July Mahogany Tide, May June
18 Algal blooms, 2016, fluoroprobe Algae (ug/l) Green Blue green Diatom Dinoflagellate Mixed community 0 13 Mar 13 Apr 13 May 13 Jun 13 Jul 13 Aug Mahogany Tide, May June Blue green algae, July

19 Algal blooms, 2015, fluoroprobe Cut open Green Blue green Diatom dinoflagellate Mono specific bloom
20 Blue green algae, August 2015 Blue green algae (ug/l)
21 Blue green algae, August 2014 Blue green algae (ug/l)
22 Blue green algae, August 2016 Blue green algae (ug/l) NYSDEC threshold

23 Current south fork blue green algal blooms Lake Agawam Mill Pond Kellis Pond Old Town Pond Mecox Bay Sagaponack Pond Georgica Pond Wainscott Pond Hook Pond = Blue green algae bloom = No blue green algae bloom
24 Dissolved oxygen, 2016 NYSDEC threshold Dissolved oxygen (mg/l)


25 Dissolved oxygen levels, 2015 v 2016 Dissolved oxygen (mg/l) NYSDEC threshold NYSDEC threshold
26 Management options 2015 What can be done to reduce nutrient delivery and mitigate algal blooms in Georgica Pond?

27 2015: Harvesting macroalgae to mitigate nitrogen and phosphorus Preliminary analyses indicate macroalgae contain 3% nitrogen and 0.2% phosphorus. Algae re grow weekly (good). Weekly removal of macroalgae during summer months would represent a significant removal of nutrients. Preliminary discussions with NYSDEC Marine Habitat Section Head have been positive; a path forward for 2016 has been established.

28 2016: NYSDEC permits obtained, FoGP funded, harvesting began in May


29 What are that macroalgae? Sago Pondweed Cladophora


30 June: 2.43 tons removed July: tons removed For July: ~25% of July phosphorus load ~10% of July nitrogen load Macroalgal harvest

31 The fate of the harvested macroalgae? Renewable resource. Gobler lab investigating converting macroalgae into fertilizer. Preliminary results suggest multiple, marketable products can be yielded from this material.

32 Management options What can be done to reduce nutrient delivery and mitigate algal blooms in Georgica Pond?
33 First step recommendations Upgrade septic systems to maximize the removal of nitrogen. Minimize fertilizer use; switch to organic fertilizers. Create and expand the growth of local and natural vegetation adjacent to Georgica Pond to create buffers that are not fertilized and intercept land runoff.

34 Opening the cut on a regular basis Opening the cut: Flushes out nutrients and algal blooms. Keeps salinity too high for blue green algae. Restricts the regions covered by macroalgae Being open for > six months reduces the accumulation of nitrogen and phosphorus and reduces the need for other reductions.


35 Effect of cut on salinity, blue green algae, 2015

36 Opening the Georgica ocean inlet, change in blue green algae, 2015 Oct 8, inlet open


37 Opening the Georgica ocean inlet, change in blue green algae, 2014 Oct 13, 2014 Oct 17, 2014 October 15, inlet open

38

39 Permeable reactive barriers (PRB) to remove nitrogen, phosphorus PBR can remove N (and perhaps P) from groundwater before it enters Georgica Pond. Targeted placement of PBRs could alleviate nitrogen loading in regions with heavy loads, poor flushing, or both. May be most effective at the headwaters of streams and/or coves where groundwater discharge is concentrated.
40 Groundwater monitoring wells
41 Groundwater monitoring well nitrate values are average of measurements January August 1000 Nitrate (um) ft Depth 10ft Depth 15ft Depth Well Number

42 Groundwater monitoring well, nitrate 4.0 mg/l 0.6 mg/l 4.5 mg/l 2.2 mg/l 5.3 mg/l 1.1 mg/l

43 Dredging Georgica Pond Removal of the thick layer of mud across parts of the Pond could eliminate 50% of the phosphorus and 20% of the nitrogen fueling algal blooms. A greater depth within the Pond would provide more dilution of nutrients and could lower water temperatures. Deepening the passage from Georgica Cove to the Pond will allow the Cove to exchange with the Pond. Dredging the bar along the north end of the pond will permit better exchange to the south.

44 Sediment type and depth of mud in meters, Georgica Pond Meeting with GEI consultants suggested sediment testing for NYSDEC dredging permits Sediment samples collected and being analyzed for NYSDEC contaminants
45


46 Mesocosm experiments, 2016
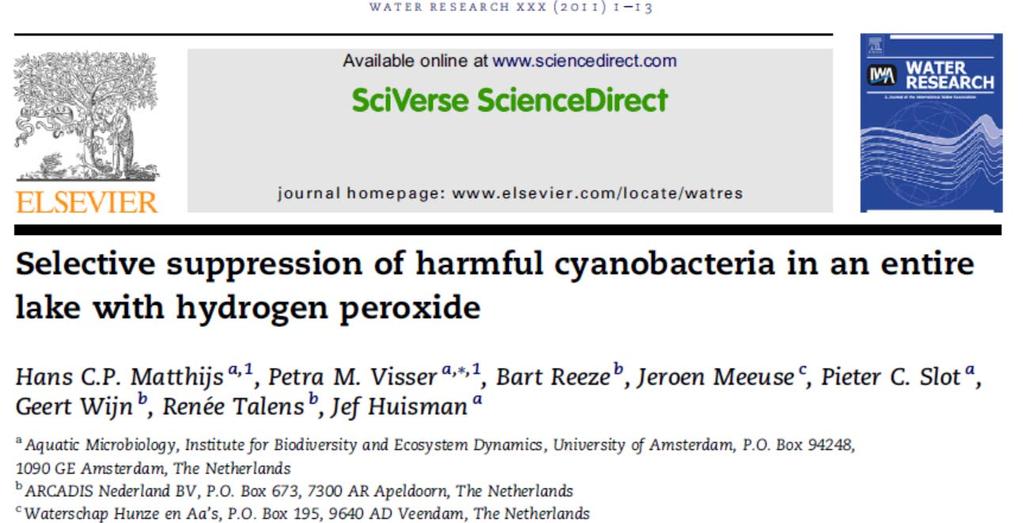
47 Hydrogen peroxide experiment results Control, no treatment Hydrogen peroxide, 2mg/L Start 3 days 7 days 0 Start 3 days 7 days Green Blue green Diatom Green Blue green Diatom Blue green algae bloom Diatoms, no blue green algae
48 Conclusions: Georgica Pond suffers from algal blooms, blue green algae, low oxygen, and fish kills promoted by excessive nitrogen and phosphorus from wastewater and sediments. In 2016, harvesting macroalgae may have reduced the July phosphorus and nitrogen loads by up to ~25% and ~10%. In 2016, blue green algal blooms were short and mild and blue green algae never dominated the Pond. In 2016, macroalgae never dominated the Pond. Groundwater testing has suggested indicated possible locations for permeable reactive barriers to mitigate nitrogen loading. Sample testing has begun to investigating the dredging of muds. Opening the cut regularly will help keep the Pond clean and clear. Hydrogen peroxide may be a useful emergency measure for Georgica Pond in the future. Responsible fertilizer use is required by farms and homeowners. Improving the removal of nitrogen and phosphorus from wastewater is the central long term solution.

49 Acknowledgements: Sincere gratitude for: Leadership of the Friends of Georgica Pond. Generosity of Perelman Foundation & Georgica Pond homeowners Collaboration with The Nature Conservancy Commitment of the East Hampton Town Trustees and Town of East Hampton Thank you to Mark Lusty, Ryan Wallace, Jennifer Janikowiak, and Rob McCabe for field sampling, laboratory work, and data analysis support. Thank you for your attention.
Long-Term Volunteer Lake Monitoring in the Upper Woonasquatucket Watershed
 Long-Term Volunteer Lake Monitoring in the Upper Woonasquatucket Watershed Linda Green URI Watershed Watch 1-87-95, lgreen@uri.edu WATER QUALITY IS A REFLECTION OF THE ACTIVITIES IN THE LANDS AND WATERS
Osher Course. What Lies Beneath the Inland Bays?
 Osher Course What Lies Beneath the Inland Bays? Objectives for Course Describe the Delaware Inland Bays and their tributaries Illustrate the ecology and importance of estuaries Demonstrate the threats
Total Maximum Daily Load Development for Unnamed Tributary to Pitts Creek. Public Meeting March 26, Why Are We Here
 Total Maximum Daily Load Development for Unnamed Tributary to Pitts Creek Public Meeting March, Why Are We Here. Learn about water quality of the stream. Discuss the Total Maximum Daily Load (TMDL) development.
EUTROPHICATION. Student Lab Workbook
 EUTROPHICATION Student Lab Workbook THE SCIENTIFIC METHOD 1. Research Background literature research about a topic of interest 2. Identification of a problem Determine a problem (with regards to the topic)
Redwood Shores Lagoon August Monthly Water Quality Monitoring Report
 Redwood Shores Lagoon August Monthly Water Quality Monitoring Report Prepared for Redwood City Public Works Services Department 1400 Broadway Redwood City, CA 94063-2594 Prepared by Clean Lakes, Inc. P.
Section 1. Introduction and Overview
 Section 1. Introduction and Overview 1.0 Technical Services Requirement This report, prepared by Cashin Associates, P.C. (CA), presents the findings and recommendations for the Analysis and Assessment
Low Dissolved Oxygen HYPOXIA. What is Hypoxia?
 HYPOXIA Low Dissolved Oxygen What is Hypoxia? Hypoxia or low dissolved oxygen has been identified as the most critical issue facing the Sound. Just as we breathe oxygen, the fish and other marine life
Bolton Town Hall February 24, George Knoecklein Northeast Aquatic Research Mansfield, CT
 Bolton Town Hall February 24, 214 George Knoecklein Northeast Aquatic Research Mansfield, CT Working Hypothesis 1. Deep drawdowns of Middle Bolton Lake fueled high growth rates of naiad in Lower Bolton
Barnegat Bay-Little Egg Harbor: Ecosystem Condition. Michael J. Kennish Institute of Marine and Coastal Sciences Rutgers University
 Barnegat Bay-Little Egg Harbor: Ecosystem Condition Michael J. Kennish Institute of Marine and Coastal Sciences Rutgers University Coastal Lagoons Barnegat Bay- Little Egg Harbor ANTHROPOGENIC EFFECTS*
Water Quality in Rice and Pike Lakes. Ryan Haney Water Resource Specialist Center for Watershed Science and Education UW Stevens Point
 Water Quality in Rice and Pike Lakes Ryan Haney Water Resource Specialist Center for Watershed Science and Education UW Stevens Point Tonight s discussion How do we measure water quality? How is the water
Big Chetac and the Red Cedar River Watershed. Dan Zerr University of Wisconsin-Extension Natural Resource Educator
 Big Chetac and the Red Cedar River Watershed Dan Zerr University of Wisconsin-Extension Natural Resource Educator The Water Cycle An area that all drains to a particular stream, river, lake, or ocean.
Redwood Shores Lagoon November 2016 Monthly Water Quality Monitoring Report
 Redwood Shores Lagoon November 2016 Monthly Water Quality Monitoring Report Prepared for Redwood City Public Works Services Department 1400 Broadway Redwood City, CA 94063-2594 Prepared by Clean Lakes,
Potato Lake 2010 Project Results and APM Plan. Saturday May 28, 2011 Dave Blumer, Jake Macholl SEH Lake Scientists
 Potato Lake 2010 Project Results and APM Plan Saturday May 28, 2011 Dave Blumer, Jake Macholl SEH Lake Scientists Lake and Aquatic Plant Management Planning Goal: To maintain or improve the overall condition
CLMP+ Report on Grass Lake (Anoka County) Lake ID# CLMP+ Data Summary
 Lake ID# CLMP+ Data Summary") CLMP+ Report on Grass Lake (Anoka County) Lake ID# 02-0113-00 2012-2013 CLMP+ Data Summary October 2014 Authors Shannon Martin, MPCA Editing and graphic design Public Information Office Staff The (MPCA)
CLMP+ Report on Grass Lake (Anoka County) Lake ID# 02-0113-00 2012-2013 CLMP+ Data Summary October 2014 Authors Shannon Martin, MPCA Editing and graphic design Public Information Office Staff The (MPCA)
Redwood Shores Lagoon February 2019 Monthly Water Quality Monitoring Report
 Redwood Shores Lagoon February 2019 Monthly Water Quality Monitoring Report Prepared for Redwood City Public Works Services Department 1400 Broadway Redwood City, CA 94063-2594 Prepared by Clean Lakes,
Environmental Services
 Environmental Services 14 River Water Quality Summary for the Twin Cities Metropolitan Area This document is a summary of the 14 water quality of major rivers in the Twin Cities metropolitan area (metro
Environmental Services
 215 Environmental Services River Water Quality Summary for the Twin Cities Metropolitan Area In 215, Metropolitan Council Environmental Services (MCES) river monitoring was conducted at six automated and
May 20, Buffer Program in Flux: Past, Present and Future
 May 20, 2016 Buffer Program in Flux: Past, Present and Future Riparian Buffer Protections Our past Excess nutrients Massive fish kills Impacts to tourism The present Nutrient management strategies Riparian
Redwood Shores Lagoon May 2017 Monthly Water Quality Monitoring Report
 Redwood Shores Lagoon May 2017 Monthly Water Quality Monitoring Report Prepared for Redwood City Public Works Services Department 1400 Broadway Redwood City, CA 94063-2594 Prepared by Clean Lakes, Inc.
Owasco Lake Day
 Introductions Halfman apologizes for not presenting this talk himself. A family reunion took precedent. Owasco Lake Day 6-25--14 1 The beginnings Preliminary water quality comparison of the Finger Lakes
a) Temperature b) Light c) Decomposition d) Mixing/Turbulence e) Salinity
 Temperature b) Light c) Decomposition d) Mixing/Turbulence e) Salinity") Dissolved Oxygen and Primary Productivity Activity Introduction: DO is often used as an indicator of water quality. You have probably read or seen news reports of fish kills that have been linked to sewage
Dissolved Oxygen and Primary Productivity Activity Introduction: DO is often used as an indicator of water quality. You have probably read or seen news reports of fish kills that have been linked to sewage
Urban Geology Spring 2011
 Urban Geology Spring 2011 Gowanus Canal Historical use New York City Water pollution Sewage treatment plants Eutrophication Combined sewage outflows (CSO) Remediation Sustainability Gowanus Canal today
Nutrients, Algal Blooms and Red Tides in Hong Kong Waters. Paul J. Harrison and Jie XU
 Nutrients, Algal Blooms and Red Tides in Hong Kong Waters Paul J. Harrison and Jie XU Division of Environment, Hong Kong University of Science & Technology 1. Introduction The Pearl River is China's second
Laurel Lake water quality, nutrients, and algae, summer
 Laurel Lake water quality, nutrients, and algae, summer 2011 1 H.A. Waterfield, W.N. Harman and M.F. Albright SAMPLING ACTIVITIES Site visits to Laurel Lake were made on 16 June and 25 July 2011; water
Eutrophication: Tracing Nutrient Pollution Back to Penns Creek
 Eutrophication: Tracing Nutrient Pollution Back to Penns Creek Nutrients are substances that life depends on for growth and reproduction. However, when these nutrients enter our planets waterways in excess,
Nutrient Sources, Fate, Transport, and Effects Study of Galveston Bay, Texas Rachel Windham,
 Nutrient Sources, Fate, Transport, and Effects Study of Galveston Bay, Texas Rachel Windham, Department of Marine Biology Texas A&M University at Galveston 2 Acknowledgements: Dr. Antonietta Quigg Members
Water Monitoring in Spa Creek: A Summary
 Water Monitoring in Spa Creek: A Summary Written by: Alexis Jones & Blake Harden Edited by: Hannah Krauss Water monitoring is very important in order to determine the health of the Chesapeake Bay and its
From My Backyard to Our Bay It s the 911 for the Chesapeake Bay
 From My Backyard to Our Bay Reporting Problems on Our Bay, Rivers, and Streams We can all be the eyes and ears of our local waterways. Maryland has established the Chesapeake Bay Safety and Environmental
The Snapshot CONODOGUINET CREEK WATERSHED SNAPSHOT
 CONODOGUINET CREEK WATERSHED SNAPSHOT ABOVE: CONODOGUINET CREEK AT RT 74 BRIDGE FACING DOWNSTREAM The Snapshot The Conodoguinet Watershed Snapshot was a collaborative effort to engage local citizens in
Harmful Algal Blooms in Lake Erie
 An update on Harmful Algal Blooms in Lake Erie Thomas Bridgeman University of Toledo November 8, 2013 Outline Introduction, History and Lake Erie HABs 2002-2013 HAB forecast and early warning tools Ohio
Aquatic Science Unit 2. Water Quality and Water Pollution
 Aquatic Science Unit 2 Water Quality and Water Pollution What is a healthy water body? In your own words, take a moment to describe what you believe are some of the characteristics of a healthy stream
2009 Puget Sound Georgia Basin Ecosystem Conference
 2009 Puget Sound Georgia Basin Ecosystem Conference Session Time/Date: 3:30 pm 5:00 pm, Monday, February 09, 2009 Session Title: Wastewaters in the Salish Sea: From Science to Solutions Session Chairs:
Sustaining Colorado s Watersheds: Making the Water Quality Connections October 2-4, 2007
 Sustaining Colorado s Watersheds: Making the Water Quality Connections October 2-4, 2007 Barr Lake and Milton Reservoir Watershed Management Plan ~ Brief History of the Reservoirs ~ Overview of the BMW
After reviewing data collected from ISLAND POND, STODDARD, the program coordinators have made the following observations and recommendations.
 OBSERVATIONS & RECOMMENDATIONS After reviewing data collected from ISLAND POND, STODDARD, the program coordinators have made the following observations and recommendations. Thank you for your continued
Fact Sheet. Chesapeake Bay Water Quality
 Fact Sheet Chesapeake Bay Water Quality Water quality is a critical measure of the Chesapeake Bay s health. For the Bay to be healthy and productive, the water must be safe for people and must support
CHAPTER 15 WATER POLLUTION. INTO THE GULF Researchers try to pin down what s choking the Gulf of Mexico
 CHAPTER 15 WATER POLLUTION INTO THE GULF Researchers try to pin down what s choking the Gulf of Mexico SAVING THE BAY Teams of researchers try to pin down what s choking the Chesapeake Water pollution
Northern Chain of Lakes
 Northern Chain of Lakes Presented by Pat Conrad and Joe Pallardy on behalf of the Brown s Creek Watershed District Board of Managers w a t e r I e c o l o g y I c o m m u n i t y Lake by Lake Analysis
Long Pond Post-Treatment Summary Report through 2013
 Long Pond Post-Treatment Summary Report through 13 March 1 Prepared by Water Resource Services TABLE OF CONTENTS Introduction... 1 Water Clarity... 3 Phytoplankton... Oxygen... Phosphorus... 1 Conclusions
An Evaluation of Nitrogen Loading into Upper Narragansett Bay
 An Evaluation of Nitrogen Loading into Upper Narragansett Bay NEWEA Conference January 26, 2010 Catherine Walker & Christine Comeau Narragansett Bay Commission Providence, RI Narragansett Bay Commission
Frequently Asked Questions - Fertilizers -
 What is fertilizer? What is phosphorus? What is nitrogen? How do I know if the fertilizer is phosphorus or nitrogen free? Which number on the bag of fertilizer is phosphorus and which is nitrogen? Is low
Results from the 2017 Water Quality Monitoring Program
 Results from the 217 Water Quality Monitoring Program As part of a larger project, this summer the BWC conducted water sampling throughout the Belleisle Bay to get a baseline of data and determine the
Wakefield Lake TMDL Public Meeting 3/17/2014. Jen Koehler, PE Barr Engineering
 Wakefield Lake TMDL Public Meeting 3/17/2014 Jen Koehler, PE Barr Engineering Outline Project Contacts Introduction to Wakefield Lake Thoughts/Questions/Concerns About TMDL Studies Lake Water Quality and
Monitoring Update April 1, Northeast Aquatic Research George Knoecklein Hillary Kenyon Sabina Perkins
 Monitoring Update April 1, 215 Northeast Aquatic Research George Knoecklein Hillary Kenyon Sabina Perkins Lake Monitoring Approach for 214 Tonight's discussion will focus on in-lake aspects: Assessment
OKLAHOMA CLEAN LAKES AND WATERSHEDS 23rd ANNUAL CONFERENCE AGENDA. SUCCESS STORY: 20 YEARS of HYPOLIMNETIC OXYGENATION of a RESERVOIR
 OKLAHOMA CLEAN LAKES AND WATERSHEDS 23rd ANNUAL CONFERENCE AGENDA SUCCESS STORY: 20 YEARS of HYPOLIMNETIC OXYGENATION of a RESERVOIR Agenda EBMUD & Camanche Reservoir Water Quality Challenges Speece Cone
Northwest Florida Water Management District. Water Policy Advisory Council 2013
 Northwest Florida Water Management District Water Policy Advisory Council 2013 Spring Management Challenges Jackson Blue Spring Nutrient pollution from agriculture Agricultural irrigation consumptive use
Appendix X: Non-Point Source Pollution
 Appendix X: Non-Point Source Pollution Sources Nonpoint source of pollution, unlike pollution from industrial and sewage treatment plants, comes from many different sources. Nonpoint source pollution is
Nutrients & Algal Blooms Developing water quality standards for the James River.
 Nutrients & Algal Blooms Developing water quality standards for the James River. Dr. Paul A. Bukaveckas and Dr. Joseph Wood Department of Biology Center for Environmental Studies http://wp.vcu.edu/jamesriver/
University of Arkansas, Fayetteville. Marc Nelson. L. Wade Cash. Keith Trost. Jennifer Purtle
 University of Arkansas, Fayetteville ScholarWorks@UARK Technical Reports Arkansas Water Resources Center 6-1-2005 Water Quality Sampling, Analysis and Annual Load Determinations for Nutrients and Sediment
CLMP+ Report on Fleming Lake (Aitkin County)
") CLMP+ Report on Fleming Lake (Aitkin County) Lake ID# -5-5-6 CLMP+ Data Summary July 7 Authors Shannon Martin Contributors/acknowledgements Terry Dahlberg Sandy Dahlberg Pam Anderson For questions regarding
CLMP+ Report on Fleming Lake (Aitkin County) Lake ID# -5-5-6 CLMP+ Data Summary July 7 Authors Shannon Martin Contributors/acknowledgements Terry Dahlberg Sandy Dahlberg Pam Anderson For questions regarding
Big Chetac Lake Getting Rid of the Green Phase 3. Nutrient Budget and Management Data Analysis Report
 Big Chetac Lake Getting Rid of the Green Phase 3 Nutrient Budget and Management Data Analysis Report Prepared for: Big Chetac Chain Lake Association and Wisconsin Department of Natural Resources Prepared
North Dakota s Nutrient Reduction Strategy. Presented to the 2016 ND Water Quality Monitoring Conference March 4, 2016
 North Dakota s Nutrient Reduction Strategy Presented to the 2016 ND Water Quality Monitoring Conference March 4, 2016 Nutrients Nutrients, in appropriate amounts, are essential to the growth and health
FORGE RIVER WATERSHED MANAGEMENT PLAN MARCH The Town of Brookhaven
 FORGE RIVER WATERSHED MANAGEMENT PLAN MARCH 2012 The Town of Brookhaven Prepared by In Association with Attribution This plan was prepared for the New York State Department of State Division of Coastal
Lake Erie LaMP Nutrient Management Strategy Lake Erie Millennium Network April 27, 2010 Windsor, ON
 Lake Erie LaMP Nutrient Management Strategy Lake Erie Millennium Network April 27, 2010 Windsor, ON Marie-Claire Doyle & Sandra George On behalf of the Lake Erie Lakewide Management Plan (LaMP) Status
Potential Effects of Reclaimed Water options on Nitrogen Loading to Tampa Bay. Tampa Bay in the 1970s
 Potential Effects of Reclaimed Water options on Nitrogen Loading to Tampa Bay Holly Greening, Tampa Bay Estuary Program February 15, 2010 1 Tampa Bay in the 1970s Phytoplankton and macroalgae dominated
How Ecosystems Work Section 2. Chapter 5 How Ecosystems Work Section 2: Cycling of Materials DAY 1
 Chapter 5 How Ecosystems Work Section 2: Cycling of Materials DAY 1 The Carbon Cycle The carbon cycle is the movement of carbon from the nonliving environment into living things and back Carbon is the
Whole Lake Experiments to Control Harmful Algal Blooms in Multi-Use Watersheds Presentation to the Middle Huron Partners 8 November 2006
 Whole Lake Experiments to Control Harmful Algal Blooms in Multi-Use Watersheds Presentation to the Middle Huron Partners 8 November 2006 U.S. EPA STAR Grant R830653-010 Develop management plan to control
Streamside Management. How the area around your pond effects the water.
 Streamside Management Zones and Water Quality How the area around your pond effects the water. Stream(pond)side Management Zone A streamside management zone (SMZ) is a strip of land immediately adjacent
Lake Washington. Water Quality Assessment Report. Copyright 2012 PLM Lake & Land Management Corp.
 Lake Washington 2012 Water Quality Assessment Report Copyright 2012 PLM Lake & Land Management Corp. Water Quality Report On May 22nd, June 18th, July 30th, August 29th, and September 27 th, 2012, PLM
Executive Summary. ES.1 Dennis Water Quality Issues. Dennis
 Executive Summary ES.1 Water Quality Issues The Town of currently faces threats to the health of its saltwater, freshwater, and groundwater resources. In recent years, excessive levels of nutrients, specifically
Dog River Watershed Management Plan
 Dog River Watershed Management Plan Preliminary Water Quality Data Analysis Doug Robison, PWS ESA is where solutions and service meet. Water Quality - Regulatory Primer Designated Use Categories Swimming
Arkansas Water Resources Center
 Arkansas Water Resources Center WATER QUALITY SAMPLING, ANALYSIS AND ANNUAL LOAD DETERMINATIONS FOR TSS, NITROGEN AND PHOSPHORUS AT THE WASHINGTON COUNTY ROAD 195 BRIDGE ON THE WEST FORK OF THE WHITE RIVER
URI Watershed Watch Program. Block Island Monitoring Results May 2007 Elizabeth Herron and Linda Green, URI Watershed Watch
 URI Watershed Watch Program Block Island Monitoring Results 1-6 May 7 Elizabeth Herron and Linda Green, URI Watershed Watch Summary: To date both the field monitoring and laboratory analyses indicate that
UCMR4 Cyanotoxins. What Will You Do If You Find Them? Keith W. Cartnick AWWA PA Annual Conference 2019
 UCMR4 Cyanotoxins What Will You Do If You Find Them? Keith W. Cartnick keith.cartnick@mottmac.com AWWA PA Annual Conference 2019 What are algae? Most are microscopic, photosynthetic organisms More of an
8 LITTLE CROSBY LAKE RESULTS
 8 LITTLE CROSBY LAKE RESULTS 8.1 LITTLE CROSBY LAKE BACKGROUND Figure 8-1: View of the south shoreline of. is 8 acres with an average depth of 7 ft and a maximum depth of 34 ft. Little Crosby Lake is a
454 Court Street, Suite 304 Portsmouth, New Hampshire Danna Truslow, PG:
 110 North Road Brentwood, New Hampshire 603-679-2790 454 Court Street, Suite 304 Portsmouth, New Hampshire 03801 603-766-6670 www.truslowrc.com Danna Truslow, PG: danna@truslowrc.com Major sources of nitrate
Can harmful algal bloom mitigation make the problem worse?
 Can harmful algal bloom mitigation make the problem worse? David M. Kidwell and Susan Baker National Oceanic and Atmospheric Administration National Centers for Coastal Ocean Science Outline Background
What Does It All Mean? CWA? Sara Esposito, P.E. DNREC Division of Watershed Stewardship
 What Does It All Mean? CWA? Sara Esposito, P.E. DNREC Division of Watershed Stewardship sara.esposito@state.de.us Why are we here? Just like pavement has helped move cars faster; it has also helped water
Causes and Possible Corrections for Nuisance Algae Conditions in Huron River Lakes: Summary Findings from 2003, 2004, and Prof John T.
 Causes and Possible Corrections for Nuisance Algae Conditions in Huron River Lakes: Summary Findings from 23, 24, and 25 Prof John T. Lehman Middle Huron Partners 8 November 25 Welcome Summary of public
Southern California Bight 2008 Regional Monitoring Program: Volume VIII. Estuarine Eutrophication
 Technical Report 0711 Southern California Bight 2008 Regional Monitoring Program: Volume VIII. Estuarine Eutrophication K. McLaughlin 1, M. Sutula 1, L. Busse 2, S. Anderson 3, J. Crooks 4, R. Dagit 5,
Acidity and Alkalinity:
 Evaluation of Pollution Sources to Lake Glenville Quarterly Report December 2018 Kimberlee K Hall, PhD Environmental Health Program, Western Carolina University Summary Chemical and microbial analysis
OHIO SEA GRANT AND STONE LABORATORY OHIO SEA GRANT AND STONE LABORATORY
 OHIO SEA GRANT AND STONE LABORATORY Framing the Issue: Current State of Nutrient Management and Great Lakes Water Quality OSU s Island OHIO SEA GRANT AND STONE LABORATORY Campus Southernmost Image: Ohio
Agawam River Project - 10 Years Later
 Bridgewater State University Virtual Commons - Bridgewater State University Watershed Access Lab Projects Watershed Access Lab 2013 Agawam River Project - 10 Years Later Recommended Citation St. Margaret
PROTECTING OUR WATERWAYS: STORMWATER POLLUTION REDUCTION EFFORTS
 PROTECTING OUR WATERWAYS: STORMWATER POLLUTION REDUCTION EFFORTS Public Information Meeting ~ May 2, 2018 Public Works Stormwater Management Division OVERVIEW Surface Water Quality Protection Municipal
Result data last updated. 10 July Map of Norske Skog Albury Paper Mills Environmental Protection Licence compliance monitoring sites
 A full copy of our license can be found on the EPA website under the following address http://www.epa.nsw.gov.au/prpoeoapp/viewpoeolicence.aspx?docid=32757&sysuid=1&licid=1272 Result data last updated
AP Lab 12--DISSOLVED OXYGEN & AQUATIC PRIMARY PRODUCTIVITY (LabBench)
") Name AP Biology AP Lab 12--DISSOLVED OXYGEN & AQUATIC PRIMARY PRODUCTIVITY (LabBench) Web address: http://www.phschool.com/science/biology_place/labbench Click on Lab 12: Dissolved Oxygen & Aquatic Primary
Name AP Biology AP Lab 12--DISSOLVED OXYGEN & AQUATIC PRIMARY PRODUCTIVITY (LabBench) Web address: http://www.phschool.com/science/biology_place/labbench Click on Lab 12: Dissolved Oxygen & Aquatic Primary
Arkansas Water Resources Center
 Arkansas Water Resources Center WATER SAMPLING, ANALYSIS AND ANNUAL LOAD DETERMINATIONS FOR TSS, NITROGEN AND PHOSPHORUS AT THE L ANGUILLE RIVER NEAR PALESTINE Submitted to the Arkansas Soil and Water
THE BLUE PLANET SATELLITE IMAGE OF OUR PLANET WHAT ARE YOUR HAPPIEST ME MEMORIES THAT INCLUDE WATER?
 OUR NEED FOR WATER! EARTH IS KNOWN AS THE BLUE PLANET. MORE THAN SEVENTY PERCENT OF THE EARTH S SURFACE IS COVERED WITH WATER. THERE ALSO IS WATER BENEATH THE SURFACE OF THE EARTH. YET, WITH ALL OF THE
Lone Lake Algae Management Plan Project Information Meeting. August 23, Sponsored by:
 Lone Lake Algae Management Plan Project Information Meeting August 23, 2018 Sponsored by: Overview Who are we? Why are we here? Watershed/Lake Characteristics Project background Algae blooms Review current
Figure 1. Platte River Sub-Watersheds and Monitoring Locations.
 Figure 1. Platte River Sub-Watersheds and Monitoring Locations. 10 2 1 9 7 BL Pond 8 Hatchery 6 3 5 4 1 Platte River at Fewins Rd 6 B. Creek to Hatchery Spring 2 Platte River at Stone Bridge 7 Platte River
Scientific overview: Water quality functions of coastal buffers
 Scientific overview: Water quality functions of coastal buffers Caitlin Chaffee, Coastal Policy Analyst RI Coastal Resources Management Council November 21, 2013 Buffer Zone Setback = Minimum Distance
Cyanobacteria: A Planktonic Supervillain
 Cyanobacteria: A Planktonic Supervillain By Brea Arvidson Biologist Restoring Balance. Enhancing Beauty. April 24, 2018 From Superhero A naturally occurring primary producer Bacteria Once called blue-green
Understanding Agriculture And Clean Water
 1 IOWA CHAPTER Understanding Agriculture And Clean Water Clean Water Act Established in 1972, the Clean Water Act (CWA) created the basic structure for regulating discharges of pollutants into water bodies
The Hypoxic Zone in the Gulf of Mexico
 The Hypoxic Zone in the Gulf of Mexico References Council Committee on Environmental and Natural Resources. 2003. An Assessment of Coastal Hypoxia and Eutrophication in U.S. Water. National Science and
AP Environmental Science
 Name AP Environmental Science DISSOLVED OXYGEN & AQUATIC PRIMARY PRODUCTIVITY (LabBench) Web address: http://www.phschool.com/science/biology_place/labbench Click on Lab 12: Dissolved Oxygen & Aquatic
Anthropogenic Impacts on Bays and Watersheds. HI-MOES Presentation 2009 The Kohala Center Kohala Watershed Partnership
 Anthropogenic Impacts on Bays and Watersheds HI-MOES Presentation 2009 The Kohala Center Kohala Watershed Partnership Some Common Terms Watershed = An area of land that drains into a common destination
St. Johns River Water Quality Projects. St. Johns River Water Quality Projects Fiscal Year
 St. Johns River Water Quality Projects Fiscal Year 2011 2012 The St. Johns River is an invaluable part of Florida and is central to our quality of life. However, for decades, the river has suffered from
Hadlock Pond, Washington Co., Lake Hadlock Association, Inc.
 Hadlock Pond, Washington Co., Lake Hadlock Association, Inc. Lake Characteristics Watershed Characteristics Surface Area (ac/ha) Max Depth (ft/m) Mean Depth (ft/m) Retention Time (years) Water Class Dam
Three bubblers were installed as a pilot project to improve oxygen levels.
 Update April, 2010 Three bubblers were installed as a pilot project to improve oxygen levels. Based on a proposal by Dr. Alex Horne (professor emeritus of engineering at UC Berkeley) and Dr. Ken O Hara
Norwalk Harbor Report Card
 Norwalk Harbor Report Card C+ Following the water s trail from your house, into the river, and to the Harbor The way land is used in a watershed has a significant effect on water quality. In areas where
Ocean Pollution. Ocean Pollution
 Ocean Pollution Ocean Pollution Some scientists believe that it is safer to dump sewage sludge into the deep ocean because it has the ability to dilute, disperse, and degrade large amounts of pollutants
Carbon/Oxygen Cycle. By Ethan Hempel, Jess Meyers, Hannah Park, and Kelly Chan
 Carbon/Oxygen Cycle By Ethan Hempel, Jess Meyers, Hannah Park, and Kelly Chan Background When animals breathe, they take in oxygen and exhale carbon dioxide. Plants use carbon dioxide (along with water
Algae are tiny plant-like like organisms that live in water There are hundreds of species of algae in Lake Erie, Most are beneficial
 Harmful Algal Blooms in Western Lake Erie Thomas B. Bridgeman, University it of Tld Toledo (and graduate students) Algae are tiny plant-like like organisms that live in water There are hundreds of species
Santa Rosa Creek Water Quality Results 2004
 Santa Rosa Creek Water Quality Results 24 Community Clean Water Institute Site Description: SRC4: Off 3rd Street in downtown Santa Rosa. Behind the Vineyard Hotel just West of Highway 11 along the Prince
Understanding Nutrients and Their Affects on the Environment
 Understanding Nutrients and Their Affects on the Environment Humans & Ecosystems Humans are just like ecosystems, too much or too little of a nutrient is bad for the system. Nutrient management is a balancing
Nutrient distributions and the interaction between coastal wetlands and the nearshore of Lake Ontario
 Nutrient distributions and the interaction between coastal wetlands and the nearshore of Ontario Krista Chomicki and Gary Bowen International Association of Great s Research, 25 Type Durham Region Coastal
The Dead Zone. Use the notes provided (attached to this sheet) to answer the following questions.
 to answer the following questions.") The Dead Zone Use the notes provided (attached to this sheet) to answer the following questions. 1. Re-define Eutrophication: 2. What are the risks associated with an excess of Nitrogen? 3. What is a Dead
The Dead Zone Use the notes provided (attached to this sheet) to answer the following questions. 1. Re-define Eutrophication: 2. What are the risks associated with an excess of Nitrogen? 3. What is a Dead
Buffer Zone = Area of Undisturbed Vegetation
 Scientific overview: Water quality functions of coastal buffers Caitlin Chaffee, Coastal Policy Analyst RI Coastal Resources Management Council November 29, 2012 Buffer Zone Setback = Minimum i Distance
Nonpoint Source Pollution A Challenge to Control
 Nonpoint Source Pollution A Challenge to Control Connecticut Envirothon Aquatics Workshop January 14, 2017 Presented by Denise Savageau Conservation Director, Town of Greenwich Point Source Pollution is
MINIMIZING THE RISK OF MANURE RUNOFF THIS FALL/WINTER. Nichole Embertson, Ph.D. Whatcom Conservation District
 MINIMIZING THE RISK OF MANURE RUNOFF THIS FALL/WINTER Nichole Embertson, Ph.D. Whatcom Conservation District Whatcom Speaker Series October 16, 2014 What is on your mind right now?? Agronomics = Nutrient
Reservoir age, increasing human population,
 B-6249 02/12 Eagle Mountain Watershed Management Brent Clayton, Justin Mechell, David Waidler and Clint Wolfe* Reservoir age, increasing human population, and changing land uses have prompted the development