Quality Management. Six Sigma Quality An introduction. All Rights Reserved, Indian Institute of Management Bangalore
|
|
|
- Hilary Allen
- 6 years ago
- Views:
Transcription
1 Quality Management Six Sigma Quality An introduction
2 Six Sigma Quality An introduction Generally six sigma quality points to very high quality levels that defects are a rarity in operations It also points to A disciplined way of handling issues in operations A structured way of addressing quality issues A trajectory to an unambiguous destination in the quality management journey in an organization
3 Introduction About Six sigma quality The moment we talk about quality, the word Six sigma comes to our mind A number of progressive companies are working hard to build six sigma quality level Motorola and GE are supposed to have pioneered this concept of 6 sigma Dabbawallahs of Mumbai has baffled the business world with their six sigma quality standard in their operations involving delivering 200,000 tiffin boxes from home to work place and again from work place back home every day
4 What is six sigma? A mechanisms to deliver near zero defect in operations using principles of process control A defect is an unacceptable state of a product or a service for a customer Defect becomes an extraordinarily a rare event For example a few defects in a million potential opportunity in a service One or two defective parts in a million that was produced in a manufacturing shop
5 Why near zero defects? Criterion Business Customers Retail Customers Total No. of policies issued during the year 247,010 2,520,874 2,767,884 Error Rate 0.50% 1.10% 1.05% Defective Policies 1,235 27,730 28,965 This implies that at a nearly 99% quality level, 28,965 customers would have been unsatisfied with the service that they have received from the company during the year. Source: Company Presentation, Own Research
6 Why high levels of quality? Better Quality Management System Superior Quality control Fewer Disruptions in Operations Smoother Output Fewer Rework Less Indirect costs High quality Finished goods Less inventory Greater Productivity Less inventory, labour, indirect costs & better quality
7 Quality Management Changing Perceptions Yesterday It is often uneconomical to make quality improvements since it brings down productivity, increases cost and investment. Productivity goes up and cost comes down as quality goes up. This fact is known, but not necessarily to everyone. Today
8 Metrics for Quality Management PPM and DPMO If we want defects to really become an extraordinarily a rare event we can think of two measures: Manufacturing: Parts per million (PPM) defect rate Services: Defects per Million Opportunities (DPMO) Six sigma uses these two measures.
9 Defects Per Million Opportunities (DPMO) If in a process Number of opportunities for making a defect per unit of execution of that process = k Number of units of observation of the process = n Number of defects that occurred in that process during the observation = d d * k n DPMO then will be = * 1,000, 000
10 DPMO Computation Example A hotel in a tourist location Potential opportunities to make a defect in a check-in process = 11 No. of guests handled during a season = 1,250 Number of defects observed = 357 DPMO = = d k n 1,000, , ,000,000 = 25, 963.
11 Premises of Quality Management Premise 1: All Quality initiatives must be continuous and data driven Premise 2: System of Quality is one of Prevention & Elimination Not Detection & Correction Premise 3: The Performance Standard is Zero Defects Premise 4: The responsibility for Quality lies primarily with those who produce & deliver products & services
12 Six Sigma Program A six sigma program requires certain enabling mechanisms for an organization A structured program for quality management & improvement Facilitating mechanisms for the Operations personnel to own, solve and obliterate the quality problems Organization structure and mandate for quality improvement issue on a continuous basis


13 DMAIC Methodology Define Measure Control Analyze Improve Source: Mahadevan, B. (2015), Operations Management: Theory & Practice, Pearson Education, 3 rd Edition, pp 575.
14 DMAIC Methodology Define Define the problem, the requirements, project scope, project charter Set goals for improvement Measure Identify variables to be measured, the type of measurement Data collection and synthesis Analyze Develop a set of tools for analysis Apply graphical tools of analysis Identify possible sources of variation and vital few root causes Explore means of eliminating them Improve Generate & validate improvement alternatives Creating new process maps for the process Control Develop control plan Establish revised standard measures to maintain performance Develop relevant training plans to maintain standards
15 Organization for six sigma In order that the organization sustainably improves the quality to near zero defect levels, A good organizational structure Mandate to make changes Ownership of processes and results and Continuous and closer review are required
16 Organization for six sigma Process Owner Supervisor or a manager who takes responsibility for various steps of a process that delivers some output to the customer. It could be the in a particular work area where the improvement project has been identified Team Leader & Members Team leader (the project leader) and the members will comprise of the employees in the chosen work area They will have day-to-day operational control of activities
17 Organization for six sigma In a six sigma organizational structure three terminologies are used to indicate these organizational entities. This includes Master Black Belt, Black Belt and Green Belt. The depth of training and experience differentiates these three.
18 Organization for six sigma Six sigma coach A consultant or a senior person in the organization who offers expert knowledge on various aspects of six sigma. This includes statistical tools, process design & analysis, change management, small group improvement, use of QC tools for improvement etc. Sponsor A member of the senior management who oversees the overall progress and implementation Helps the team refine the project scope, sorts out issues cutting across other parts of the organization, approves projects and provides the necessary support in terms of resources
19 Quality Management Total Quality Management
20 Quality Gurus Deming s contributions New perceptions to quality management Critical Role of Top Management Plan Do Check Act (PDCA) Cycle 14 point agenda for quality improvement Considered father of Japanese Quality Management Systems Highest Award in Japan named after him
21 Juran s Quality Trilogy Quality planning: the process of preparing to meet quality goals Quality control: the process of making quality goals during operations; importance of using statistical methods Quality improvement: the process of breaking through to unprecedented levels of performance
22 Philip Crosby Absolutes of Quality I Absolute: Definition of quality is conformance to standards II Absolute: The system of Quality is prevention III Absolute: The performance standard is zero defects IV Absolute: Measurement of Quality is the price of nonconformance V Absolute: There is no such thing as Quality Problem
23 Other quality gurus Karou Ishikawa Cause & Effect (Fishbone) Diagram Cause & Effect Diagram with Action Card (CEDAC) Shigeo Shingo Poka Yoke Genichi Taguchi Loss function Design of experiments
24 Quality Revolution in the 1980 s Salient features Alternative ideas about what constitutes good quality Newer methods to build quality into products and services that we offer New tools to assess performance of an organization with respect to quality Changed roles of middle managers and supervisors from one of control to facilitation of the process of building quality into the products and services
25 Total Quality Management (TQM) The definition points to four critical aspects of any good TQM program Role of Top Management Employee Involvement & Training Use of Tools & Techniques Development of a good quality system
26 Total Quality Management Elements Role of Top Management Quality System Employee Involvement Training & Team Work Tools & Techniques
27 Role of Top Management Total in TQM refers to every one, every where and every time. This will be possible only when the Top Management gets actively involved in this process Possible roles for Top Management Lead from the front by example Signal the importance of quality for the organization Help Middle Management resolve difficult trade-offs by providing guidance & directions
28 Employee Involvement It is about creating certain structures, culture and practices to make employee involvement a reality Build a culture of process ownership facilitate this process Role of middle management and experts go through some change Provide training on some tools & techniques that people can use in their work place to address quality issues Build a climate and culture for team working Put in a system of project by project continuous improvement

29 Elements of a Quality Assurance System Understand customer needs Translate them to meaningful measures for the operating system Mechanisms for identifying quality problems Tools & techniques for the employees For tracking problems to their root causes Identifying corrective measures Top Management Commitment to Quality Quality Assurance System Employee involvement for continuous focus on quality improvement Quality Certifications & Benchmarking exercises Documentation of all quality related initiatives for continuous learning & improvement Methods for preventing recurrence of problems Source: Mahadevan, B. (2015), Operations Management: Theory & Practice, Pearson Education, 3 rd Edition, pp 350.
30 Tools for Quality Management Available tools for Quality Management can be broadly categorized into two: Quality Operations Highlighting Problems Identifying Improvement Opportunities Analyzing problems & their root causes Quality Planning & Design Building Quality into Products & Services Strategic Planning
31 Quality Management Tools Purpose of Use Quality Control Quality Management Highlighting Problems Control Charts Identifying Improvement Opportunities Analyzing problems & their root causes Building Quality into Products & Services Histograms Check Sheets Pareto Diagrams Scatter Diagrams Graphs Cause & Effect (Fishbone) Diagram CEDAC Affinity Diagram Relationship Diagram Tree Diagram Matrix Diagram Matrix Data Analysis Process Decision Program Chart (PDPC) Arrow Diagram Poka Yoke (Fool Proofing) Strategic Planning Quality Function Deployment (QFD) Quality Costing
32 Number of occurences Causes for adjustment snags Number of occurrences Leakage 25 Missing 24 Fouling 5 Reworks 26 Poor routing 5 Loose fitting 15 Histogram Causes for adjustment snags LEAKAGE MISSING FOULING REWORKS POOR Categories of problems ROUTING LOOSE FITTING 05 Source: Mahadevan, B. (2015), Operations Management: Theory & Practice, Pearson Education, 3 rd Edition, pp 339.
33 Number of occurences Cumulative occurences (%) Pareto Diagram Adjustment Snags Analysis Reworks Leakage Missing Loose fitting Poor routing Fouling 0.0 Categories of problems Source: Mahadevan, B. (2015), Operations Management: Theory & Practice, Pearson Education, 3 rd Edition, pp 340.
34 Number of occurences Number of occurences Cumulative occurrences (%) Number of Causes for rework occurrences Lack of drawing clarity 23 Tooling problems 15 Process control issues 6 Design issues 33 Vendor related problems 23 Rework Analysis Lack of drawing clarity Causes for Rework Tooling problems Process control issues Categories of problems Design issues Vendor related problems Design issues Lack of drawing clarity Reworks Analysis Vendor related problems Tooling problems Categories of problems Process Control Issues
35 Cause and Effect Diagram A generic representation Materials Work methods Quality Equipment Labour Cause Effect Source: Mahadevan, B. (2015), Operations Management: Theory & Practice, Pearson Education, 3 rd Edition, pp 340.
, Operations Management: Theory & Practice, Pearson Education, 3")
36 Cause & Effect Diagram An example Source: Mahadevan, B. (2015), Operations Management: Theory & Practice, Pearson Education, 3 rd Edition, pp 328.
, Operations Management: Theory & Practice, Pearson Education, 3 rd Edition,")
37 Cause Effect Diagram with Action Card (CEDAC) An example Source: Mahadevan, B. (2015), Operations Management: Theory & Practice, Pearson Education, 3 rd Edition, pp 341.
38 Poka Yoke Poka Yoke, which means fool proofing is a technique which works on the basic premise that several defects that creep into an operation are indeed avoidable Further, Errors & Defects have a Cause & Effect relationship Poka Yoke ensures that a defect once detected can be eliminated once and for all by modifying the process or design of the product or service


39 POKA YOKE An example
40 Matrix Diagram A two dimensional matrix to portray and analyze a problem at a strategic level Once the two dimensions are identified it lends itself to the analysis of the problem in a structured way A visual approach that helps management to identify problems and possible solutions

41 Performance of the company Worst Same Better Matrix Diagram: An Example Earth Moving Equipment Manufacturer A - Product cost B - Product quality C - Engg. Quality D - Enquiry lead time E - Mfg. lead time F - Delivery reliability G - Design flexibility H - Delivery flexibility I - Volume flexibility J - Service support Less Important Qualifying Importance of the Attribute Order Winning Source: Mahadevan, B. (2015), Operations Management: Theory & Practice, Pearson Education, 3 rd Edition, pp 343.
42 Quality Function Deployment (QFD) The four houses of quality Links customer needs to design attributes Links design attributes to actions firms can take Links actions to implementaction decisions Links implementaction to process plans Source: Mahadevan, B. (2015), Operations Management: Theory & Practice, Pearson Education, 3 rd Edition, pp 344.
43 House of Quality 5. Tradeoffs 2. Importance 3. Product characteristics 1. Customer requirements 4. Relationship matrix 6. Benchmarks 7. Technical assessment & target values Source: Mahadevan, B. (2015), Operations Management: Theory & Practice, Pearson Education, 3 rd Edition, pp 315.
44 House of Quality An illustration for a Restaurant Customer Requirements Correlation: ++: Strong Positive +: Positive + -: Negative -- --: Strong Negative Number of tables available Competitive Evaluation X- Own Company A - Competitor A B - Competitor B (5 is best) Steaming hot A B X Enough space to sit & eat X A B Less time during peak hours X B A Easy to carry home 2 ++ A X B Quick order processing X A B Importance Weighting Importance Scale: Strong: 9 Medium: 3 Small: 1 Target Values Technical Characteristics Temperature of cooked item Maintain current Level Time taken to cook the food Reduce it by 10% of the current level Order processing time Reduce time to 2 minutes Thickness of packing material Maintain current level Number of service counters in peak time Increase the counters by one Maintain current level Technical Evaluation (5 is best) 5 4 X A,B A,B X 3 A X B X,B X,A,B 2 B X A A 1 Source: Mahadevan, B. (2015), Operations Management: Theory & Practice, Pearson Education, 3 rd Edition, pp 315.
45 Quality Management Statistical Process Control (SPC) - Fundamentals
46 SPC An Introduction Statistics is at the core of modern quality management Helps operationalize some decisions and keep performance and outcome with in limits Provides basic framework to systematically analyze the quality problem in various business processes A good mechanism to highlight either an existing quality problem or an impending problem
47 Variations in Business Processes Two types of variations occur in business processes; Common Causes & Assignable Causes Chance variations due to common causes causes due to random events that cannot be controlled Ambient temperature and humidity Normal wear and tear
48 Statistical Process Control Business processes always exhibit variations Filling a 500 gms detergent powder in a sachet Guest check-out time in a 5 star hotel SPC is a collective set of tools & techniques used to develop a quality assurance system that enables one to make meaningful sense of these variations
49 Assignable Causes Non-random variations due to assignable causes When observed variations are not statistically found to be due to random events, it clearly points to the existence of assignable causes Errors due to operator skill level differences Changes in the operating condition of an equipment Changes introduced in the standard operating procedure
50 Issues addressed thru SPC Key issues addressed in SPC based quality assurance system: How do we know whether the observed changes are due to random variations or assignable causes? How does one ensure that the random events are indeed rare events?
51 Quality Assurance using SPC Some terminologies: Designed Standard Centre of specification limits (Target) Upper Specification Limit (USL) Lower Specification Limit (LSL) (USL LSL): Desired tolerance This represents the Voice of the Customer
52 Voice of the Customer Examples Customer check-out time in a 5 star Hotel: 90 ± 20 Seconds Target = 90 seconds USL = 110 seconds LSL = 70 Seconds Desired tolerance is Seconds Diameter of the pen manufactured: 8 ± 0.5 mm Target = 8.0 millimeter USL = 8.5 millimeter LSL = 7.5 millimeter Desired tolerance is millimeter
53 Quality Assurance using SPC Some terminologies: Status of process Centre of the process (Process Average) Upper Control Limit (UCL) Lower Control Limit (LCL) (UCL LCL): Spread of the process This represents the Voice of the Process
54 SPC Attribute to study At the outset the questions that we need to address are: What is the attribute in a process that needs to be measured for the purpose of quality control? How should we measure for the purpose of analysis?
55 Characteristics for process control Some examples Type of Applications Characteristic for Measurement Manufacturing Number of defects in the product Conformance to test specifications Number of missing elements Service Systems Number of defects in various business processes Errors in processing documents Conformance to waiting time/lead time related specifications Source: Mahadevan, B. (2015), Operations Management: Theory & Practice, Pearson Education, 3 rd Edition, pp 581.
56 Choosing a characteristic Examples from service industry Time taken to complete the Settlement of claims in insurance Loan approval in a financial institution Patient admission process in a hospital Voice of the customer: 20 ± 6 Minutes How to measure the quality performance in this case?
57 Methods of measuring defects Method A: Count the number of occasions patients were indeed admitted after 26 minutes as defects in the process. In 100 observations, let us say there were 7 occasions this means the proportion of defects is 7% Method B: Make detailed measurements of the actual admission time in the 100 cases 24.95, 21.87, 25.45, Use this data and do analysis
58 Measurement Methods Attribute Based Simple clustering of the characteristic into a few categories (such as good or bad) Measurements are easy to make, quick & less expensive Will reveal very little information about the process
59 Measurement Methods Variable Based Detailed observation of the characteristic (such as length, diameter, weight, time) This is called variable based Measurement will be expensive and more time consuming Will provide a wealth of information about the process
60 Types of Charts For attribute based measures we have p chart C chart For variable based measures we have R Chart Before we see the specifics of each of these let us get to know the process of setting up a control chart
61 Logic of Charts We use certain well known statistical principles pertaining to a random process The mean (which is the measure of central tendency) The Standard Deviation (which is a measure of dispersion) In a Normal Distribution, the area covered within ± 3 std. dev will be 99.73%
62 Normal Distribution
63 Logic of Charts What it means is that any variations happening in this range has a probability that it is due to random events. Once we cross these limits the probability that the variation is due to random is so low that we begin to suspect there is an assignable cause This is an indication that the process may be out of control
64 Control Chart A generalized representation +3σ Upper Control Limit (UCL) Plot of sample data Process Average 3σ Lower Control Limit (LCL) Process in a state of Statistical Control Source: Mahadevan, B. (2015), Operations Management: Theory & Practice, Pearson Education, 3 rd Edition, pp 583.
65 Control Chart A generalized representation +3σ Out of control indication Upper Control Limit (UCL) Process Average 3σ Lower Control Limit (LCL) Process not in a state of Statistical Control
66 Quality Management Setting up a Control Chart
67 Setting up a process control system Choose the characteristic for process control Choose the Measurement method Attribute Based Variable Based P chart, c chart XChart, R Chart Choose the type of Control Chart Collect Data, Establish Control Limits Plot the data & Analyse Source: Mahadevan, B. (2015), Operations Management: Theory & Practice, Pearson Education, 3 rd Edition, pp 580.
68 Step 1: Choose the measurement characteristic: Diameter of a cylindrical component (cm) Step 2: Choose the measurement method Actual measurement of diameter (variable based) Step 3: Choose the Control Chart: Step 4: Decide on a Sampling Plan Step 5: Collect Data & Establish Control Limits
69 Data for the chart Sampling Plan Sample every 20 minutes Each time take five consecutive samples (Sample size is 5) Take 15 such samples Observations in each sub-group* Sub-groups * All values in the table in centimeters Source: Mahadevan, B. (2015), Operations Management: Theory & Practice, Pearson Education, 3 rd Edition, pp 584.


70 Extract the process parameters Subgroups Observations in each sub-group Average Range X (R) Average of all 15 observations * All values in the table in centimeters Source: Mahadevan, B. (2015), Operations Management: Theory & Practice, Pearson Education, 3 rd Edition, pp 584.
 2 1.880 0 3.268 3 1.023 0 2.574 4 0.729 0 2.282 5 0.577 0 2.114 6 0.")

71 Establish Control Limits Table for selecting values for establishing the control limits for X and R Charts* Sample A 2 D 3 D 4 size (n) * Source: Juran, J.M. and F.M. Gryna, (1995), Quality Planning and Analysis, Tata McGraw-Hill, 3 rd Edition, New Delhi, pp 385.

72 Establish Control Limits In our example, A 2 = 0.577; D 3 = 0; D 4 = * All values in centimeters
73 XChart X-bar Chart Mean Diameter (cms) Sample Means Centre Line UCL LCL Sample Number Source: Mahadevan, B. (2015), Operations Management: Theory & Practice, Pearson Education, 3 rd Edition, pp 585.
74 R Chart An example Mean Range (cms) R Chart Sample Range Centre Line UCL LCL Sample Number Source: Mahadevan, B. (2015), Operations Management: Theory & Practice, Pearson Education, 3 rd Edition, pp 585.
75 P Chart Suppose the same cylinders are subjected to a much simpler testing of merely classifying them as defect When the cylinder is beyond the acceptable limits (too small or too big in diameter) it is classified as defect Sampling Plan is as follows: Sample 100 pieces every 30 minutes for testing Collect 12 such samples
76 P Chart Step 1: Choose the measurement characteristic: Diameter of a cylindrical component (cm) Step 2: Choose the measurement method Classify as good or bad (attribute based) Step 3: Choose the Control Chart: P Chart Step 4: Decide on a Sampling Plan Step 5: Collect Data & Establish Control Limits
77 Data for the chart Sampling Plan Sample no. Number of defects Sample every 30 minutes Each time take 100 consecutive samples Take 12 such samples * All values in the table in centimeters Source: Mahadevan, B. (2015), Operations Management: Theory & Practice, Pearson Education, 3 rd Edition, pp 586.
 1 10 0.10 2 9 0.09 3 8 0.08 4 11 0.")

78 Extract the process parameters Sample no. Number of p defects (%) Average of all 12 observations * All values in the table in centimeters

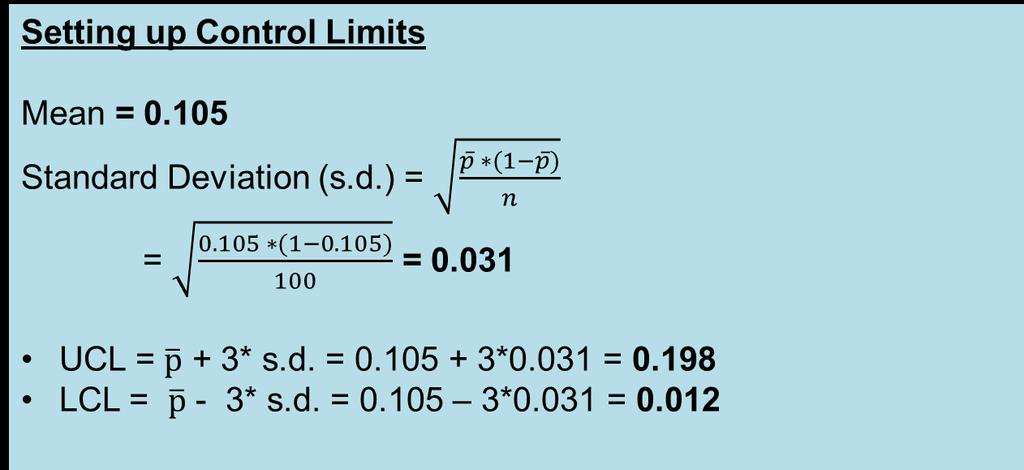
79 Establish Control Limits
80 P Chart p Chart p Centre Line UCL LCL Proportion of defects Sample No. Source: Mahadevan, B. (2015), Operations Management: Theory & Practice, Pearson Education, 3 rd Edition, pp 587.
81 C Charts Similar to p chart, Instead of proportion of defects, we merely count the number of defects Appropriate in certain situations Number of knots in a square meter of a cloth Number of scratches in a square meter of a smooth finished surface etc.

82 Computing the limits for C Chart
83 Quality Management Using the Control Charts
84 Using the Control Charts There are two questions that comes to our mind when it comes to using the control charts: Is the process of out of control? What are we supposed to do in that case? Is there a way we can detect an impending out of control situation much earlier?
85 Number of defects Process out of control Points outside the control limit c Chart c Centre Line UCL LCL Sample No. Source: Mahadevan, B. (2015), Operations Management: Theory & Practice, Pearson Education, 3 rd Edition, pp 588.
86 Steps to be taken Step 1: Remove the outlier and re-compute the control limits (revise the chart parameters) Step 2: Perform a detailed investigation to explore any assignable causes for the drift in the performance Step 3: If there are no assignable causes, resume the process with revised control parameters Step 4: If there are assignable causes implement countermeasures, and resume the process Step 5: Stabilize the process, re-establish control limits and ensure the process is in control
87 Early Detection of Problems The other question pertains to early detection of an impending problem Over several years, some useful rules have been created that helps operating personnel to detect a possible drift in the process
, Operations Management: Theory & Practice, Pearson Education, 3 rd")
88 Zones A, B and C Mean Zone A Zone B Zone C Source: Mahadevan, B. (2015), Operations Management: Theory & Practice, Pearson Education, 3 rd Edition, pp 590.
89 When to Stop the Process One point beyond Zone A Nine points in a row in Zone C or beyond Six points in a row, steadily increasing or decreasing Fourteen points in a row, alternating up & down Two out of three points in a row in Zone A or beyond Four out of five points in a row in Zone B and beyond Fifteen points in a row in Zone C

, Operations Management: Theory & Practice, Pearson Education, 3")
90 Predictive capability of processes Which process is better? Process B is better than Process A Spread of a process is indicative of its capability Lesser the spread better is the process Source: Mahadevan, B. (2015), Operations Management: Theory & Practice, Pearson Education, 3 rd Edition, pp 591.

91 Predictive capability of processes Which process is better? Offset Process A is better than Process B A process that is aligned closer to the desired target is likely to be more capable Process B Process A LSL Source: Mahadevan, B. (2015), Operations Management: Theory & Practice, Pearson Education, 3 rd Edition, pp 592. Target USL
92 Process Capability Process Capability is defined by the spread of the process Potential capability (C p ) is defined as the ratio of the difference in specification limits to the process spread C p = Specification Range Pr ocess Capability ( USL LSL) 6 Actual capability (C pk ) takes into consideration the extent to which the process has deviated from the desired target C pk = Min Pr ocess Centre LSL USL Pr ocess, 3 3 Centre
93 Process Capability & Defects Process Capability Index (C pk ) Total Products outside the specification limits ,255 ppm ,614 ppm ,861 ppm ,395 ppm ,700 ppm ppm ppm ppm ppm Source: Quality Planning & Analysis, Juran & Gryna, Chapter 17, 3e
94 Six sigma Organization C pk is a good measure to predict the defects coming out of a process It could be used to target improvements in the process Suppliers could be asked to submit their C pk levels and it can be continuously monitored A six sigma organization is one which is able to achieve a C pk value of 2
95 Quality Management Issues in Service Quality
96 Service Quality Issues Example A flight that is supposed to take off at 7.30 pm is getting delayed. The airline customer relationship officer has kept the passengers in the dark about the delay. Further, upon mounting pressure announces a departure time which never happened.
97 Service Quality Issues Example A week end program in a business school was a disaster as it was nowhere near the expectations of the participants A number of e-retailers in the US failed miserably during the Christmas season of They could not deliver the Christmas gift before Christmas. Instead they returned the money paid by the customers with a $ 50 add on to it and an apology note..
98 Intangibility Performances rather than objects, therefore precise specs. can be rarely set Cannot be counted, measured, inventoried, tested and verified in advance to assure quality Difficult to understand how consumers perceive & evaluate their services
99 Heterogeneity Performance vary from producer to producer, consumer to consumer, day to day Consistency of behavior from service personnel is difficult to assure What firms intend to deliver may be different from what the consumer receives
100 Simultaneity Not engineered in a plant and then delivered in tact to the consumer Quality occurs during service delivery while the consumer interacts with the service personnel Consumers input may be critical to quality The service firm may have less managerial control in real time
101 Service Quality Some considerations Service quality is A measure of how well the service delivered matches with expectations Pre-dominantly is a function of perceptions of the customers (Example of the weekend course in a Business School)
102 Service Quality Some considerations Quality evaluations are Not made solely on the outcome of the service They also involve evaluation of the process of delivery (Example of Airline Delays & the way it was handled) (Example of e-tailers inability to deliver Christmas Gifts) Points to difficulty in Service Recovery (after a failure)
103 Service Quality The five gaps model Expected Service Gap 5 Consumer Perceived Service Firm Gap 3 Service Delivery Gap 4 External Communications to Consumers Gap 1 Translation of perceptions into Service Qlty. Specs. Gap 2 Management perceptions of Consumer Expectations Source: Parasuraman, A., Zeithhaml, V.A. and Berry, L.L., (1985), A conceptual model of service quality & its implications for future research, Journal of Marketing, 49 (4),
104 Gaps in Service Quality Why do they occur? Gap 1: Service firm executives may not always understand What the consumer wants? What features a service must have? What levels of performance? Gap 2: Means to meet the expectations absent Knowledge of consumer expectations exist but not the perceived means to deliver Absence of management commitment to quality Gap 3: Variability in employee performance Gap 4: Problems arising out of communication Firms tend to promise more in communications than what they deliver in reality Firms tend to neglect to inform consumers of special efforts to assure quality that are not visible to consumers Gap 5 = f (Gap 1, Gap 2, Gap 3, Gap 4)
105 Service Quality Concluding Remarks Service Quality is more challenging than product quality as it is a function of the perceptions of the customers Organizations can use the notion of gaps in service delivery to identify specific improvement opportunities in the service delivery process
Project Quality Management. For the PMP Exam using PMBOK
 Project Quality Management For the PMP Exam using PMBOK Guide 5 th Edition PMI, PMP, PMBOK Guide are registered trade marks of Project Management Institute, Inc. Contacts Name: Khaled El-Nakib, PMP, PMI-RMP
For the PMP Exam using PMBOK. PMI, PMP, PMBOK Guide are registered trade marks of Project Management Institute, Inc.
 For the PMP Exam using PMBOK Guide 5 th Edition PMI, PMP, PMBOK Guide are registered trade marks of Project Management Institute, Inc. 1 Contacts Name: Khaled El-Nakib, MSc, PMP, PMI-RMP URL: http://www.khaledelnakib.com
Quality Management. It costs a lot to produce a bad product. Norman Augustine
 Quality Management It costs a lot to produce a bad product. Norman Augustine Cost of quality 1. Prevention costs 2. Appraisal costs 3. Internal failure costs 4. External failure costs 5. Opportunity costs
Operations Management
 9-1 Management of Quality Operations Management William J. Stevenson 8 th edition 9-2 Management of Quality CHAPTER 9 Management of Quality McGraw-Hill/Irwin Operations Management, Eighth Edition, by William
The Philosophy of TQM An Overview
 The Philosophy of TQM An Overview TQM = Customer-Driven Quality Management References for Lecture: Background Reference Material on Web: The Philosophy of TQM by Pat Hammett Customer Quality Measures Customers
PROJECT QUALITY MANAGEMENT. 1 Powered by POeT Solvers LImited
 PROJECT QUALITY MANAGEMENT 1 www.pmtutor.org Powered by POeT Solvers LImited WHAT S PROJECT QUALITY MANAGEMENT? WHAT S PROJECT QUALITY MANAGEMENT? Project Quality Management processes include all the activities
SHORT ANSWER QUESTIONS (KEY) UNIT- I
 UNIT- I") SHORT ANSWER QUESTIONS (KEY) UNIT- I 1. Define quality. Quality is the totality of characteristics of an entity that bear on its ability to satisfy stated and implied needs. 2. What do you mean by quality
SHORT ANSWER QUESTIONS (KEY) UNIT- I 1. Define quality. Quality is the totality of characteristics of an entity that bear on its ability to satisfy stated and implied needs. 2. What do you mean by quality
PMP Exam Preparation Workshop Project Quality Management
 PMP Exam Preparation Workshop Project Quality Management 1 Learning Objectives By the end of this session you will understand: The PM Quality Processes The PM Process Groups Project Quality Management
Lecture Notes on Statistical Quality Control
 STATISTICAL QUALITY CONTROL: The field of statistical quality control can be broadly defined as those statistical and engineering methods that are used in measuring, monitoring, controlling, and improving
Learning Objectives. Defining Quality. Defining Quality 5 Ways. Manufacturing Quality vs. Service Quality. Cost of Quality. Chapter 5 Managing Quality
 Chapter 5 Managing Quality Operations Management by R. Dan Reid & Nada R. Sanders 4th Edition Wiley 2010 Learning Objectives Explain the meaning of TQM Identify the costs of Quality Identify Quality leaders
Quality Management (PQM01) Chapter 04 - Quality Control
 Chapter 04 - Quality Control") Quality Management (PQM01) Chapter 04 - Quality Control Slide 1 Slide 2 Involves monitoring specific project results to determine if they comply with relevant quality standards, and identifying ways to
Quality Management (PQM01) Chapter 04 - Quality Control Slide 1 Slide 2 Involves monitoring specific project results to determine if they comply with relevant quality standards, and identifying ways to
International Journal on Textile Engineering and Processes, ISSN: , Vol 1, Issue 1, Jan2015
 Total Quality Management in Terry Fabric Manufacturing Pranjali Chandurkar, CTF Abstract The challenge that companies face as the 21st Century gets underway, is to succeed in global economy where competition
Workshop 5. Managing Quality. Kate Hughes & John Whiteley
 Workshop 5 Managing Quality Kate Hughes & John Whiteley 8-2 The various definitions of quality The transcendent approach views quality as synonymous with innate excellence. The manufacturing-based approach
Ch.3 Quality Issues.
 Module 2 : Supply Environment. Ch.3 Quality Issues. Edited by Dr. Seung Hyun Lee (Ph.D., CPM) IEMS Research Center, E-mail : lkangsan@iems.co.kr Resolving Quality Problems. Documentation of Corrective
Product, Service & Process Design
 Strategies for new product introduction market pull we make what we can sell example: food industry technology push we sell what we can make example: electronics inter-functional view example: personal
Process Performance and Quality Chapter 6
 Process Performance and Quality Chapter 6 How Process Performance and Quality fits the Operations Management Philosophy Operations As a Competitive Weapon Operations Strategy Project Management Process
Process Performance and Quality
 Process Performance and Quality How Process Performance and Quality fits the Operations Management Philosophy Chapter 6 Operations As a Competitive Weapon Operations Strategy Project Management Process
Introduction to Quality Management. BPF 2123 Quality Management System
 Introduction to Quality Management BPF 2123 Quality Management System 1 Chapter Outline Introduction Changes in the Business Culture Defining Quality Dimensions of Quality Gurus of Quality / TQM Historical
Introduction to Control Charts
 Introduction to Control Charts Highlights Control charts can help you prevent defects before they happen. The control chart tells you how the process is behaving over time. It's the process talking to
LEAN PRODUCTION SYSTEM
 LEAN PRODUCTION SYSTEM Introduction Lean Overview Process Control Tools 1. Flow Chart / Diagram 2. Check Sheet 3. Histogram 4. Pareto Chart / Diagram 5. Cause-and-Effect Diagram 6. Why-Why Diagram 7. Scatter
Online Student Guide Types of Control Charts
 Online Student Guide Types of Control Charts OpusWorks 2016, All Rights Reserved 1 Table of Contents LEARNING OBJECTIVES... 4 INTRODUCTION... 4 DETECTION VS. PREVENTION... 5 CONTROL CHART UTILIZATION...
PART 5 Managing Growth in the Small Business
 Managing Operations PART 5 Managing Growth in the Small Business PowerPoint Presentation by Charlie Cook, The University of West Alabama 2010 Cengage Learning. All Rights Reserved. May not be scanned,
Techniques and Tools OPRE
 Techniques and Tools OPRE 6364 1 TQM Operationalized Find out what the customer wants Design a product or service that meets or exceeds customer wants Design processes that facilitates doing the job right
Projektledning och Projektmetodik, VBEF01. Kristian Widén Tekn. Doktor Avd. För Byggproduktion Inst. För Byggvetenskaper Lunds Universitet
 Projektledning och Projektmetodik, VBEF01 Kristian Widén Tekn. Doktor Avd. För Byggproduktion Inst. För Byggvetenskaper Lunds Universitet 1 Project Quality Management 2 What Is Project Quality Management?
Application of statistical tools and techniques in Quality Management
 Application of statistical tools and techniques in Quality Management Asst. Professor Dr Predrag Djordjevic University of Belgrade, Technical Faculty in Bor, Serbia QUALITY IN SOCIETY The concept was known
Quality. Monitoring & Controlling Processes. Planning. Processes. Executing Processes. Process. Knowledge Area. Monitoring &
 PMBOK 5 Ed. DEI- Monitoring & Controlling Processes Planning Processes Enter phase/ Start project Initiating Processes Closing Processes Exit phase/ End project Executing Processes Knowledge Area Process
Industrial Problem Solving
 Industrial Problem Solving Presented by Chris Butterworth Six Sigma Master Black Belt Chris Butterworth ASQ Certified Six Sigma Master Black Belt 30+ years experience in Manufacturing Inspector - Quality
Project Quality Management. Prof. Dr. Daning Hu Department of Informatics University of Zurich
 Project Quality Management Prof. Dr. Daning Hu Department of Informatics University of Zurich Learning Objectives Define project quality management and understand how quality relates to various aspects
FUNDAMENTALS OF QUALITY CONTROL AND IMPROVEMENT
 FUNDAMENTALS OF QUALITY CONTROL AND IMPROVEMENT Third Edition AMITAVA MITRA Auburn University College of Business Auburn, Alabama WILEY A JOHN WILEY & SONS, INC., PUBLICATION PREFACE xix PARTI PHILOSOPHY
Continuous Improvement Toolkit. Graphical Analysis. Continuous Improvement Toolkit.
 Continuous Improvement Toolkit Graphical Analysis The Continuous Improvement Map Managing Risk FMEA Understanding Performance Check Sheets Data Collection PDPC RAID Log* Risk Assessment* Fault Tree Analysis
Computer Science and Software Engineering University of Wisconsin - Platteville 3. Statistical Process Control
 Computer Science and Software Engineering University of Wisconsin - Platteville 3. Statistical Process Control Yan Shi SE 3730 / CS 5730 Lecture Notes Outline About Deming and Statistical Process Control
Project Management CTC-ITC 310 Spring 2018 Howard Rosenthal
 Project Management CTC-ITC 310 Spring 2018 Howard Rosenthal 1 Notice This course is based on and includes material from the text: A User s Manual To the PMBOK Guide Authors: Cynthia Stackpole Snyder Publisher:
Developing and implementing statistical process control tools in a Jordanian company. R.H. Fouad* and Salman D. Al-Shobaki
 Int. J. Manufacturing Technology and Management, Vol. 17, No. 4, 2009 337 Developing and implementing statistical process control tools in a Jordanian company R.H. Fouad* and Salman D. Al-Shobaki Department
FUNDAMENTALS OF QUALITY CONTROL AND IMPROVEMENT. Fourth Edition. AMITAVA MITRA Auburn University College of Business Auburn, Alabama.
 FUNDAMENTALS OF QUALITY CONTROL AND IMPROVEMENT Fourth Edition AMITAVA MITRA Auburn University College of Business Auburn, Alabama WlLEY CONTENTS PREFACE ABOUT THE COMPANION WEBSITE PART I PHILOSOPHY AND
WHY QUALITY IS IMPORTANT? PRODUCT AND QUALITY COSTS OF POOR QUALITY COST OF ACHIEVING GOOD QUALITY. Prevention costs.
 WHY QUALITY IS IMPORTANT? Lecture 7: Quality management systems PRODUCT AND QUALITY Quality has direct impact on economic results in both ways Costs Incomes Quality assurance Poor quality costs Higher
Chapter 06 Service Quality
 Chapter 06 Service Quality McGraw-Hill/Irwin Service Management: Operations, Strategy, and Information Technology, 6e Copyright 2008 by The McGraw-Hill Companies, Inc. All Rights Reserved. Moments of Truth
1. What is a key difference between an Affinity Diagram and other tools?
 1) AFFINITY DIAGRAM 1. What is a key difference between an Affinity Diagram and other tools? Affinity Diagram builds the hierarchy 'bottom-up', starting from the basic elements and working up, as opposed
Dimensions of product and service quality
 Dimensions of product and service quality DIMENSIONS OF QUALITY Dimension Meaning and Example Performance Primary product characteristics, such as the brightness of the picture Features Secondary characteristics,
Global Operations and Supply Chain Management Final Exam Notes
 Global Operations and Supply Chain Management Final Exam Notes Lecture One Operations Management: the process that effectively produce, transform and deliver a product or service. Inputs -> transformation
Quality Tool to Achieve Excellence in Construction Projects. By Dr. Abdul Razzak Rumane 2018 by Rumane
 Quality Tool to Achieve Excellence in Construction Projects By Dr. Abdul Razzak Rumane 2018 by Rumane Topics to be Discussed 1. Overview of Quality 2. Quality Definition 3. Categories of Quality Tools
Chapter 6 - Statistical Quality Control
 Chapter 6 - Statistical Quality Control Operations Management by R. Dan Reid & Nada R. Sanders 3rd Edition PowerPoint Presentation by R.B. Clough UNH M. E. Henrie - UAA Learning Objectives Describe Categories
Analysis of Software Quality Tools Samsung Galaxy Note 7 Recall Case
 Analysis of Software Quality Tools Samsung Galaxy Note 7 Recall Case Aishwary Borkar, Aishwarya Auti, Robinson Ingle Symbiosis Institute of Computer Studies and Research SI(D)U Pune, India Symbiosis Institute
Lean Gold Certification Blueprint
 The Lean Certification Blueprint provides additional useful information beyond the Body of Knowledge. The Body of Knowledge specifies the competencies, topics, and subtopics required by different types
many quality problems remain invisible to consumers
 Quality Management 1. Define Quality and TQM. 2. What are the ISO standards and why are they important? 3. What is Six Sigma? 4. Explain how benchmarking is used? 5. What are quality robust products and
Delivering Engineered Solutions
 Quality Terms Term Description Accept / Reject Criteria This refers to the measurement and decision of whether or not the quality and performance of a product or service is acceptable. These criteria can
Quality Management Chapter 14
 Quality Management Chapter 14 1 Objectives What is Quality? Total Quality Management TQM in Service Cost of Quality Quality Improvements Quality Awards and Certifications 2 What is Quality? The Meaning
Expert Reference Series of White Papers. Tools and Techniques Useful in Quality Planning, Assurance, and Control
 Expert Reference Series of White Papers Tools and Techniques Useful in Quality Planning, Assurance, and Control info@globalknowledge.net www.globalknowledge.net The Tools and Techniques Useful in Quality
PROJECT MANAGEMENT. Quality Management (QM) Course 7 Project Management Knowledge Areas (5) Risk Management (RM)
 Course 7 Project Management Knowledge Areas (5) Risk Management (RM)") PROJECT MANAGEMENT Course 7 Project Management Knowledge Areas (5) Quality Management (QM) Risk Management (RM) Cătălina Mancaș QM + RM Processes: Inputs Tools & Techniques Outputs Project Quality Management
PROJECT MANAGEMENT Course 7 Project Management Knowledge Areas (5) Quality Management (QM) Risk Management (RM) Cătălina Mancaș QM + RM Processes: Inputs Tools & Techniques Outputs Project Quality Management
Continuous Improvement Toolkit. Pareto Analysis. Continuous Improvement Toolkit.
 Continuous Improvement Toolkit Pareto Analysis The Continuous Improvement Map Managing Risk FMEA Understanding Performance Check Sheets Data Collection PDPC RAID Log* Risk Assessment* Fault Tree Analysis
CP:
 Adeng Pustikaningsih, M.Si. Dosen Jurusan Pendidikan Akuntansi Fakultas Ekonomi Universitas Negeri Yogyakarta CP: 08 222 180 1695 Email : adengpustikaningsih@uny.ac.id Operations Management Managing Quality
SEMBODAI RUKMANI VARATHARAJAN ENGINEERING COLLEGE
 SEMBODAI RUKMANI VARATHARAJAN ENGINEERING COLLEGE DEPARTMENT OF ELECTRONICSAND COMMUNICATION ENGINEERING QUESTION BANK Sub.Code :GE6757 Branch / Year / Sem : ECE/IV/VII Sub.Name :TOTAL QUALITY MANAGEMENT
Daily Management (DM) as a Key Driver of Process Improvement, Consistency and Reliability at the Level of the Work
 as a Key Driver of Process Improvement, Consistency and Reliability at the Level of the Work") Daily Management (DM) as a Key Driver of Process Improvement, Consistency and Reliability at the Level of the Work Summary: DM is the key accountability sub-system for managers to continually improve their
Daily Management (DM) as a Key Driver of Process Improvement, Consistency and Reliability at the Level of the Work Summary: DM is the key accountability sub-system for managers to continually improve their
LEAN CERTIFICATION BODY OF KNOWLEDGE RUBRIC VERSION 3.0
 MODULE 1 LEAN CERTIFICATION BODY OF KNOWLEDGE RUBRIC VERSION 3.0 1. Cultural Enablers 15% 20% 25% 1.1. Principles of Cultural Enablers 3% 4% 5% 1.1.1. Respect for the individual 1.1.2. Humility 1.2. Processes
Process Analysis Chapter 3
 Process Analysis Chapter 3 How Process Analysis fits the Operations Management Philosophy Operations As a Competitive Weapon Operations Strategy Project Management Process Strategy Process Analysis Process
Statistics Quality: Control - Statistical Process Control and Using Control Charts
 Statistics Quality: Control - Statistical Process Control and Using Control Charts Processes Processing an application for admission to a university and deciding whether or not to admit the student. Reviewing
CH (8) Hot Topics. Quality Management
 Hot Topics. Quality Management") CH (8) Hot Topics Quality Management 1 CH ( 8 ) Quality Management 2 Introduction This knowledge area requires you to understand three processes, as described in the book PMP : Plan Quality Management,
CH (8) Hot Topics Quality Management 1 CH ( 8 ) Quality Management 2 Introduction This knowledge area requires you to understand three processes, as described in the book PMP : Plan Quality Management,
Quality management in construction projects
 Quality management in construction projects MSc, PMP, CQE ASQ. Introduction The quality as a concept has a deep root in the history, anyway the quality profession greatly evolved after World War II when
The materials required over the next two modules include:
 Meet with the Math Instructor and verify that the statistics modules have been completed and that students will be again reviewing these kinds of data over the next two quality modules. The Math Instructor
Total Quality Management
 Total Quality Management James R. Evans Total Quality Management Contents About This Course How to Take This Course ix xi 1 Quality in Manufacturing and Service 1 A Brief History Modern Developments
Applying Statistical Techniques to implement High Maturity Practices At North Shore Technologies (NST) Anand Bhatnagar December 2015
 Anand Bhatnagar December 2015") Applying Statistical Techniques to implement High Maturity Practices At North Shore Technologies (NST) Anand Bhatnagar December 2015 For our audience some Key Features Say Yes when you understand Say No
Applying Statistical Techniques to implement High Maturity Practices At North Shore Technologies (NST) Anand Bhatnagar December 2015 For our audience some Key Features Say Yes when you understand Say No
Chapter 9 1. List and briefly explain the dimensions of product and service quality
 Chapter 9 1. List and briefly explain the dimensions of product and service quality Product Quality the dimensions of product quality include: 1. performance main characteristics or function of the product
An Introduction to Hoshin Kanri, a.k.a. Strategic Goal Deployment How to Use this Process to Deploy Your Strategic Goals
 An Introduction to Hoshin Kanri, a.k.a. Strategic Goal Deployment How to Use this Process to Deploy Your Strategic Goals Pete Winiarski Win Enterprises, LLC Hoshin Kanri has its roots in the 1950s, with
QUESTION 2 What conclusion is most correct about the Experimental Design shown here with the response in the far right column?
 QUESTION 1 When a Belt Poka-Yoke's a defect out of the process entirely then she should track the activity with a robust SPC system on the characteristic of interest in the defect as an early warning system.
İŞL 343 Üretim İşlemler Yönetimi Bahar Dönemi. Chapters 9-10 Management and Control of Quality. Melike Meterelliyoz Kuyzu
 İŞL 343 Üretim İşlemler Yönetimi 2010-2011 Bahar Dönemi Chapters 9-10 Management and Control of Quality Melike Meterelliyoz Kuyzu What is quality? Quality does not mean goodness is the ability of a product
Measurement Systems Analysis
 Measurement Systems Analysis Components and Acceptance Criteria Rev: 11/06/2012 Purpose To understand key concepts of measurement systems analysis To understand potential sources of measurement error and
Managing Quality. PowerPoint slides by Jeff Heyl. Copyright 2017 Pearson Education, Inc.
 Managing Quality 6 PowerPoint presentation to accompany Heizer, Render, Munson Operations Management, Twelfth Edition Principles of Operations Management, Tenth Edition PowerPoint slides by Jeff Heyl 6-1
Malay (Rumi, Roman script)
") Hai Malay (Rumi, Roman script) Project Management Process Groups Project Integration Management Initiating Planning Executing Scope Monitoring & Controlling Closing Knowledge Areas Time Cost Quality Human
Hai Malay (Rumi, Roman script) Project Management Process Groups Project Integration Management Initiating Planning Executing Scope Monitoring & Controlling Closing Knowledge Areas Time Cost Quality Human
Process Improvement Sudies in Appliance Manufacturing
 ABSTRACT Process Improvement Sudies in Appliance Manufacturing Dr. Hulya Yazici Arcelik A.S. The study illustrates the use of SAS/QC, STAT modules of SAS Institute for computerized process data analysis.
Project Quality Management
 Project Quality Introduction Unit 1 Unit 2 Unit 3 PMP Exam Preparation Project Integration Project Scope Project Time Unit 4 Unit 5 Unit 6 Unit 7 Project Cost Project Quality Project Human Resource Project
KINGS COLLEGE OF ENGINEERING DEPARTMENT OF MANAGEMENT STUDIES QUESTION BANK UNIT 1 INTRODUCTION
 KINGS COLLEGE OF ENGINEERING DEPARTMENT OF MANAGEMENT STUDIES QUESTION BANK IV/VII Subject Code/Name: MG1401/Total Quality Management Year/Sem : UNIT 1 INTRODUCTION PART A( 2 marks) 1 Define quality. 2
IE 301 Industrial Engineering laboratory LAB No.5: The seven QC tools and Acceptance sampling Instructor: Assisant.Prof. Parichat Chuenwatanakul Lab
 IE 301 Industrial Engineering laboratory LAB No.5: The seven QC tools and Acceptance sampling Instructor: Assisant.Prof. Parichat Chuenwatanakul Lab objectives: To practice using the seven QC tools to
Slide Chapter 17 Quality management
 Slide 17.1 Chapter 17 Quality management Slide 17.2 Quality management Direct Design Operations management Develop Quality management Deliver The market requires consistent quality of products and services
Seven Quality Control Tools
 Seven Quality Control Tools Workbook 7QC Overview Learn what Quality Control is as well as what the 7QC Tools are. A workbook intended to accompany the Facilitator s Guides for this course. This guide
Instructor Info: Dave Tucker, LSSMBB ProModel Senior Consultant Office:
 Instructor Info: Dave Tucker, LSSMBB ProModel Senior Consultant Office: 321.567.5642 dtucker@promodel.com 1 Understand how simulation models can be utilized within the DMAIC approach Examine a completed
Strategies for Improvement of Process Control
 Strategies for Improvement of Process Control Michael V. Petrovich Luftig & Warren International National Manufacturing Week March 2000 Presentation Objectives Expand the concept of process control beyond
Continuous Improvement Toolkit. Relationship Mapping. Continuous Improvement Toolkit.
 Continuous Improvement Toolkit Relationship Mapping The Continuous Improvement Map Managing Risk FMEA Understanding Performance Check Sheets Data Collection PDPC RAID Log* Risk Assessment* Fault Tree Analysis
Chapter 1 Statistical Quality Control, 7th Edition by Douglas C. Montgomery. Copyright (c) 2013 John Wiley & Sons, Inc.
 2013 John Wiley & Sons, Inc.") 1 Learning Objectives 2 1.1 Definitions Meaning of Quality and Quality Improvement 1.1.1 The Eight Dimensions of Quality 1. Performance 2. Reliability 3. Durability 4. Serviceability 5. Aesthetics 6. Features
1 Learning Objectives 2 1.1 Definitions Meaning of Quality and Quality Improvement 1.1.1 The Eight Dimensions of Quality 1. Performance 2. Reliability 3. Durability 4. Serviceability 5. Aesthetics 6. Features
Resolving Common Issues with Performance Indices
 http://www.isixsigma.com/library/content/c090119a.asp Resolving Common Issues with Performance Indices By Forrest W. Breyfogle III Measurements affect behavior. Wrong behavior results when metrics are
STATISTICAL QUALITY CONTROL. Majid Rafiee Department of Industrial Engineering Sharif University of Technology
 STATISTICAL QUALITY CONTROL Majid Rafiee Department of Industrial Engineering Sharif University of Technology rafiee@sharif.ir Quality Improvement in Modern Business Environment Copyright Notice Parts
Continuous Improvement Toolkit
 Continuous Improvement Toolkit Sampling Sample Population Managing Risk PDPC Pros and Cons Importance-Urgency Mapping RACI Matrix Stakeholder Analysis FMEA RAID Logs Break-even Analysis Cost Benefit Analysis
Process Analysis. Process Analysis. Process Analysis. Process Analysis. A Systematic Approach to. Define Scope. Identify Opportunities.
 Chapter 4 A process is how a company makes a product or service. Design considerations are: Process Structure Customer Involvement Vertical Integration Resource Flexibility Capital Intensity A Systematic
Continuous Improvement Toolkit. Value Analysis
 Continuous Improvement Toolkit Value Analysis VA NVA The Continuous Improvement Map Managing Risk FMEA Understanding Performance** Check Sheets Data Collection PDPC RAID Log* Risk Analysis* Benchmarking***
ROOT CAUSE ANALYSIS AND THE AUDIT LIFE CYCLE
 1 ROOT CAUSE ANALYSIS AND THE AUDIT LIFE CYCLE DEREK BUTLER SENIOR MANAGER GRANT THORNTON LLP +1 443.414.3257 DEREK.BUTLER@US.GT.COM AHIA 35th Annual Conference September 11-14, 2016 www.ahia.org Agenda
Quality Control Charts
 Quality Control Charts General Purpose In all production processes, we need to monitor the extent to which our products meet specifications. In the most general terms, there are two "enemies" of product
Quality: Getting the Basics Right. Trevor Naidoo
 Quality: Getting the Basics Right Lecture outline What is quality? Evolution of quality management Focus of quality management customers Role of employees in quality improvement Quality in service companies
Understanding Operations
 Understanding Operations Operations in an Organization Section 1, Sub-section 1.2 Operations Management Definition An operations system is defined as one in which: several activities are performed to transform
Business Systems - Operations Management
 Business Systems - Operations Management Session 2 Planning & Control, Operations Improvement Facilitator: Dr. Jonathan Farrell 1 This Evening s s Program Little s s Law Some more examples The Nature of
SPECIAL CONTROL CHARTS
 INDUSTIAL ENGINEEING APPLICATIONS AND PACTICES: USES ENCYCLOPEDIA SPECIAL CONTOL CHATS A. Sermet Anagun, PhD STATEMENT OF THE POBLEM Statistical Process Control (SPC) is a powerful collection of problem-solving
Engaging All Employees to Eliminate the Eight Wastes
 Engaging All Employees to Eliminate the Eight Wastes Abstract Charles Aubrey Vice President, Anderson Pharmaceutical Packaging, USA Kaizen means continuous improvement in Japanese. It has become closely
BBA Sixth Semester Total Quality Management
 Chapter - II BBA Sixth Semester Total Quality Management -BIJAY LAL PRADHAN M Sc Statistics, FDPM(IIMA) PhD Scholar (TQM) Syllabus Introduction to Quality and Quality management Conceptual Frameworks for
We are IntechOpen, the world s leading publisher of Open Access books Built by scientists, for scientists. International authors and editors
 We are IntechOpen, the world s leading publisher of Open Access books Built by scientists, for scientists 3,500 108,000 1.7 M Open access books available International authors and editors Downloads Our
We are IntechOpen, the world s leading publisher of Open Access books Built by scientists, for scientists. International authors and editors
 We are IntechOpen, the world s leading publisher of Open Access books Built by scientists, for scientists 3,900 116,000 120M Open access books available International authors and editors Downloads Our
BBA Sixth Semester Total Quality Management. -BIJAY LAL PRADHAN M Sc Statistics, FDPM(IIMA) PhD Scholar (TQM)
 PhD Scholar (TQM)") BBA Sixth Semester Total Quality Management -BIJAY LAL PRADHAN M Sc Statistics, FDPM(IIMA) PhD Scholar (TQM) Total Quality Management Course Title : Total Quality Management Code No. : MGT 163 Area of
BBA Sixth Semester Total Quality Management -BIJAY LAL PRADHAN M Sc Statistics, FDPM(IIMA) PhD Scholar (TQM) Total Quality Management Course Title : Total Quality Management Code No. : MGT 163 Area of
Service Quality. Competing through Service Quality
 Service Quality Competing through Service Quality Example of Service Industries Health Care Hospital, medical practice, dentistry, eye care Professional Services Accounting, Legal, Architectural, IT Financial
3C05: Software Quality. Unit 8: Software Quality. What is Quality?
 3C05: Software Unit 8: Software Objective To introduce software quality management and assurance with particular reference to the requirements of ISO 9000 and associated standards. To introduce QFD, a
Step 5: ISO9001:2015 -Risk Based Planning Risk Controls
 Step 5: ISO9001:2015 -Risk Based Planning Risk Controls Ridgeway Services Specialists Ltd Copyright 2014 In this fifth workshop module we will look at risks controls. By the end of this module you will
Six Sigma Black Belt Week 3. Six Sigma Black Belt Week 3. Six Sigma Black Belt Week 3. Project Management. Chapter 3-4
 Chapter 3-4 Project Management 3-4-1 Project Management Six Sigma involves a process of improvement projects. In order for these to be successful they must be managed. 3-4-2 Administrative Support Steering
Customer Satisfaction & Quality (CS&Q)
") Customer Satisfaction & Quality (CS&Q) Course #5 Jérôme Firmin 2015 Tools / methods - for non Quality Solving & Continuous Improvement 5 Whys 5 S Fishbone diagram PDCA Deming wheel Failure Mode and Effects
Customer Satisfaction & Quality (CS&Q) Course #5 Jérôme Firmin 2015 Tools / methods - for non Quality Solving & Continuous Improvement 5 Whys 5 S Fishbone diagram PDCA Deming wheel Failure Mode and Effects
Developing Control Charts in a Manufacturing Industry and Improvement of Quality Using PDCA Cycle
 International Conference on Mechanical, Industrial and Materials Engineering 07 (ICMIME07) 8-0 December, 07, RUET, Rajshahi, Bangladesh. Paper ID: IE-64 Developing Control Charts in a Manufacturing Industry
MAKING SENSE OF DATA
 MAKING SENSE OF DATA Donald J. Wheeler SPC Press Knoxville, Tennessee Contents About the Author Introduction ix xi Chapter One Why Continual Improvement? 1 1.1 What is Quality? 3 1.2 The Three Questions