REGIONAL SOLICITATION ROADWAY APPLICATIONS: POTENTIAL CHANGES. TAB September 20, 2017
|
|
|
- Gwendoline Bell
- 6 years ago
- Views:
Transcription

1 REGIONAL SOLICITATION ROADWAY APPLICATIONS: POTENTIAL CHANGES TAB September 20, 2017

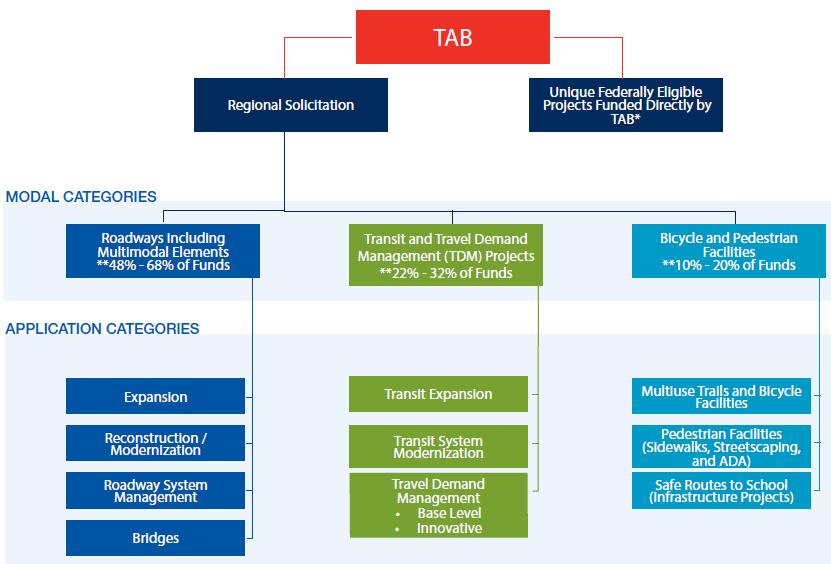
2 Application Categories

3 Bridge Incorporate Highway Truck Corridor Study Tiers instead of Freight Project Elements and Current Daily Heavy Commercial Traffic measures (Page BR 4) 3
4 Roadway System Management Changes recommended by Work Group 5A. Congestion Reduction: Shift from Synchro analysis to Streetlight speed data (Page RSM 12) Measures existing congestion in the project area through travel speeds 4
5 Roadway System Management Changes recommended by RSM Work Group Regional Signal Retiming Program 40:1 B/C Economies of Scale Consistency with TPP and FHWA feedback on needed changes to federally-required Congestion Management Process (CMP) 5
 PAs focus on PA Intersection Conversion Study priorities Points for both at-grade and grade-separated projects at")
6 Roadway Expansion 1A: A-Minors focus on systemwide congestion relief using Streetlight for travel speeds. (Page RE 3) PAs focus on PA Intersection Conversion Study priorities Points for both at-grade and grade-separated projects at these 90+ intersections 6
7 Questions Steve Peterson, Manager of Highway Planning and TAB/TAC Process Joe Barbeau, Senior Planner Elaine Koutsoukos, TAB Coordinator
8 Roadway Expansion Prioritizing Criteria and Measures September 20, 2017 Definition: A roadway project that adds thru lane capacity. Projects must be located on a non freeway principal arterial or A minor arterial functionally classified roadway, consistent with the latest TAB approved functional classification map. However, A minor connectors cannot be expanded with new thru lane capacity with these federal funds per regional policy and must apply in the Reconstruction/Modernization and Spot Mobility application category. Examples of Roadway Expansion Projects: New roadways Two lane to four lane expansions Two lane to three lane expansions Four lane to six lane expansions New interchanges with or without associated frontage roads Expanded interchanges with either new ramp movements or added thru lanes New bridges, overpasses and underpasses Scoring: Criteria and Measures Points % of Total Points 1. Role in the Regional Transportation System and Economy % Measure A Average distance to nearestsystem Congestion and Principal 80 Arterial Intersection Conversion Study Priorities parallel roadways Measure B Connection to Total Jobs, and Manufacturing/Distribution 3050 Jobs, and Students Measure C Current daily heavy commercial trafficregional Truck Corridor 5080 Study Tiers Measure D Freight project elements Usage % Measure A Current daily person throughput 110 Measure B Forecast 2040 average daily traffic volume Equity and Housing Performance 100 9% Measure A Connection to disadvantaged populations and project s benefits, impacts, and mitigation 30 Measure B Housing Performance Score Infrastructure Age % Measure A Date of construction Congestion Reduction/Air Quality % Measure A Vehicle delay reduced 100 Measure B Kg of emissions reduced Safety % Measure A Crashes reduced Multimodal Elements and Existing Connections 100 9% Measure A Transit, bicycle, or pedestrian project elements & connections Risk Assessment 75 7% Measure A Risk Assessment Form Cost Effectiveness 100 9% Measure A Cost effectiveness (total project cost/total points awarded/total project cost) 100 Roadway Expansion: 1
9 Roadway Expansion Total 1,100 Roadway Expansion: 2
10 Roadway Expansion 1. Role in the Regional Transportation System and Economy ( Points) Tying regional policy (Thrive MSP2040) to the Regional Solicitation, this criterion measures the project s ability to serve a transportation purpose within the regional transportation system and economy based on how well it fulfills its functional classification role, reduces systemwide congestion, aligns with the Principal Arterial Intersection Conversion Study, ;serves heavy commercial traffic, and connects to employment, manufacturing/distribution related employment, and students, and aligns with i.e., the Regional Truck Corridor Study). A. MEASURE: Address how the project route fulfills its role in the regional transportation system as identified by its current functional classification. Respond as appropriate to one type of functional classification. For A minor arterial projects only: The measure will analyze the level of congestion on the parallel A minor arterial or principal arterial to determine the importance of the Relieverroadway in reducing congestion on the entire Regional Highway System. Council staff will use Streetlight travel speed data on an applicant selected parallel route to the proposed project. The analysis will compare the peak hour travel speed on a parallel route to free flow conditions on this same route to see whether the proposed project could relieve congestion on the parallel route too. The applicant must identify the parallel corridor as part of the response. RESPONSE (Calculation): Parallel Corridor: Parallel Corridor Start and End Points: Free Flow Travel Speed (Council Staff): Peak Hour Travel Speed (Council Staff): Percentage Decrease in Travel Speed in Peak Hour Compared to Free Flow (Council Staff): For principal arterial projects only: Analysis of congestion via Streetlight travel speed data will also be provided for principal arterial projects. However, the measure also The measure relies on the results on the Principal Arterial Intersection Conversion Study, which prioritized non freeway principal arterial intersections. In addition to interchange projects, other lane expansion projects that make improvements to a low, medium, or high priority intersection can also earn points in this measure. Use the final study report for this measure: metrocouncil.org/paics RESPONSE (Select one for your project, based on the Principal Arterial Intersection Conversion Study): Parallel Corridor: Parallel Corridor Start and End Points: Free Flow Travel Speed (Council Staff): Peak Hour Travel Speed (Council Staff): Roadway Expansion: 3
11 Roadway Expansion Percentage Decrease in Travel Speed in Peak Hour Compared to Free Flow (Council Staff): Proposed interchange or at grade project that reduces delay at a High Priority Intersection: (80 Points) Proposed at grade project that reduces delay at a Medium Priority Intersection: (60 Points) Proposed at grade project that reduces delay at a Low Priority Intersection: (50 Points) Proposed interchange that reduces delay at a Medium Priority Intersection: (40 Points) Proposed interchange project that reduces delay at a Low Priority Intersection: (0 Points) Not listed as a priority in the study: (0 Points) SCORING GUIDANCE (80 Points) Expanders, Augmentors, and Non Freeway Principal Arterials: The applicant with the furthest average distance from the closest parallel Due to the two scoring methods, more than one project can score the maximum points.a Minor Arterials or Principal Arterials on both sides will receive the full points. The furthest average distance will be considered separately for Expanders, Augmentors, and Non Freeway Principal Arterials. In order to be awarded points for this measure the proposed project itself must show some delay reduction in measure 5A. If the project does not reduce delay, then it cannot reduce systemwide congestion and will score 0 points for this measure. Relievers: A minor arterials: The applicant with the with the most congestion on a parallel route (measured by the largest percentage decrease in peak hour travel speeds relative to free flow conditions)highest number of hours per day in which current capacity exceeds the design capacity on the Principal Arterial will receive the full points. Remaining Reliever projects will receive a proportionate share of the full points. For example, if the application being scored showed a 5% decrease of travel speeds in the peak hour on the parallel route relative to free flow conditions and the top project had a 10% reduction, this applicant would receive (5/10)*80 points, or 40 points. In order to be awarded points as an A minor arterial the proposed project must show some delay reduction in measure 5A. If the project does not reduce delay, then it cannot reduce systemwide congestion and will score 0 points for this measure. The scorer will have discretion in determining whether the applicant selected the correct parallel A minor arterial or principal arterial (and location on that segment). Principal arterials: Projects will be scored based on their Principal Arterial Intersection Conversion Study priorities and project type along with their congestion score measured vs. the A minor arterials. Each principal arterial application will be awarded the higher score generated by these two methods. However, all interchange projects must only use the scoring output from the Principal Arterial Intersection Conversion Study. Four projects (one each for Augmentor, Expander, Reliever, and Non Freeway Principal Arterial) may receive the full points. Remaining projects will receive a proportionate share of the full points (awarded to the top score in the appropriate functional classification). For example, if the Expander being scored had a distance of 8 miles and the top Expander project had an average distance of 10 miles, this applicant would receive (8/10)*80 points or 64 points. Metropolitan Council staff will provide average Roadway Expansion: 4
12 Roadway Expansion distance data for all Augmentor, Expander, and Non Freeway Principal Arterial projects to ensure consistency of methodology between applications. B. MEASURE: Reference the Regional Economy map generated at the beginning of the application process. Report the existing employment, manufacturing/distribution related employment, and post secondary students enrolled within one mile, as depicted on the Regional Economy map. Upload the Regional Economy map used for this measure. RESPONSE (Data from the Regional Economy map): Existing Employment within 1 Mile: (Maximum of points) Existing Manufacturing/Distribution Related Employment within 1 Mile: (Maximum of points) Existing Post Secondary Students: (Maximum of points) SCORING GUIDANCE (350 Points) All Census block groups that are included within or intersect the buffer area around the project will be included. The applicant with the highest existing total employment will receive the full points. Remaining projects will receive a proportionate share of the full points. For example, if the application being scored had 1,000 workers within one mile and the top project had 1,500 workers, this applicant would receive (1,000/1,500)*30 50 points or points. The applicant with the highest existing manufacturing/distribution related employment will receive the full points. Remaining projects will receive a proportionate share of the full points equal to the existing manufacturing/distribution related employment within one mile of the project being scored divided by the project with the highest manufacturing/distribution related employment within one mile multiplied by the maximum points available for the measure. For example, if the application being scored had 1,000 manufacturing/distribution related workers within one mile and the top project had 1,500 manufacturing/distribution related workers, this applicant would receive (1,000/1,500)*30 50 points or points. The applicant with the highest number of post secondary students will receive 18 points. Remaining projects will receive a proportionate share of the 18 points. For example, if the application being scored had 1,000 students within one mile and the top project had 1,500 students, this applicant would receive (1,000/1,500)*18 30 points or points. The scorer will assess if the applicant would score highest with the total employment part of the measure, the manufacturing/distribution employment part of the measure, or the education part of the measure and give the applicant the highest of the three scores out of a maximum of points. Note: Due to the use of multiple sub measures, two applicants will receive the full points. C. MEASURE: This criterion relies on the results on the Truck Highway Corridor Study, which prioritized all principal and minor arterials based on truck volume, truck percentage of total Roadway Expansion: 5
13 Roadway Expansion traffic, proximity to freight industry clusters, and proximity to regional freight terminals. (80 points) Use the final study report for this measure: 2/Transit Plans, Studies Reports/Highways Roads/Truck Freight Corridor Study.aspx RESPONSE Select one for your project, based on the Regional Truck Corridor Study): Along Tier 1: (80 Points) Along Tier 2: (60 Points) Along Tier 3: (40 Points) The project provides a direct and immediate connection (i.e., intersects) with either a Tier 1, Tier 2, or Tier 3 corridor: (10 Points) None of the tiers: (0 Points) C. Provide the current daily heavy commercial traffic at one location along the A Minor Arterial or Non Freeway Principal Arterial s project length. It is required that an actual count is collected, or that available data from within the last three years is used (from the city, county or MnDOT). Heavy commercial traffic is defined as all trucks with at least two axles and six tires. For new roadways, using a traffic model, identify the estimated current daily heavy commercial traffic volume. RESPONSE: Location: Current daily heavy commercial traffic volume: Date heavy commercial count taken: SCORING GUIDANCE (50 Points) The applicant with the highest daily heavy commercial traffic at a location along the project length will receive the full points. Remaining projects will receive a proportionate share of the full points. For example, if the application being scored had a heavy commercial volume of 750 vehicles and the top project had a heavy commercial volume of 1,000 vehicles, this applicant would receive (750/1,000)*50 points, or 38 points. D. MEASURE: Discuss any freight elements that are included as part of the project and how they improve efficiency, security, or safety. (15 points) Address how the proposed project safely integrates freight. Freight elements could be project elements such as upgrading a non ten ton roadway to a ten ton roadway, adding paved shoulders, wider shoulders, acceleration lanes, or longer turning lanes added specifically to accommodate freight movements. RESPONSE (Limit 1,400 characters; approximately 200 words): SCORING GUIDANCE (15 Points) The project with the most comprehensive freight elements included as part of the project will receive the full points. Remaining projects will receive a share of the full points at the scorer s discretion. Roadway Expansion: 6
14 Roadway Expansion Roadway Expansion: 7
15 Roadway Expansion 2. Usage (175 Points) This criterion quantifies the project s potential impact by measuring the current daily person throughput and future vehicular traffic that will be served by the project. These roadway users directly benefit from the project improvements on the A minor arterial or non freeway principal arterial. A. MEASURE: The applicant must identify the location along the project length and provide the current AADT volume from the MnDOT 50 series maps and existing transit routes that travel on the road (reference Transit Connections Map). Ridership data will be provided by the Metropolitan Council staff, if public transit is currently provided on the project length. Metropolitan Council staff will calculate the current daily person throughput at one location along the A minor arterial or non freeway principal arterial project length using the current average annual daily traffic (AADT) volume and average annual ridership. Current Daily Person Throughput = (current average annual daily traffic volume x 1.30 vehicle occupancy) + average annual daily transit ridership ( ) For new roadways, identify the estimated existing daily traffic volume based on traffic modeling. RESPONSE: Location: Current AADT volume: Existing Transit Routes on the Project: Transit routes that will likely be diverted to a the new proposed roadway (if applicable): SCORING GUIDANCE (110 Points) The applicant with highest current daily person throughput will receive the full points for the measure. Remaining projects will receive a proportionate share of the full points. For example, if the application being scored had a daily person throughput of 1,000 vehicles and the top project within the same functional classification had a daily person throughput of 1,500 vehicles, this applicant would receive (1,000/1,500)*110 points or 73 points. B. MEASURE: Provide the forecast (2040) average daily traffic volume at the same location along the A minor arterial or non freeway principal arterial project length, as identified in the previous measure. The applicant may choose to use a county or city travel demand model based on the Metropolitan Council model to identify the forecast (2040) average daily traffic volume or have Metropolitan Council staff determine the forecast volume using the Metropolitan Council model and project location. Respond as appropriate to the use of one type of forecast model. (65 Points) For new roadways, identify the modeled forecast daily traffic volume if this information is available. If not available, then identify the forecast volumes that will be relocated from any parallel roadway(s) to the new roadway. Roadway Expansion: 8
16 Roadway Expansion RESPONSE: Use Metropolitan Council model to determine forecast (2040) ADT volume If checked, METC Staff will provide Forecast (2040) ADT volume OR RESPONSE: Identify the approved county or city travel demand model to determine forecast (2040) ADT volume: Forecast (2040) ADT volume : SCORING GUIDANCE (65 Points) The applicant with the highest forecast (2040) ADT volume will receive the full points for the measure. Remaining projects will receive a proportionate share of the full points. For example, if the application being scored had a daily forecast of 28,000 vehicles and the top project had a daily forecast of 32,000 vehicles, this applicant would receive (28,000/32,000)*65 points or 57 points. Roadway Expansion: 9
17 Roadway Expansion 3. Equity and Housing Performance (100 Points) This criterion addresses the project s positive and negative impacts to low income populations, people of color, children, people with disabilities, and the elderly. The criterion also evaluates a community s efforts to promote affordable housing. A. MEASURE: Reference the Socio Economic Conditions map generated at the beginning of the application process. Identify the project s location as it applies in the listed responses below. Describe the project s positive benefits, and negative impacts, and mitigation for lowincome populations; people of color; children, people with disabilities, and the elderly. Geographic proximity alone is not sufficient to receive the full points listed below. In order to receive the maximum points, the response should address the benefits, impacts, and mitigation for the populations listed. Upload the Socio Economic Conditions map used for this measure. RESPONSE (Select one, based on the Socio Economic Conditions map): Project located in Area of Concentrated Poverty with 50% or more of residents are people of color (ACP50): (up to 100% of maximum score) Project located in Area of Concentrated Poverty: ( up to 80% of maximum score) Project s census tracts are above the regional average for population in poverty or population of color: (up to 60% of maximum score) Project located in a census tract that is below the regional average for population in poverty or populations of color, or includes children, people with disabilities, or the elderly: (up to 40% of maximum score) RESPONSE (Limit 2,800 characters; approximately 400 words): SCORING GUIDANCE (30 Points) Based on the Socio Economic Conditions map s output, the applicant will select the appropriate option from the above bullets. However, geographic proximity alone is not sufficient to receive full points. The applicant must fully describe the positive benefits and negative impacts (with mitigation to address the issue) for those identified groups. Each project will first be graded on a 10 point scale, not accounting for geography. Each score from the 10 point scale will then be adjusted to the appropriate geography. The project with the most positive benefits and appropriate mitigation for negative impacts will receive the full points relative to its maximum geographic sub area defined above. Remaining projects will receive a share of the full points at the scorer s discretion. This response is intended to be qualitative. Metropolitan Council staff will score this measure. Note: Due to the geographic adjustment to scores, it is possible that the above process will result in no project receiving the maximum allotment of 30 points. In this case, the highest scoring application for this measure will be adjusted to receive the full 30 points. Remaining projects will receive a proportionate share of the full points. For example, if the application being scored had 10 points and the top project had 20 points, this applicant would receive (10/20)*30 points or 15 points. B. MEASURE: Metropolitan Council staff will award points to the project based on the Housing Performance Score for the city or township in which the project is located. The score Roadway Expansion: 10
18 Roadway Expansion includes consideration of affordability and diversification, local initiatives to facilitate affordable workforce housing development or preservation, and density of residential development. If the project is in more than one jurisdiction, the points will be awarded based on a weighted average using the length of the project in each jurisdiction. For stand alone intersection, bridge, underpass, and interchange projects, a one mile radiusbuffer will be drawn around the project. If the radius buffer enters more than one jurisdiction, the points will be awarded based on the proportionate population of the Census blocks in each jurisdiction that are all or partially located in the area within the one mile radius buffer. If a project is located in a city or township with no allocation of affordable housing need (either there is no forecasted household growth or the area does not have land to support sewered development), then the project will not be disadvantaged by this measure and the project s total score will be adjusted as a result. RESPONSE (Affordable Housing Score completed by Metropolitan Council staff): City/Township: Length of Segment (Population from Regional Economy Map for stand alone projects) within City/Township: SCORING GUIDANCE (70 Points) The applicant with the highest Housing Performance Score will receive the full points. Remaining projects will receive a proportionate share of the full points. For example, if the application being scored had a Housing Performance Score of 55 and the top project had a Housing Performance Score of 90, this applicant would receive (55/90)*70 points or 43 points. Note: Metropolitan Council staff will score this measure. Projects will use the city Housing Performance Score based on the project location. If a project is located in more than one jurisdiction, the points will be awarded based on a weighted average of the city or township scores for the project location based on the length of the project in each jurisdiction. For stand alone roadway (intersection, bridge, underpass, and interchange) projects, a one mile radiusbuffer will be drawn around the project. If the radius buffer enters more than one jurisdiction, the points will be awarded based on the proportionate population of the Census blocks in each jurisdiction that are all or partially located in the area within the one mile radius buffer. If a project is located in a city or township with no allocation of affordable housing need (either there is no forecasted household growth or the area does not have land to support sewered development), then the project will not be disadvantaged by this measure and the project s total score will be adjusted as a result. If this is the case, then the total points possible in the application will be 930 instead of 1,000. The total points awarded through the rest of the application (900 as a hypothetical example) will be divided by 930, then multiplied by 1,000. Therefore, a project scoring 900 out of 930, will equate to 968 points on a 1,000 point scale. If a portion of the project is located in a city with an affordable housing allocation and the other portion is located in a township with no affordable housing allocation, then a combination of the weighted Roadway Expansion: 11
19 Roadway Expansion average and no affordable housing methodologies should be used. This will result in a total score that will be somewhere between 930 and 1,000; then the score will need to be adjusted to fit a 1,000 point scale. Roadway Expansion: 12
20 Roadway Expansion 4. Infrastructure Age (75 40 Points) This criterion will assess the age of the roadway facility being improved. Roadway improvement investments should focus on the higher needs of an aging facility, whereas improvements to a recently reconstructed roadway does not display an efficient use of funds. A. MEASURE: Identify the year of the roadway s original construction or most recent reconstruction. If the reconstruction date is used for the roadway, a full reconstruction must have been completed during the indicated year. Routine maintenance, such as an overlay or sealcoating project does not constitute a reconstruction and should not be used to determine the infrastructure age. For new roadways, identify the average age of the parallel roadways from which traffic will be diverted to the new roadway. RESPONSE: Year of original roadway construction or most recent reconstruction: Segment length: SCORING GUIDANCE (75 40 Points) The applicant with the oldest roadway will receive full points. Remaining projects will receive a proportionate share of the full points. For example, if the application being scored was constructed 41 years ago and the oldest project was constructed 48 years ago, this applicant would receive (41/48)*75 40 points or points. Note: Because of the reporting of year of construction, it is possible for multiple projects to receive the full allotment of points. Roadway Expansion: 13
21 Roadway Expansion 5. Congestion Reduction/Air Quality (150 Points) This criterion measures the project s ability to reduce intersection delay and emissions during peak hour conditions. In addition, it will address its ability to improve congested intersections operating at unacceptable levels of service during peak hour conditions. A. MEASURE: Conduct a capacity analysis at one or more of the intersections (or rail crossings) being improved by the roadway project using existing turning movement counts (collected within the last three years) in the weekday a.m. or p.m. peak hour and Synchro or HCM software. The analysis must include build and no build conditions (with and without the project improvements). The applicant must show the current total peak hour delay at one or more intersections (or rail crossings) and the reduction in total peak hour intersection delay at these intersections (or rail crossings) in seconds, due to the project. If more than one intersection is examined, then the delay reduced by each intersection (or rail crossing) can be can added together to determine the total delay reduced by the project. If expanding thru lanes or building a new interchange on an existing signalized corridor, signal retiming must be completed in the five year time period before the project was submitted for funding (i.e., completed a signal retiming between 2013 and 2018), consistent with regional policy in the 2040 Transportation Policy Plan. For new roadways, identify the key intersection(s) on any parallel roadway(s) that will experience reduced delay as a result of traffic diverting to the new roadway. If more than one intersection is examined, then the delay reduced by each intersection can be can added together. For roadway projects that include a railroad crossing, the applicant should conduct fieldwork during either the a.m. or p.m. peak hour to determine the total peak hour delay reduced by the project. Applicants can also add together intersection delay reduced and railroad delay reduced, if they both will be improved by the project. The applicant should include the appropriate Synchro or HCM full reports (including the Timing Page Report) that support the improvement in total peak hour delay and should conduct the analysis using the following: Under the network settings, all defaults should be used for lanes, volumes, phases and simulation Use Synchro s automatic optimization to determine cycle, offset and splits (for traffic signals) Project improvements assumed in the build condition should be reflected in the total project cost, such as additional through or turn lanes and protective left turn phasing Roadway lengths for intersection approaches must be the same length for before and after scenarios An average weekday should be used for the existing conditions instead of a weekend, peak holiday, or special event time period that is not representative of the corridor for most of the year Total Peak Hour Delay Reduced (Seconds) = Total Peak Hour Delay Per Vehicle x Vehicles Per Hour Roadway Expansion: 14
22 Roadway Expansion RESPONSE (Calculation): Total Peak Hour Delay/Vehicle without the Project (Seconds/Vehicle): Total Peak Hour Delay/Vehicle with the Project (Seconds/Vehicle): Total Peak Hour Delay/Vehicle Reduced by the Project (Seconds/Vehicle): Volume (Vehicles Per Hour): Total Peak Hour Delay Reduced by the Project (Seconds): EXPLANATION of methodology used to calculate railroad crossing delay, if applicable, or date of last signal retiming for signalized corridors (Limit 1,400 characters; approximately 200 words): SCORING GUIDANCE (100 Points) The applicant with the most peak hour vehicle delay reduced by the project improvement will receive the full points for the measure. Remaining projects will receive a proportionate share of the points. For example, if the application being scored reduced delay by 5,000 seconds and the top project reduced delay by 25,000 seconds, this applicant would receive (5,000/25,000)*100 points, or 20 points. If expanding thru lanes or building a new interchange on an existing signalized corridor, signal retiming must be completed in the five year time period before the project was submitted for funding (i.e., completed a signal retiming between 2013 and 2018), consistent with regional policy in the 2040 Transportation Policy Plan. If the date of the signal retiming is more than five years past, then the project will be disqualified as part of the qualifications review of the projects. Applicants will provide that date as part of the explanation for this measure. B. MEASURE: Using the Synchro or HCM analysis completed in the previous measure, identify the total peak hour emissions reduction in kilograms (CO, NO X, VOC) due to the project. The applicant should include the appropriate Synchro or HCM reports (including the Timing Page Report) that support the improvement in total peak hour emissions. If more than one intersection is examined, then the emissions reduced by each intersection can be can added together to determine the total emissions reduced by the project. Roadway projects that do not include new roadway segments or railroad grade separation elements: Total Peak Hour Emissions Reduced (Kilograms)= Total Peak Hour Emissions without the project Total Peak Hour Emissions with the ProjectReduced Per Vehicle x Vehicles Per Hour RESPONSE (Calculation): Total (CO, NO X, and VOC) Peak Hour Emissions/Vehicle without the Project (Kilograms): Total (CO, NO X, and VOC) Peak Hour Emissions/Vehicle with the Project (Kilograms): Total (CO, NO X, and VOC) Peak Hour Emissions Reduced/Vehicle by the Project (Kilograms): Volume (Vehicles Per Hour): Total (CO, NO X, and VOC) Peak Hour Emissions Reduced by the Project (Kilograms): Roadway Expansion: 15
23 Roadway Expansion If more than one intersection is examined, the response in should include a total of all emissions reduced. Roadway projects that are constructing new roadway segments, but do not include railroad grade separation elements: For new roadways, identify the key intersection(s) on any parallel roadway(s) that will experience reduced emissions as a result of traffic diverting to the new roadway (using Synchro). If more than one intersection is examined, then the emissions reduced by each intersection can be can added together. However, new roadways will also generate new emissions compared to existing conditions as traffic diverts from the parallel roadways. The applicant needs to estimate four variables to determine the new emissions generated once the project is completed on any major intersections. Those variables include: speed, vehicle mile traveled, delay, and total vehicle stops. The applicant needs to detail any assumptions used for conditions after the project is built. The variables will be used in the exact same equation used Synchro required of the other project types. The equation below should only be used to estimate the new emissions generated by new roadways. Parallel Roadways Enter data for Parallel Roadways. Total Peak Hour Emissions Reduced (Kilograms) = Total Peak Hour Emissions Reduced Per Vehicle x Vehicles Per Hourwithout the project Total Peak Hour Emissions with the Project RESPONSE (Data Input and Calculation): Total (CO, NO X, and VOC) Peak Hour Emissions Per Vehicle without the Project (Kilograms): (Applicant inputs number) Total (CO, NO X, and VOC) Peak Hour Emissions Per Vehicle with the Project (Kilograms): (Applicant inputs number) Total (CO, NO X, and VOC) Peak Hour Emissions Reduced Per Vehicle by the Project (Kilograms): (Online Calculation) Volume (Vehicles Per Hour): (Applicant inputs number) Total (CO, NO X, and VOC) Peak Hour Emissions Reduced by the Project (Kilograms): (Online Calculation) If more than one intersection is examined, the response is a total of all emissions reduced. Emissions Reduced on Parallel Roadways (Online Calculation) Roadway Expansion: 16
24 Roadway Expansion New Roadway Portion Cruise speed in miles per hour with the project: (Applicant inputs number) Vehicle miles traveled with the project: (Applicant inputs number) Total delay in hours with the project: (Applicant inputs number) Total stops in vehicles per hour with the project: (Applicant inputs number) Fuel consumption in gallons: Total (CO, NOX, and VOC) Peak Hour Emissions Reduced or Produced on New Roadway (Kilograms): EXPLANATION of methodology and assumptions used:(limit 1,400 characters; approximately 200 words) Total (CO, NOX, and VOC) Peak Hour Emissions Reduced by the Project (Kilograms): Speed = cruise speed in miles per hour Total Travel = vehicle miles traveled Total Delay = total delay in hours Stops = total stops in vehicles per hour K4 = * Speed * Speed 2 K2 = K5 = * Speed 2 F2 = Fuel consumption in gallons CO = F2 * kg/gallon NO X = F2 * kg/gallon VOC = F2 * kg/gallon Total = Total Peak Hour Emissions reduced on Parallel Roadways (CO + NOx + VOC) Roadway projects that include railroad grade separation elements: For roadway projects that include a railroad crossing, the applicant needs to input four variables before and after the project to determine the change in emissions. Those variables include: speed, vehicle mile traveled, delay, and total vehicle stops. The applicant needs to conduct fieldwork during either the a.m. or p.m. peak hour to determine the existing conditions and then detail any assumptions used for conditions after the project is built. The variables will be used in the exact same equation used within the software program (i.e., Synchro) required of the other project types. Therefore, the approach to calculate the kilograms emissions reduced for railroad grade separation projects will be comparable to intersection improvement projects. RESPONSE (Calculation): Cruise speed in miles per hour without the project: (Applicant inputs number) Vehicle miles traveled without the project: (Applicant inputs number) Roadway Expansion: 17
25 Roadway Expansion Total delay in hours without the project: (Applicant inputs number) Total stops in vehicles per hour without the project: (Applicant inputs number) Cruise speed in miles per hour with the project: (Applicant inputs number) Vehicle miles traveled with the project: (Applicant inputs number) Total delay in hours with the project: (Applicant inputs number) Total stops in vehicles per hour with the project: (Applicant inputs number) Fuel consumption in gallons (F1) Fuel consumption in gallons (F2) Fuel consumption in gallons (F3) Total (CO, NOX, and VOC) Peak Hour Emissions Reduced by the Project (Kilograms): EXPLANATION of methodology and assumptions used:(limit 1,400 characters; approximately 200 words) Speed = cruise speed in miles per hour Total Travel = vehicle miles traveled Total Delay = total delay in hours Stops = total stops in vehicles per hour K1 = * Speed * Speed 2 K2 = K3 = * Speed 2 F1 (or F2 without the project) = Fuel consumption in gallons F1 = Total Travel * k1 + Total Delay * k2 + Stops * k3 F2 = Total Travel * k1 + Total Delay * k2 + Stops * k3 F3 = F1 F2 CO = F3 * kg/gallon NO X = F3 * kg/gallon VOC = F3 * kg/gallon Equation Automatically Provides Emissions Reduced: Total (CO, NO X, and VOC) Peak Hour Emissions Reduced by the Project (Kilograms): (Online Calculation) EXPLANATION of methodology and assumptions used (Limit 1,400 characters; approximately 200 words): SCORING GUIDANCE (50 Points) The applicant with the most kilograms reduced by the project improvement will receive the full points for the measure. Remaining projects will receive a proportionate share of the full. For example, if the Roadway Expansion: 18
26 Roadway Expansion application being scored reduced emissions by 3 kilograms and the top project reduced emissions by 5 kilograms, this applicant would receive (3/5)*50 points or 30 points. Roadway Expansion: 19
27 Roadway Expansion 6. Safety (150 Points) This criterion addresses the project s ability to correct deficiencies and improve the overall safety of an existing or future roadway facility. It will assess the project s monetized safety benefits. A. MEASURE: Respond as appropriate to one of the two project types below. Calculate the reduction in the total number of crashes due to improvements on the A minor arterial or non freeway principal arterial made by the project. The applicant must base the estimate of crash reduction on the methodology consistent with the latest Highway Safety Improvement Program (HSIP) application. Applicants should focus on the crash analysis for reactive projects. starting on page 7 through page 11, in addition to Appendix A, E, and F. Crash data must be obtained for the project length using the MnDOT TIS system average for calendar years through Crash data should include all crash types and severity, including pedestrian and bicycle crashes. Applicants should request crash data from MnDOT as early as possible. The applicant must then attach a listing of the crashes reduced and the HSIP Benefit/Cost (B/C) worksheet that identifies the resulting benefit associated with the project. As part of the response, please detail and attach the crash modification factor(s) used from FHWA s Crash Modification Factors Clearinghouse: This measure requests the monetized safety benefit of the project. The cost of the project is scored in the Cost Effectiveness criterion. New Roadways: 1. For new roadways, identify the parallel roadway(s) from which traffic will be diverted to the new roadway. 2. Using the crash data for , calculate the existing crash rate for the parallel roadway(s) identified in Step Identify the daily traffic volume that will be relocated from the parallel roadway(s) to the new roadway. 4. Calculate the number of crashes on the parallel roadway(s) using the existing crash rate from Step 2 and the relocated traffic volume to determine the change in number of crashes due to the relocated traffic volume. For instance, if 5,000 vehicles are expected to relocate from the existing parallel roadway to the new roadway, calculate the number of crashes related to the 5,000 vehicles. 5. Identify the average crash rate for the new roadway using MnDOT s average crash rates by roadway type. Using the average crash rate for the new roadway, calculate the number of crashes related to the relocated traffic (i.e., the 5,000 vehicles). 6. Calculate the crash reduction factor using the existing number of crashes on the existing parallel roadway (Step 4) compared to the estimated crashes calculated for the new roadway (Step 5), due to the relocated traffic volume (i.e., the 5,000 vehicles). Roadway Expansion: 20
28 Roadway Expansion 7. The calculated crash reduction factor should be used in the HSIP B/C worksheet. 8. Upload additional documentation materials into the Other Attachments Form in the online application. RESPONSE (Calculation): Crash Modification Factor Used (Limit 700 characters; approximately 100 words): Rationale for Crash Modifications Selected (Limit 1,400 characters; approximately 200 words): Project Benefit ($) from B/C ratio: Explanation of Methodology: Roadway projects that include railroad grade separation elements: Since the number of observed crashes at an existing at grade railroad crossing is minor compared to an intersection, this measure will assess crash risk exposure that exists in order to compare projects. As a proactive safety measure, railroad grade separation projects eliminate the crash risk exposure. Crash Risk Exposure Eliminated = current average annual daily traffic volume x average number of daily trains at the at grade crossing RESPONSE (Calculation): Current AADT volume: Average daily trains: Crash Risk Exposure eliminated: SCORING GUIDANCE (150 Points) This measure will be considered separately for projects that do and do not include a railroad gradeseparation project. As a result, two projects (one project without a railroad grade separation project and one with a railroad grade separation project) may receive the full points. For projects that do not include a grade separation project, the applicant with the highest dollar value of benefits will receive the full points for the measure. Remaining projects will receive a proportionate share of the full points. For example, if the application being scored had safety benefits of $11,000,000 and the top project had safety benefits of $16,000,000, this applicant would receive (11,000,000/16,000,000)*150 points or 103 points. For railroad grade separation projects, the applicant with the highest crash risk exposure eliminated due to the project will receive the full points for the measure. Remaining projects will receive a proportionate share of the full points. For example, if the application being scored reduced 11,000 exposures and the top project reduced 16,000 exposures this applicant would receive (11,000 /16,000)*150 points or 103 points. Roadway Expansion: 21
29 Roadway Expansion 7. Multimodal Elements and Existing Connections (100 Points) This criterion measures how the project improves the travel experience, safety, and security for other modes of transportation and addresses the safe integration of these modes. The Transportation Policy Plan requires that explicit consideration of all users of the transportation system be considered in the planning and scoping phase of roadway projects. A. MEASURE: Describe how the project positively affects the multimodal system. Discuss any bicycle, pedestrian, or transit elements that are included as part of the project and how they improve the travel experience, safety, and security for users of these modes. Applicants should make sure that new multimodal elements described in the response are accounted for as part of the cost estimate form earlier in the application. Applicants should note if there is no transit service in the project area and identify supporting studies or plans that address why a mode may not be incorporated in the project (e.g., a bicycle system plan that locates bikeway facilities on a lower volume parallel route). Describe to reference how the proposed multimodal improvements positively affect identified alignments in the Regional Bicycle Transportation Network (RBTN) or along a regional trail, if applicable. Also, describediscuss the existing bicycle, pedestrian, and transit connections and how the project enhances these connections. RESPONSE (Limit 2, 800 characters; approximately 400 words): SCORING GUIDANCE (100 Points) The project with thethat most positively affects the comprehensive multimodal elements included as part of the projectsystem will receive the full points. Remaining projects will receive a share of the full points at the scorer s discretion. The project score will be based on the quality of the improvements, as opposed to being based solely on the number of modes addressed. Points can be earned for incorporating multimodal project elements, positively affecting identified alignments in the Regional Bicycle Transportation Network (RBTN) or regional trail, or for making connections with existing multimodal systems. Scorers should make sure that new multimodal elements described in the response are accounted for on the cost estimate form earlier in the application. Roadway Expansion: 22
30 Roadway Expansion 8. Risk Assessment (75 Points) This criterion measures the number of risks associated with successfully building the project. High risk applications increase the likelihood that projects will withdraw at a later date. If this happens, the region is forced to reallocate the federal funds in a short amount of time or return them to the US Department of Transportation. and the steps already completed in the project development process. These steps risks are outlined in the checklist in the required Risk Assessment. A. MEASURE: Applications involving construction must complete the Risk Assessment. This checklist includes activities completed to date, as well as an assessment of risks (e.g., rightof way acquisition, proximity to historic properties, etc.). If the applicant is completing a transit or TDM application that is operations only, check the box and do not complete the remainder of the form. These projects will receive full points for the Risk Assessment. Park and Ride and other transit construction projects require completion of the Risk Assessment below. RESPONSE (Complete Risk Assessment): SCORING GUIDANCE (75 Points) The applicant with the most points on the Risk Assessment (more points equate to less project risk) will receive the full points for the measure. Remaining projects will receive a proportionate share of the full points. For example, if the application being scored had 40 points and the top project had 70 points, this applicant would receive (40/70)*75 points or 43 points. Roadway Expansion: 23
31 Roadway Expansion 9. Cost Effectiveness (100 Points) This criterion will assess the project s cost effectiveness based on the total TAB eligible project cost (not including noise walls) and total points awarded in the previous 8 criteria. A. MEASURE: This measure will calculate the cost effectiveness of the project. Metropolitan Council staff will divide the number of points awarded in the previous criteria by the TABeligible project cost (not including noise walls) by the total number of points awarded in the previous criteria. Cost effectiveness = total TAB eligible project cost (not including noise walls)/total number of points awarded in previous criteria/total TAB eligible project cost (not including noise walls) RESPONSE (This measure will be calculated after the scores for the other measures are tabulated by the Scoring Committee): Total Project Cost (entered in Project Cost Form): SCORING GUIDANCE (100 Points) The applicant with the most points (i.e., the benefits) per dollar will receive the full points for the measure. Remaining projects will receive a proportionate share of the full points. For example, if the top project received.0005 points per dollar and the application being scored received points per dollar, this applicant would receive (.00025/.0005)*100 points or 50 points. TOTAL: 1,100 POINTS Roadway Expansion: 24
32 Roadway Reconstruction/Modernization and Spot Mobility Prioritizing Criteria and Measures September 20, 2017 Definition: A roadway project that does not add thru lane capacity, but reconstructs, reclaims, or modernizes, or adds new spot mobility elements (e.g., new turn lanes, traffic signal, or roundabout)the facility. Routine maintenance including mill and overlay projects are not eligible. Projects must be located on a non freeway principal arterial or A minor arterial functionally classified roadway, consistent with the latest TAB approved functional classification map. Examples of Roadway Reconstruction/Modernization and Spot Mobility Projects: Intersection improvements or alternative intersections such as unsignalized or signalized reduced conflict intersections. Interchange reconstructions that do not involve new ramp movements or added thru lanes Turn lanes (not continuous) Two lane to three lane conversions Four lane to three lane conversions Addition or replacement of traffic signals Shoulder improvements Strengthening a non 10 ton roadway Raised medians, frontage roads, access modifications, or other access management Roadway improvements that add multimodal elements New alignments that replace an existing alignment and do not expand the number of lanes Roundabouts Scoring: Criteria and Measures Points % of Total Points 1. Role in the Regional Transportation System and Economy % Measure A System Congestion and Principal Arterial Intersection Conversion Study PrioritiesAverage distance to nearest parallel roadways 8065 Measure B Connection to Total Jobs and Manufacturing/Distribution Jobs 3040 Measure C Regional Truck Corridor Study TiersCurrent daily heavy commercial 5065 traffic Measure D Freight project elements Usage % Measure A Current daily person throughput 110 Measure B Forecast 2040 average daily traffic volume Equity and Housing Performance 100 9% Measure A Connection to disadvantaged populations and project s benefits 30 Measure B Housing Performance Score Infrastructure Age/Condition % Measure A Date of construction 50 Measure B Geometric, structural, or infrastructure deficiencies Congestion Reduction/Air Quality % Measure A Vehicle delay reduced 4550 Measure B Kg of emissions reduced Safety % Measure A Crashes reduced Multimodal Elements and Existing Connections 100 9% Measure A Transit, bicycle, or pedestrian project elements and connections Risk Assessment 75 7% Measure A Risk Assessment Form 75 Reconstruction/Modernization: 1
ACTION TRANSMITTAL No
 Transportation Advisory Board of the Metropolitan Council of the Twin Cities DATE: November 6, 2017 TO: FROM: ACTION TRANSMITTAL No. 2017-29 Transportation Advisory Board Technical Advisory Committee PREPARED
Bridges Prioritizing Criteria and Measures
 Bridges Prioritizing Criteria and Measures August 17, 2017 Definition: A bridge rehabilitation or replacement project located on a non Freeway Principal Arterial or A Minor Arterial functionally classified
Committee Report. Transportation Committee. Business Item No
 Committee Report Business Item No.2014-73 Transportation Committee For the Metropolitan Council meeting of April 9, 2014 Subject: Regional Solicitation Evaluation Recommendations Proposed Action That the
TRANSPORTATION ADVISORY BOARD Of the Metropolitan Council
 1. Call to Order 2. Approval of Agenda 3. Approval of August 2, 2017 Minutes 4. TAB Report 5. Committee Reports TRANSPORTATION ADVISORY BOARD Of the Metropolitan Council Notice of a Meeting of the TECHNICAL
Appendix D Functional Classification Criteria and Characteristics, and MnDOT Access Guidance
 Appendix D Functional Classification Criteria and Characteristics, and MnDOT Access Guidance Functional classification identifies the role a highway or street plays in the transportation system. Some highways
Appendix D: Functional Classification Criteria and Characteristics, and MnDOT Access Guidance
 APPENDICES Appendix D: Functional Classification Criteria and Characteristics, and MnDOT Access Guidance D.1 Functional classification identifies the role a highway or street plays in the transportation
Congestion Management Process (CMP)
") Congestion Management Process (CMP) Introduction The Congestion Management Process (CMP) is a systematic, data-driven, and regionally accepted approach that aims to improve the performance of the transportation
Congestion Management Process (CMP) Introduction The Congestion Management Process (CMP) is a systematic, data-driven, and regionally accepted approach that aims to improve the performance of the transportation
Webinar Series for Comprehensive Plan Updates. Transportation Overview
 Webinar Series for Comprehensive Plan Updates Transportation Overview Presented by Michael Larson and Mark Filipi August 18, 2016 2040 Transportation Policy Plan Adopted January 14 th, 2015 Multimodal
Highway and Freight Current Investment Direction and Plan. TAB September 20, 2017
 Highway and Freight Current Investment Direction and Plan TAB September 20, 2017 Today s Topics Where are we now, what are the current issues? Where do we want to go? How will we get there? What are the
Surface Transportation Block Grant Program
 Scoring Criteria Guide Surface Transportation Block Grant Program 2019 Call for Projects For the St. Louis Region Guidance Document for STP-S Project Evaluation TABLE OF CONTENTS Overview...3 Road Project
12 Evaluation of Alternatives
 12 Evaluation of Alternatives This chapter evaluates the effectiveness of the No-Build Alternative and the proposed METRO Blue Line Light Rail Transit (BLRT) Extension project based on the information
ACTION TRANSMITTAL
 ACTION TRANSMITTAL 2016-07 DATE: December 4, 2015 TO: FROM: TAC Planning MTS Staff PREPARED BY: Rachel Wiken (651) 602-1572 SUBJECT: REQUESTED ACTION: RECOMMENDED MOTION: Functional Class Change #1330
APPENDIX B. Public Works and Development Engineering Services Division Guidelines for Traffic Impact Studies
 APPENDIX B Public Works and Development Engineering Services Division Guidelines for Traffic Impact Studies Revised December 7, 2010 via Resolution # 100991 Reformatted March 18, 2011 TABLE OF CONTENTS
Highway and Freight Current Investment Direction and Plan. TAC August 2, 2017
 Highway and Freight Current Investment Direction and Plan TAC August 2, 2017 Today s Topics Highway & Freight Where are we now? The Highway Story What are the issues? How is the system performing? Where
CHAPTER 2: MODELING METHODOLOGY
 CHAPTER 2: MODELING METHODOLOGY 2.1 PROCESS OVERVIEW The methodology used to forecast future conditions consisted of traditional traffic engineering practices and tools with enhancements to more accurately
GUIDE FOR THE PREPARATION OF TRAFFIC IMPACT STUDIES
 GUIDE FOR THE PREPARATION OF TRAFFIC IMPACT STUDIES Adopted by Town Council on November 25, 2008 Prepared By: HNTB Engineering Department Planning Department TABLE OF CONTENTS I. INTRODUCTION... 1 II.
6.0 CONGESTION HOT SPOT PROBLEM AND IMPROVEMENT TRAVEL DEMAND MODEL ANALYSIS
 6.0 CONGESTION HOT SPOT PROBLEM AND IMPROVEMENT TRAVEL DEMAND MODEL ANALYSIS 6.1 MODEL RUN SUMMARY NOTEBOOK The Model Run Summary Notebook (under separate cover) provides documentation of the multiple
APPENDIX H: TRAVEL DEMAND MODEL VALIDATION AND ANALYSIS
 APPENDIX H: TRAVEL DEMAND MODEL VALIDATION AND ANALYSIS Travel demand models (TDM) simulate current travel conditions and forecast future travel patterns and conditions based on planned system improvements
TRANSPORTATION IMPACT ANALYSIS GUIDELINES
 TRANSPORTATION IMPACT ANALYSIS GUIDELINES SANTA CLARA COUNTY TRANSPORTATION AUTHORITY CONGESTION MANAGEMENT PROGRAM ADOPTED MARCH 2009 TABLE OF CONTENTS PART I - STATUTE AND AUTHORITY...1 CHAPTER 1. CMP
Mobility and System Reliability Goal
 Mobility and System Reliability Goal Provide surface transportation infrastructure and services that will advance the efficient and reliable movement of people and goods throughout the state. Background:
Proposed Comprehensive Update to the State of Rhode Island s Congestion Management Process
 Proposed Comprehensive Update to the State of Rhode Island s Statewide Planning Program January 2018 Summary Outline of of Action Steps 1. Develop Objectives for Congestion Management What is the desired
Project Prioritization for Urban and Rural Projects TEAM CONFERENCE March 7, 2018
 Project Prioritization for Urban and Rural Projects 2018 TEAM CONFERENCE March 7, 2018 Challenge Limited funding for transportation improvements requires strategic selection of projects to ensure resource
Contents i Contents Page 1 A New Transportation Plan Community Involvement Goals and Objectives... 11
 Contents i Contents 1 A New Transportation Plan... 1 Why develop a new plan?... 1 What area does the LRTP focus on?... 2 Why is this LRTP important?... 3 Meeting Requirements for Transportation Planning...
Traffic Impact Study Requirements
 [TYPE THE COMPANY NAME] Traffic Impact Study Requirements County of San Mateo Department of Public Works Roadway Services 9/1/2013 I. Introduction The County of San Mateo (County), Department of Public
Chapter 2 Transportation Policy Plan Strategies
 Chapter 2 Transportation Policy Plan Strategies As discussed in Chapter 1, the current federal transportation law, Fixing America s Surface Transportation Act (FAST Act), mandates a streamlined and performance-based
2. Guiding Principles, Objectives, and Policies
 2. Guiding Principles, Objectives, and Policies INTRODUCTION The guiding principles for the 2040 MTP Update establish the vision and key focus areas for this planning effort. They combine the guidance
Transportation Advisory Board May 21, 2014
 Transportation Advisory Board May 21, 2014 1 2040 TPP Schedule April 2013 to May 2014: Policymaker Task Force, Partner Agency Work Group and other stakeholder discussions on preparation of draft 2040 TPP
SECTION III - REGIONAL ARTERIAL SYSTEM. The Regional Arterial System is a subcomponent of a broader regional thoroughfare system.
 SECTION III - REGIONAL ARTERIAL SYSTEM SYSTEM IDENTIFICATION The Regional Arterial System is a subcomponent of a broader regional thoroughfare system. The NCTCOG Regional Thoroughfare Plan (RTP) recognizes
Federal STP Funding Application (Form 1)
") Federal STP Funding Application (Form 1) INSTRUCTIONS: Complete and return completed application to Kevin Roggenbuck, Transportation Coordinator, Transportation Advisory Board, 390 North Robert St., St.
Federal STP Funding Application (Form 1) INSTRUCTIONS: Complete and return completed application to Kevin Roggenbuck, Transportation Coordinator, Transportation Advisory Board, 390 North Robert St., St.
Chapter 14 Work Program
 Chapter 14 Work Program The Metropolitan Council will carry out or participate in many studies and plans over the next three years. This is not an exhaustive list of all work to be completed by the Metropolitan
The Policies section will also provide guidance and short range policies in order to accomplish the goals and objectives.
 4 Goals & Objectives INTRODUCTION The 2015-2040 MTP preserves and promotes the quality of life and economic prosperity of the MAB by providing a transportation system consistent with the regional goals.
Database and Travel Demand Model
 Database and Travel Demand Model 7 The CMP legislation requires every CMA, in consultation with the regional transportation planning agency (the Metropolitan Transportation Commission (MTC) in the Bay
Appendix O Congestion Management Program REGIONAL TRANSPORTATION PLAN/SUSTAINABLE COMMUNITIES STRATEGY
 Appendix O Congestion Management Program REGIONAL TRANSPORTATION PLAN/SUSTAINABLE COMMUNITIES STRATEGY 2014 REGIONAL CONGESTION MANAGEMENT PROGRAM 2014 RTP/SCS APPENDIX O SAN JOAQUIN COUNCIL OF GOVERNMENTS
2030 Transportation Policy Plan SUMMARY PRESENTATION. Land Use Advisory Committee November 15, 2012
 2030 Transportation Policy Plan SUMMARY PRESENTATION Land Use Advisory Committee November 15, 2012 Today s Topics Transportation Policy Plan (TPP) Requirements and Background Current TPP Policies, Issues
Tri-County Regional Planning Commission 2045 Regional Metropolitan Transportation Plan Goals and Objectives Adopted March 22, 2017
 Tri-County Regional Planning Commission 2045 Regional Metropolitan Transportation Plan Goals and Objectives Adopted March 22, 2017 One of the initial steps in the development of the TCRPC 2045 Metropolitan
2040 Transportation Policy Plan Conversion to Performance Based Planning Basis. 25 th Annual CTS Transportation Research Conference May 21, 2014
 2040 Transportation Policy Plan Conversion to Performance Based Planning Basis 25 th Annual CTS Transportation Research Conference May 21, 2014 1 About the plan Long-range transportation plan for the Twin
City of Berkeley. Guidelines for Development of Traffic Impact Reports
 Office of Transportation (OOT) City of Berkeley Guidelines for Development of Traffic Impact Reports Office of Transportation, City of Berkeley 1 1. Overview These guidelines provide a framework to help
Chapter #9 TRAVEL DEMAND MODEL
 Chapter #9 TRAVEL DEMAND MODEL TABLE OF CONTENTS 9.0 Travel Demand Model...9-1 9.1 Introduction...9-1 9.2 Overview...9-1 9.2.1 Study Area...9-1 9.2.2 Travel Demand Modeling Process...9-3 9.3 The Memphis
RESOLUTION NO
 RESOLUTION NO. 2018-12 RESOLUTION OF THE SOUTHEASTERN WISCONSIN REGIONAL PLANNING COMMISSION AMENDING THE TRANSPORTATION IMPROVEMENT PROGRAM FOR SOUTHEASTERN WISCONSIN: 2017-2020 WHEREAS, the Southeastern
Corpus Christi Metropolitan Transportation Plan Fiscal Year Introduction:
 Introduction: Traffic congestion in the Corpus Christi Metropolitan area is not as much a function of population growth as the function of the increase in single occupant trips. Using census data, the
TRANSPORTATION IMPACT ANALYSISGUIDELINES
 TRANSPORTATION IMPACT ANALYSISGUIDELINES ADOPTED OCTOBER2014 SANTACLARAVALLEYTRANSPORTATION AUTHORITY CONGESTION MANAGEMENTPROGRAM CONGESTION MANAGEMENT PROGRAM TRANSPORTATION IMPACT ANALYSIS GUIDELINES
Appendix B. OKI 2030 Regional Transportation Plan Project Scoring Process. Ohio Kentucky Indiana Regional Council of Governments
 Appendix B OKI 2030 Regional Transportation Plan Project Scoring Process APPENDIX B OKI 2030 REGIONAL TRANSPORTATION PLAN PROJECT SCORING PROCESS Background This scoring process is intended to assist selection
CHECKLIST OF MINIMUM REQUIREMENTS FOR VICTORIA
 CHECKLIST OF MINIMUM REQUIREMENTS FOR VICTORIA The checklist below was compiled from information on the Plan Elements pages in the Local Planning Handbook under the Minimum Requirements sections of the
Traffic Impact Analysis Guidelines. Town of Queen Creek
 Traffic Impact Analysis Guidelines Town of Queen Creek January 2016 1. INTRODUCTION The purpose of this document is to outline the procedures and requirements for preparing a Transportation Impact Analysis
HB2 Implementation Policy Guide
 report HB2 Implementation Policy Guide prepared for Commonwealth Transportation Board date August 1, 2015 6.0 Appendix A: Safety Measures Table 6.1 Safety Factor Measures Summary ID Measure Name Weight
ACTION TRANSMITTAL No
 Transportation Advisory Board of the Metropolitan Council of the Twin Cities ACTION TRANSMITTAL No. 2014-17 DATE: February, 2014 TO: FROM: PREPARED BY: SUBJECT: REQUESTED ACTION: T Bob Paddock Roadway
ARC Freight Advisory Task Force Meeting. SOUTH FULTON COMMUNITY IMPROVEMENT DISTRICT Multi-Modal Study
 ARC Freight Advisory Task Force Meeting SOUTH FULTON COMMUNITY IMPROVEMENT DISTRICT Multi-Modal Study March 1, 2018 Outline Study Overview Scope of Work Key Investment Needs Draft Investment Recommendations
Alternatives Evaluation Methodology
 Alternatives Evaluation Methodology www.vision54 56.com B 1 Phase 2 Alternatives Evaluation Methodology PASCO COUNTY METROPOLITAN PLANNING ORGANIZATION 8731 Citizens Drive New Port Richey, FL 34654 Ph
City of Menifee. Public Works Department. Traffic Impact Analysis Guidelines
 Public Works Department Traffic Impact Analysis Guidelines Revised: August 2015 TABLE OF CONTENTS INTRODUCTION... 3 PURPOSE... 3 EXEMPTIONS... 3 SCOPING... 4 METHODOLOGY... 5 STUDY AREA... 6 STUDY SCENARIOS...
2018 Regional Solicitation Assessment: Surveys and Sensativty Analysis Looking Toward 2020: Top Issues List
 2018 Regional Solicitation Assessment: Surveys and Sensativty Analysis Looking Toward 2020: Top Issues List April 3, 2019 Technical Advisory Committee Participant Surveys Surveys provided to applicants,
Freight and Rail Stakeholder Webinar. January 7, 2014
 Freight and Rail Stakeholder Webinar January 7, 2014 Agenda Modal Needs Baseline Revenue Modal Scenarios Website Statewide Freight Plan Statewide Rail Plan Jeff Carroll MULTIMODAL TRANSPORTATION NEEDS
10. PROJECT DEVELOPMENT, LEADERSHIP, AND OVERSIGHT GUIDELINES
 10. PROJECT DEVELOPMENT, LEADERSHIP, AND OVERSIGHT GUIDELINES It is important to note that the Transitway Guidelines are not intended to be prescriptive, but rather to provide a consistent basis for planning,
CITY OF VALLEJO PUBLIC WORKS DEPARTMENT TRAFFIC IMPACT Analysis/Study GUIDELINES
 The City Engineer, under the authority of the Public Works Director and recommendations from the Traffic Engineer, will make the final decision on the need for a traffic study. The purpose of the traffic
MULTIMODAL TRANSPORTATION IMPACT STUDY GUIDELINES
 MULTIMODAL TRANSPORTATION IMPACT STUDY GUIDELINES 1 st Edition City of San Luis Obispo 2035 Circulation Element 1 Table of Contents Introduction... 2 Process... 2 When Impact Studies Are Required... 3
CHECKLIST OF MINIMUM REQUIREMENTS FOR NEW BRIGHTON
 CHECKLIST OF MINIMUM REQUIREMENTS FOR NEW BRIGHTON The checklist below was compiled from information on the Plan Elements pages in the Local Planning Handbook under the Minimum Requirements sections of
PROJECT SUBMISSION FORM
 PROJECT SUBMISSION FORM Basic Project Information CEID 1182 1. Submitting Agency: MDOT/State Highway Administration 2. Secondary Agency: 3. Agency Project ID: 4. Project Type: Interstate Primary Secondary
CLA /10.54, PID Project Description:
 Project Description: The proposed project will consist of widening IR 70 to three lanes from Enon Road (SLM 06.75) to the US 68 interchange ramps (SLM 10.55). IR 70 is a component of the Strategic Highway
Rivers Edge Alternative Urban Areawide Review (AUAR) Traffic Study
 Traffic Study") Appendix F Rivers Edge Alternative Urban Areawide Review (AUAR) Traffic Study Prepared by Westwood Professional Services, Inc. for City of St. Paul Park Grey Cloud Island Township October 14, 2003 Introduction
Appendix F Rivers Edge Alternative Urban Areawide Review (AUAR) Traffic Study Prepared by Westwood Professional Services, Inc. for City of St. Paul Park Grey Cloud Island Township October 14, 2003 Introduction
9. TRAVEL FORECAST MODEL DEVELOPMENT
 9. TRAVEL FORECAST MODEL DEVELOPMENT To examine the existing transportation system and accurately predict impacts of future growth, a travel demand model is necessary. A travel demand model is a computer
TRAFFIC STUDY GUIDELINES
 TRAFFIC STUDY GUIDELINES December 2013 The scope of the traffic impact analysis (TIA) should follow these guidelines and the requirements of VMC 11.80.130 and VMC 11.70, transportation concurrency (attached
P4.0 Highway Quantitative Scoring Workgroup Recommendations
 P4.0 Highway Quantitative Scoring Workgroup Recommendations May 18, 2015 Highway Project Scoring Overview Insert Table of Eligibility Statewide Mobility Regional Impact Division Needs Eligible Projects:
Regional Performance Measures Annual Progress Report TPO Board - 2/4/2016 Presentation by: Chris Wichman, Senior Planner
 2015 TPO Board - 2/4/2016 Presentation by: Chris Wichman, Senior Planner Overview History and definition of performance-based planning & programming Review of 2015 TPO Board Action Requested 2 History
Benefit-Cost Analysis in MPO Transportation Planning
 Benefit-Cost Analysis in MPO Transportation Planning Mary Luebbers, Ohio-Kentucky-Indiana Regional Council of Governments; Eric C. Gabler, Federal Highway Administration November 8, 2007 John A. Roebling
APPENDIX D. Glossary D-1
 APPENDIX D Glossary D-1 Glossary of Transportation Planning Terms ANNUAL AVERAGE DAILY TRAFFIC (AADT): The total number of vehicles passing a given location on a roadway over the course of one year, divided
Highest Priority Performance Measures for the TPP
 Highest Priority Performance Measures for the TPP The following list of measures are the highest priority performance measures as identified by modal working groups. These groups consist of staff from
CITY OF CLOVIS Traffic Impact Study Guidelines
 CITY OF CLOVIS Traffic Impact Study Guidelines CLOVIS, A WAY OF LIFE Approved August 25, 2014 City Council Resolution 2014-79 Prepared by City of Clovis Engineering Division Steve White, City Engineer
Transform 66 Multimodal Project: Prioritization Process and Evaluation Criteria Approved March 3, 2016
 Transform 66 Multimodal Project: Prioritization Process and Evaluation Criteria Approved March 3, 2016 The Memorandum of Agreement (MOA) for the Transform 66: Inside the Beltway Project directs NVTC to
GUIDING PRINCIPLES MEMORANDUM
 M E T R O P O L I TAN TRA NS P O RTATI O N PLAN GUIDING PRINCIPLES MEMORANDUM El Paso Metropolitan Planning Organization INTRODUCTION The guiding principles for development of the El Paso MPO s Destino
Section 11: Transportation Strategies Toolbox
 Section 11: Transportation Strategies Toolbox A transportation strategies toolbox was developed to provide a systematic approach to identify potential strategies that address corridor transportation needs.
Traffic Impact Study Guidelines. City of Guelph
 Traffic Impact Study Guidelines City of Guelph April 2016 Engineering and Capital Infrastructure Services Infrastructure, Development & Enterprise 1 Carden Street Guelph, Ontario Canada N1H 3A1 Page 1
HIGHWAY 71 CORRIDOR IMPROVEMENT STUDY BELLA VISTA BYPASS MISSOURI STATE LINE BENTON COUNTY
 HIGHWAY 71 CORRIDOR IMPROVEMENT STUDY BELLA VISTA BYPASS MISSOURI STATE LINE BENTON COUNTY DRAFT December 2017 Highway 71 Corridor Improvement Study Bella Vista Bypass to Missouri State Line BENTON COUNTY
DES MOINES AREA MPO. Environment Roundtable. October 13, 2015
 DES MOINES AREA MPO Environment Roundtable October 13, 2015 October 13, 2015 Agenda 1. Call to Order 2. VOTE: Approval of Agenda 3. VOTE: Approval of Meeting Minutes 4. UPDATE: Water Trails 5. DISCUSSION:
MOBILITY AND ALTERNATIVES ANALYSIS
 6 MOBILITY AND ALTERNATIVES ANALYSIS BACK OF SECTION DIVIDER 6.0 Mobility and Alternatives Analysis Travel demand analysis provides a framework for the identification of transportation facilities and services
ACTIVE TRANSPORTATION ADVISORY COMMITTEE. Memphis MPO March 30, 2015
 ACTIVE TRANSPORTATION ADVISORY COMMITTEE Memphis MPO March 30, 2015 Agenda Welcome & Introductions Announcements and Briefings Livability 2040: Regional Transportation Plan Congestion Management Process
A three-stage process was implemented in order to develop and evaluate the project concepts and provide recommendations for the project.
 MEMORANDUM TO: FROM: Highway 36/Rice Street PMT Mark Benson DATE: March 23, 2009 RE: Selection of a Preferred Alternative SEH No. 105803 The purpose of this memorandum is to document the process for selecting
7.0 Benefit/Cost Analysis
 7.0 Benefit/Cost Analysis 7.0 Benefit/Cost Analysis This section presents detailed instructions on how to conduct benefit-cost analysis using a spreadsheet tool developed for the Phase I evaluation; this
APPENDIX A - PLANS AND POLICY REVIEW FEBRUARY 2017
 APPENDIX A - PLANS AND POLICY REVIEW FEBRUARY 2017 DENVERMOVES Transit Denver Moves: Transit APPENDIX A PLANS AND POLICY REVIEW 2035 Metro Vision Regional Transportation Plan (MVRTP) (2011) 2040 Fiscally
TRB WEBINAR PROGRAM Planning and Preliminary Engineering Applications Guide to the Highway Capacity Manual: Contents
 TRANSPORTATION RESEARCH BOARD TRB WEBINAR PROGRAM Planning and Preliminary Engineering Applications Guide to the Highway Capacity Manual: Contents Tuesday, May 30, 2017 2:00-3:30 PM ET The Transportation
TOWN OF MOORESVILLE TRANSPORTATION IMPACT ANALYSIS PROCEDURES MANUAL TOWN OF MOORESVILLE, NORTH CAROLINA
 TOWN OF MOORESVILLE TRANSPORTATION IMPACT ANALYSIS PROCEDURES MANUAL TOWN OF MOORESVILLE, NORTH CAROLINA Effective August 1, 2007 Amended March 4, 2013, December 1, 2014, May 1, 2017 TOWN OF MOORESVILLE,
CHAPTER 2. VISION, GOALS AND MTP FRAMEWORK
 CHAPTER 2. VISION, GOALS AND MTP FRAMEWORK MTP VISION In order to create a framework for the 2040 Metropolitan Transportation Plan (MTP), a vision statement was drafted by the Vision/Goals Committee and
Project Initiation Form
 Meeting Date: The Project Initiation Form should be completed in conjunction with the Level 2 Screening Form. Process Leads and/or Planners should complete the Project Initiation Form to document coordination
Addendum #3 to the Regional Transportation Plan
 Nashville Area Metropolitan Planning Organization Addendum #3 to the Regional Transportation Plan Effective November 21, 2018 Nashville Area Metropolitan Planning Organization 138 Second Avenue North Nashville,
TRANSPORTATION RELATIONSHIP TO OTHER ELEMENTS OF THE PLAN AND COUNTY REGULATIONS VISION FOR TRANSPORTATION PLANNING ROAD NETWORK SECTION 7
 TRANSPORTATION Like many growing western counties, Douglas County focuses on one of the most integral elements in land-use planning: transportation. The primary purpose of a transportation network is to
The Folded Interchange: An Unconventional Design for the Reconstruction of Cloverleaf Interchanges
 The Folded Interchange: An Unconventional Design for the Reconstruction of Cloverleaf Interchanges I. ABSTRACT Keith A. Riniker, PE, PTOE This paper presents the Folded Interchange design and compares
Transportation Improvement Program (TIP) Relationship to 2040 Metropolitan Transportation Plan (MTP) - Goals and Performance Measures
 Relationship to 2040 Metropolitan Transportation Plan (MTP) - Goals and Performance Measures") Mid-Region Metropolitan Planning Organization Mid-Region Council of Governments 809 Copper Avenue NW Albuquerque, New Mexico 87102 (505) 247-1750-tel. (505) 247-1753-fax www.mrcog-nm.gov Transportation
Mid-Region Metropolitan Planning Organization Mid-Region Council of Governments 809 Copper Avenue NW Albuquerque, New Mexico 87102 (505) 247-1750-tel. (505) 247-1753-fax www.mrcog-nm.gov Transportation
RESOLUTION NO
 RESOLUTION NO. 2017- A RESOLUTION OF THE BOARD OF COUNTY COMMISSIONERS OF SARASOTA COUNTY, FLORIDA PROVIDING FINDINGS OF FACT; ESTABLISHING A UNIFORM METHODOLOGY FOR MULTIMODAL MOBILITY ANALYSES ; AND
PERFORMANCE-BASED PLANNING AND PROGRAMMING
 February 2017 performance-based planning and programming Boston Region MPO PERFORMANCE-BASED PLANNING AND PROGRAMMING WHAT IS PERFORMANCE-BASED PLANNING AND PROGRAMMING? Performance-based planning and
MOTOR MPO CONGESTION MANAGEMENT PROCESS (CMP)
") MOTOR MPO CONGESTION MANAGEMENT PROCESS (CMP) Background: Metropolitan Planning Organizations that have been designated as a Transportation Management Area (TMA) are required to develop a Congestion Management
MOTOR MPO CONGESTION MANAGEMENT PROCESS (CMP) Background: Metropolitan Planning Organizations that have been designated as a Transportation Management Area (TMA) are required to develop a Congestion Management
Livability 2050 Regional Transportation Plan Update. Transportation Policy Board (TPB) August 23, 2018
 August 23, 2018") Livability 2050 Regional Transportation Plan Update Transportation Policy Board (TPB) August 23, 2018 1 Oct. 2017 Plan Kick-Off Sept. 2019 Plan Adoption Timeline Livability 2050 Regional Transportation
Livability 2050 Regional Transportation Plan Update Transportation Policy Board (TPB) August 23, 2018 1 Oct. 2017 Plan Kick-Off Sept. 2019 Plan Adoption Timeline Livability 2050 Regional Transportation
Benefit Cost Analysis Narrative
 Chicago Region Environmental and Transportation Efficiency Program (CREATE) Grade Separations of: GS21a - Union Pacific and 95 th Street GS11 - Belt Railway Company of Chicago and Columbus Ave. GS 9 -
Chapter 4: Transportation and Land Use
 Chapter 4: Transportation and Land Use Transportation and land use together make possible the wide range of destination opportunities in the region. Transportation provides the connections, and, in turn,
Recommended Roadway Plan Section 3 Existing Facilities & System Performance
 Recommended Roadway Plan Section 3 Existing Facilities & System Performance RECOMMENDED ROADWAY PLAN SECTION 3 Existing Facilities and System Performance 3.1 Introduction An important prerequisite to transportation
North Central Texas Council of Governments. Workshop TxDOT Dallas
 Workshop TxDOT Dallas July 10, 2015 1 CMP Workshop Overview Overview of the CMP CMP and Documentation Project Implementation Form CMP Corridor Analysis Fact Sheet CMP Roadway Deficiency Form Project Examples
The Highway Economic Requirements System (HERS): How HERS Works
: How HERS Works") The Highway Economic Requirements System (HERS): How HERS Works presented to Committee for a Study of the Future Interstate Highway System presented by Rich Margiotta, Ph.D. December 20, 2016 What We ll
The Highway Economic Requirements System (HERS): How HERS Works presented to Committee for a Study of the Future Interstate Highway System presented by Rich Margiotta, Ph.D. December 20, 2016 What We ll
5.0 PRELIMINARY ENVIRONMENTAL REVIEW
 5.0 PRELIMINARY ENVIRONMENTAL REVIEW 5.1 INTRODUCTION A preliminary environmental review was performed on the proposed freeway improvements that form Concept C, which encompasses the three freeway corridors
Chapter 2 Transportation Element Goals, Objectives and Policies
 Chapter 2 Transportation Element Goals, Objectives and Policies City of Belleview Comprehensive Plan Adopted by Ord 2016-10 on July 5, 2016 GOALS, OBJECTIVES AND POLICIES Goal 2 Transportation...1 Objective
BCEO TRAFFIC IMPACT STUDY GUIDELINES
 BCEO TRAFFIC IMPACT STUDY GUIDELINES February 2006 TABLE OF CONTENTS INTRODUCTION..... i TRAFFIC IMPACT STUDY STRUCTURE... 1 WHEN IS A TRAFFIC IMPACT STUDY NEEDED?..... 1 STUDY AREA, SITE PLAN & HORIZON
TRANSPORTATION IMPACT STUDIES
 January 28, 2009 POLICIES AND PROCEDURES FOR TRANSPORTATION IMPACT STUDIES Related to Highway Occupancy Permits Pennsylvania Department of Transportation Bureau of Highway Safety and Traffic Engineering
Chapter 5 Transportation Draft
 Chapter 5 Transportation Draft Discussion Similar to the other elements in the Comprehensive Plan, the transportation element impacts the quality of life, economic development and public safety of the
ACTIVE TRANSPORTATION PROGRAMMING COMMITTEE Project Funding and Scoring Criteria
 ACTIVE TRANSPORTATION PROGRAMMING COMMITTEE Project Funding and Scoring Criteria Section I. Project meets minimum MARC/State DOT/Federal DOT Requirements STBGP Set-Aside Project Eligibility The Surface