ENVIRONMENTAL STUDY REPORT
|
|
|
- Pamela Lyons
- 6 years ago
- Views:
Transcription


1 Strasburg Road Extension From North of Stauffer Drive To New Dundee Road Class Environmental Assessment ENVIRONMENTAL STUDY REPORT APPENDICES Volume II October 2013
2 Strasburg Road Extension Environmental Study Report From North of Stauffer Drive to New Dundee Road October 2013 APPENDIX D* TECHNICAL SUPPORT MATERIAL D.1 Traffic D.1 (a) Traffic Report D.1 (b) Screening Assessment D.1 (c) Additional Traffic Scope Technical Memorandum D.2 Natural Environment D.3 Supplementary Land Use Information D.4 Noise Impact Assessment D.5 Air Quality Assessment D.6 Cultural Heritage Assessment Report D.7 Archaeological Resources D.8 Drainage and Stormwater Management *Information in some of these appendices reflects impact assessment analyses from Stage 1 of the comparative assessment of Strasburg Road Extension alignments. For Stage 2 comparative assessment results please refer to Appendix C E-Rev 1
3 Strasburg Road Extension Environmental Study Report From North of Stauffer Drive to New Dundee Road October 2013 APPENDIX D.1 TRAFFIC [The comprehensive documentation of the traffic analysis in Appendix D.1 includes a screening of the roundabout option for the Strasburg Road Extension intersections with the Robert Ferrie Drive Extension, the Blair Creek Drive Extension and New Dundee Road/Reidel Drive-Cameron Road that were part of the original (2011) Technically Preferred Alignment (Alignment E4 Modified). It should be noted that these intersections have not been included in the subsequent roundabout screening for the Strasburg Road Extension/New Dundee Road intersection that is part of the new (2013) Technically Preferred Alignment (Alignment W1). The location and configuration of the Strasburg Road Extension/Robert Ferrie Drive Extension intersection will be determined through a separate planning study. City of Kitchener and Region of Waterloo staff will investigate possible mitigation of the existing substandard sight distances at the New Dundee Road/Reidel Drive-Cameron Road intersection as part of the local road network considerations to be addressed in the Blair Creek Drive Extension environmental assessment study, and develop a solution in collaboration with the Township of North Dumfries and area property owners, before opening of the Strasburg Road Intersection at New Dundee Road.] E-Rev 1
4 Strasburg Road Extension Environmental Study Report From North of Stauffer Drive to New Dundee Road October 2013 APPENDIX D.1 (a) TRAFFIC REPORT E-Rev 1

5 Strasburg Road Extension Rush Meadow Street to New Dundee Road TRAFFIC REPORT January 26, 2012
6 Strasburg Road Extension Rush Meadow Street to New Dundee Road City of Kitchener Final Traffic Report for the Class EA Table of Contents 1.0 BACKGROUND HISTORICAL DEVELOPMENT OF THE STRASBURG ROAD EXTENSION PROJECT RATIONALE FUTURE BASE TRAFFIC CONDITION ANALYSIS TRANSPORTATION NETWORK PROPOSED DEVELOPMENT SCHEDULE DEVELOPMENT TRIP GENERATION DEVELOPMENT TRIP DISTRIBUTION DEVELOPMENT TRIP ASSIGNMENTS FUTURE BASE TRAFFIC FORECAST TRAFFIC IMPACT ASSESSMENT SHORT LIST OF ALIGNMENT ALTERNATIVES TRAFFIC INFILTRATION AVERAGE ANNUAL DAILY TRAFFIC (AADT) VOLUMES INTERSECTION ANALYSIS SIGNAL WARRANT ANALYSIS SIGHTLINE ISSUES ON NEW DUNDEE ROAD INITIAL ROUNDABOUT SCREENING ANALYSIS INTERSECTION PERFORMANCE ANALYSIS SUMMARY OF FINDINGS APPENDIX A: CAPACITY ANALYSIS RESULTS i
7 Strasburg Road Extension Rush Meadow Street to New Dundee Road City of Kitchener Final Traffic Report for the Class EA This page intentionally left blank ii
8 Strasburg Road Extension Rush Meadow Street to New Dundee Road City of Kitchener Final Traffic Report for the Class EA 1.0 BACKGROUND 1.1 Historical Development of the Strasburg Road Extension The approved alignment of Strasburg Road Extension from Rush Meadow Street to 500 m north of Stauffer Drive, herein referred to as the project, has been developed based on the recommendations from a number of community and transportation network planning studies, completed between 1981 and With the approval of the 2004/2005 Development Change Background Study and the Brigadoon Community Plan by City Council, the proposed layout of the project was again re-established. The project s alignment was confirmed by the approval of the Doon South Community Plan Phase II in 2009 and recent draft approval of the Regional Transportation Master Plan by the Region of Waterloo reconfirmed the need for, and prioritization of the extension of the project to New Dundee Road. The proposed Strasburg Road corridor identified for the southerly extension from its current terminus traverses an environmentally sensitive area consisting of a Provincially Significant Wetland (PSW), a dense wooded area, and other sensitive environmental features. The objective of this study is to assess a feasible alternative to the current Official Plan alignment that may significantly reduce the environmental impact of the project. Figure 1.1 below illustrates the conceptual alignment of the established Strasburg Road corridor, for which Detail Design is in progress (North Section or Part-B as shown below), and the limits of this Strasburg Road Extension Class EA Study (South Section or Part-A as shown below). Figure 1.1: Conceptual Alignment of the Established Strasburg Road Corridor 1
9 Strasburg Road Extension Rush Meadow Street to New Dundee Road City of Kitchener Final Traffic Report for the Class EA 1.2 Project Rationale According to the Regional Transportation Master Plan by the Region of Waterloo, the proposed project is necessarily required to relieve future demand on Homer Watson Boulevard, Huron Road, and Fischer Hallman Road as well as to provide support for the approved development and future growth of the Doon South and southwest Kitchener areas. The Doon South Community and Broader Study Area Traffic Impact Study 1 report prepared by Paradigm in November 2008 (the Paradigm report) forecasted a modest traffic diversion from the existing road network upon completion of the project (i.e., diversion of traffic from Huron Road to Homer Watson Boulevard onto the extended Strasburg Road). Thus, the existing traffic congestion/delays at intersections from Huron Road to Homer Watson Boulevard during the peak hour periods will be relieved upon the completion of this project. Several other traffic impact studies for the proposed developments around the Brigadoon and Doon South communities, as well as other developments within the current study area indicated the need for this project to support the future growth and development in the area. The Paradigm report was assumed to reflect the latest development scenario in and around the Strasburg Road study area. When paired with the Doon South Community Road Network Review report, prepared by itrans, it indicated construction of approximately 7,000 houses around the Brigadoon and Doon South communities. However, for the purpose of this study, the development forecast was adjusted to reflect the latest development plans (September 2010), including the potential future developments, as provided by the City of Kitchener. Based on the latest information provided by the City's Planning Division, approximately 8,450 houses will be built within the vicinity of the study area. This study therefore aims to develop the most technically preferred alignment for the Strasburg Road Extension to: i. Provide traffic and municipal services for the approved development and future growth at the Doon South and southwest Kitchener areas; ii. Relieve future demand on Homer Watson Boulevard, Huron Road and, Fischer Hallman Road; iii. Achieve compatibility with City and Regional policies for future growth, development, and location of any related road intersections; and iv. Minimize impacts to natural heritage features and other important environmental resources. 1 Doon South Community and Broader Study Area Traffic Impact Study November Paradigm Transportation Solutions 2
10 Strasburg Road Extension Rush Meadow Street to New Dundee Road City of Kitchener Final Traffic Report for the Class EA 2.0 FUTURE BASE TRAFFIC CONDITION ANALYSIS 2.1 Transportation Network Figure 2.1 illustrates the transportation network in the area which consists of the following major arterial roads: Huron Road, an urban arterial, exhibits a basic 4-lane cross section within the study area. The posted speed limit on Huron Road is 60 km/h within the study area. The current intersection of Huron Road and Strasburg Road is a roundabout. Huron Road terminates at Homer Watson Boulevard, forming an interchange. The eastbound left movement on Huron Road at Homer Watson Boulevard operates under a Stop control; all other movements at this intersection operate under free flow conditions. Homer Watson Boulevard is another 4-lane divided urban arterial within the City. Homer Watson Boulevard interchanges with Highway 401 and becomes Fountain Street to the south of the interchange. New Dundee Road is a basic 2-lane road, varying from a semi-urban to a rural cross-section as it travels west, and Fischer Hallman Road is also a basic 2-lane rural arterial with a posted speed limit of 80 km/h. Strasburg Road is an existing 4-lane urban collector, with a posted speed limit of 50 km/h. The City plans to implement the Strasburg Road Extension as a major 4-lane urban collector with a posted speed limit of 60 km/h. Figure 2.1: Existing Transportation Network in the Area 3
 will be operational under the future traffic conditions.")
11 Strasburg Road Extension Rush Meadow Street to New Dundee Road City of Kitchener Final Traffic Report for the Class EA This study assumes the extension of Robert Ferrie Drive and the Doon South Blair Creek Drive up to Strasburg Road will be complete, and both the intersections (i.e., Robert Ferrie Drive/Strasburg Road and Blair Creek Drive/Strasburg Road) will be operational under the future traffic conditions. This report also assumes that traffic using the Stauffer Drive/Riedel Drive intersection will be turning at the Robert Ferrie Drive/Strasburg Road intersection under the future traffic conditions. 2.2 Proposed Development Schedule This study assumes two specific horizon years for the proposed developments around the Brigadoon and Doon South communities, as well as areas to the west of the proposed Strasburg Road and south of Huron Road. The specific horizon years are 2016 (i.e., an interim year of developments) and 2031 (as the full build-out horizon year). The developments assumed in this study, including previously anticipated phasings are illustrated below: Figure 2.2: Proposed Developments in the Area In addition to the cited traffic zones (TAZ) in the Paradigm report, this study also considers background developments that were included in the Traffic Analysis Report, prepared for the recently completed 'Huron Road EA' study, by Sernas 2 in October Therefore, the additional developments located northeast and northwest of the Strasburg Road/Huron Road intersection were also included under the 2031 traffic forecast. 2 Transportation and Traffic Analysis Report Huron Road From Strasburg Road to Fischer-Hallman Road October 2009 Sernas Transtech. 4

12 Strasburg Road Extension Rush Meadow Street to New Dundee Road City of Kitchener Final Traffic Report for the Class EA Figure 2.3: Traffic Analysis Zones The following table summarizes the details of the development phasing based on the development information received by the City s Planning Division. Table 2.1: Proposed Development Schedule Development Zones Approximate Location Land Use Horizon Horizon T-01201, 30T-98201, 30T West of Strasburg Residential 685 units 1,476 units 30T-04204, 30T-04208, 30T-04209, 11a East of Strasburg Residential 673 units 110 units 30T-0702, 30T-07204, 30T Doon South Community Residential 521 units 196 units 30T-06203, 4,5 Doon South Community Residential 200 units 214 units 30T-07205, 30T-98202, 25 Brigadoon Community Residential 379 units 711 units 30T Doon South Community Residential 1050 units 300 units TAZ 1a, 1b, 2 and 3a East of Strasburg Residential units TAZ 13b, 13d and 13e East of Strasburg Road Residential units TAZ 20a Doon South Phase II Residential units TAZ 20d, 20e East of Strasburg Residential units OP08/07 /S/KA & ZC08/26 /S/KA West of Strasburg Residential units TAZ 20b East of Strasburg Retail/ Commercial - GFA 89,000 ft 2 TAZ 20c East of Strasburg Business Park - GFA 194,000 ft 2 TAZ 20f East of Strasburg Business Park - GFA 103,000 ft 2 Conestoga Development Retail/ Commercial Conestoga College Blvd Retail/ Commercial - GFA 32,000 ft 2 5
13 Strasburg Road Extension Rush Meadow Street to New Dundee Road City of Kitchener Final Traffic Report for the Class EA Development Zones Approximate Location Land Use Horizon Horizon Conestoga Development Office Conestoga College Blvd Office - GFA 32,000 ft 2 Conestoga Development Hotel Conestoga College Blvd Hotel Rooms Additional Developments 1 North of Huron Residential units Additional Developments 2 North of Huron Residential units Additional Developments - 3, 6, 7 North of Huron Residential - Assumed 50% Built-Out Additional Developments - 4, 5 North/South on Huron Commercial units Additional Developments 8 North of Huron Residential - 64 units Additional Developments 9 South of Huron Residential units Additional Developments 10 West of Strasburg Residential - Assumed 35% Built-Out Additional Developments - 14a East of Strasburg Commercial - 105,500 ft 2 Additional Developments - 14b East of Strasburg Residential - 44 units Additional Developments 15 East of Strasburg Residential - 64 units Additional Developments 16 East of Strasburg Residential - 68 units Additional Developments 17 East of Strasburg Commercial - 155,000 ft 2 Additional Developments 18 North of Huron Residential - 1,200 units Based on the referenced previously approved traffic study reports, this study assumes: The development in the TAZ #21 and #9 to be completely constructed under existing traffic conditions, so it is not included as future developments; TAZ 20b to be developed as a Shopping Centre with an approximate GFA of 89,000 ft 2, whereas 20c and 20f are classified as Business Park consisting of approximately 194,000 ft 2 and 103,000 ft 2 GFA respectively; A mixed-use development encompassing 64,000 ft 2 and consisting of 50% retail and 50% office use has been proposed on Conestoga College Boulevard. The total development on Conestoga College Boulevard also includes a 190-room hotel; The non-residential land use, excluding the hotel land-use, assumes 50% synergy trips; and Site trips were adjusted presuming a modal split of 95% and 5% as auto and transit users, respectively. 2.3 Development Trip Generation Site traffic generation was estimated based on trip generation factors extracted from the ITE Trip Generation Handbook 8 th Edition. Site traffic forecasts were developed assuming the slower progression rate of residential developments. The sections below discuss the site trip generation in detail Horizon Year: A total of 3,508 single detached homes are assumed to be constructed and occupied by the horizon year of This assumption is based on the horizon year forecast given in the 2008 Paradigm report, and is adjusted to reflect the latest development plans (September 2010), as provided by the City of Kitchener. The following table summarizes the site trip generation anticipated by the residential developments for the horizon year of
14 Strasburg Road Extension Rush Meadow Street to New Dundee Road City of Kitchener Final Traffic Report for the Class EA Table 2.2: 2016 Additional Development Trips TAZ Horizon Year 2016 Weekday AM Peak Hour Weekday PM Peak Hour In Out 2-way In Out 2-way 30T-01201, 30T-98201, 30T West of Strasburg Road (685 Units) 30T-04204, 30T-04208, 30T-04209, 11a East of Strasburg Road (673 Units) 30T-0702, 30T-07204, 30T Doon South Community (521 Units) 30T-06203, 4,5 Doon South Community (200 Units) 30T-07205, 30T-98202, 25 Brigadoon Community (379 Units) 30T Doon South Community (1050 Units) Total 3,508 Units Directional Distribution 25% 75% 100% 63% 37% 100% Average Rate Site Traffic based on Average Equation Rate Site Traffic based on Equation Transit %age 5% 5% 5% 5% 5% 5% Less Trips for Transit Total Trips Directional Distribution 25% 75% 100% 63% 37% 100% Average Rate Site Traffic based on Average Equation Rate Site Traffic based on Equation Transit %age 5% 5% 5% 5% 5% 5% Less Trips for Transit Total Trips Directional Distribution 25% 75% 100% 63% 37% 100% Average Rate Site Traffic based on Average Equation Rate Site Traffic based on Equation Transit %age 5% 5% 5% 5% 5% 5% Less Trips for Transit Total Trips Directional Distribution 25% 75% 100% 63% 37% 100% Average Rate Site Traffic based on Average Equation Rate Site Traffic based on Equation Transit %age 5% 5% 5% 5% 5% 5% Less Trips for Transit Total Trips Directional Distribution 25% 75% 100% 63% 37% 100% Average Rate Site Traffic based on Average Equation Rate Site Traffic based on Equation Transit %age 5% 5% 5% 5% 5% 5% Less Trips for Transit Total Trips Directional Distribution 25% 75% 100% 63% 37% 100% Average Rate Site Traffic based on Average Equation Rate Site Traffic based on Equation Transit %age 5% 5% 5% 5% 5% 5% Less Trips for Transit Total Trips Net New Trips 600 1,780 2,380 1,835 1,070 2,905 7
15 Strasburg Road Extension Rush Meadow Street to New Dundee Road City of Kitchener Final Traffic Report for the Class EA 2031 Horizon Year: Based on the steady progression of residential development, this report assumes the construction of an additional 4,941 residential units by the horizon year of This assumption is based on the horizon year forecast given in the 2008 Paradigm report, and is adjusted to reflect the latest development plans (September 2010), as provided by the City of Kitchener. In addition, the following traffic zones are assumed to contain non-residential land use based on the updated land use plan: TAZ 20b Commercial/Retail Land Use Approximate GLA 89,000 ft 2 ; TAZ 20e & 20f Business Park Land Use Approximate GFA 297,000 ft 2 ; Conestoga Development - Retail Land Use Approximate GFA 32,000ft 2 ; Conestoga Development - Office Land Use Approximate GFA 32,000ft 2 ; and Conestoga Development - Hotel Land Use Consisting of approximately 190 rooms The following tables summarize the site trip generations anticipated by the residential and non-residential developments respectively, for the horizon year of Table 2.3: 2031 Additional Residential Development Trips TAZ 30T-01201, 30T-98201, 30T West of Strasburg Road (1476 Units) 30T-04204, 30T-04208, 30T-04209, 11a East of Strasburg Road (110 Units) 30T-0702, 30T-07204, 30T Doon South Community (196 Units) 30T-06203, 4,5 Doon South Community (214 Units) Horizon Year 2031 Residential Development Weekday AM Peak Hour Weekday PM Peak Hour In Out 2-way In Out 2-way Directional Distribution 25% 75% 100% 63% 37% 100% Average Rate Site Traffic based on Average Equation Rate Site Traffic based on Equation Transit %age 5% 5% 5% 5% 5% 5% Less Trips for Transit Total Trips Directional Distribution 25% 75% 100% 63% 37% 100% Average Rate Site Traffic based on Average Equation Rate Site Traffic based on Equation Transit %age 5% 5% 5% 5% 5% 5% Less Trips for Transit Total Trips Directional Distribution 25% 75% 100% 63% 37% 100% Average Rate Site Traffic based on Average Equation Rate Site Traffic based on Equation Transit %age 5% 5% 5% 5% 5% 5% Less Trips for Transit Total Trips Directional Distribution 25% 75% 100% 63% 37% 100% Average Rate Site Traffic based on Average Equation Rate Site Traffic based on Equation Transit %age 5% 5% 5% 5% 5% 5% Less Trips for Transit Total Trips
16 Strasburg Road Extension Rush Meadow Street to New Dundee Road City of Kitchener Final Traffic Report for the Class EA TAZ 30T-07205, 30T-98202, 25 Brigadoon Community (711 Units) 30T Doon South Community (300 Units) 1a, 1b, 2 and 3a - East of Strasburg Road (799 Units) 13b, 13d and 13e East of Strasburg Road (149 Units) 20a Doon South Phase II (144 Units) 20d, 20e East of Strasburg Road (342 Units) Horizon Year 2031 Residential Development Weekday AM Peak Hour Weekday PM Peak Hour In Out 2-way In Out 2-way Directional Distribution 25% 75% 100% 63% 37% 100% Average Rate Site Traffic based on Average Equation Rate Site Traffic based on Equation Transit %age 5% 5% 5% 5% 5% 5% Less Trips for Transit Total Trips Directional Distribution 25% 75% 100% 63% 37% 100% Average Rate Site Traffic based on Average Equation Rate Site Traffic based on Equation Transit %age 5% 5% 5% 5% 5% 5% Less Trips for Transit Total Trips Directional Distribution 25% 75% 100% 63% 37% 100% Average Rate Site Traffic based on Average Equation Rate Site Traffic based on Equation Transit %age 5% 5% 5% 5% 5% 5% Less Trips for Transit Total Trips Directional Distribution 25% 75% 100% 63% 37% 100% Average Rate Site Traffic based on Average Equation Rate Site Traffic based on Equation Transit %age 5% 5% 5% 5% 5% 5% Less Trips for Transit Total Trips Directional Distribution 25% 75% 100% 63% 37% 100% Average Rate Site Traffic based on Average Equation Rate Site Traffic based on Equation Transit %age 5% 5% 5% 5% 5% 5% Less Trips for Transit Total Trips Directional Distribution 25% 75% 100% 63% 37% 100% Average Rate Site Traffic based on Average Equation Rate Site Traffic based on Equation Transit %age 5% 5% 5% 5% 5% 5% Less Trips for Transit Total Trips
17 Strasburg Road Extension Rush Meadow Street to New Dundee Road City of Kitchener Final Traffic Report for the Class EA TAZ OP08/07 /S/KA & ZC08/26 /S/KA West of Strasburg (500 Units) Total 4941 Units Horizon Year 2031 Residential Development Weekday AM Peak Hour Weekday PM Peak Hour In Out 2-way In Out 2-way Directional Distribution 25% 75% 100% 63% 37% 100% Average Rate Site Traffic based on Average Equation Rate Site Traffic based on Equation Transit %age 5% 5% 5% 5% 5% 5% Less Trips for Transit Total Trips Net New Trips 855 2,530 3,385 2,585 1,520 4,105 Table 2.4: 2031 Additional Non-Residential Development Trips TAZ 20b Retail/ Commercial Development (GFA 89,000 ft 2 ) 20c Business Park (GFA 194,000 ft 2 ) 20f Business Park (GFA 103,000 ft 2 ) Sub-Total Horizon Year 2031 Weekday AM Peak Hour Weekday PM Peak Hour Non-Residential Development In Out 2-way In Out 2-way Directional Distribution 60% 40% 100% 50% 50% 100% Average Rate Site Traffic based on Average Equation Rate Site Traffic based on Equation Synergy %age 50% 50% 50% 40% 40% 40% Less Trips for Synergy Transit %age 5% 5% 5% 5% 5% 5% Less Trips for Transit Total Trips Directional Distribution 85% 15% 100% 22% 78% 100% Average Rate Site Traffic based on Average Equation Rate Site Traffic based on Equation Synergy %age 50% 50% 50% 50% 50% 50% Less Trips for Synergy Transit %age 5% 5% 5% 5% 5% 5% Less Trips for Transit Total Trips Directional Distribution 85% 15% 100% 22% 78% 100% Average Rate Site Traffic based on Average Equation Rate Site Traffic based on Equation Synergy %age 50% 50% 50% 50% 50% 50% Less Trips for Synergy Transit %age 5% 5% 5% 5% 5% 5% Less Trips for Transit Total Trips Net New Trips
18 Strasburg Road Extension Rush Meadow Street to New Dundee Road City of Kitchener Final Traffic Report for the Class EA Retail/ Commercial (32,000 ft 2 ) Office (32,000 ft 2 ) Hotel (190 Rooms) Horizon Year 2031 Weekday AM Peak Hour Weekday PM Peak Hour Conestoga Developments In Out 2-way In Out 2-way Directional Distribution 60% 40% 100% 50% 50% 100% Average Rate Site Traffic based on Average Equation Rate Site Traffic based on Equation Synergy %age 50% 50% 50% 50% 50% 50% Less Trips for Synergy Transit %age 5% 5% 5% 5% 5% 5% Less Trips for Transit Total Trips Directional Distribution 88% 12% 100% 17% 83% 100% Average Rate Site Traffic based on Average Equation Rate Site Traffic based on Equation Synergy %age 50% 50% 50% 50% 50% 50% Less Trips for Synergy Transit %age 5% 5% 5% 5% 5% 5% Less Trips for Transit Total Trips Directional Distribution 55% 45% 100% 57% 43% 100% Average Rate Site Traffic based on Average Equation Rate Site Traffic based on Equation Transit %age 5% 5% 5% 5% 5% 5% Less Trips for Transit Total Trips Sub-Total Net New Trips In addition to the developments noted above, this study also considers additional developments included in the Traffic Analysis Report, prepared for Huron Road EA, completed by Sernas in October The additional development zones and their associated trip generations (as given in the Sernas report) are shown below. Table 2.5: 2031 Other Additional Development Trips Additional Developments Weekday AM Peak Hour Weekday PM Peak Hour Zones Size Development Type In Out 2-way In Out 2-way units Residential 25% 75% 100% 63% 37% 100% units Residential 25% 75% 100% 63% 37% 100% , 6, 7 Assumed 50% Built-Out Residential 4, units Commercial 8 64 units Residential 25% 75% 100% 63% 37% 100% % 50% 100% 61% 39% 100% % 75% 100% 63% 37% 100%
19 Strasburg Road Extension Rush Meadow Street to New Dundee Road City of Kitchener Final Traffic Report for the Class EA Additional Developments Weekday AM Peak Hour Weekday PM Peak Hour Development Zones Size In Out 2-way In Out 2-way Type 25% 75% 100% 63% 37% 100% units Residential Assumed 35% Built-Out Residential 14a 105,500 ft 2 Commercial 14b 44 units Residential units Residential units Residential ,000 ft 2 Commercial 18 1,200 units Residential 25% 75% 100% 63% 37% 100% % 50% 100% 61% 39% 100% % 75% 100% 25% 75% 100% % 75% 100% 63% 37% 100% % 75% 100% 63% 37% 100% % 50% 100% 61% 39% 100% % 75% 100% 63% 37% 100% Only the additional development trips generated from Zones 14a 17 (highlighted in the above table) are considered as net additional trips. The other developments are either already included in the 2008 Paradigm report or included in the future background traffic. By totalling the 2031 developments in the Brigadoon and Doon South communities, and the Conestoga College Boulevard area by the east and west sides of Strasburg Road, this study estimates the following in terms of net new trips that will be added to the future area road network, under future traffic conditions: Table 2.6: Total Net Additional Development Trips Horizon 2010 to to 2031 Development Weekday AM Peak Hour Weekday PM Peak Hour Landuse Site In Out 2-way In Out 2-way Residential 420 1,240 1,660 1, ,005 East side of Commercial Strasburg Road Sub-total 420 1,240 1,660 1, ,005 Residential West side of Commercial Strasburg Road Sub-total East + West Total 600 1,780 2,380 1,835 1,070 2,905 Residential 521 1,533 2,054 1, ,595 East side of Commercial Strasburg Road Sub-total 927 1,824 2,751 2,134 1,432 3,566 West side of Strasburg Road Residential 370 1,105 1,475 1, ,705 Commercial Sub-total 370 1,105 1,475 1, ,705 East + West Total 1,297 2,929 4,226 3,209 2,062 5, to 2031 East + West Overall Total 1,897 4,709 6,606 5,044 3,132 8,176 12
20 Strasburg Road Extension Rush Meadow Street to New Dundee Road City of Kitchener Final Traffic Report for the Class EA 2.4 Development Trip Distribution The site trip distribution was developed based on available information from the referenced Traffic Impact Study report. The site trip distribution is summarized in the table below: Table 2.7: Weekday Peak Hour Trip Distribution Directions Weekday AM Peak Hour Weekday PM Peak Hour IN OUT IN OUT North 25% 40% 40% 25% Northwest 30% 20% 20% 30% East 35% 30% 30% 35% Southwest/ Southeast 10% 10% 10% 10% Total 100% 100% 100% 100% Figures 2.4 and 2.5 illustrate the above site trip distributions on the surrounding area road network and with respect to the trips originating from the proposed developments, located to the west and east of Strasburg Road respectively. 13
21 Strasburg Road Extension Rush Meadow Street to New Dundee Road City of Kitchener Final Traffic Report for the Class EA Figure 2.4: West Development Trip Distribution 14
22 Strasburg Road Extension Rush Meadow Street to New Dundee Road City of Kitchener Final Traffic Report for the Class EA Figure 2.5: East Development Trip Distribution Note: Percentages shown are related to the east development traffic using Strasburg Road only. 15
23 Strasburg Road Extension Rush Meadow Street to New Dundee Road City of Kitchener Final Traffic Report for the Class EA 2.5 Development Trip Assignments Based on the site trip distribution parameters above and by also using the assumptions below, the development trips were assigned onto the Strasburg Road study area intersections. The assumptions with respect to the trip assignment are as follows: For the proposed developments located to the west of Strasburg Road, a fixed portion of approximately 15% of the net new trips onto Strasburg Road will be accessed via Rockcliffe Drive and the other 85% will be accessed via the north entrance on Huron Road. Whereas, for the proposed developments located to the east of Strasburg Road, a gravity model is employed based on an inverse relationship to the average daily distance travelled, to estimate the portion of the net new trips that will be using the Strasburg Road for access. Moreover, for trips originating in developments east of Strasburg Road, it was assumed that these trips would be split 20% along Biehn Drive, 40% along Robert Ferrie Drive, and 40% along Blair Creek Drive. 2.6 Future Base Traffic Forecast The 2008 traffic volumes during the weekday morning and afternoon peak hours at the existing study area intersections were extracted from the turning volumes reported in the Paradigm report. The 2008 traffic volumes were applied with a growth rate of 1% per annum to update the traffic turning volumes to Based on the latest land use around Strasburg Road and south of Huron Road, no significant change in the traffic turning volumes is anticipated, other than the background corridor growth. Figure 2.6 illustrates the latest traffic volumes (2010) during the weekday morning and afternoon peak hours, respectively at all the intersections within the vicinity of the study area. 16
24 Strasburg Road Extension Rush Meadow Street to New Dundee Road City of Kitchener Final Traffic Report for the Class EA Figure 2.6: Estimated 2010 Traffic Volumes 17
25 Strasburg Road Extension Rush Meadow Street to New Dundee Road City of Kitchener Final Traffic Report for the Class EA Upon completion of this project, it is anticipated that traffic will be diverted from the existing road network (i.e., from Huron Road Homer Watson Boulevard onto the extended Strasburg Road) to use the new Strasburg Road. The amount of traffic diversion was estimated from the Regional Transportation Model and was included in the future background traffic conditions on Strasburg Road. The same traffic growth rate of 1% per annum was also applied to estimate the background traffic volumes during the weekday peak hours under future background traffic conditions for 2016 and Moreover, the forecast total traffic volumes under the 2016 and 2031 horizon years were estimated by adding the future background volumes and the net additional development volumes for all of the intersections on Strasburg Road (i.e., from Rush Meadow Road to New Dundee Road). Figures 2.7 and 2.8 illustrate the future total traffic volumes with the Official Plan alignment scenario by 2016 and
26 Strasburg Road Extension Rush Meadow Street to New Dundee Road City of Kitchener Final Traffic Report for the Class EA Rush Meadow Street Rush Meadow Street Rockcliffe Drive Rockcliffe Drive Biehn Drive Biehn Drive Robert Ferrie Drive Robert Ferrie Drive Blair Creek Drive Blair Creek Drive New Dundee Road New Dundee Road Weekday AM Peak Hour 2016 Weekday PM Peak Hour Figure 2.7: Estimated 2016 Traffic Volumes 19
27 Strasburg Road Extension Rush Meadow Street to New Dundee Road City of Kitchener Final Traffic Report for the Class EA Rush Meadow Street Rush Meadow Street Rockcliffe Drive Rockcliffe Drive Biehn Drive Biehn Drive Robert Ferrie Drive Robert Ferrie Drive Blair Creek Drive Blair Creek Drive New Dundee Road New Dundee Road Weekday AM Peak Hour 2031 Weekday PM Peak Hour Figure 2.8: Estimated 2031 Traffic Volumes 20
28 Strasburg Road Extension Rush Meadow Street to New Dundee Road City of Kitchener Final Traffic Report for the Class EA 3.0 TRAFFIC IMPACT ASSESSMENT 3.1 Short List of Alignment Alternatives Five alternative alignments for the Strasburg Road Extension (South Section), which have been deviated from the Official Plan alignment, were shortlisted for consideration by the City. Key features of these five shortlisted alternative alignments are described below, and their respective alignments are illustrated in Figure 3.1. Alignment Option E2 Diverges from the Official Plan alignment at the north end of the farm, bed & breakfast, and conference centre at 500 Stauffer Drive Skirts east of farm/bed & breakfast operation pond and west of Stauffer Woods (ESPA 33) Connects to Reidel Drive 325 m south of Stauffer Drive to preserve Scenic-Heritage section of Reidel Drive designated as part of the Doon South trail system Generally avoids direct impact with agricultural operation at 271 Reidel Drive and uses existing New Dundee/Reidel Drive intersection Alignment Option E3 Diverges from the Official Plan alignment at the north end of the farm, bed & breakfast, and conference centre at 500 Stauffer Drive Skirts east of farm/bed & breakfast operation pond and west of Stauffer Woods (ESPA 33) Crosses narrow point of Blair Swamp PSW Connects to New Dundee Road 260 m west of Reidel Drive with a new intersection Alignment Option E4 Diverges from the Official Plan alignment at the north end of the farm, bed & breakfast, and conference centre at 500 Stauffer Drive Skirts east of farm/bed & breakfast operation pond and west of Stauffer Woods (ESPA 33) Crosses narrow point of Blair Swamp PSW Swings east behind farm buildings at 271 Reidel Drive Intersects New Dundee Road at an angle compatible with opposing Cameron Road leg Alignment Option C2 Diverges from the Official Plan alignment at the north end of the farm, bed & breakfast, and conference centre at 500 Stauffer Drive Coincident with Lot 9/Lot 14 Concession BT property line to south limit of the farm/bed & breakfast operation Connects to Reidel Drive corridor 625 m south of Stauffer Drive, avoids direct impact with agricultural operations at 271 Reidel Drive and uses existing New Dundee/Reidel Drive intersection Alignment Option W1 Diverges from the Official Plan alignment at the north end of the farm, bed & breakfast, and conference centre at 500 Stauffer Drive Skirts west of most significant groundwater recharge area and upper Blair Creek corridor Coincident with west boundary of lands in Lot 5 Con BNS New intersection with New Dundee Road 730 m west of existing Reidel Drive intersection 21

29 Strasburg Road Extension Rush Meadow Street to New Dundee Road City of Kitchener Final Traffic Report for the Class EA Figure 3.1: Shortlisted Alternative Alignments for the Strasburg Road Extension 3.2 Traffic Infiltration The following table illustrates the average daily travel distances assumed in the gravity model for an estimated portion of the net new trips generated by the developments east of Strasburg Road, using the road for access under the five shortlisted alignment options. 22
30 Strasburg Road Extension Rush Meadow Street to New Dundee Road City of Kitchener Final Traffic Report for the Class EA Table 3.1: Estimated Percentages of East Development Trips Using Strasburg Road Destinations AM Outbound Percent Distribution Not using Strasburg Road Average Daily Travel Distance (m) Using Strasburg Road E2/E4 E3 C2 W1 % of East Development Trips Using Strasburg Road E2/E4 E3 C2 W1 To North (Downtown Kitchener) To Northwest (City of Waterloo) To East (City of Cambridge) To Southwest/ Southeast (Hwy 401) 40% 12,400 13,200 13,720 13,720 14,660 44% 41% 41% 36% 20% 14,200 15,960 16,480 16,480 17,420 40% 37% 37% 33% 30% 13,500 19,700 20,220 20,220 21,160 24% 22% 22% 20% 10% 7,250 7,540 8,060 8,060 9,000 46% 41% 41% 32% Weighted Average 37% 35% 35% 30% One of the major impacts of the W1 alignment is expected to be an increase in traffic infiltration through the existing Brigadoon and Doon South road network. As can be estimated from above, about 7% of the net new trips originating from developments to the east of Strasburg Road will be redistributed and infiltrated through the existing neighbourhood roads due to the W1 alignment shift. To gain a more precise understanding of the traffic infiltration impact on the existing neighbourhood streets and intersections, further traffic studies should be undertaken in greater detail. In addition, the W1 alignment is not supported by the transit catchment perspective. In the eastern alignment options, a reduction of about 5% in the total net development trips was assumed due to transit use. Under W1, the above reduction in auto trips by using transit may not be applied and the resulting additional auto trips will be infiltrated into the surrounding road network. The following table estimates the total amount of reduced auto trips (in AADT) by using transit. Table 3.2: Estimated Traffic Infiltration of East Development Trips Under W1 Alignment Horizon Year 2031 AM Peak Hour PM Peak Hour Throughout the Weekday Net New Trips Originating From Developments to the East of Strasburg Road 7% of the Net New Trips Originating From Developments to the East of Strasburg Road being redistributed due to the alignment shift in W1 4,411 5,571 49, ,495 Reduced auto trips due to transit use ,600 Total estimated AADT of the Infiltration Volumes through Brigadoon and Doon South Areas 7,095 23
31 Strasburg Road Extension Rush Meadow Street to New Dundee Road City of Kitchener Final Traffic Report for the Class EA The table above summarizes the additional daily traffic volumes (in vehicle trips) that are expected to infiltrate through the existing community road area network. With the W1 alignment, approximately 7,100 additional AADT trips will tend to shortcut through the existing road area network. With such high traffic volumes making its way through the neighbourhood road system, it is expected that there will be a significant impact on traffic operations for the internal road area network intersections. With an increase in infiltration volumes, there may be a potential increase in the number of collisions at the existing neighbourhood intersections, since collision rates are proportional to the average daily traffic volumes. Moreover, with additional congestion from higher volumes of turning traffic, there may be increases in greenhouse gas emissions. Based on the existing area road network within the Brigadoon Community and existing/future road area network within the Doon South Community, it is likely that the additional infiltration volumes would travel primarily via Caryndale Drive-Biehn Drive, Robert Ferrie Drive-Doon South Drive-Doon Mills Drive and Doon Village Road, which will affect a number of internal road area intersections. Taking into account the above considerations, the W1 alignment was eliminated from the subsequent intersection analysis since it is not preferred from the transit service viewpoint and does not support the necessary traffic and municipal services for the approved development and future growth at the Doon South and southwest Kitchener areas. 3.3 Average Annual Daily Traffic (AADT) Volumes The 2016 and 2031 AADT volumes on each section of Strasburg Road and surrounding roads with respect to the various alignment options are shown in Table 3.3 to Table 3.6 below. The predicted intersection turning volumes translate to AADT two-way volumes on the Strasburg Road Extension ranging from 11,800 to 12,400 in 2016, and from 18,400 to 21,200 in 2031 with the shortlisted alignment E2/E4, which is similar to the current Kitchener Municipal Official Plan alignment. 24
32 Strasburg Road Extension Rush Meadow Street to New Dundee Road City of Kitchener Final Traffic Report for the Class EA Rockcliffe Drive Biehn Drive n/a n/a 11,410 19,100 11,890 20,380 11,890 20,380 12,190 21,220 Biehn Drive Robert Ferrie Drive n/a n/a 11,160 18,420 11,590 19,610 11,590 19,610 11,880 20,380 Robert Ferrie Drive Blair Creek Drive n/a n/a 11,780 18,360 12,140 19,370 12,140 19,370 12,380 20,010 Blair Creek Drive New Dundee Road 1,130 1,310 11,270 17,010 11,560 17,820 11,560 17,820 11,760 18,350 East of Cameron Road 4,780 5,550 10,260 17,410 10,390 17,760 10,390 17,760 10,480 18,000 East of Strasburg Road 4,780 5,550 19,000 28,870 10,390 17,760 19,210 29,440 10,480 18,000 West of Strasburg Road 6,280 7,290 8,160 12,580 8,070 12,330 8,070 12,330 8,020 12,170 South of New Dundee Road 2,730 3,170 9,150 11,930 9,230 12,140 9,230 12,140 9,270 12,270 Table 3.3: AADT Volumes on Strasburg Road Strasburg Road No Strasburg Road Extension Western Alignment (W1) Central Alignment (C2) Central Alignment (E3) Eastern Alignment (E2 & E4) Table 3.4: AADT Volumes on New Dundee Road New Dundee Road No Strasburg Road Extension Western Alignment (W1) Central Alignment (C2) Central Alignment (E3) Eastern Alignment (E2 & E4) Table 3.5: AADT Volumes on Cameron Road Cameron Road No Strasburg Road Extension Western Alignment (W1) Central Alignment (C2) Central Alignment (E3) Eastern Alignment (E2 & E4)
33 Strasburg Road Extension Rush Meadow Street to New Dundee Road City of Kitchener Final Traffic Report for the Class EA Robert Ferrie Drive n/a n/a 3,350 7,360 3,650 8,200 3,650 8,200 3,850 8,740 Blair Creek Drive n/a n/a 2,220 6,050 2,530 6,890 2,530 6,890 2,730 7,440 Table 3.6: AADT Volumes on access to Strasburg Road Access to Strasburg Road No Strasburg Road Extension Western Alignment (W1) Central Alignment (C2) Central Alignment (E3) Eastern Alignment (E2 & E4)
34 Strasburg Road Extension Rush Meadow Street to New Dundee Road City of Kitchener Final Traffic Report for the Class EA 4.0 INTERSECTION ANALYSIS 4.1 Signal Warrant Analysis A high level signal warrant analysis using the future traffic volumes has been conducted for all the new intersections. A summary of the signal warrant analysis for these new intersections is shown in Table 4.1. Table 4.1: Summary of Signal Warrant Analysis Intersections Signal Warranted? Rockcliffe Drive/Strasburg Road Not warranted up to year 2031 Biehn Drive/Strasburg Road Not warranted up to year 2031 Robert Ferrie Drive/Strasburg Road Blair Creek Drive/Strasburg Road New Dundee Road/Strasburg Road Warranted as soon as Strasburg Road is opened Warranted as soon as Strasburg Road is opened Warranted as soon as Strasburg Road is opened Table 4.1 indicates that three of the new intersections: Robert Ferrie Drive/Strasburg Road, Blair Creek Drive/Strasburg Road and New Dundee Road/Strasburg Road would warrant a signal control by the opening of the Strasburg Road extension. Figures 4.1 to 4.3 illustrate the conceptual layouts for these three signalized intersections respectively. 27
35 Strasburg Road Extension Rush Meadow Street to New Dundee Road City of Kitchener Final Traffic Report for the Class EA Figure 4.1: Conceptual Signal Control Layout at Strasburg Road/Robert Ferrie Drive 28
36 Strasburg Road Extension Rush Meadow Street to New Dundee Road City of Kitchener Final Traffic Report for the Class EA Figure 4.2: Conceptual Signal Control Layout at Strasburg Road/Blair Creek Drive 29
37 Strasburg Road Extension Rush Meadow Street to New Dundee Road City of Kitchener Final Traffic Report for the Class EA Figure 4.3: Conceptual Signal Control Layout at Strasburg Road/New Dundee Road 30
38 Strasburg Road Extension Rush Meadow Street to New Dundee Road City of Kitchener Final Traffic Report for the Class EA For the other two intersections: Rockcliffe Drive/Strasburg Road and Biehn Drive/Strasburg Road, the following intersection configurations are assumed: Rockcliffe Drive/Strasburg Road Intersection A left turn lane and two thru lanes on Strasburg Road northbound approach A thru lane and a shared thru/right turn lane on Strasburg Road southbound approach A left turn lane and an exclusive right turn lane from Rockcliffe eastbound onto Strasburg Road with storage and taper lengths One-way stop control on Rockcliffe eastbound Biehn Drive/Strasburg Road Intersection A thru lane and a shared thru/left turn lane on Strasburg Road southbound A thru lane and a shared thru/right turn lane on Strasburg Road northbound A shared left/right turn lane from Biehn Drive westbound onto Strasburg Road One-way stop control on Biehn Drive westbound 4.2 Sightline Issues on New Dundee Road The currently proposed intersection between New Dundee Road and Strasburg Road is located at a hill crest when approaching New Dundee Road westbound. A combination between the hill crest and vehicles traveling at high speed on New Dundee Road creates an unsafe condition and a sight line issue for drivers exiting from Cameron Road and Reidel Drive. The posted speed limit on New Dundee Road is 80 km/h. Figures 4.4 and 4.5 show the sightline at New Dundee Road from the westbound and eastbound approaches respectively. Alignment option E3 proposes that the Strasburg Road be connected to New Dundee Road at about 260 metres west of the existing Reidel Drive with a new intersection in order to improve the sightline issue at the current intersection location. As such, two potential options for this E3 alignment connection at New Dundee Road: a staggered signal control layout for New Dundee Road/Strasburg Road and New Dundee/Cameron Road and a new 4-leg signal control layout by also shifting Cameron Road to the west are also included in Figures 4.6 and 4.7 for illustration purposes. As an alternative, the existing vertical profile on New Dundee Road would have to be modified if the future intersection is to be stayed at the current location in the cases for Alignment Options E2, E4, and C2. Figure 4.8 shows the current vertical profile on New Dundee Road whereas Figure 4.9 shows the modified vertical profile in order to satisfy the minimum sight distance requirement. 31


39 Strasburg Road Extension Rush Meadow Street to New Dundee Road City of Kitchener Final Traffic Report for the Class EA Intersection at hill crest New Dundee Road Figure 4.4: View at New Dundee Road from Westbound Approach Cameron Road Reidel Drive New Dundee Road Figure 4.5: View at New Dundee Road from Eastbound Approach 32
40 Strasburg Road Extension Rush Meadow Street to New Dundee Road City of Kitchener Final Traffic Report for the Class EA Figure 4.6: Conceptual Staggered Signal Control Layout at Strasburg Road/New Dundee Road/Cameron Road (Illustrative purposes for E3 Alignment only) 33
41 Strasburg Road Extension Rush Meadow Street to New Dundee Road City of Kitchener Final Traffic Report for the Class EA Figure 4.7: Conceptual Shifted Signal Control Layout at Strasburg Road/New Dundee Road/Cameron Road (Illustrative purposes for E3 Alignment only) 34
42 Strasburg Road Extension Rush Meadow Street to New Dundee Road City of Kitchener Final Traffic Report for the Class EA Figure 4.8: New Dundee Road Profile for Signalized Intersection Option (without correction) 35
43 Strasburg Road Extension Rush Meadow Street to New Dundee Road City of Kitchener Final Traffic Report for the Class EA Figure 4.9: New Dundee Road Profile for Signalized Intersection Option (with correction) 36
44 Strasburg Road Extension Rush Meadow Street to New Dundee Road City of Kitchener Final Traffic Report for the Class EA 4.3 Initial Screening Analysis The Region of Waterloo requires that an initial roundabout screening analysis be completed prior to any road improvements required as a result of the Strasburg Road connection. As such, an initial roundabout screening analysis has been conducted for each of the above three signal warranted intersections. The intent of the initial roundabout screening analysis is to provide a relatively quick feasibility assessment of a modern roundabout at a particular intersection in comparison to other appropriate forms of traffic control or road improvements. The intended outcome of this tool is to provide enough information to assist the Region in deciding whether or not to proceed with an intersection control study to further investigate the feasibility of a roundabout. The initial roundabout screening analysis requires a comparison of the 20 year life-cycle costs between a roundabout option and, in this case, a signal control option for the above three signal warranted intersections. The 20 year life-cycle cost is the sum of the implementation cost and the 20 year injury collision cost related to the type of intersection control and discounted into a present value. The following assumptions were used when calculating the 20 year injury collision costs for the concerned intersections. Table 4.2: 20 Year Injury Collision Cost Assumptions Item Value Injury Collision Cost $30,000 Discount Rate 6% Average Injury Collision Rate for Signal Control Intersection 0.11 collisions/mve with AADT entering volumes between 20,001 and 25,000 for a 3-leg intersection 0.14 collisions/mve with AADT entering volumes greater than 25,000 for a 3-leg intersection 0.22 collisions/mve with AADT entering volumes greater than 25,000 for a 4-leg intersection Ratio of Annual Injury Collision Frequency for a versus a Signal Control Intersection 25% Table 4.3 and Table 4.4 summarize respectively the 20 year life-cycle cost comparisons between a roundabout option and a signal control option for the Robert Ferrie Drive/Strasburg Road and Blair Creek Drive/Strasburg Road intersections. Table 4.3: 20 Year Life-Cycle Cost Comparison - Robert Ferrie Drive/Strasburg Road Cost Item Signal Control Implementation Cost $3.08 million $3.66 million Injury Collision Cost (Present Value) $340,000 $85,000 Total Life Cycle Cost $3.42 million $3.75 million 37
45 Strasburg Road Extension Rush Meadow Street to New Dundee Road City of Kitchener Final Traffic Report for the Class EA Table 4.4: 20 Year Life-Cycle Cost Comparison Blair Creek Drive/Strasburg Road Cost Item Signal Control Implementation Cost $1.47 million $1.78 million Injury Collision Cost (Present Value) $320,000 $80,000 Total Life Cycle Cost $1.79 million $1.86 million As shown in Table 4.3 and Table 4.4, both intersections have similar 20 year life-cycle costs for a signal control and a roundabout option. In both cases, the roundabout option has a slightly higher life-cycle cost than a signal control by a ratio of less than 1.1. As a result, the City may wish to consider implementing a roundabout at these two intersections. Conceptual roundabout layouts for these two intersections were developed and are included in Figure 4.10 and Figure Final design details of these two roundabouts should be reviewed during the detailed design stage. 38
46 Strasburg Road Extension Rush Meadow Street to New Dundee Road City of Kitchener Final Traffic Report for the Class EA Figure 4.10: Conceptual Layout at Strasburg Road/Robert Ferrie Drive 39
47 Strasburg Road Extension Rush Meadow Street to New Dundee Road City of Kitchener Final Traffic Report for the Class EA Figure 4.11: Conceptual Layout at Strasburg Road/Blair Creek Drive 40
48 Strasburg Road Extension Rush Meadow Street to New Dundee Road City of Kitchener Final Traffic Report for the Class EA Due to the existing sightline issue for the New Dundee Road/Strasburg Road intersection, numerous options have been developed in attempt to mitigate this issue. The pros and cons together with the 20 year life-cycle cost comparisons for all of the potential options developed for this intersection are summarized in Table 4.5. As can be seen from Table 4.5, the roundabout options have the lowest total life-cycle cost than the other signal control options which suggests that a roundabout might also be an attractive option for this location. However, because of the hill crest location at New Dundee Road/Strasburg Road, it may be difficult for drivers to appreciate the roundabout layout when approaching on an upward gradient. Considerations should be given to install some raised chevron signs and landscaping at the centre of the roundabout. Since New Dundee Road falls under the jurisdiction of the Region of Waterloo, the feasibility of implementing a roundabout at this intersection should also be discussed with the Region and be considered in more detail. Two conceptual roundabout layouts for this intersection were developed and are included in Figure 4.12 and Figure The vertical profile in association with the roundabout design is also shown in Figure Final design details of this roundabout would need to be reviewed during the detailed design stage. 41
49 Strasburg Road Extension Rush Meadow Street to New Dundee Road City of Kitchener Final Traffic Report for the Class EA This page intentionally left blank 42
50
51 Strasburg Road Extension Rush Meadow Street to New Dundee Road City of Kitchener Final Traffic Report for the Class EA Table 4.5: Summary of Pros and Cons and the 20 Year Life-Cycle Cost Comparisons for the Various Intersection Control Options at Strasburg Road/New Dundee Road Option Pros Cons Implementation Cost (2012 Value) Injury Collision Cost (2012 Value) 20 Year Life-Cycle Cost (2012 Value) Option A (without reverse curve approach design) Option B (with reverse curve approach design) 4-Leg Signal Control (at current intersection location) Staggered Signal Control 4-Leg Signal Control (shifted to the west by about 200 metres from the current intersection location) Fewer injury collision rate than a signal control Less delays and better LOS performance than a signal control, especially during off-peaks Consistent with the initiative of implementing roundabouts at the other two new intersections on Strasburg Road Drivers in the area are more familiar with this roundabout design Fewer injury collision rate than a signal control Less delays and better LOS performance than a signal control, especially during off-peaks Consistent with the initiative of implementing roundabouts at the other two new intersections on Strasburg Road The reverse curve approaches would help to restrict the vehicle speed in entering the roundabout Less conflict movements and thus less traffic delays than two staggered intersections Minimal property impact A more economic solution if the Region considers having an EB left turn signal would be acceptable as an alternative measure to the vertical profile correction The minimum decision sight distance requirement is achieved by having the intersection shifted to the west by approximately 200 metres The minimum decision sight distance requirement is achieved by having the intersection shifted to the west by approximately 200 metres Less conflict movements and thus less traffic delays than two staggered intersections Since the roundabout is located at the hill crest, some special treatments to increase the visibility of the roundabout centre island would be required such as by providing raised chevron, signs and appropriate landscaping (costs included) Drivers may not necessarily reduce the speed of their vehicles before entering the roundabout Since the roundabout is located at the hill crest, some special treatments to increase the visibility of the roundabout centre island would be required such as by providing raised chevron, signs and appropriate landscaping (costs included) Drivers in the area may not be familiar with the reverse curve approach design for the roundabout Higher injury collision rate than a roundabout A vertical profile correction is required in order to achieve the minimum decision sight distance requirement An EB left turn signal phase is required in the case of no vertical profile correction The introduction of an EB left turn signal phase means that it will reduce the green time for the critical WB movement during the peak hours Higher injury collision rate than a roundabout as well as a 4- leg signal control intersection Not preferred from traffic operational viewpoint as two staggered intersections will create additional conflict movements and thus traffic delays than a single 4-leg intersection The close intersection spacing does not permit signal progression and hence, traffic mobility cannot be optimized Having the intersection shifted by 200 metres means that the Strasburg Road alignment would also have to be shifted which makes it less supportive from transit catchment perspective Additional costs will be incurred due to the shifting of Strasburg Road alignment Higher injury collision rate than a roundabout Significant property impact Additional costs will be incurred due to the shifting of both Strasburg Road and Cameron Road alignments The most costly option among the others $3,000,000 $210,000 $3,210,000 $3,000,000 (assumed having a similar order as Option A) $2,900,000 with vertical profile correction $2,500,000 without vertical profile correction $210,000 $3,210,000 $840,000 $3,740,000 with vertical profile correction $3,340,000 without vertical profile correction $4,400,000 $1,050,000 $5,450,000 $6,900,000 $840,000 $7,740,000 43
52 Strasburg Road Extension Rush Meadow Street to New Dundee Road City of Kitchener Final Traffic Report for the Class EA This page intentionally left blank 44
53 Strasburg Road Extension Rush Meadow Street to New Dundee Road City of Kitchener Final Traffic Report for the Class EA Figure 4.12: Conceptual Layout at Strasburg Road/New Dundee Road (Option A) 45
54 Strasburg Road Extension Rush Meadow Street to New Dundee Road City of Kitchener Final Traffic Report for the Class EA Figure 4.13: Conceptual Layout at Strasburg Road/New Dundee Road (Option B) 46
55 Strasburg Road Extension Rush Meadow Street to New Dundee Road City of Kitchener Final Traffic Report for the Class EA Figure 4.14: New Dundee Road Profile for Option 47
56 Strasburg Road Extension Rush Meadow Street to New Dundee Road City of Kitchener Final Traffic Report for the Class EA 4.4 Intersection Performance Analysis Evaluation of the performance measures for the above new intersections has been completed under future traffic conditions in 2016 and For the intersections at Rockcliffe Drive/Strasburg Road and Biehn Drive/Strasburg Road, it was determined that a signal control would not be warranted up to the 2031 traffic conditions and hence, these two intersections are assumed to be operated with a one-way stop control on the side legs. For the intersections at Robert Ferrie Drive/Strasburg Road, Blair Creek Drive/Strasburg Road and New Dundee Road/Strasburg Road, since a signal control would be warranted by the opening of the Strasburg Road extension, evaluation of the performance measures for each of these three intersections will be conducted for both signal control and roundabout options. Analysis of the unsignalized and signalized intersections were undertaken using the procedure set out by the Highway Capacity Manual (HCM 2000), with the assistance of the Synchro, Version 7 - Trafficware Traffic Signal Timing software package. The intersection operation is typically described based on Level of Service (LOS) ratings that are expressed on a scale of A to F, where A is considered excellent (i.e., very little delay) and F is considered unacceptable (i.e., very congested, very long delays), as outlined below. Table 4.6: Level of Service Description LEVEL OF SERVICE Signalized Intersection Delay Unsignalized Intersection Delay A 10 sec 10 sec B sec sec C sec sec D sec sec E sec sec F 80 sec 50 sec The roundabout controlled intersections were analyzed using the Sidra Version 5.0 software package, which evaluates delay and LOS based on the HCM methodology. The performance measures of the intersections for the horizon years of 2016 and 2031 are summarized respectively in the tables below. The detailed output results are provided in APPENDIX A: CAPACITY ANALYSIS RESULTS. 48
57 Strasburg Road Extension Rush Meadow Street to New Dundee Road City of Kitchener Final Traffic Report for the Class EA TABLE 4.7: CAPACITY ANALYSIS RESULTS UNSIGNALIZED INTERSECTIONS FUTURE TRAFFIC CONDITIONS (2016) Intersections Weekday AM Peak Hour 2016 Weekday PM Peak Hour 2016 V/C Ratio Average Delay (s) Level of Service (LOS) V/C Ratio Average Delay (s) Level of Service (LOS) Strasburg Road /Rockcliffe Drive Overall A B EB Shared LT- RT Strasburg Road/Biehn Drive B B Overall A A WB Shared LT- RT B B TABLE 4.8: CAPACITY ANALYSIS RESULTS UNSIGNALIZED INTERSECTIONS FUTURE TRAFFIC CONDITIONS (2031) Intersections Weekday AM Peak Hour 2031 Weekday PM Peak Hour 2031 V/C Ratio Average Delay (s) Level of Service (LOS) V/C Ratio Average Delay (s) Level of Service (LOS) Strasburg Road /Rockcliffe Drive Overall A B EB Shared LT- RT C E Strasburg Road/Biehn Drive Overall C E WB Shared LT- RT D D TABLE 4.9: CAPACITY ANALYSIS RESULTS SIGNALIZED INTERSECTIONS FUTURE TRAFFIC CONDITIONS (2016) Weekday AM Peak Hour 2016 Weekday PM Peak Hour 2016 Intersections Max V/C Ratio Average Delay (s) Level of Service (LOS) Max V/C Ratio Average Delay (s) Level of Service (LOS) Strasburg Road/Robert Ferrie Drive B A Strasburg Road /Blair Creek Drive A A Strasburg Road /New Dundee Road B B 49
58 Strasburg Road Extension Rush Meadow Street to New Dundee Road City of Kitchener Final Traffic Report for the Class EA TABLE 4.10: CAPACITY ANALYSIS RESULTS SIGNALIZED INTERSECTIONS FUTURE TRAFFIC CONDITIONS (2031) Weekday AM Peak Hour 2031 Weekday PM Peak Hour 2031 Intersections Max V/C Ratio Average Delay (s) Level of Service (LOS) Max V/C Ratio Average Delay (s) Level of Service (LOS) Strasburg Road/Robert Ferrie Drive B C Strasburg Road /Blair Creek Drive B B Strasburg Road /New Dundee Road B C TABLE 4.11: CAPACITY ANALYSIS RESULTS ROUNDABOUT INTERSECTIONS FUTURE TRAFFIC CONDITIONS (2016) Intersections Weekday AM Peak Hour 2016 Max V/C Ratio Average Delay (s) Level of Service (LOS) Weekday PM Peak Hour 2016 Max V/C Ratio Average Delay (s) Level of Service (LOS) Strasburg Road/Robert Ferrie Drive A A Strasburg Road /Blair Creek Drive A A Strasburg Road /New Dundee Road A B TABLE 4.12: CAPACITY ANALYSIS RESULTS ROUNDABOUT INTERSECTIONS FUTURE TRAFFIC CONDITIONS (2031) Intersections Weekday AM Peak Hour 2031 Max V/C Ratio Average Delay (s) Level of Service (LOS) Weekday PM Peak Hour 2031 Max V/C Ratio Average Delay (s) Level of Service (LOS) Strasburg Road/Robert Ferrie Drive B A Strasburg Road /Blair Creek Drive A A Strasburg Road /New Dundee Road B C 50
59 Strasburg Road Extension Rush Meadow Street to New Dundee Road City of Kitchener Final Traffic Report for the Class EA 5.0 Summary of Findings The study undertaken for this project was to assess a feasible alternative to the current Official Plan alignment that may significantly reduce the environmental impact of the project. In doing so, five alternative alignments which have been deviated from the Official Plan alignment, were selected and shortlisted for consideration by the City. Because the alternative routes differed in alignment, an analysis was required to determine the vehicle demand at the various alternatives. In order to provide a more comprehensive review of vehicle demand for the proposed Strasburg Road, an assumption of two specific horizon years were introduced. These horizon years viewed the areas of proposed developments around the Brigadoon and Doon South communities, as well as areas to the west of the proposed Strasburg Road and south of Huron Road. As well, the specific horizon years viewed the areas at different development phases, which ultimately influenced the vehicle demand for this project. A reduction of about 5% in the total net development trips was assumed in this study due to transit use. However, because the W1 alternative alignment is not supported from the transit catchment perspective, the above reduction in auto trips by using transit may not be applied. Nevertheless, W1 alignment would result in additional auto trips being infiltrated into the surrounding road network. Therefore, the W1 alignment was not preferred from the transit service viewpoint. Also, it does not support the necessary traffic and municipal services for the approved development and future growth at the Doon south and southwest Kitchener areas. Alignment Option E3 proposes that the Strasburg Road be connected to New Dundee Road at about 260 metres west of the existing Reidel Drive with a new intersection in order to improve the sightline issue at the current intersection location. The current proposed intersection between New Dundee Road and Strasburg Road is located at a hill crest when approaching New Dundee Road westbound. A combination between the hill crest and vehicles traveling at 80km/hr on New Dundee Road creates an unsafe condition and a sight line issue for drivers exiting from Cameron Road and Reidel Drive. As such, a staggered signal control layout and a 4-leg signal control layout at New Dundee for the shifting alignment of Strasburg Road/Cameron Road were considered. Albeit the minimum decision sight distance requirement is achieved by having the intersection shifted to the west by approximately 260 metres, significant property acquisition costs will be incurred. Having the intersection shifted further to the west means that the Strasburg Road alignment would also have to be shifted which makes it also less supportive from transit catchment perspective. Additional costs will also be incurred due to the shifting of Strasburg Road alignment as both Blair Creek Drive and Robert Ferrie Drive would need to be extended to connect with the future Strasburg Road. Because of that, the E3 alignment was not preferred since it would be more costly than the other eastern alignment options. Taking into account the above considerations, the eastern alignment options, i.e. E2 and E4 are considered more preferable from the traffic and transportation perspective. From the intersection analysis, three of the new intersections to be connected with Strasburg Road at: Robert Ferrie Drive, Blair Creek Drive and New Dundee Road would warrant a signal control by the opening of the Strasburg Road extension. Initial roundabout screenings have also been conducted at these new intersections and results from the initial screenings indicate that a roundabout might be an attractive option at Strasburg Road/Robert Ferrie Drive and Strasburg Road/Blair Creek Drive albeit a signal control at these two intersections would have a lower total life-cycle cost by taking into account the implementation cost and a 20-year injury collision cost. Final design details of these two roundabouts should be reviewed during the detailed design stage. 51
60 Strasburg Road Extension Rush Meadow Street to New Dundee Road City of Kitchener Final Traffic Report for the Class EA For the intersection at New Dundee Road and Strasburg Road, the roundabout options have lower total life-cycle cost than the other signal control options which suggests that a roundabout might also be an attractive option for this location. However, because of the hill crest location at New Dundee Road/Strasburg Road, it may be difficult for drivers to appreciate the roundabout layout when approaching on an up gradient. Considerations should be given to put in some raised chevron signs and landscaping at the centre of the roundabout. Since New Dundee Road falls under the jurisdiction of the Region of Waterloo, the feasibility of implementing a roundabout at this intersection should also be discussed with the Region and be considered in more detail. Final design details of this roundabout would need to be reviewed during the detailed design stage. 52
61 Strasburg Road Extension Rush Meadow Street to New Dundee Road City of Kitchener Final Traffic Report for the Class EA APPENDIX A: CAPACITY ANALYSIS RESULTS 53
62
63 HCM Unsignalized Intersection Capacity Analysis 5: Rockcliffe Drive & Strasburg Road Movement EBL EBR NBL NBT SBT SBR Lane Configurations Sign Control Stop Free Free Grade 0% 0% 0% Volume (veh/h) Peak Hour Factor Hourly flow rate (vph) Pedestrians Lane Width (m) Walking Speed (m/s) Percent Blockage Right turn flare (veh) 4 Median type TWLTL Median storage veh) 2 Upstream signal (m) px, platoon unblocked vc, conflicting volume vc1, stage 1 conf vol 421 vc2, stage 2 conf vol 314 vcu, unblocked vol tc, single (s) tc, 2 stage (s) 5.8 tf (s) p0 queue free % cm capacity (veh/h) Direction, Lane # EB 1 NB 1 NB 2 NB 3 SB 1 SB 2 SB 3 Volume Total Volume Left Volume Right csh Volume to Capacity Queue Length 95th (m) Control Delay (s) Lane LOS B A Approach Delay (s) Approach LOS B Intersection Summary Average Delay 0.9 Intersection Capacity Utilization 26.7% ICU Level of Service A Analysis Period (min) AM Peak Synchro 6 Report SNC Lavalin Page 1
64 HCM Unsignalized Intersection Capacity Analysis 5: Rockcliffe Drive & Strasburg Road Movement EBL EBR NBL NBT SBT SBR Lane Configurations Sign Control Stop Free Free Grade 0% 0% 0% Volume (veh/h) Peak Hour Factor Hourly flow rate (vph) Pedestrians Lane Width (m) Walking Speed (m/s) Percent Blockage Right turn flare (veh) 9 Median type TWLTL Median storage veh) 2 Upstream signal (m) px, platoon unblocked vc, conflicting volume vc1, stage 1 conf vol 773 vc2, stage 2 conf vol 332 vcu, unblocked vol tc, single (s) tc, 2 stage (s) 5.8 tf (s) p0 queue free % cm capacity (veh/h) Direction, Lane # EB 1 NB 1 NB 2 NB 3 SB 1 SB 2 SB 3 Volume Total Volume Left Volume Right csh Volume to Capacity Queue Length 95th (m) Control Delay (s) Lane LOS B A Approach Delay (s) Approach LOS B Intersection Summary Average Delay 0.6 Intersection Capacity Utilization 31.4% ICU Level of Service A Analysis Period (min) PM Peak Synchro 6 Report SNC Lavalin Page 1
65 HCM Unsignalized Intersection Capacity Analysis 5: Rockcliffe Drive & Strasburg Road Movement EBL EBR NBL NBT SBT SBR Lane Configurations Sign Control Stop Free Free Grade 0% 0% 0% Volume (veh/h) Peak Hour Factor Hourly flow rate (vph) Pedestrians Lane Width (m) Walking Speed (m/s) Percent Blockage Right turn flare (veh) 4 Median type TWLTL Median storage veh) 2 Upstream signal (m) px, platoon unblocked vc, conflicting volume vc1, stage 1 conf vol 674 vc2, stage 2 conf vol 584 vcu, unblocked vol tc, single (s) tc, 2 stage (s) 5.8 tf (s) p0 queue free % cm capacity (veh/h) Direction, Lane # EB 1 NB 1 NB 2 NB 3 SB 1 SB 2 SB 3 Volume Total Volume Left Volume Right csh Volume to Capacity Queue Length 95th (m) Control Delay (s) Lane LOS C A Approach Delay (s) Approach LOS C Intersection Summary Average Delay 2.6 Intersection Capacity Utilization 46.9% ICU Level of Service A Analysis Period (min) AM Peak Synchro 6 Report SNC Lavalin Page 1
66 HCM Unsignalized Intersection Capacity Analysis 5: Rockcliffe Drive & Strasburg Road Movement EBL EBR NBL NBT SBT SBR Lane Configurations Sign Control Stop Free Free Grade 0% 0% 0% Volume (veh/h) Peak Hour Factor Hourly flow rate (vph) Pedestrians Lane Width (m) Walking Speed (m/s) Percent Blockage Right turn flare (veh) 9 Median type TWLTL Median storage veh) 2 Upstream signal (m) px, platoon unblocked vc, conflicting volume vc1, stage 1 conf vol 1350 vc2, stage 2 conf vol 598 vcu, unblocked vol tc, single (s) tc, 2 stage (s) 5.8 tf (s) p0 queue free % cm capacity (veh/h) Direction, Lane # EB 1 NB 1 NB 2 NB 3 SB 1 SB 2 SB 3 Volume Total Volume Left Volume Right csh Volume to Capacity Queue Length 95th (m) Control Delay (s) Lane LOS E B Approach Delay (s) Approach LOS E Intersection Summary Average Delay 2.4 Intersection Capacity Utilization 56.5% ICU Level of Service B Analysis Period (min) PM Peak Synchro 6 Report SNC Lavalin Page 1
67 HCM Unsignalized Intersection Capacity Analysis 74: Biehn Drive & Strasburg Road Movement WBL WBR NBT NBR SBL SBT Lane Configurations Sign Control Stop Free Free Grade 0% 0% 0% Volume (veh/h) Peak Hour Factor Hourly flow rate (vph) Pedestrians Lane Width (m) Walking Speed (m/s) Percent Blockage Right turn flare (veh) Median type TWLTL Median storage veh) 2 Upstream signal (m) px, platoon unblocked vc, conflicting volume vc1, stage 1 conf vol 556 vc2, stage 2 conf vol 247 vcu, unblocked vol tc, single (s) tc, 2 stage (s) 5.8 tf (s) p0 queue free % cm capacity (veh/h) Direction, Lane # WB 1 NB 1 NB 2 SB 1 SB 2 Volume Total Volume Left Volume Right csh Volume to Capacity Queue Length 95th (m) Control Delay (s) Lane LOS B A Approach Delay (s) Approach LOS B Intersection Summary Average Delay 1.2 Intersection Capacity Utilization 37.0% ICU Level of Service A Analysis Period (min) AM Peak Synchro 6 Report SNC Lavalin Page 1
68 HCM Unsignalized Intersection Capacity Analysis 71: Biehn Drive & Strasburg Road Movement WBL WBR NBT NBR SBL SBT Lane Configurations Sign Control Stop Free Free Grade 0% 0% 0% Volume (veh/h) Peak Hour Factor Hourly flow rate (vph) Pedestrians Lane Width (m) Walking Speed (m/s) Percent Blockage Right turn flare (veh) Median type TWLTL Median storage veh) 2 Upstream signal (m) px, platoon unblocked vc, conflicting volume vc1, stage 1 conf vol 590 vc2, stage 2 conf vol 484 vcu, unblocked vol tc, single (s) tc, 2 stage (s) 5.8 tf (s) p0 queue free % cm capacity (veh/h) Direction, Lane # WB 1 NB 1 NB 2 SB 1 SB 2 Volume Total Volume Left Volume Right csh Volume to Capacity Queue Length 95th (m) Control Delay (s) Lane LOS B A Approach Delay (s) Approach LOS B Intersection Summary Average Delay 1.0 Intersection Capacity Utilization 52.1% ICU Level of Service A Analysis Period (min) PM Peak Synchro 6 Report SNC Lavalin Page 1
69 HCM Unsignalized Intersection Capacity Analysis 74: Biehn Drive & Strasburg Road Movement WBL WBR NBT NBR SBL SBT Lane Configurations Sign Control Stop Free Free Grade 0% 0% 0% Volume (veh/h) Peak Hour Factor Hourly flow rate (vph) Pedestrians Lane Width (m) Walking Speed (m/s) Percent Blockage Right turn flare (veh) Median type TWLTL Median storage veh) 2 Upstream signal (m) px, platoon unblocked vc, conflicting volume vc1, stage 1 conf vol 978 vc2, stage 2 conf vol 454 vcu, unblocked vol tc, single (s) tc, 2 stage (s) 5.8 tf (s) p0 queue free % cm capacity (veh/h) Direction, Lane # WB 1 NB 1 NB 2 SB 1 SB 2 Volume Total Volume Left Volume Right csh Volume to Capacity Queue Length 95th (m) Control Delay (s) Lane LOS D A Approach Delay (s) Approach LOS D Intersection Summary Average Delay 3.4 Intersection Capacity Utilization 71.6% ICU Level of Service C Analysis Period (min) AM Peak Synchro 6 Report SNC Lavalin Page 1
70 HCM Unsignalized Intersection Capacity Analysis 71: Biehn Drive & Strasburg Road Movement WBL WBR NBT NBR SBL SBT Lane Configurations Sign Control Stop Free Free Grade 0% 0% 0% Volume (veh/h) Peak Hour Factor Hourly flow rate (vph) Pedestrians Lane Width (m) Walking Speed (m/s) Percent Blockage Right turn flare (veh) Median type TWLTL Median storage veh) 2 Upstream signal (m) px, platoon unblocked vc, conflicting volume vc1, stage 1 conf vol 974 vc2, stage 2 conf vol 934 vcu, unblocked vol tc, single (s) tc, 2 stage (s) 5.8 tf (s) p0 queue free % cm capacity (veh/h) Direction, Lane # WB 1 NB 1 NB 2 SB 1 SB 2 Volume Total Volume Left Volume Right csh Volume to Capacity Queue Length 95th (m) Control Delay (s) Lane LOS D A Approach Delay (s) Approach LOS D Intersection Summary Average Delay 3.1 Intersection Capacity Utilization 86.8% ICU Level of Service E Analysis Period (min) PM Peak Synchro 6 Report SNC Lavalin Page 1
71 Lanes, Volumes, Timings 13: Robert Ferrie Drive & Strasburg Road Lane Group WBL WBR NBT NBR SBL SBT Lane Configurations Ideal Flow (vphpl) Storage Length (m) Storage Lanes Total Lost Time (s) Leading Detector (m) Trailing Detector (m) Turning Speed (k/h) Lane Util. Factor Frt Flt Protected Satd. Flow (prot) Flt Permitted Satd. Flow (perm) Right Turn on Red Yes Yes Satd. Flow (RTOR) Headway Factor Link Speed (k/h) Link Distance (m) Travel Time (s) Volume (vph) Peak Hour Factor Adj. Flow (vph) Lane Group Flow (vph) Turn Type pm+pt Protected Phases Permitted Phases 8 6 Detector Phases Minimum Initial (s) Minimum Split (s) Total Split (s) Total Split (%) 41.8% 0.0% 41.8% 0.0% 16.4% 58.2% Maximum Green (s) Yellow Time (s) All-Red Time (s) Lead/Lag Lag Lead Lead-Lag Optimize? Yes Yes Vehicle Extension (s) Recall Mode None C-Min None C-Min Walk Time (s) Flash Dont Walk (s) Pedestrian Calls (#/hr) Act Effct Green (s) Actuated g/c Ratio v/c Ratio Control Delay Queue Delay Total Delay LOS C B A A 2016 AM Peak Synchro 6 Report SNC Lavalin Page 1
72 Lanes, Volumes, Timings 13: Robert Ferrie Drive & Strasburg Road Lane Group WBL WBR NBT NBR SBL SBT Approach Delay Approach LOS C B A Queue Length 50th (m) Queue Length 95th (m) Internal Link Dist (m) Turn Bay Length (m) 50.0 Base Capacity (vph) Starvation Cap Reductn Spillback Cap Reductn Storage Cap Reductn Reduced v/c Ratio Intersection Summary Area Type: Other Cycle Length: 55 Actuated Cycle Length: 55 Offset: 0 (0%), Referenced to phase 2:NBT and 6:SBTL, Start of Green Natural Cycle: 55 Control Type: Actuated-Coordinated Maximum v/c Ratio: 0.64 Intersection Signal Delay: 10.9 Intersection LOS: B Intersection Capacity Utilization 42.2% ICU Level of Service A Analysis Period (min) 15 Splits and Phases: 13: Robert Ferrie Drive & Strasburg Road 2016 AM Peak Synchro 6 Report SNC Lavalin Page 2
73 Lanes, Volumes, Timings 13: Robert Ferrie Drive & Strasburg Road Lane Group WBL WBR NBT NBR SBL SBT Lane Configurations Ideal Flow (vphpl) Storage Length (m) Storage Lanes Total Lost Time (s) Leading Detector (m) Trailing Detector (m) Turning Speed (k/h) Lane Util. Factor Frt Flt Protected Satd. Flow (prot) Flt Permitted Satd. Flow (perm) Right Turn on Red Yes Yes Satd. Flow (RTOR) Headway Factor Link Speed (k/h) Link Distance (m) Travel Time (s) Volume (vph) Peak Hour Factor Adj. Flow (vph) Lane Group Flow (vph) Turn Type pm+pt Protected Phases Permitted Phases 8 6 Detector Phases Minimum Initial (s) Minimum Split (s) Total Split (s) Total Split (%) 40.0% 0.0% 41.8% 0.0% 18.2% 60.0% Maximum Green (s) Yellow Time (s) All-Red Time (s) Lead/Lag Lag Lead Lead-Lag Optimize? Yes Yes Vehicle Extension (s) Recall Mode None C-Min None C-Min Walk Time (s) Flash Dont Walk (s) Pedestrian Calls (#/hr) Act Effct Green (s) Actuated g/c Ratio v/c Ratio Control Delay Queue Delay Total Delay LOS B B A A 2016 PM Peak Synchro 6 Report SNC Lavalin Page 1
74 Lanes, Volumes, Timings 13: Robert Ferrie Drive & Strasburg Road Lane Group WBL WBR NBT NBR SBL SBT Approach Delay Approach LOS B B A Queue Length 50th (m) Queue Length 95th (m) Internal Link Dist (m) Turn Bay Length (m) 50.0 Base Capacity (vph) Starvation Cap Reductn Spillback Cap Reductn Storage Cap Reductn Reduced v/c Ratio Intersection Summary Area Type: Other Cycle Length: 55 Actuated Cycle Length: 55 Offset: 0 (0%), Referenced to phase 2:NBT and 6:SBTL, Start of Green Natural Cycle: 55 Control Type: Actuated-Coordinated Maximum v/c Ratio: 0.48 Intersection Signal Delay: 9.6 Intersection LOS: A Intersection Capacity Utilization 45.2% ICU Level of Service A Analysis Period (min) 15 Splits and Phases: 13: Robert Ferrie Drive & Strasburg Road 2016 PM Peak Synchro 6 Report SNC Lavalin Page 2
75 Lanes, Volumes, Timings 13: Robert Ferrie Drive & Strasburg Road Lane Group WBL WBR NBT NBR SBL SBT Lane Configurations Ideal Flow (vphpl) Storage Length (m) Storage Lanes Total Lost Time (s) Leading Detector (m) Trailing Detector (m) Turning Speed (k/h) Lane Util. Factor Frt Flt Protected Satd. Flow (prot) Flt Permitted Satd. Flow (perm) Right Turn on Red Yes Yes Satd. Flow (RTOR) Headway Factor Link Speed (k/h) Link Distance (m) Travel Time (s) Volume (vph) Peak Hour Factor Adj. Flow (vph) Lane Group Flow (vph) Turn Type pm+pt Protected Phases Permitted Phases 8 6 Detector Phases Minimum Initial (s) Minimum Split (s) Total Split (s) Total Split (%) 43.6% 0.0% 41.8% 0.0% 14.5% 56.4% Maximum Green (s) Yellow Time (s) All-Red Time (s) Lead/Lag Lag Lead Lead-Lag Optimize? Yes Yes Vehicle Extension (s) Recall Mode None C-Min None C-Min Walk Time (s) Flash Dont Walk (s) Pedestrian Calls (#/hr) Act Effct Green (s) Actuated g/c Ratio v/c Ratio Control Delay Queue Delay Total Delay LOS C B B A 2031 AM Peak Synchro 6 Report SNC Lavalin Page 1
76 Lanes, Volumes, Timings 13: Robert Ferrie Drive & Strasburg Road Lane Group WBL WBR NBT NBR SBL SBT Approach Delay Approach LOS C B A Queue Length 50th (m) Queue Length 95th (m) #85.9 m Internal Link Dist (m) Turn Bay Length (m) 50.0 Base Capacity (vph) Starvation Cap Reductn Spillback Cap Reductn Storage Cap Reductn Reduced v/c Ratio Intersection Summary Area Type: Other Cycle Length: 55 Actuated Cycle Length: 55 Offset: 0 (0%), Referenced to phase 2:NBT and 6:SBTL, Start of Green Natural Cycle: 55 Control Type: Actuated-Coordinated Maximum v/c Ratio: 0.87 Intersection Signal Delay: 17.8 Intersection LOS: B Intersection Capacity Utilization 71.4% ICU Level of Service C Analysis Period (min) 15 # 95th percentile volume exceeds capacity, queue may be longer. Queue shown is maximum after two cycles. m Volume for 95th percentile queue is metered by upstream signal. Splits and Phases: 13: Robert Ferrie Drive & Strasburg Road 2031 AM Peak Synchro 6 Report SNC Lavalin Page 2
77 Lanes, Volumes, Timings 13: Robert Ferrie Drive & Strasburg Road Lane Group WBL WBR NBT NBR SBL SBT Lane Configurations Ideal Flow (vphpl) Storage Length (m) Storage Lanes Total Lost Time (s) Leading Detector (m) Trailing Detector (m) Turning Speed (k/h) Lane Util. Factor Frt Flt Protected Satd. Flow (prot) Flt Permitted Satd. Flow (perm) Right Turn on Red Yes Yes Satd. Flow (RTOR) Headway Factor Link Speed (k/h) Link Distance (m) Travel Time (s) Volume (vph) Peak Hour Factor Adj. Flow (vph) Lane Group Flow (vph) Turn Type pm+pt Protected Phases Permitted Phases 8 6 Detector Phases Minimum Initial (s) Minimum Split (s) Total Split (s) Total Split (%) 36.7% 0.0% 41.7% 0.0% 21.7% 63.3% Maximum Green (s) Yellow Time (s) All-Red Time (s) Lead/Lag Lag Lead Lead-Lag Optimize? Yes Yes Vehicle Extension (s) Recall Mode None C-Min None C-Min Walk Time (s) Flash Dont Walk (s) Pedestrian Calls (#/hr) Act Effct Green (s) Actuated g/c Ratio v/c Ratio Control Delay Queue Delay Total Delay LOS C C C A 2031 PM Peak Synchro 6 Report SNC Lavalin Page 1
78 Lanes, Volumes, Timings 13: Robert Ferrie Drive & Strasburg Road Lane Group WBL WBR NBT NBR SBL SBT Approach Delay Approach LOS C C B Queue Length 50th (m) Queue Length 95th (m) 53.5 #103.2 # Internal Link Dist (m) Turn Bay Length (m) 50.0 Base Capacity (vph) Starvation Cap Reductn Spillback Cap Reductn Storage Cap Reductn Reduced v/c Ratio Intersection Summary Area Type: Other Cycle Length: 60 Actuated Cycle Length: 60 Offset: 0 (0%), Referenced to phase 2:NBT and 6:SBTL, Start of Green Natural Cycle: 60 Control Type: Actuated-Coordinated Maximum v/c Ratio: 0.79 Intersection Signal Delay: 20.7 Intersection LOS: C Intersection Capacity Utilization 81.4% ICU Level of Service D Analysis Period (min) 15 # 95th percentile volume exceeds capacity, queue may be longer. Queue shown is maximum after two cycles. Splits and Phases: 13: Robert Ferrie Drive & Strasburg Road 2031 PM Peak Synchro 6 Report SNC Lavalin Page 2
79 Lanes, Volumes, Timings 14: East-West Collector & Strasburg Road Lane Group WBL WBR NBT NBR SBL SBT Lane Configurations Ideal Flow (vphpl) Lane Width (m) Storage Length (m) Storage Lanes Total Lost Time (s) Leading Detector (m) Trailing Detector (m) Turning Speed (k/h) Lane Util. Factor Frt Flt Protected Satd. Flow (prot) Flt Permitted Satd. Flow (perm) Right Turn on Red Yes Yes Satd. Flow (RTOR) Headway Factor Link Speed (k/h) Link Distance (m) Travel Time (s) Volume (vph) Peak Hour Factor Adj. Flow (vph) Lane Group Flow (vph) Turn Type pm+pt Protected Phases Permitted Phases 6 Detector Phases Minimum Initial (s) Minimum Split (s) Total Split (s) Total Split (%) 41.8% 0.0% 41.8% 0.0% 16.4% 58.2% Maximum Green (s) Yellow Time (s) All-Red Time (s) Lead/Lag Lag Lead Lead-Lag Optimize? Yes Yes Vehicle Extension (s) Recall Mode None C-Min None C-Min Walk Time (s) Flash Dont Walk (s) Pedestrian Calls (#/hr) Act Effct Green (s) Actuated g/c Ratio v/c Ratio Control Delay Queue Delay Total Delay AM Peak Synchro 6 Report SNC Lavalin Page 1
80 Lanes, Volumes, Timings 14: East-West Collector & Strasburg Road Lane Group WBL WBR NBT NBR SBL SBT LOS B A A A Approach Delay Approach LOS B A A Queue Length 50th (m) Queue Length 95th (m) m Internal Link Dist (m) Turn Bay Length (m) 50.0 Base Capacity (vph) Starvation Cap Reductn Spillback Cap Reductn Storage Cap Reductn Reduced v/c Ratio Intersection Summary Area Type: Other Cycle Length: 55 Actuated Cycle Length: 55 Offset: 0 (0%), Referenced to phase 2:NBT and 6:SBTL, Start of Green Natural Cycle: 55 Control Type: Actuated-Coordinated Maximum v/c Ratio: 0.54 Intersection Signal Delay: 7.2 Intersection LOS: A Intersection Capacity Utilization 35.8% ICU Level of Service A Analysis Period (min) 15 m Volume for 95th percentile queue is metered by upstream signal. Splits and Phases: 14: East-West Collector & Strasburg Road 2016 AM Peak Synchro 6 Report SNC Lavalin Page 2
81 Lanes, Volumes, Timings 14: East-West Collector & Strasburg Road Lane Group WBL WBR NBT NBR SBL SBT Lane Configurations Ideal Flow (vphpl) Storage Length (m) Storage Lanes Total Lost Time (s) Leading Detector (m) Trailing Detector (m) Turning Speed (k/h) Lane Util. Factor Frt Flt Protected Satd. Flow (prot) Flt Permitted Satd. Flow (perm) Right Turn on Red Yes Yes Satd. Flow (RTOR) Headway Factor Link Speed (k/h) Link Distance (m) Travel Time (s) Volume (vph) Peak Hour Factor Adj. Flow (vph) Lane Group Flow (vph) Turn Type pm+pt Protected Phases Permitted Phases 6 Detector Phases Minimum Initial (s) Minimum Split (s) Total Split (s) Total Split (%) 40.0% 0.0% 41.8% 0.0% 18.2% 60.0% Maximum Green (s) Yellow Time (s) All-Red Time (s) Lead/Lag Lag Lead Lead-Lag Optimize? Yes Yes Vehicle Extension (s) Recall Mode None C-Min None C-Min Walk Time (s) Flash Dont Walk (s) Pedestrian Calls (#/hr) Act Effct Green (s) Actuated g/c Ratio v/c Ratio Control Delay Queue Delay Total Delay LOS B A A A 2016 PM Peak Synchro 6 Report SNC Lavalin Page 1
82 Lanes, Volumes, Timings 14: East-West Collector & Strasburg Road Lane Group WBL WBR NBT NBR SBL SBT Approach Delay Approach LOS B A A Queue Length 50th (m) Queue Length 95th (m) Internal Link Dist (m) Turn Bay Length (m) 50.0 Base Capacity (vph) Starvation Cap Reductn Spillback Cap Reductn Storage Cap Reductn Reduced v/c Ratio Intersection Summary Area Type: Other Cycle Length: 55 Actuated Cycle Length: 55 Offset: 0 (0%), Referenced to phase 2:NBT and 6:SBTL, Start of Green Natural Cycle: 55 Control Type: Actuated-Coordinated Maximum v/c Ratio: 0.40 Intersection Signal Delay: 6.3 Intersection LOS: A Intersection Capacity Utilization 42.8% ICU Level of Service A Analysis Period (min) 15 Splits and Phases: 14: East-West Collector & Strasburg Road 2016 PM Peak Synchro 6 Report SNC Lavalin Page 2
83 Lanes, Volumes, Timings 14: East-West Collector & Strasburg Road Lane Group WBL WBR NBT NBR SBL SBT Lane Configurations Ideal Flow (vphpl) Lane Width (m) Storage Length (m) Storage Lanes Total Lost Time (s) Leading Detector (m) Trailing Detector (m) Turning Speed (k/h) Lane Util. Factor Frt Flt Protected Satd. Flow (prot) Flt Permitted Satd. Flow (perm) Right Turn on Red Yes Yes Satd. Flow (RTOR) Headway Factor Link Speed (k/h) Link Distance (m) Travel Time (s) Volume (vph) Peak Hour Factor Adj. Flow (vph) Lane Group Flow (vph) Turn Type pm+pt Protected Phases Permitted Phases 6 Detector Phases Minimum Initial (s) Minimum Split (s) Total Split (s) Total Split (%) 43.6% 0.0% 41.8% 0.0% 14.5% 56.4% Maximum Green (s) Yellow Time (s) All-Red Time (s) Lead/Lag Lag Lead Lead-Lag Optimize? Yes Yes Vehicle Extension (s) Recall Mode None C-Min None C-Min Walk Time (s) Flash Dont Walk (s) Pedestrian Calls (#/hr) Act Effct Green (s) Actuated g/c Ratio v/c Ratio Control Delay Queue Delay Total Delay AM Peak Synchro 6 Report SNC Lavalin Page 1
84 Lanes, Volumes, Timings 14: East-West Collector & Strasburg Road Lane Group WBL WBR NBT NBR SBL SBT LOS C B B B Approach Delay Approach LOS C B B Queue Length 50th (m) Queue Length 95th (m) m17.0 m48.6 Internal Link Dist (m) Turn Bay Length (m) 50.0 Base Capacity (vph) Starvation Cap Reductn Spillback Cap Reductn Storage Cap Reductn Reduced v/c Ratio Intersection Summary Area Type: Other Cycle Length: 55 Actuated Cycle Length: 55 Offset: 0 (0%), Referenced to phase 2:NBT and 6:SBTL, Start of Green Natural Cycle: 55 Control Type: Actuated-Coordinated Maximum v/c Ratio: 0.81 Intersection Signal Delay: 14.5 Intersection LOS: B Intersection Capacity Utilization 61.1% ICU Level of Service B Analysis Period (min) 15 m Volume for 95th percentile queue is metered by upstream signal. Splits and Phases: 14: East-West Collector & Strasburg Road 2031 AM Peak Synchro 6 Report SNC Lavalin Page 2
85 Lanes, Volumes, Timings 14: East-West Collector & Strasburg Road Lane Group WBL WBR NBT NBR SBL SBT Lane Configurations Ideal Flow (vphpl) Storage Length (m) Storage Lanes Total Lost Time (s) Leading Detector (m) Trailing Detector (m) Turning Speed (k/h) Lane Util. Factor Frt Flt Protected Satd. Flow (prot) Flt Permitted Satd. Flow (perm) Right Turn on Red Yes Yes Satd. Flow (RTOR) Headway Factor Link Speed (k/h) Link Distance (m) Travel Time (s) Volume (vph) Peak Hour Factor Adj. Flow (vph) Lane Group Flow (vph) Turn Type pm+pt Protected Phases Permitted Phases 6 Detector Phases Minimum Initial (s) Minimum Split (s) Total Split (s) Total Split (%) 36.7% 0.0% 41.7% 0.0% 21.7% 63.3% Maximum Green (s) Yellow Time (s) All-Red Time (s) Lead/Lag Lag Lead Lead-Lag Optimize? Yes Yes Vehicle Extension (s) Recall Mode None C-Min None C-Min Walk Time (s) Flash Dont Walk (s) Pedestrian Calls (#/hr) Act Effct Green (s) Actuated g/c Ratio v/c Ratio Control Delay Queue Delay Total Delay LOS C C C A 2031 PM Peak Synchro 6 Report SNC Lavalin Page 1
86 Lanes, Volumes, Timings 14: East-West Collector & Strasburg Road Lane Group WBL WBR NBT NBR SBL SBT Approach Delay Approach LOS C C B Queue Length 50th (m) Queue Length 95th (m) 40.9 #100.1 m#57.3 m44.5 Internal Link Dist (m) Turn Bay Length (m) 50.0 Base Capacity (vph) Starvation Cap Reductn Spillback Cap Reductn Storage Cap Reductn Reduced v/c Ratio Intersection Summary Area Type: Other Cycle Length: 60 Actuated Cycle Length: 60 Offset: 0 (0%), Referenced to phase 2:NBT and 6:SBTL, Start of Green Natural Cycle: 60 Control Type: Actuated-Coordinated Maximum v/c Ratio: 0.78 Intersection Signal Delay: 17.6 Intersection LOS: B Intersection Capacity Utilization 78.4% ICU Level of Service D Analysis Period (min) 15 # 95th percentile volume exceeds capacity, queue may be longer. Queue shown is maximum after two cycles. m Volume for 95th percentile queue is metered by upstream signal. Splits and Phases: 14: East-West Collector & Strasburg Road 2031 PM Peak Synchro 6 Report SNC Lavalin Page 2
87 Lanes, Volumes, Timings 15: New Dundee Road & Strasburg Road Lane Group EBL EBT EBR WBL WBT WBR NBL NBT NBR SBL SBT SBR Lane Configurations Ideal Flow (vphpl) Lane Width (m) Storage Length (m) Storage Lanes Total Lost Time (s) Leading Detector (m) Trailing Detector (m) Turning Speed (k/h) Lane Util. Factor Frt Flt Protected Satd. Flow (prot) Flt Permitted Satd. Flow (perm) Right Turn on Red Yes Yes Yes Yes Satd. Flow (RTOR) Headway Factor Link Speed (k/h) Link Distance (m) Travel Time (s) Volume (vph) Peak Hour Factor Heavy Vehicles (%) 8% 8% 0% 0% 8% 8% 0% 0% 0% 8% 0% 8% Adj. Flow (vph) Lane Group Flow (vph) Turn Type Perm Perm Perm pm+pt Free Protected Phases Permitted Phases Free Detector Phases Minimum Initial (s) Minimum Split (s) Total Split (s) Total Split (%) 40.0% 40.0% 0.0% 40.0% 40.0% 0.0% 40.0% 40.0% 0.0% 20.0% 60.0% 0.0% Maximum Green (s) Yellow Time (s) All-Red Time (s) Lead/Lag Lag Lag Lead Lead-Lag Optimize? Yes Yes Yes Vehicle Extension (s) Recall Mode None None None None Max Max None Max Walk Time (s) Flash Dont Walk (s) Pedestrian Calls (#/hr) Act Effct Green (s) Actuated g/c Ratio v/c Ratio Control Delay Queue Delay AM Peak Synchro 6 Report SNC Lavalin Page 1
88 Lanes, Volumes, Timings 15: New Dundee Road & Strasburg Road Lane Group EBL EBT EBR WBL WBT WBR NBL NBT NBR SBL SBT SBR Total Delay LOS B B B A B A A A Approach Delay Approach LOS B A B A Queue Length 50th (m) Queue Length 95th (m) Internal Link Dist (m) Turn Bay Length (m) Base Capacity (vph) Starvation Cap Reductn Spillback Cap Reductn Storage Cap Reductn Reduced v/c Ratio Intersection Summary Area Type: Other Cycle Length: 55 Actuated Cycle Length: 49.2 Natural Cycle: 55 Control Type: Semi Act-Uncoord Maximum v/c Ratio: 0.61 Intersection Signal Delay: 11.0 Intersection Capacity Utilization 51.9% Analysis Period (min) 15 Intersection LOS: B ICU Level of Service A Splits and Phases: 15: New Dundee Road & Strasburg Road 2016 AM Peak Synchro 6 Report SNC Lavalin Page 2
89 Lanes, Volumes, Timings 15: New Dundee Road & Strasburg Road Lane Group EBL EBT EBR WBL WBT WBR NBL NBT NBR SBL SBT SBR Lane Configurations Ideal Flow (vphpl) Lane Width (m) Storage Length (m) Storage Lanes Total Lost Time (s) Leading Detector (m) Trailing Detector (m) Turning Speed (k/h) Lane Util. Factor Frt Flt Protected Satd. Flow (prot) Flt Permitted Satd. Flow (perm) Right Turn on Red Yes Yes Yes Yes Satd. Flow (RTOR) Headway Factor Link Speed (k/h) Link Distance (m) Travel Time (s) Volume (vph) Peak Hour Factor Heavy Vehicles (%) 8% 8% 0% 0% 8% 8% 0% 0% 0% 8% 0% 8% Adj. Flow (vph) Lane Group Flow (vph) Turn Type Perm Perm Perm pm+pt Free Protected Phases Permitted Phases Free Detector Phases Minimum Initial (s) Minimum Split (s) Total Split (s) Total Split (%) 40.0% 40.0% 0.0% 40.0% 40.0% 0.0% 40.0% 40.0% 0.0% 20.0% 60.0% 0.0% Maximum Green (s) Yellow Time (s) All-Red Time (s) Lead/Lag Lag Lag Lead Lead-Lag Optimize? Yes Yes Yes Vehicle Extension (s) Recall Mode None None None None Max Max None Max Walk Time (s) Flash Dont Walk (s) Pedestrian Calls (#/hr) Act Effct Green (s) Actuated g/c Ratio v/c Ratio Control Delay Queue Delay PM Peak Synchro 6 Report SNC Lavalin Page 1
90 Lanes, Volumes, Timings 15: New Dundee Road & Strasburg Road Lane Group EBL EBT EBR WBL WBT WBR NBL NBT NBR SBL SBT SBR Total Delay LOS B B B B B B A A Approach Delay Approach LOS B B B A Queue Length 50th (m) Queue Length 95th (m) Internal Link Dist (m) Turn Bay Length (m) Base Capacity (vph) Starvation Cap Reductn Spillback Cap Reductn Storage Cap Reductn Reduced v/c Ratio Intersection Summary Area Type: Other Cycle Length: 55 Actuated Cycle Length: 51.1 Natural Cycle: 55 Control Type: Semi Act-Uncoord Maximum v/c Ratio: 0.72 Intersection Signal Delay: 12.9 Intersection Capacity Utilization 69.3% Analysis Period (min) 15 Intersection LOS: B ICU Level of Service C Splits and Phases: 15: New Dundee Road & Strasburg Road 2016 PM Peak Synchro 6 Report SNC Lavalin Page 2
91 Lanes, Volumes, Timings 15: New Dundee Road & Strasburg Road Lane Group EBL EBT EBR WBL WBT WBR NBL NBT NBR SBL SBT SBR Lane Configurations Ideal Flow (vphpl) Lane Width (m) Storage Length (m) Storage Lanes Total Lost Time (s) Leading Detector (m) Trailing Detector (m) Turning Speed (k/h) Lane Util. Factor Frt Flt Protected Satd. Flow (prot) Flt Permitted Satd. Flow (perm) Right Turn on Red Yes Yes Yes Yes Satd. Flow (RTOR) Headway Factor Link Speed (k/h) Link Distance (m) Travel Time (s) Volume (vph) Peak Hour Factor Heavy Vehicles (%) 8% 8% 0% 0% 8% 8% 0% 0% 0% 8% 0% 8% Adj. Flow (vph) Lane Group Flow (vph) Turn Type Perm Perm Perm pm+pt Free Protected Phases Permitted Phases Free Detector Phases Minimum Initial (s) Minimum Split (s) Total Split (s) Total Split (%) 36.7% 36.7% 0.0% 36.7% 36.7% 0.0% 36.7% 36.7% 0.0% 26.7% 63.3% 0.0% Maximum Green (s) Yellow Time (s) All-Red Time (s) Lead/Lag Lag Lag Lead Lead-Lag Optimize? Yes Yes Yes Vehicle Extension (s) Recall Mode None None None None Max Max None Max Walk Time (s) Flash Dont Walk (s) Pedestrian Calls (#/hr) Act Effct Green (s) Actuated g/c Ratio v/c Ratio Control Delay Queue Delay AM Peak Synchro 6 Report SNC Lavalin Page 1
92 Lanes, Volumes, Timings 15: New Dundee Road & Strasburg Road Lane Group EBL EBT EBR WBL WBT WBR NBL NBT NBR SBL SBT SBR Total Delay LOS B C B A B C A A Approach Delay Approach LOS C A B B Queue Length 50th (m) Queue Length 95th (m) # Internal Link Dist (m) Turn Bay Length (m) Base Capacity (vph) Starvation Cap Reductn Spillback Cap Reductn Storage Cap Reductn Reduced v/c Ratio Intersection Summary Area Type: Other Cycle Length: 60 Actuated Cycle Length: 58.2 Natural Cycle: 60 Control Type: Semi Act-Uncoord Maximum v/c Ratio: 0.79 Intersection Signal Delay: 16.4 Intersection LOS: B Intersection Capacity Utilization 68.0% ICU Level of Service C Analysis Period (min) 15 # 95th percentile volume exceeds capacity, queue may be longer. Queue shown is maximum after two cycles. Splits and Phases: 15: New Dundee Road & Strasburg Road 2031 AM Peak Synchro 6 Report SNC Lavalin Page 2
93 Lanes, Volumes, Timings 15: New Dundee Road & Strasburg Road Lane Group EBL EBT EBR WBL WBT WBR NBL NBT NBR SBL SBT SBR Lane Configurations Ideal Flow (vphpl) Lane Width (m) Storage Length (m) Storage Lanes Total Lost Time (s) Leading Detector (m) Trailing Detector (m) Turning Speed (k/h) Lane Util. Factor Frt Flt Protected Satd. Flow (prot) Flt Permitted Satd. Flow (perm) Right Turn on Red Yes Yes Yes Yes Satd. Flow (RTOR) Headway Factor Link Speed (k/h) Link Distance (m) Travel Time (s) Volume (vph) Peak Hour Factor Heavy Vehicles (%) 8% 8% 0% 0% 8% 8% 0% 0% 0% 8% 0% 8% Adj. Flow (vph) Lane Group Flow (vph) Turn Type Perm Perm Perm pm+pt Free Protected Phases Permitted Phases Free Detector Phases Minimum Initial (s) Minimum Split (s) Total Split (s) Total Split (%) 38.3% 38.3% 0.0% 38.3% 38.3% 0.0% 36.7% 36.7% 0.0% 25.0% 61.7% 0.0% Maximum Green (s) Yellow Time (s) All-Red Time (s) Lead/Lag Lag Lag Lead Lead-Lag Optimize? Yes Yes Yes Vehicle Extension (s) Recall Mode None None None None Max Max None Max Walk Time (s) Flash Dont Walk (s) Pedestrian Calls (#/hr) Act Effct Green (s) Actuated g/c Ratio v/c Ratio Control Delay Queue Delay PM Peak Synchro 6 Report SNC Lavalin Page 1
94 Lanes, Volumes, Timings 15: New Dundee Road & Strasburg Road Lane Group EBL EBT EBR WBL WBT WBR NBL NBT NBR SBL SBT SBR Total Delay LOS C B B D D D B A Approach Delay Approach LOS B D D C Queue Length 50th (m) Queue Length 95th (m) #98.7 #75.3 # Internal Link Dist (m) Turn Bay Length (m) Base Capacity (vph) Starvation Cap Reductn Spillback Cap Reductn Storage Cap Reductn Reduced v/c Ratio Intersection Summary Area Type: Other Cycle Length: 60 Actuated Cycle Length: 60 Natural Cycle: 60 Control Type: Semi Act-Uncoord Maximum v/c Ratio: 0.99 Intersection Signal Delay: 33.1 Intersection LOS: C Intersection Capacity Utilization 95.2% ICU Level of Service F Analysis Period (min) 15 # 95th percentile volume exceeds capacity, queue may be longer. Queue shown is maximum after two cycles. Splits and Phases: 15: New Dundee Road & Strasburg Road 2031 PM Peak Synchro 6 Report SNC Lavalin Page 2
95 Detailed Output about:blank Page 1 of /01/24 DETAILED OUTPUT Strasburg Road-N-Robert Ferrie Drive Strasburg Road-N-Robert Ferrie Drive-Weekday AM 2016 OUTPUT TABLE LINKS s Basic Parameters Gap Acceptance Parameters Movements Movement Capacity Parameters Movement Performance Fuel Consumption, Emissions and Cost (Total) Fuel Consumption, Emissions and Cost (Rate) Intersection Negotiation Data Movement Speeds and Geometric Delay Lanes Lane Performance Lane Flow and Capacity Information Lane, Approach and Intersection Performance Driver Characteristics Lane Delays Lane Queues (Vehicles) Lane Queues (Distance) Lane Queue Percentiles (Vehicles) Lane Queue Percentiles (Distance) Lane Stops Flow Rates and Demand Analysis Movement Definitions and Flow Rates (O-D) Flow Rates (Separate Light and Heavy Vehicles) Flow Rates (Total Vehicles and Percent Heavy) Other Model Settings Parameters Used in Cost Calculations Diagnostics s Basic Parameters Site:Strasburg Road-N-Robert Ferrie Drive-Weekday AM Circulating/Exiting Stream Cent Circ Insc Ent Ent Cir Ent Av.Ent Island Width Diam. Rad Ang Lan Lan Lane Flow %HV Adjust. %Exit Cap. O-D Diam Width Flow Incl. Constr. Factor m m m m deg m veh/h pcu/h Effect South: Strasburg Road Environment Factor: 1.20 Entry/Circulating Flow Adjustment: Medium N East: Robert Ferrie Drive Environment Factor: 1.20 Entry/Circulating Flow Adjustment: Medium N Environment Factor: 1.20 Entry/Circulating Flow Adjustment: Medium N 0.982
96 Detailed Output about:blank Page 2 of /01/ Capacity Model: SIDRA Standard HV Method for Gap Acceptance: Include HV Effect for all percentages Gap Acceptance Parameters Site:Strasburg Road-N-Robert Ferrie Drive-Weekday AM Turn Lane Lane ---- Circulating/Exiting Stream --- Critical Gap No. Type Flow Aver Aver In-Bnch Prop Foll-up Rate Speed Dist Headway Bunched Hdwy Dist Headway pcu/h km/h m sec sec m sec South: Strasburg Road Environment Factor: 1.20 Entry/Circulating Flow Adjustment: Medium Thru 1 Subdominant Dominant Right 2 Dominant East: Robert Ferrie Drive Environment Factor: 1.20 Entry/Circulating Flow Adjustment: Medium Left 1 Dominant Right 1 Dominant Environment Factor: 1.20 Entry/Circulating Flow Adjustment: Medium Left 1 Subdominant Thru 1 Subdominant Dominant Capacity Model: SIDRA Standard Priority sharing is implied for some movements (Follow-up Headway plus Intra-bunch Headway is larger than the Critical Gap). The O-D Factor ( Basic Parameters table) allows for priority sharing and priority emphasis. Dist (Distance): Spacing, i.e. distance between the front ends of two successive vehicles across all lanes in the circulating or exiting stream Movements Movement Capacity Parameters Site:Strasburg Road-N-Robert Ferrie Drive-Weekday AM Mov Opposing Movement Total Prac. Prac. Lane Deg. ID Demand Adjust. Cap. Deg. Spare Util Satn Flow HV Flow HV Flow Satn Cap. veh/h % veh/h % pcu/h veh/h xp % % x South: Strasburg Road 8T T R R East: Robert Ferrie Drive 1L L * 6R R * L L T T * Maximum degree of saturation
97 Detailed Output about:blank Page 3 of /01/24 Movement Performance Site:Strasburg Road-N-Robert Ferrie Drive-Weekday AM Mov Total Total Aver. Eff. Total Perf. Tot.Trav. Tot.Trav. Aver. ID Delay Delay Delay Stop Stops Index Distance Time Speed (veh-h/h)(pers-h/h)(sec) Rate (veh-km/h)(veh-h/h) (km/h) South: Strasburg Road 8T T R R East: Robert Ferrie Drive 1L L R R L L T T Fuel Consumption, Emissions and Cost (Total) Site:Strasburg Road-N-Robert Ferrie Drive-Weekday AM 2016 Mov Cost Fuel CO2 CO HC NOX ID Total Total Total Total Total Total $/h L/h kg/h kg/h kg/h kg/h South: Strasburg Road 8T T R R East: Robert Ferrie Drive 1L L R R L L T T INTERSECTION: Fuel Consumption, Emissions and Cost (Rate) Site:Strasburg Road-N-Robert Ferrie Drive-Weekday AM 2016 Mov Cost Fuel CO2 CO HC NOX ID Rate Rate Rate Rate Rate Rate $/km L/100km g/km g/km g/km g/km South: Strasburg Road 8T T R R
98 Detailed Output about:blank Page 4 of /01/24 East: Robert Ferrie Drive 1L L R R L L T T INTERSECTION: Intersection Negotiation Data Site:Strasburg Road-N-Robert Ferrie Drive-Weekday AM Negn Negn Negn Appr. Downstream Distance From To Radius Speed Dist. Dist Approach Approach Turn m km/h m m m User Spec? South: Strasburg Road East Right No North Thru No East: Robert Ferrie Drive South Left No North Right No South Thru No East Left No Maximum Negotiation (Design) Speed = 50.0 km/h Downstream distance is distance travelled from the stopline until exit cruise speed is reached (includes negotiation distance). Acceleration distance is weighted for light and heavy vehicles. The same distance applies for both stopped and unstopped vehicles. Movement Speeds and Geometric Delay Site:Strasburg Road-N-Robert Ferrie Drive-Weekday AM Queue Move-up App. Speeds Exit Speeds Av. Section Spd Geom Mov st 2nd Delay ID Cruise Negn Negn Cruise Grn Grn Running Overall sec South: Strasburg Road 8T T R R East: Robert Ferrie Drive 1L L R R L L T T "Running Speed" is the average speed excluding stopped periods. HCM Delay Formula option used: Geometric Delay is not included in Control Delay.
99 Detailed Output about:blank Page 5 of /01/24 Lanes Lane Performance Site:Strasburg Road-N-Robert Ferrie Drive-Weekday AM 2016 Q u e u e Flow Cap Deg. Aver. Eff. 95% Back Lane Lane Satn Delay Stop Length No. veh/h veh/h x sec Rate veh m m South: Strasburg Road 1 T TR East: Robert Ferrie Drive 1 LR LT T Lane Flow and Capacity Information Site:Strasburg Road-N-Robert Ferrie Drive-Weekday AM Lane Dem Flow (veh/h) Min Tot Deg. Lane No Cap Cap Satn Util Lef Thru Rig Tot veh/h veh/h x % South: Strasburg Road 1 T TR East: Robert Ferrie Drive 1 LR LT T The capacity value for priority and continuous movements is obtained by adjusting the basic saturation flow for heavy vehicle and turning vehicle effects. Saturation flow scale applies if specified. Lane, Approach and Intersection Performance Site:Strasburg Road-N-Robert Ferrie Drive-Weekday AM Lane Demand Flow (veh/h) Adj. Eff Grn Deg Aver. Longest Shrt No %HV Basic (sec) Sat Delay Queue Lane L T R Tot Satf. 1st 2nd x sec m m South: Strasburg Road 1 T TR
100 Detailed Output about:blank Page 6 of /01/ East: Robert Ferrie Drive 1 LR LT T ========================================================================== ALL VEHICLES Total % Max Aver. Max Flow HV X Delay Queue ========================================================================== Peak flow period = 15 minutes. Queue values in this table are 95% queue (metres) Note: Basic Saturation Flows are not adjusted at roundabouts or signcontrolled intersections and apply only to continuous lanes. Driver Characteristics Site:Strasburg Road-N-Robert Ferrie Drive-Weekday AM Average Driver Lane Satn Satn Satn Satn Queue Response No. Speed Flow Hdwy Spacing Space Time km/h veh/h sec m m sec South: Strasburg Road 1 T TR East: Robert Ferrie Drive 1 LR LT T Saturation Flow and Saturation Headway are derived from follow-up headway. Lane Delays Site:Strasburg Road-N-Robert Ferrie Drive-Weekday AM Delay (seconds/veh) Deg. Stop-line Delay Acc. Queuing Stopd Lane Satn 1st 2nd Total Dec. Total MvUp (Idle) Geom Control No. x d1 d2 dsl dn dq dqm di dig dic South: Strasburg Road 1 T TR East: Robert Ferrie Drive 1 LR LT T HCM Delay Formula option used: (i) Control Delay does not include Geometric Delay, (ii) Stop-line Delay is treated as being same as Control Delay.
101 Detailed Output about:blank Page 7 of /01/24 dsl: Stop-line delay (=d1+d2) dn: Average stop-start delay for all vehicles queued and unqueued dq: Queuing delay (the part of the stop-line delay that includes stopped delay and queue move-up delay) dqm: Queue move-up delay di: Stopped delay (stopped (idling) time at near-zero speed) dig: Geometric delay dic: Intersection control delay (sum of stop-line and geometric delays) Lane Queues (Vehicles) Site:Strasburg Road-N-Robert Ferrie Drive-Weekday AM Deg. Ovrfl. Back of Queue (veh) Queue Prob. P'ile Cyc-Av. Queue Lane Satn Queue Stor. Block Block No. x No Nb1 Nb2 Nb 95% Ratio % % Nc 95% South: Strasburg Road 1 T TR East: Robert Ferrie Drive 1 LR LT T HCM Delay Formula option used: Cycle-Average Queue is calculated using average delay from the HCM equation. (i.e. HCM delays are treated as stop-line delays for this purpose). SIDRA Standard models are used for Back of Queue estimation since HCM only gives Cycle-Average Queues for unsignalised intersections. Lane Queues (Distance) Site:Strasburg Road-N-Robert Ferrie Drive-Weekday AM Deg. Ovrfl. Back of Queue (m) Queue Prob. P'ile Cyc-Av. Queue Lane Satn Queue Stor. Block Block No. x No Nb1 Nb2 Nb 95% Ratio % % Nc 95% South: Strasburg Road 1 T TR East: Robert Ferrie Drive 1 LR LT T HCM Delay Formula option used: Cycle-Average Queue is calculated using average delay from the HCM equation. (i.e. HCM delays are treated as stop-line delays for this purpose). SIDRA Standard models are used for Back of Queue estimation since HCM only gives Cycle-Average Queues for unsignalised intersections. Lane Queue Percentiles (Vehicles) Site:Strasburg Road-N-Robert Ferrie Drive-Weekday AM 2016
102 Detailed Output about:blank Page 8 of /01/ Deg. Percentile Back of Queue (veh) Lane Satn No. x 50% 70% 85% 90% 95% 98% South: Strasburg Road 1 T TR East: Robert Ferrie Drive 1 LR LT T SIDRA Standard models are used for Back of Queue estimation since HCM only gives Cycle-Average Queues for unsignalised intersections. Lane Queue Percentiles (Distance) Site:Strasburg Road-N-Robert Ferrie Drive-Weekday AM Deg. Percentile Back of Queue (metres) Lane Satn No. x 50% 70% 85% 90% 95% 98% South: Strasburg Road 1 T TR East: Robert Ferrie Drive 1 LR LT T SIDRA Standard models are used for Back of Queue estimation since HCM only gives Cycle-Average Queues for unsignalised intersections. Lane Stops Site:Strasburg Road-N-Robert Ferrie Drive-Weekday AM Queue Total Deg. -- Effective Stop Rate -- Total Move-up Queue Prop. Lane Satn Geom. Overall Stops Rate Move-ups Queued No. x he1 he2 hig h H hqm Hqm pq South: Strasburg Road 1 T TR East: Robert Ferrie Drive 1 LR LT T hig is the average value for all movements in a shared lane hqm is average queue move-up rate for all vehicles queued and unqueued
103 Detailed Output about:blank Page 9 of /01/24 Flow Rates and Demand Analysis Movement Definitions and Flow Rates (O-D) Site:Strasburg Road-N-Robert Ferrie Drive-Weekday AM From To Mov Flow Rate Flow Scale Peak Flow Approach Approach ID Turn LV HV Fixed Var Factor South: Strasburg Road East 8R Right North 8T Thru East: Robert Ferrie Drive South 1L Left North 6R Right South 4T Thru East 7L Left Unit Time for Volumes = 60 minutes Peak Flow Period = 15 minutes Flow Rates include effects of Flow Scale and Peak Flow Factor Flow Rates (Separate Light and Heavy Vehicles) Site:Strasburg Road-N-Robert Ferrie Drive-Weekday AM 2016 Mov Left Through Right ID LV HV LV HV LV HV Demand flows in veh/h as used by the program South: Strasburg Road 8T T R R East: Robert Ferrie Drive 1L L R R L L T T Unit Time for Volumes = 60 minutes Peak Flow Period = 15 minutes Flow Rates include effects of Flow Scale and Peak Flow Factor Flow Rates (Total Vehicles and Percent Heavy) Site:Strasburg Road-N-Robert Ferrie Drive-Weekday AM Mov Left Through Right ID Total %HV Total %HV Total %HV ---
104 Detailed Output Page 10 of 10 Demand flows in veh/h as used by the program South: Strasburg Road 8T T R R East: Robert Ferrie Drive 1L L R R L L T T Unit Time for Volumes = 60 minutes Peak Flow Period = 15 minutes Flow Rates include effects of Flow Scale and Peak Flow Factor Other Model Settings Site:Strasburg Road-N-Robert Ferrie Drive-Weekday AM 2016 * Basic Parameters: Intersection Type: Driving on the right-hand side of the road Input data specified in Metric units Model Defaults: US HCM (Metric) Peak Flow Period (for performance): 15 minutes Unit time (for volumes): 60 minutes. HCM Delay Model option used HCM Queue Model option used Level of Service based on: Delay (HCM 2000) Queue percentile: 95% Parameters Used in Cost Calculations Site:Strasburg Road-N-Robert Ferrie Drive-Weekday AM 2016 Pump price of fuel ($/L) = Fuel resource cost factor = 0.70 Ratio of running cost to fuel cost = 3.0 Average income ($/h) = Time value factor = 0.40 Light vehicle mass (1000 kg) = 1.4 Heavy vehicle mass (1000 kg) = 11.0 Light vehicle idle fuel rate (L/h) = Heavy vehicle idle fuel rate (L/h) = Diagnostics Site:Strasburg Road-N-Robert Ferrie Drive-Weekday AM 2016 Processed: January 24, :55:28 PM SIDRA INTERSECTION Copyright Akcelik and Associates Pty Ltd Project: H:\DATA\ Transportation Planning\Working\Strasburg Road\SIDRA Files\PC\Robert Ferrie Drive and Strasburg Road - Final.sip , SNC-LAVALIN INC, SINGLE about:blank 2012/01/24
105 Detailed Output about:blank Page 1 of /01/24 DETAILED OUTPUT Strasburg Road-N-Robert Ferrie Drive Strasburg Road-N-Robert Ferrie Drive-Weekday PM 2016 OUTPUT TABLE LINKS s Basic Parameters Gap Acceptance Parameters Movements Movement Capacity Parameters Movement Performance Fuel Consumption, Emissions and Cost (Total) Fuel Consumption, Emissions and Cost (Rate) Intersection Negotiation Data Movement Speeds and Geometric Delay Lanes Lane Performance Lane Flow and Capacity Information Lane, Approach and Intersection Performance Driver Characteristics Lane Delays Lane Queues (Vehicles) Lane Queues (Distance) Lane Queue Percentiles (Vehicles) Lane Queue Percentiles (Distance) Lane Stops Flow Rates and Demand Analysis Movement Definitions and Flow Rates (O-D) Flow Rates (Separate Light and Heavy Vehicles) Flow Rates (Total Vehicles and Percent Heavy) Other Model Settings Parameters Used in Cost Calculations Diagnostics s Basic Parameters Site:Strasburg Road-N-Robert Ferrie Drive-Weekday PM Circulating/Exiting Stream Cent Circ Insc Ent Ent Cir Ent Av.Ent Island Width Diam. Rad Ang Lan Lan Lane Flow %HV Adjust. %Exit Cap. O-D Diam Width Flow Incl. Constr. Factor m m m m deg m veh/h pcu/h Effect South: Strasburg Road Environment Factor: 1.20 Entry/Circulating Flow Adjustment: Medium N East: Robert Ferrie Drive Environment Factor: 1.20 Entry/Circulating Flow Adjustment: Medium N Environment Factor: 1.20 Entry/Circulating Flow Adjustment: Medium N 0.988
106 Detailed Output about:blank Page 2 of /01/ Capacity Model: SIDRA Standard HV Method for Gap Acceptance: Include HV Effect for all percentages Gap Acceptance Parameters Site:Strasburg Road-N-Robert Ferrie Drive-Weekday PM Turn Lane Lane ---- Circulating/Exiting Stream --- Critical Gap No. Type Flow Aver Aver In-Bnch Prop Foll-up Rate Speed Dist Headway Bunched Hdwy Dist Headway pcu/h km/h m sec sec m sec South: Strasburg Road Environment Factor: 1.20 Entry/Circulating Flow Adjustment: Medium Thru 1 Subdominant Dominant Right 2 Dominant East: Robert Ferrie Drive Environment Factor: 1.20 Entry/Circulating Flow Adjustment: Medium Left 1 Dominant Right 1 Dominant Environment Factor: 1.20 Entry/Circulating Flow Adjustment: Medium Left 1 Subdominant Thru 1 Subdominant Dominant Capacity Model: SIDRA Standard Priority sharing is implied for some movements (Follow-up Headway plus Intra-bunch Headway is larger than the Critical Gap). The O-D Factor ( Basic Parameters table) allows for priority sharing and priority emphasis. Dist (Distance): Spacing, i.e. distance between the front ends of two successive vehicles across all lanes in the circulating or exiting stream Movements Movement Capacity Parameters Site:Strasburg Road-N-Robert Ferrie Drive-Weekday PM Mov Opposing Movement Total Prac. Prac. Lane Deg. ID Demand Adjust. Cap. Deg. Spare Util Satn Flow HV Flow HV Flow Satn Cap. veh/h % veh/h % pcu/h veh/h xp % % x South: Strasburg Road 8T T R R East: Robert Ferrie Drive 1L L R R L L * 4T T * * Maximum degree of saturation
107 Detailed Output about:blank Page 3 of /01/24 Movement Performance Site:Strasburg Road-N-Robert Ferrie Drive-Weekday PM Mov Total Total Aver. Eff. Total Perf. Tot.Trav. Tot.Trav. Aver. ID Delay Delay Delay Stop Stops Index Distance Time Speed (veh-h/h)(pers-h/h)(sec) Rate (veh-km/h)(veh-h/h) (km/h) South: Strasburg Road 8T T R R East: Robert Ferrie Drive 1L L R R L L T T Fuel Consumption, Emissions and Cost (Total) Site:Strasburg Road-N-Robert Ferrie Drive-Weekday PM 2016 Mov Cost Fuel CO2 CO HC NOX ID Total Total Total Total Total Total $/h L/h kg/h kg/h kg/h kg/h South: Strasburg Road 8T T R R East: Robert Ferrie Drive 1L L R R L L T T INTERSECTION: Fuel Consumption, Emissions and Cost (Rate) Site:Strasburg Road-N-Robert Ferrie Drive-Weekday PM 2016 Mov Cost Fuel CO2 CO HC NOX ID Rate Rate Rate Rate Rate Rate $/km L/100km g/km g/km g/km g/km South: Strasburg Road 8T T R R
108 Detailed Output about:blank Page 4 of /01/24 East: Robert Ferrie Drive 1L L R R L L T T INTERSECTION: Intersection Negotiation Data Site:Strasburg Road-N-Robert Ferrie Drive-Weekday PM Negn Negn Negn Appr. Downstream Distance From To Radius Speed Dist. Dist Approach Approach Turn m km/h m m m User Spec? South: Strasburg Road East Right No North Thru No East: Robert Ferrie Drive South Left No North Right No South Thru No East Left No Maximum Negotiation (Design) Speed = 50.0 km/h Downstream distance is distance travelled from the stopline until exit cruise speed is reached (includes negotiation distance). Acceleration distance is weighted for light and heavy vehicles. The same distance applies for both stopped and unstopped vehicles. Movement Speeds and Geometric Delay Site:Strasburg Road-N-Robert Ferrie Drive-Weekday PM Queue Move-up App. Speeds Exit Speeds Av. Section Spd Geom Mov st 2nd Delay ID Cruise Negn Negn Cruise Grn Grn Running Overall sec South: Strasburg Road 8T T R R East: Robert Ferrie Drive 1L L R R L L T T "Running Speed" is the average speed excluding stopped periods. HCM Delay Formula option used: Geometric Delay is not included in Control Delay.
109 Detailed Output about:blank Page 5 of /01/24 Lanes Lane Performance Site:Strasburg Road-N-Robert Ferrie Drive-Weekday PM 2016 Q u e u e Flow Cap Deg. Aver. Eff. 95% Back Lane Lane Satn Delay Stop Length No. veh/h veh/h x sec Rate veh m m South: Strasburg Road 1 T TR East: Robert Ferrie Drive 1 LR LT T Lane Flow and Capacity Information Site:Strasburg Road-N-Robert Ferrie Drive-Weekday PM Lane Dem Flow (veh/h) Min Tot Deg. Lane No Cap Cap Satn Util Lef Thru Rig Tot veh/h veh/h x % South: Strasburg Road 1 T TR East: Robert Ferrie Drive 1 LR LT T The capacity value for priority and continuous movements is obtained by adjusting the basic saturation flow for heavy vehicle and turning vehicle effects. Saturation flow scale applies if specified. Lane, Approach and Intersection Performance Site:Strasburg Road-N-Robert Ferrie Drive-Weekday PM Lane Demand Flow (veh/h) Adj. Eff Grn Deg Aver. Longest Shrt No %HV Basic (sec) Sat Delay Queue Lane L T R Tot Satf. 1st 2nd x sec m m South: Strasburg Road 1 T TR
110 Detailed Output about:blank Page 6 of /01/ East: Robert Ferrie Drive 1 LR LT T ========================================================================== ALL VEHICLES Total % Max Aver. Max Flow HV X Delay Queue ========================================================================== Peak flow period = 15 minutes. Queue values in this table are 95% queue (metres) Note: Basic Saturation Flows are not adjusted at roundabouts or signcontrolled intersections and apply only to continuous lanes. Driver Characteristics Site:Strasburg Road-N-Robert Ferrie Drive-Weekday PM Average Driver Lane Satn Satn Satn Satn Queue Response No. Speed Flow Hdwy Spacing Space Time km/h veh/h sec m m sec South: Strasburg Road 1 T TR East: Robert Ferrie Drive 1 LR LT T Saturation Flow and Saturation Headway are derived from follow-up headway. Lane Delays Site:Strasburg Road-N-Robert Ferrie Drive-Weekday PM Delay (seconds/veh) Deg. Stop-line Delay Acc. Queuing Stopd Lane Satn 1st 2nd Total Dec. Total MvUp (Idle) Geom Control No. x d1 d2 dsl dn dq dqm di dig dic South: Strasburg Road 1 T TR East: Robert Ferrie Drive 1 LR LT T HCM Delay Formula option used: (i) Control Delay does not include Geometric Delay, (ii) Stop-line Delay is treated as being same as Control Delay.
111 Detailed Output about:blank Page 7 of /01/24 dsl: Stop-line delay (=d1+d2) dn: Average stop-start delay for all vehicles queued and unqueued dq: Queuing delay (the part of the stop-line delay that includes stopped delay and queue move-up delay) dqm: Queue move-up delay di: Stopped delay (stopped (idling) time at near-zero speed) dig: Geometric delay dic: Intersection control delay (sum of stop-line and geometric delays) Lane Queues (Vehicles) Site:Strasburg Road-N-Robert Ferrie Drive-Weekday PM Deg. Ovrfl. Back of Queue (veh) Queue Prob. P'ile Cyc-Av. Queue Lane Satn Queue Stor. Block Block No. x No Nb1 Nb2 Nb 95% Ratio % % Nc 95% South: Strasburg Road 1 T TR East: Robert Ferrie Drive 1 LR LT T HCM Delay Formula option used: Cycle-Average Queue is calculated using average delay from the HCM equation. (i.e. HCM delays are treated as stop-line delays for this purpose). SIDRA Standard models are used for Back of Queue estimation since HCM only gives Cycle-Average Queues for unsignalised intersections. Lane Queues (Distance) Site:Strasburg Road-N-Robert Ferrie Drive-Weekday PM Deg. Ovrfl. Back of Queue (m) Queue Prob. P'ile Cyc-Av. Queue Lane Satn Queue Stor. Block Block No. x No Nb1 Nb2 Nb 95% Ratio % % Nc 95% South: Strasburg Road 1 T TR East: Robert Ferrie Drive 1 LR LT T HCM Delay Formula option used: Cycle-Average Queue is calculated using average delay from the HCM equation. (i.e. HCM delays are treated as stop-line delays for this purpose). SIDRA Standard models are used for Back of Queue estimation since HCM only gives Cycle-Average Queues for unsignalised intersections. Lane Queue Percentiles (Vehicles) Site:Strasburg Road-N-Robert Ferrie Drive-Weekday PM 2016
112 Detailed Output about:blank Page 8 of /01/ Deg. Percentile Back of Queue (veh) Lane Satn No. x 50% 70% 85% 90% 95% 98% South: Strasburg Road 1 T TR East: Robert Ferrie Drive 1 LR LT T SIDRA Standard models are used for Back of Queue estimation since HCM only gives Cycle-Average Queues for unsignalised intersections. Lane Queue Percentiles (Distance) Site:Strasburg Road-N-Robert Ferrie Drive-Weekday PM Deg. Percentile Back of Queue (metres) Lane Satn No. x 50% 70% 85% 90% 95% 98% South: Strasburg Road 1 T TR East: Robert Ferrie Drive 1 LR LT T SIDRA Standard models are used for Back of Queue estimation since HCM only gives Cycle-Average Queues for unsignalised intersections. Lane Stops Site:Strasburg Road-N-Robert Ferrie Drive-Weekday PM Queue Total Deg. -- Effective Stop Rate -- Total Move-up Queue Prop. Lane Satn Geom. Overall Stops Rate Move-ups Queued No. x he1 he2 hig h H hqm Hqm pq South: Strasburg Road 1 T TR East: Robert Ferrie Drive 1 LR LT T hig is the average value for all movements in a shared lane hqm is average queue move-up rate for all vehicles queued and unqueued
113 Detailed Output about:blank Page 9 of /01/24 Flow Rates and Demand Analysis Movement Definitions and Flow Rates (O-D) Site:Strasburg Road-N-Robert Ferrie Drive-Weekday PM From To Mov Flow Rate Flow Scale Peak Flow Approach Approach ID Turn LV HV Fixed Var Factor South: Strasburg Road East 8R Right North 8T Thru East: Robert Ferrie Drive South 1L Left North 6R Right South 4T Thru East 7L Left Unit Time for Volumes = 60 minutes Peak Flow Period = 15 minutes Flow Rates include effects of Flow Scale and Peak Flow Factor Flow Rates (Separate Light and Heavy Vehicles) Site:Strasburg Road-N-Robert Ferrie Drive-Weekday PM 2016 Mov Left Through Right ID LV HV LV HV LV HV Demand flows in veh/h as used by the program South: Strasburg Road 8T T R R East: Robert Ferrie Drive 1L L R R L L T T Unit Time for Volumes = 60 minutes Peak Flow Period = 15 minutes Flow Rates include effects of Flow Scale and Peak Flow Factor Flow Rates (Total Vehicles and Percent Heavy) Site:Strasburg Road-N-Robert Ferrie Drive-Weekday PM Mov Left Through Right ID Total %HV Total %HV Total %HV ---
114 Detailed Output Page 10 of 10 Demand flows in veh/h as used by the program South: Strasburg Road 8T T R R East: Robert Ferrie Drive 1L L R R L L T T Unit Time for Volumes = 60 minutes Peak Flow Period = 15 minutes Flow Rates include effects of Flow Scale and Peak Flow Factor Other Model Settings Site:Strasburg Road-N-Robert Ferrie Drive-Weekday PM 2016 * Basic Parameters: Intersection Type: Driving on the right-hand side of the road Input data specified in Metric units Model Defaults: US HCM (Metric) Peak Flow Period (for performance): 15 minutes Unit time (for volumes): 60 minutes. HCM Delay Model option used HCM Queue Model option used Level of Service based on: Delay (HCM 2000) Queue percentile: 95% Parameters Used in Cost Calculations Site:Strasburg Road-N-Robert Ferrie Drive-Weekday PM 2016 Pump price of fuel ($/L) = Fuel resource cost factor = 0.70 Ratio of running cost to fuel cost = 3.0 Average income ($/h) = Time value factor = 0.40 Light vehicle mass (1000 kg) = 1.4 Heavy vehicle mass (1000 kg) = 11.0 Light vehicle idle fuel rate (L/h) = Heavy vehicle idle fuel rate (L/h) = Diagnostics Site:Strasburg Road-N-Robert Ferrie Drive-Weekday PM 2016 Processed: January 24, :56:07 PM SIDRA INTERSECTION Copyright Akcelik and Associates Pty Ltd Project: H:\DATA\ Transportation Planning\Working\Strasburg Road\SIDRA Files\PC\Robert Ferrie Drive and Strasburg Road - Final.sip , SNC-LAVALIN INC, SINGLE about:blank 2012/01/24
115 Detailed Output DETAILED OUTPUT Strasburg Road-N-Robert Ferrie Drive Page 1 of 10 Strasburg Road-N-Robert Ferrie Drive-Weekday AM 2031 OUTPUT TABLE LINKS s Basic Parameters Gap Acceptance Parameters Movements Movement Capacity Parameters Movement Performance Fuel Consumption, Emissions and Cost (Total) Fuel Consumption, Emissions and Cost (Rate) Intersection Negotiation Data Movement Speeds and Geometric Delay Lanes Lane Performance Lane Flow and Capacity Information Lane, Approach and Intersection Performance Driver Characteristics Lane Delays Lane Queues (Vehicles) Lane Queues (Distance) Lane Queue Percentiles (Vehicles) Lane Queue Percentiles (Distance) Lane Stops Flow Rates and Demand Analysis Movement Definitions and Flow Rates (O-D) Flow Rates (Separate Light and Heavy Vehicles) Flow Rates (Total Vehicles and Percent Heavy) Other Model Settings Parameters Used in Cost Calculations Diagnostics s Basic Parameters Site:Strasburg Road-N-Robert Ferrie Drive-Weekday AM Circulating/Exiting Stream Cent Circ Insc Ent Ent Cir Ent Av.Ent Island Width Diam. Rad Ang Lan Lan Lane Flow %HV Adjust. %Exit Cap. O-D Diam Width Flow Incl. Constr. Factor m m m m deg m veh/h pcu/h Effect South: Strasburg Road Environment Factor: 1.20 Entry/Circulating Flow Adjustment: Medium N East: Robert Ferrie Drive Environment Factor: 1.20 Entry/Circulating Flow Adjustment: Medium N Environment Factor: 1.20 Entry/Circulating Flow Adjustment: Medium N Capacity Model: SIDRA Standard HV Method for Gap Acceptance: Include HV Effect for all percentages about:blank 2012/01/24
116 Detailed Output Page 2 of 10 Gap Acceptance Parameters Site:Strasburg Road-N-Robert Ferrie Drive-Weekday AM Turn Lane Lane ---- Circulating/Exiting Stream --- Critical Gap No. Type Flow Aver Aver In-Bnch Prop Foll-up Rate Speed Dist Headway Bunched Hdwy Dist Headway pcu/h km/h m sec sec m sec South: Strasburg Road Environment Factor: 1.20 Entry/Circulating Flow Adjustment: Medium Thru 1 Subdominant Dominant Right 2 Dominant East: Robert Ferrie Drive Environment Factor: 1.20 Entry/Circulating Flow Adjustment: Medium Left 1 Dominant Right 1 Dominant Environment Factor: 1.20 Entry/Circulating Flow Adjustment: Medium Left 1 Subdominant Thru 1 Subdominant Dominant Capacity Model: SIDRA Standard Priority sharing is implied for some movements (Follow-up Headway plus Intra-bunch Headway is larger than the Critical Gap). The O-D Factor ( Basic Parameters table) allows for priority sharing and priority emphasis. Dist (Distance): Spacing, i.e. distance between the front ends of two successive vehicles across all lanes in the circulating or exiting stream Movements Movement Capacity Parameters Site:Strasburg Road-N-Robert Ferrie Drive-Weekday AM Mov Opposing Movement Total Prac. Prac. Lane Deg. ID Demand Adjust. Cap. Deg. Spare Util Satn Flow HV Flow HV Flow Satn Cap. veh/h % veh/h % pcu/h veh/h xp % % x South: Strasburg Road 8T T R R East: Robert Ferrie Drive 1L L * 6R R * L L T T * Maximum degree of saturation Movement Performance Site:Strasburg Road-N-Robert Ferrie Drive-Weekday AM 2031 about:blank 2012/01/24
117 Detailed Output Page 3 of Mov Total Total Aver. Eff. Total Perf. Tot.Trav. Tot.Trav. Aver. ID Delay Delay Delay Stop Stops Index Distance Time Speed (veh-h/h)(pers-h/h)(sec) Rate (veh-km/h)(veh-h/h) (km/h) South: Strasburg Road 8T T R R East: Robert Ferrie Drive 1L L R R L L T T Fuel Consumption, Emissions and Cost (Total) Site:Strasburg Road-N-Robert Ferrie Drive-Weekday AM 2031 Mov Cost Fuel CO2 CO HC NOX ID Total Total Total Total Total Total $/h L/h kg/h kg/h kg/h kg/h South: Strasburg Road 8T T R R East: Robert Ferrie Drive 1L L R R L L T T INTERSECTION: Fuel Consumption, Emissions and Cost (Rate) Site:Strasburg Road-N-Robert Ferrie Drive-Weekday AM 2031 Mov Cost Fuel CO2 CO HC NOX ID Rate Rate Rate Rate Rate Rate $/km L/100km g/km g/km g/km g/km South: Strasburg Road 8T T R R East: Robert Ferrie Drive 1L L R R L L T T about:blank 2012/01/24
118 about:blank 2012/01/24 Detailed Output INTERSECTION: Page 4 of 10 Intersection Negotiation Data Site:Strasburg Road-N-Robert Ferrie Drive-Weekday AM Negn Negn Negn Appr. Downstream Distance From To Radius Speed Dist. Dist Approach Approach Turn m km/h m m m User Spec? South: Strasburg Road East Right No North Thru No East: Robert Ferrie Drive South Left No North Right No South Thru No East Left No Maximum Negotiation (Design) Speed = 50.0 km/h Downstream distance is distance travelled from the stopline until exit cruise speed is reached (includes negotiation distance). Acceleration distance is weighted for light and heavy vehicles. The same distance applies for both stopped and unstopped vehicles. Movement Speeds and Geometric Delay Site:Strasburg Road-N-Robert Ferrie Drive-Weekday AM Queue Move-up App. Speeds Exit Speeds Av. Section Spd Geom Mov st 2nd Delay ID Cruise Negn Negn Cruise Grn Grn Running Overall sec South: Strasburg Road 8T T R R East: Robert Ferrie Drive 1L L R R L L T T "Running Speed" is the average speed excluding stopped periods. HCM Delay Formula option used: Geometric Delay is not included in Control Delay. Lanes Lane Performance Site:Strasburg Road-N-Robert Ferrie Drive-Weekday AM 2031
119 Detailed Output Q u e u e Flow Cap Deg. Aver. Eff. 95% Back Lane Lane Satn Delay Stop Length No. veh/h veh/h x sec Rate veh m m South: Strasburg Road 1 T TR East: Robert Ferrie Drive 1 LR LT T Page 5 of 10 Lane Flow and Capacity Information Site:Strasburg Road-N-Robert Ferrie Drive-Weekday AM Lane Dem Flow (veh/h) Min Tot Deg. Lane No Cap Cap Satn Util Lef Thru Rig Tot veh/h veh/h x % South: Strasburg Road 1 T TR East: Robert Ferrie Drive 1 LR LT T The capacity value for priority and continuous movements is obtained by adjusting the basic saturation flow for heavy vehicle and turning vehicle effects. Saturation flow scale applies if specified. Lane, Approach and Intersection Performance Site:Strasburg Road-N-Robert Ferrie Drive-Weekday AM Lane Demand Flow (veh/h) Adj. Eff Grn Deg Aver. Longest Shrt No %HV Basic (sec) Sat Delay Queue Lane L T R Tot Satf. 1st 2nd x sec m m South: Strasburg Road 1 T TR East: Robert Ferrie Drive 1 LR LT T ========================================================================== ALL VEHICLES Total % Max Aver. Max Flow HV X Delay Queue ========================================================================== about:blank 2012/01/24
120 Detailed Output Peak flow period = 15 minutes. Page 6 of 10 Queue values in this table are 95% queue (metres) Note: Basic Saturation Flows are not adjusted at roundabouts or signcontrolled intersections and apply only to continuous lanes. Driver Characteristics Site:Strasburg Road-N-Robert Ferrie Drive-Weekday AM Average Driver Lane Satn Satn Satn Satn Queue Response No. Speed Flow Hdwy Spacing Space Time km/h veh/h sec m m sec South: Strasburg Road 1 T TR East: Robert Ferrie Drive 1 LR LT T Saturation Flow and Saturation Headway are derived from follow-up headway. Lane Delays Site:Strasburg Road-N-Robert Ferrie Drive-Weekday AM Delay (seconds/veh) Deg. Stop-line Delay Acc. Queuing Stopd Lane Satn 1st 2nd Total Dec. Total MvUp (Idle) Geom Control No. x d1 d2 dsl dn dq dqm di dig dic South: Strasburg Road 1 T TR East: Robert Ferrie Drive 1 LR LT T HCM Delay Formula option used: (i) Control Delay does not include Geometric Delay, (ii) Stop-line Delay is treated as being same as Control Delay. dsl: Stop-line delay (=d1+d2) dn: Average stop-start delay for all vehicles queued and unqueued dq: Queuing delay (the part of the stop-line delay that includes stopped delay and queue move-up delay) dqm: Queue move-up delay di: Stopped delay (stopped (idling) time at near-zero speed) dig: Geometric delay dic: Intersection control delay (sum of stop-line and geometric delays) Lane Queues (Vehicles) Site:Strasburg Road-N-Robert Ferrie Drive-Weekday AM about:blank 2012/01/24
121 about:blank 2012/01/24 Detailed Output Deg. Ovrfl. Back of Queue (veh) Queue Prob. P'ile Cyc-Av. Queue Lane Satn Queue Stor. Block Block No. x No Nb1 Nb2 Nb 95% Ratio % % Nc 95% South: Strasburg Road 1 T TR East: Robert Ferrie Drive 1 LR LT T Page 7 of 10 HCM Delay Formula option used: Cycle-Average Queue is calculated using average delay from the HCM equation. (i.e. HCM delays are treated as stop-line delays for this purpose). SIDRA Standard models are used for Back of Queue estimation since HCM only gives Cycle-Average Queues for unsignalised intersections. Lane Queues (Distance) Site:Strasburg Road-N-Robert Ferrie Drive-Weekday AM Deg. Ovrfl. Back of Queue (m) Queue Prob. P'ile Cyc-Av. Queue Lane Satn Queue Stor. Block Block No. x No Nb1 Nb2 Nb 95% Ratio % % Nc 95% South: Strasburg Road 1 T TR East: Robert Ferrie Drive 1 LR LT T HCM Delay Formula option used: Cycle-Average Queue is calculated using average delay from the HCM equation. (i.e. HCM delays are treated as stop-line delays for this purpose). SIDRA Standard models are used for Back of Queue estimation since HCM only gives Cycle-Average Queues for unsignalised intersections. Lane Queue Percentiles (Vehicles) Site:Strasburg Road-N-Robert Ferrie Drive-Weekday AM Deg. Percentile Back of Queue (veh) Lane Satn No. x 50% 70% 85% 90% 95% 98% South: Strasburg Road 1 T TR East: Robert Ferrie Drive 1 LR LT T SIDRA Standard models are used for Back of Queue estimation since HCM only gives Cycle-Average Queues for unsignalised intersections.
122 Detailed Output Page 8 of 10 Lane Queue Percentiles (Distance) Site:Strasburg Road-N-Robert Ferrie Drive-Weekday AM Deg. Percentile Back of Queue (metres) Lane Satn No. x 50% 70% 85% 90% 95% 98% South: Strasburg Road 1 T TR East: Robert Ferrie Drive 1 LR LT T SIDRA Standard models are used for Back of Queue estimation since HCM only gives Cycle-Average Queues for unsignalised intersections. Lane Stops Site:Strasburg Road-N-Robert Ferrie Drive-Weekday AM Queue Total Deg. -- Effective Stop Rate -- Total Move-up Queue Prop. Lane Satn Geom. Overall Stops Rate Move-ups Queued No. x he1 he2 hig h H hqm Hqm pq South: Strasburg Road 1 T TR East: Robert Ferrie Drive 1 LR LT T hig is the average value for all movements in a shared lane hqm is average queue move-up rate for all vehicles queued and unqueued Flow Rates and Demand Analysis Movement Definitions and Flow Rates (O-D) Site:Strasburg Road-N-Robert Ferrie Drive-Weekday AM From To Mov Flow Rate Flow Scale Peak Flow Approach Approach ID Turn LV HV Fixed Var Factor South: Strasburg Road East 8R Right North 8T Thru East: Robert Ferrie Drive South 1L Left North 6R Right about:blank 2012/01/24
123 about:blank 2012/01/24 Detailed Output South 4T Thru East 7L Left Unit Time for Volumes = 60 minutes Peak Flow Period = 15 minutes Flow Rates include effects of Flow Scale and Peak Flow Factor Page 9 of 10 Flow Rates (Separate Light and Heavy Vehicles) Site:Strasburg Road-N-Robert Ferrie Drive-Weekday AM 2031 Mov Left Through Right ID LV HV LV HV LV HV Demand flows in veh/h as used by the program South: Strasburg Road 8T T R R East: Robert Ferrie Drive 1L L R R L L T T Unit Time for Volumes = 60 minutes Peak Flow Period = 15 minutes Flow Rates include effects of Flow Scale and Peak Flow Factor Flow Rates (Total Vehicles and Percent Heavy) Site:Strasburg Road-N-Robert Ferrie Drive-Weekday AM Mov Left Through Right ID Total %HV Total %HV Total %HV --- Demand flows in veh/h as used by the program South: Strasburg Road 8T T R R East: Robert Ferrie Drive 1L L R R L L T T Unit Time for Volumes = 60 minutes Peak Flow Period = 15 minutes Flow Rates include effects of Flow Scale and Peak Flow Factor Other Model Settings Site:Strasburg Road-N-Robert Ferrie Drive-Weekday AM 2031
124 about:blank 2012/01/24 Detailed Output Page 10 of 10 * Basic Parameters: Intersection Type: Driving on the right-hand side of the road Input data specified in Metric units Model Defaults: US HCM (Metric) Peak Flow Period (for performance): 15 minutes Unit time (for volumes): 60 minutes. HCM Delay Model option used HCM Queue Model option used Level of Service based on: Delay (HCM 2000) Queue percentile: 95% Parameters Used in Cost Calculations Site:Strasburg Road-N-Robert Ferrie Drive-Weekday AM 2031 Pump price of fuel ($/L) = Fuel resource cost factor = 0.70 Ratio of running cost to fuel cost = 3.0 Average income ($/h) = Time value factor = 0.40 Light vehicle mass (1000 kg) = 1.4 Heavy vehicle mass (1000 kg) = 11.0 Light vehicle idle fuel rate (L/h) = Heavy vehicle idle fuel rate (L/h) = Diagnostics Site:Strasburg Road-N-Robert Ferrie Drive-Weekday AM 2031 Processed: January 24, :06:28 PM SIDRA INTERSECTION Copyright Akcelik and Associates Pty Ltd Project: H:\DATA\ Transportation Planning\Working\Strasburg Road\SIDRA Files\PC\Robert Ferrie Drive and Strasburg Road - Final.sip , SNC-LAVALIN INC, SINGLE
125 Detailed Output about:blank Page 1 of /01/24 DETAILED OUTPUT Strasburg Road-N-Robert Ferrie Drive Strasburg Road-N-Robert Ferrie Drive-Weekday PM 2031 OUTPUT TABLE LINKS s Basic Parameters Gap Acceptance Parameters Movements Movement Capacity Parameters Movement Performance Fuel Consumption, Emissions and Cost (Total) Fuel Consumption, Emissions and Cost (Rate) Intersection Negotiation Data Movement Speeds and Geometric Delay Lanes Lane Performance Lane Flow and Capacity Information Lane, Approach and Intersection Performance Driver Characteristics Lane Delays Lane Queues (Vehicles) Lane Queues (Distance) Lane Queue Percentiles (Vehicles) Lane Queue Percentiles (Distance) Lane Stops Flow Rates and Demand Analysis Movement Definitions and Flow Rates (O-D) Flow Rates (Separate Light and Heavy Vehicles) Flow Rates (Total Vehicles and Percent Heavy) Other Model Settings Parameters Used in Cost Calculations Diagnostics s Basic Parameters Site:Strasburg Road-N-Robert Ferrie Drive-Weekday PM Circulating/Exiting Stream Cent Circ Insc Ent Ent Cir Ent Av.Ent Island Width Diam. Rad Ang Lan Lan Lane Flow %HV Adjust. %Exit Cap. O-D Diam Width Flow Incl. Constr. Factor m m m m deg m veh/h pcu/h Effect South: Strasburg Road Environment Factor: 1.20 Entry/Circulating Flow Adjustment: Medium N East: Robert Ferrie Drive Environment Factor: 1.20 Entry/Circulating Flow Adjustment: Medium N Environment Factor: 1.20 Entry/Circulating Flow Adjustment: Medium N 0.964
126 Detailed Output about:blank Page 2 of /01/ Capacity Model: SIDRA Standard HV Method for Gap Acceptance: Include HV Effect for all percentages Gap Acceptance Parameters Site:Strasburg Road-N-Robert Ferrie Drive-Weekday PM Turn Lane Lane ---- Circulating/Exiting Stream --- Critical Gap No. Type Flow Aver Aver In-Bnch Prop Foll-up Rate Speed Dist Headway Bunched Hdwy Dist Headway pcu/h km/h m sec sec m sec South: Strasburg Road Environment Factor: 1.20 Entry/Circulating Flow Adjustment: Medium Thru 1 Subdominant Dominant Right 2 Dominant East: Robert Ferrie Drive Environment Factor: 1.20 Entry/Circulating Flow Adjustment: Medium Left 1 Dominant Right 1 Dominant Environment Factor: 1.20 Entry/Circulating Flow Adjustment: Medium Left 1 Subdominant Thru 1 Subdominant Dominant Capacity Model: SIDRA Standard Priority sharing is implied for some movements (Follow-up Headway plus Intra-bunch Headway is larger than the Critical Gap). The O-D Factor ( Basic Parameters table) allows for priority sharing and priority emphasis. Dist (Distance): Spacing, i.e. distance between the front ends of two successive vehicles across all lanes in the circulating or exiting stream Movements Movement Capacity Parameters Site:Strasburg Road-N-Robert Ferrie Drive-Weekday PM Mov Opposing Movement Total Prac. Prac. Lane Deg. ID Demand Adjust. Cap. Deg. Spare Util Satn Flow HV Flow HV Flow Satn Cap. veh/h % veh/h % pcu/h veh/h xp % % x South: Strasburg Road 8T T R R East: Robert Ferrie Drive 1L L * 6R R * L L T T * Maximum degree of saturation
127 Detailed Output about:blank Page 3 of /01/24 Movement Performance Site:Strasburg Road-N-Robert Ferrie Drive-Weekday PM Mov Total Total Aver. Eff. Total Perf. Tot.Trav. Tot.Trav. Aver. ID Delay Delay Delay Stop Stops Index Distance Time Speed (veh-h/h)(pers-h/h)(sec) Rate (veh-km/h)(veh-h/h) (km/h) South: Strasburg Road 8T T R R East: Robert Ferrie Drive 1L L R R L L T T Fuel Consumption, Emissions and Cost (Total) Site:Strasburg Road-N-Robert Ferrie Drive-Weekday PM 2031 Mov Cost Fuel CO2 CO HC NOX ID Total Total Total Total Total Total $/h L/h kg/h kg/h kg/h kg/h South: Strasburg Road 8T T R R East: Robert Ferrie Drive 1L L R R L L T T INTERSECTION: Fuel Consumption, Emissions and Cost (Rate) Site:Strasburg Road-N-Robert Ferrie Drive-Weekday PM 2031 Mov Cost Fuel CO2 CO HC NOX ID Rate Rate Rate Rate Rate Rate $/km L/100km g/km g/km g/km g/km South: Strasburg Road 8T T R R
128 Detailed Output about:blank Page 4 of /01/24 East: Robert Ferrie Drive 1L L R R L L T T INTERSECTION: Intersection Negotiation Data Site:Strasburg Road-N-Robert Ferrie Drive-Weekday PM Negn Negn Negn Appr. Downstream Distance From To Radius Speed Dist. Dist Approach Approach Turn m km/h m m m User Spec? South: Strasburg Road East Right No North Thru No East: Robert Ferrie Drive South Left No North Right No South Thru No East Left No Maximum Negotiation (Design) Speed = 50.0 km/h Downstream distance is distance travelled from the stopline until exit cruise speed is reached (includes negotiation distance). Acceleration distance is weighted for light and heavy vehicles. The same distance applies for both stopped and unstopped vehicles. Movement Speeds and Geometric Delay Site:Strasburg Road-N-Robert Ferrie Drive-Weekday PM Queue Move-up App. Speeds Exit Speeds Av. Section Spd Geom Mov st 2nd Delay ID Cruise Negn Negn Cruise Grn Grn Running Overall sec South: Strasburg Road 8T T R R East: Robert Ferrie Drive 1L L R R L L T T "Running Speed" is the average speed excluding stopped periods. HCM Delay Formula option used: Geometric Delay is not included in Control Delay.
129 Detailed Output about:blank Page 5 of /01/24 Lanes Lane Performance Site:Strasburg Road-N-Robert Ferrie Drive-Weekday PM 2031 Q u e u e Flow Cap Deg. Aver. Eff. 95% Back Lane Lane Satn Delay Stop Length No. veh/h veh/h x sec Rate veh m m South: Strasburg Road 1 T TR East: Robert Ferrie Drive 1 LR LT T Lane Flow and Capacity Information Site:Strasburg Road-N-Robert Ferrie Drive-Weekday PM Lane Dem Flow (veh/h) Min Tot Deg. Lane No Cap Cap Satn Util Lef Thru Rig Tot veh/h veh/h x % South: Strasburg Road 1 T TR East: Robert Ferrie Drive 1 LR LT T The capacity value for priority and continuous movements is obtained by adjusting the basic saturation flow for heavy vehicle and turning vehicle effects. Saturation flow scale applies if specified. Lane, Approach and Intersection Performance Site:Strasburg Road-N-Robert Ferrie Drive-Weekday PM Lane Demand Flow (veh/h) Adj. Eff Grn Deg Aver. Longest Shrt No %HV Basic (sec) Sat Delay Queue Lane L T R Tot Satf. 1st 2nd x sec m m South: Strasburg Road 1 T TR
130 Detailed Output about:blank Page 6 of /01/ East: Robert Ferrie Drive 1 LR LT T ========================================================================== ALL VEHICLES Total % Max Aver. Max Flow HV X Delay Queue ========================================================================== Peak flow period = 15 minutes. Queue values in this table are 95% queue (metres) Note: Basic Saturation Flows are not adjusted at roundabouts or signcontrolled intersections and apply only to continuous lanes. Driver Characteristics Site:Strasburg Road-N-Robert Ferrie Drive-Weekday PM Average Driver Lane Satn Satn Satn Satn Queue Response No. Speed Flow Hdwy Spacing Space Time km/h veh/h sec m m sec South: Strasburg Road 1 T TR East: Robert Ferrie Drive 1 LR LT T Saturation Flow and Saturation Headway are derived from follow-up headway. Lane Delays Site:Strasburg Road-N-Robert Ferrie Drive-Weekday PM Delay (seconds/veh) Deg. Stop-line Delay Acc. Queuing Stopd Lane Satn 1st 2nd Total Dec. Total MvUp (Idle) Geom Control No. x d1 d2 dsl dn dq dqm di dig dic South: Strasburg Road 1 T TR East: Robert Ferrie Drive 1 LR LT T HCM Delay Formula option used: (i) Control Delay does not include Geometric Delay, (ii) Stop-line Delay is treated as being same as Control Delay.
131 Detailed Output about:blank Page 7 of /01/24 dsl: Stop-line delay (=d1+d2) dn: Average stop-start delay for all vehicles queued and unqueued dq: Queuing delay (the part of the stop-line delay that includes stopped delay and queue move-up delay) dqm: Queue move-up delay di: Stopped delay (stopped (idling) time at near-zero speed) dig: Geometric delay dic: Intersection control delay (sum of stop-line and geometric delays) Lane Queues (Vehicles) Site:Strasburg Road-N-Robert Ferrie Drive-Weekday PM Deg. Ovrfl. Back of Queue (veh) Queue Prob. P'ile Cyc-Av. Queue Lane Satn Queue Stor. Block Block No. x No Nb1 Nb2 Nb 95% Ratio % % Nc 95% South: Strasburg Road 1 T TR East: Robert Ferrie Drive 1 LR LT T HCM Delay Formula option used: Cycle-Average Queue is calculated using average delay from the HCM equation. (i.e. HCM delays are treated as stop-line delays for this purpose). SIDRA Standard models are used for Back of Queue estimation since HCM only gives Cycle-Average Queues for unsignalised intersections. Lane Queues (Distance) Site:Strasburg Road-N-Robert Ferrie Drive-Weekday PM Deg. Ovrfl. Back of Queue (m) Queue Prob. P'ile Cyc-Av. Queue Lane Satn Queue Stor. Block Block No. x No Nb1 Nb2 Nb 95% Ratio % % Nc 95% South: Strasburg Road 1 T TR East: Robert Ferrie Drive 1 LR LT T HCM Delay Formula option used: Cycle-Average Queue is calculated using average delay from the HCM equation. (i.e. HCM delays are treated as stop-line delays for this purpose). SIDRA Standard models are used for Back of Queue estimation since HCM only gives Cycle-Average Queues for unsignalised intersections. Lane Queue Percentiles (Vehicles) Site:Strasburg Road-N-Robert Ferrie Drive-Weekday PM 2031
132 Detailed Output about:blank Page 8 of /01/ Deg. Percentile Back of Queue (veh) Lane Satn No. x 50% 70% 85% 90% 95% 98% South: Strasburg Road 1 T TR East: Robert Ferrie Drive 1 LR LT T SIDRA Standard models are used for Back of Queue estimation since HCM only gives Cycle-Average Queues for unsignalised intersections. Lane Queue Percentiles (Distance) Site:Strasburg Road-N-Robert Ferrie Drive-Weekday PM Deg. Percentile Back of Queue (metres) Lane Satn No. x 50% 70% 85% 90% 95% 98% South: Strasburg Road 1 T TR East: Robert Ferrie Drive 1 LR LT T SIDRA Standard models are used for Back of Queue estimation since HCM only gives Cycle-Average Queues for unsignalised intersections. Lane Stops Site:Strasburg Road-N-Robert Ferrie Drive-Weekday PM Queue Total Deg. -- Effective Stop Rate -- Total Move-up Queue Prop. Lane Satn Geom. Overall Stops Rate Move-ups Queued No. x he1 he2 hig h H hqm Hqm pq South: Strasburg Road 1 T TR East: Robert Ferrie Drive 1 LR LT T hig is the average value for all movements in a shared lane hqm is average queue move-up rate for all vehicles queued and unqueued
133 Detailed Output about:blank Page 9 of /01/24 Flow Rates and Demand Analysis Movement Definitions and Flow Rates (O-D) Site:Strasburg Road-N-Robert Ferrie Drive-Weekday PM From To Mov Flow Rate Flow Scale Peak Flow Approach Approach ID Turn LV HV Fixed Var Factor South: Strasburg Road East 8R Right North 8T Thru East: Robert Ferrie Drive South 1L Left North 6R Right South 4T Thru East 7L Left Unit Time for Volumes = 60 minutes Peak Flow Period = 15 minutes Flow Rates include effects of Flow Scale and Peak Flow Factor Flow Rates (Separate Light and Heavy Vehicles) Site:Strasburg Road-N-Robert Ferrie Drive-Weekday PM 2031 Mov Left Through Right ID LV HV LV HV LV HV Demand flows in veh/h as used by the program South: Strasburg Road 8T T R R East: Robert Ferrie Drive 1L L R R L L T T Unit Time for Volumes = 60 minutes Peak Flow Period = 15 minutes Flow Rates include effects of Flow Scale and Peak Flow Factor Flow Rates (Total Vehicles and Percent Heavy) Site:Strasburg Road-N-Robert Ferrie Drive-Weekday PM Mov Left Through Right ID Total %HV Total %HV Total %HV ---
134 Detailed Output Page 10 of 10 Demand flows in veh/h as used by the program South: Strasburg Road 8T T R R East: Robert Ferrie Drive 1L L R R L L T T Unit Time for Volumes = 60 minutes Peak Flow Period = 15 minutes Flow Rates include effects of Flow Scale and Peak Flow Factor Other Model Settings Site:Strasburg Road-N-Robert Ferrie Drive-Weekday PM 2031 * Basic Parameters: Intersection Type: Driving on the right-hand side of the road Input data specified in Metric units Model Defaults: US HCM (Metric) Peak Flow Period (for performance): 15 minutes Unit time (for volumes): 60 minutes. HCM Delay Model option used HCM Queue Model option used Level of Service based on: Delay (HCM 2000) Queue percentile: 95% Parameters Used in Cost Calculations Site:Strasburg Road-N-Robert Ferrie Drive-Weekday PM 2031 Pump price of fuel ($/L) = Fuel resource cost factor = 0.70 Ratio of running cost to fuel cost = 3.0 Average income ($/h) = Time value factor = 0.40 Light vehicle mass (1000 kg) = 1.4 Heavy vehicle mass (1000 kg) = 11.0 Light vehicle idle fuel rate (L/h) = Heavy vehicle idle fuel rate (L/h) = Diagnostics Site:Strasburg Road-N-Robert Ferrie Drive-Weekday PM 2031 Processed: January 24, :10:45 PM SIDRA INTERSECTION Copyright Akcelik and Associates Pty Ltd Project: H:\DATA\ Transportation Planning\Working\Strasburg Road\SIDRA Files\PC\Robert Ferrie Drive and Strasburg Road - Final.sip , SNC-LAVALIN INC, SINGLE about:blank 2012/01/24
135 Detailed Output DETAILED OUTPUT Strasburg Road-N-Blair Creek Drive Page 1 of 10 Strasburg Road-N-Blair Creek Drive- Weekday AM 2016 OUTPUT TABLE LINKS s Basic Parameters Gap Acceptance Parameters Movements Movement Capacity Parameters Movement Performance Fuel Consumption, Emissions and Cost (Total) Fuel Consumption, Emissions and Cost (Rate) Intersection Negotiation Data Movement Speeds and Geometric Delay Lanes Lane Performance Lane Flow and Capacity Information Lane, Approach and Intersection Performance Driver Characteristics Lane Delays Lane Queues (Vehicles) Lane Queues (Distance) Lane Queue Percentiles (Vehicles) Lane Queue Percentiles (Distance) Lane Stops Flow Rates and Demand Analysis Movement Definitions and Flow Rates (O-D) Flow Rates (Separate Light and Heavy Vehicles) Flow Rates (Total Vehicles and Percent Heavy) Other Model Settings Parameters Used in Cost Calculations Diagnostics s Basic Parameters Site:Strasburg Road-N-Blair Creek Drive-Weekday AM Circulating/Exiting Stream Cent Circ Insc Ent Ent Cir Ent Av.Ent Island Width Diam. Rad Ang Lan Lan Lane Flow %HV Adjust. %Exit Cap. O-D Diam Width Flow Incl. Constr. Factor m m m m deg m veh/h pcu/h Effect South: Strasburg Road Environment Factor: 1.20 Entry/Circulating Flow Adjustment: Medium N East: Blair Creek Drive Environment Factor: 1.20 Entry/Circulating Flow Adjustment: Medium N Environment Factor: 1.20 Entry/Circulating Flow Adjustment: Medium N Capacity Model: SIDRA Standard HV Method for Gap Acceptance: Include HV Effect for all percentages about:blank 2012/01/24
136 Detailed Output Page 2 of 10 Gap Acceptance Parameters Site:Strasburg Road-N-Blair Creek Drive-Weekday AM Turn Lane Lane ---- Circulating/Exiting Stream --- Critical Gap No. Type Flow Aver Aver In-Bnch Prop Foll-up Rate Speed Dist Headway Bunched Hdwy Dist Headway pcu/h km/h m sec sec m sec South: Strasburg Road Environment Factor: 1.20 Entry/Circulating Flow Adjustment: Medium Thru 1 Subdominant Dominant Right 2 Dominant East: Blair Creek Drive Environment Factor: 1.20 Entry/Circulating Flow Adjustment: Medium Left 1 Dominant Right 1 Dominant Environment Factor: 1.20 Entry/Circulating Flow Adjustment: Medium Left 1 Subdominant Thru 1 Subdominant Dominant Capacity Model: SIDRA Standard Priority sharing is implied for some movements (Follow-up Headway plus Intra-bunch Headway is larger than the Critical Gap). The O-D Factor ( Basic Parameters table) allows for priority sharing and priority emphasis. Dist (Distance): Spacing, i.e. distance between the front ends of two successive vehicles across all lanes in the circulating or exiting stream Movements Movement Capacity Parameters Site:Strasburg Road-N-Blair Creek Drive-Weekday AM Mov Opposing Movement Total Prac. Prac. Lane Deg. ID Demand Adjust. Cap. Deg. Spare Util Satn Flow HV Flow HV Flow Satn Cap. veh/h % veh/h % pcu/h veh/h xp % % x South: Strasburg Road 8T T R R East: Blair Creek Drive 1L L * 6R R * L L T T * Maximum degree of saturation Movement Performance Site:Strasburg Road-N-Blair Creek Drive-Weekday AM 2016 about:blank 2012/01/24
137 Detailed Output Page 3 of Mov Total Total Aver. Eff. Total Perf. Tot.Trav. Tot.Trav. Aver. ID Delay Delay Delay Stop Stops Index Distance Time Speed (veh-h/h)(pers-h/h)(sec) Rate (veh-km/h)(veh-h/h) (km/h) South: Strasburg Road 8T T R R East: Blair Creek Drive 1L L R R L L T T Fuel Consumption, Emissions and Cost (Total) Site:Strasburg Road-N-Blair Creek Drive-Weekday AM 2016 Mov Cost Fuel CO2 CO HC NOX ID Total Total Total Total Total Total $/h L/h kg/h kg/h kg/h kg/h South: Strasburg Road 8T T R R East: Blair Creek Drive 1L L R R L L T T INTERSECTION: Fuel Consumption, Emissions and Cost (Rate) Site:Strasburg Road-N-Blair Creek Drive-Weekday AM 2016 Mov Cost Fuel CO2 CO HC NOX ID Rate Rate Rate Rate Rate Rate $/km L/100km g/km g/km g/km g/km South: Strasburg Road 8T T R R East: Blair Creek Drive 1L L R R L L T T about:blank 2012/01/24
138 about:blank 2012/01/24 Detailed Output INTERSECTION: Page 4 of 10 Intersection Negotiation Data Site:Strasburg Road-N-Blair Creek Drive-Weekday AM Negn Negn Negn Appr. Downstream Distance From To Radius Speed Dist. Dist Approach Approach Turn m km/h m m m User Spec? South: Strasburg Road East Right No North Thru No East: Blair Creek Drive South Left No North Right No South Thru No East Left No Maximum Negotiation (Design) Speed = 50.0 km/h Downstream distance is distance travelled from the stopline until exit cruise speed is reached (includes negotiation distance). Acceleration distance is weighted for light and heavy vehicles. The same distance applies for both stopped and unstopped vehicles. Movement Speeds and Geometric Delay Site:Strasburg Road-N-Blair Creek Drive-Weekday AM Queue Move-up App. Speeds Exit Speeds Av. Section Spd Geom Mov st 2nd Delay ID Cruise Negn Negn Cruise Grn Grn Running Overall sec South: Strasburg Road 8T T R R East: Blair Creek Drive 1L L R R L L T T "Running Speed" is the average speed excluding stopped periods. HCM Delay Formula option used: Geometric Delay is not included in Control Delay. Lanes Lane Performance Site:Strasburg Road-N-Blair Creek Drive-Weekday AM 2016
139 Detailed Output Q u e u e Flow Cap Deg. Aver. Eff. 95% Back Lane Lane Satn Delay Stop Length No. veh/h veh/h x sec Rate veh m m South: Strasburg Road 1 T TR East: Blair Creek Drive 1 LR LT T Page 5 of 10 Lane Flow and Capacity Information Site:Strasburg Road-N-Blair Creek Drive-Weekday AM Lane Dem Flow (veh/h) Min Tot Deg. Lane No Cap Cap Satn Util Lef Thru Rig Tot veh/h veh/h x % South: Strasburg Road 1 T TR East: Blair Creek Drive 1 LR LT T The capacity value for priority and continuous movements is obtained by adjusting the basic saturation flow for heavy vehicle and turning vehicle effects. Saturation flow scale applies if specified. Lane, Approach and Intersection Performance Site:Strasburg Road-N-Blair Creek Drive-Weekday AM Lane Demand Flow (veh/h) Adj. Eff Grn Deg Aver. Longest Shrt No %HV Basic (sec) Sat Delay Queue Lane L T R Tot Satf. 1st 2nd x sec m m South: Strasburg Road 1 T TR East: Blair Creek Drive 1 LR LT T ========================================================================== ALL VEHICLES Total % Max Aver. Max Flow HV X Delay Queue ========================================================================== about:blank 2012/01/24
140 Detailed Output Peak flow period = 15 minutes. Page 6 of 10 Queue values in this table are 95% queue (metres) Note: Basic Saturation Flows are not adjusted at roundabouts or signcontrolled intersections and apply only to continuous lanes. Driver Characteristics Site:Strasburg Road-N-Blair Creek Drive-Weekday AM Average Driver Lane Satn Satn Satn Satn Queue Response No. Speed Flow Hdwy Spacing Space Time km/h veh/h sec m m sec South: Strasburg Road 1 T TR East: Blair Creek Drive 1 LR LT T Saturation Flow and Saturation Headway are derived from follow-up headway. Lane Delays Site:Strasburg Road-N-Blair Creek Drive-Weekday AM Delay (seconds/veh) Deg. Stop-line Delay Acc. Queuing Stopd Lane Satn 1st 2nd Total Dec. Total MvUp (Idle) Geom Control No. x d1 d2 dsl dn dq dqm di dig dic South: Strasburg Road 1 T TR East: Blair Creek Drive 1 LR LT T HCM Delay Formula option used: (i) Control Delay does not include Geometric Delay, (ii) Stop-line Delay is treated as being same as Control Delay. dsl: Stop-line delay (=d1+d2) dn: Average stop-start delay for all vehicles queued and unqueued dq: Queuing delay (the part of the stop-line delay that includes stopped delay and queue move-up delay) dqm: Queue move-up delay di: Stopped delay (stopped (idling) time at near-zero speed) dig: Geometric delay dic: Intersection control delay (sum of stop-line and geometric delays) Lane Queues (Vehicles) Site:Strasburg Road-N-Blair Creek Drive-Weekday AM about:blank 2012/01/24
141 about:blank 2012/01/24 Detailed Output Deg. Ovrfl. Back of Queue (veh) Queue Prob. P'ile Cyc-Av. Queue Lane Satn Queue Stor. Block Block No. x No Nb1 Nb2 Nb 95% Ratio % % Nc 95% South: Strasburg Road 1 T TR East: Blair Creek Drive 1 LR LT T Page 7 of 10 HCM Delay Formula option used: Cycle-Average Queue is calculated using average delay from the HCM equation. (i.e. HCM delays are treated as stop-line delays for this purpose). SIDRA Standard models are used for Back of Queue estimation since HCM only gives Cycle-Average Queues for unsignalised intersections. Lane Queues (Distance) Site:Strasburg Road-N-Blair Creek Drive-Weekday AM Deg. Ovrfl. Back of Queue (m) Queue Prob. P'ile Cyc-Av. Queue Lane Satn Queue Stor. Block Block No. x No Nb1 Nb2 Nb 95% Ratio % % Nc 95% South: Strasburg Road 1 T TR East: Blair Creek Drive 1 LR LT T HCM Delay Formula option used: Cycle-Average Queue is calculated using average delay from the HCM equation. (i.e. HCM delays are treated as stop-line delays for this purpose). SIDRA Standard models are used for Back of Queue estimation since HCM only gives Cycle-Average Queues for unsignalised intersections. Lane Queue Percentiles (Vehicles) Site:Strasburg Road-N-Blair Creek Drive-Weekday AM Deg. Percentile Back of Queue (veh) Lane Satn No. x 50% 70% 85% 90% 95% 98% South: Strasburg Road 1 T TR East: Blair Creek Drive 1 LR LT T SIDRA Standard models are used for Back of Queue estimation since HCM only gives Cycle-Average Queues for unsignalised intersections.
142 Detailed Output Page 8 of 10 Lane Queue Percentiles (Distance) Site:Strasburg Road-N-Blair Creek Drive-Weekday AM Deg. Percentile Back of Queue (metres) Lane Satn No. x 50% 70% 85% 90% 95% 98% South: Strasburg Road 1 T TR East: Blair Creek Drive 1 LR LT T SIDRA Standard models are used for Back of Queue estimation since HCM only gives Cycle-Average Queues for unsignalised intersections. Lane Stops Site:Strasburg Road-N-Blair Creek Drive-Weekday AM Queue Total Deg. -- Effective Stop Rate -- Total Move-up Queue Prop. Lane Satn Geom. Overall Stops Rate Move-ups Queued No. x he1 he2 hig h H hqm Hqm pq South: Strasburg Road 1 T TR East: Blair Creek Drive 1 LR LT T hig is the average value for all movements in a shared lane hqm is average queue move-up rate for all vehicles queued and unqueued Flow Rates and Demand Analysis Movement Definitions and Flow Rates (O-D) Site:Strasburg Road-N-Blair Creek Drive-Weekday AM From To Mov Flow Rate Flow Scale Peak Flow Approach Approach ID Turn LV HV Fixed Var Factor South: Strasburg Road East 8R Right North 8T Thru East: Blair Creek Drive South 1L Left North 6R Right about:blank 2012/01/24
143 about:blank 2012/01/24 Detailed Output South 4T Thru East 7L Left Unit Time for Volumes = 60 minutes Peak Flow Period = 15 minutes Flow Rates include effects of Flow Scale and Peak Flow Factor Page 9 of 10 Flow Rates (Separate Light and Heavy Vehicles) Site:Strasburg Road-N-Blair Creek Drive-Weekday AM 2016 Mov Left Through Right ID LV HV LV HV LV HV Demand flows in veh/h as used by the program South: Strasburg Road 8T T R R East: Blair Creek Drive 1L L R R L L T T Unit Time for Volumes = 60 minutes Peak Flow Period = 15 minutes Flow Rates include effects of Flow Scale and Peak Flow Factor Flow Rates (Total Vehicles and Percent Heavy) Site:Strasburg Road-N-Blair Creek Drive-Weekday AM Mov Left Through Right ID Total %HV Total %HV Total %HV --- Demand flows in veh/h as used by the program South: Strasburg Road 8T T R R East: Blair Creek Drive 1L L R R L L T T Unit Time for Volumes = 60 minutes Peak Flow Period = 15 minutes Flow Rates include effects of Flow Scale and Peak Flow Factor Other Model Settings Site:Strasburg Road-N-Blair Creek Drive-Weekday AM 2016
144 about:blank 2012/01/24 Detailed Output Page 10 of 10 * Basic Parameters: Intersection Type: Driving on the right-hand side of the road Input data specified in Metric units Model Defaults: US HCM (Metric) Peak Flow Period (for performance): 15 minutes Unit time (for volumes): 60 minutes. HCM Delay Model option used HCM Queue Model option used Level of Service based on: Delay (HCM 2000) Queue percentile: 95% Parameters Used in Cost Calculations Site:Strasburg Road-N-Blair Creek Drive-Weekday AM 2016 Pump price of fuel ($/L) = Fuel resource cost factor = 0.70 Ratio of running cost to fuel cost = 3.0 Average income ($/h) = Time value factor = 0.40 Light vehicle mass (1000 kg) = 1.4 Heavy vehicle mass (1000 kg) = 11.0 Light vehicle idle fuel rate (L/h) = Heavy vehicle idle fuel rate (L/h) = Diagnostics Site:Strasburg Road-N-Blair Creek Drive-Weekday AM 2016 Processed: January 24, :17:12 PM SIDRA INTERSECTION Copyright Akcelik and Associates Pty Ltd Project: H:\DATA\ Transportation Planning\Working\Strasburg Road\SIDRA Files\PC\Robert Ferrie Drive and Blair Creek Drive - Final.sip , SNC-LAVALIN INC, SINGLE
145 Detailed Output about:blank Page 1 of /01/24 DETAILED OUTPUT Strasburg Road-N-Blair Creek Drive Strasburg Road-N-Blair Creek Drive- Weekday PM 2016 OUTPUT TABLE LINKS s Basic Parameters Gap Acceptance Parameters Movements Movement Capacity Parameters Movement Performance Fuel Consumption, Emissions and Cost (Total) Fuel Consumption, Emissions and Cost (Rate) Intersection Negotiation Data Movement Speeds and Geometric Delay Lanes Lane Performance Lane Flow and Capacity Information Lane, Approach and Intersection Performance Driver Characteristics Lane Delays Lane Queues (Vehicles) Lane Queues (Distance) Lane Queue Percentiles (Vehicles) Lane Queue Percentiles (Distance) Lane Stops Flow Rates and Demand Analysis Movement Definitions and Flow Rates (O-D) Flow Rates (Separate Light and Heavy Vehicles) Flow Rates (Total Vehicles and Percent Heavy) Other Model Settings Parameters Used in Cost Calculations Diagnostics s Basic Parameters Site:Strasburg Road-N-Blair Creek Drive-Weekday PM Circulating/Exiting Stream Cent Circ Insc Ent Ent Cir Ent Av.Ent Island Width Diam. Rad Ang Lan Lan Lane Flow %HV Adjust. %Exit Cap. O-D Diam Width Flow Incl. Constr. Factor m m m m deg m veh/h pcu/h Effect South: Strasburg Road Environment Factor: 1.20 Entry/Circulating Flow Adjustment: Medium N East: Blair Creek Drive Environment Factor: 1.20 Entry/Circulating Flow Adjustment: Medium N Environment Factor: 1.20 Entry/Circulating Flow Adjustment: Medium N 0.993
146 Detailed Output about:blank Page 2 of /01/ Capacity Model: SIDRA Standard HV Method for Gap Acceptance: Include HV Effect for all percentages Gap Acceptance Parameters Site:Strasburg Road-N-Blair Creek Drive-Weekday PM Turn Lane Lane ---- Circulating/Exiting Stream --- Critical Gap No. Type Flow Aver Aver In-Bnch Prop Foll-up Rate Speed Dist Headway Bunched Hdwy Dist Headway pcu/h km/h m sec sec m sec South: Strasburg Road Environment Factor: 1.20 Entry/Circulating Flow Adjustment: Medium Thru 1 Subdominant Dominant Right 2 Dominant East: Blair Creek Drive Environment Factor: 1.20 Entry/Circulating Flow Adjustment: Medium Left 1 Dominant Right 1 Dominant Environment Factor: 1.20 Entry/Circulating Flow Adjustment: Medium Left 1 Subdominant Thru 1 Subdominant Dominant Capacity Model: SIDRA Standard Priority sharing is implied for some movements (Follow-up Headway plus Intra-bunch Headway is larger than the Critical Gap). The O-D Factor ( Basic Parameters table) allows for priority sharing and priority emphasis. Dist (Distance): Spacing, i.e. distance between the front ends of two successive vehicles across all lanes in the circulating or exiting stream Movements Movement Capacity Parameters Site:Strasburg Road-N-Blair Creek Drive-Weekday PM Mov Opposing Movement Total Prac. Prac. Lane Deg. ID Demand Adjust. Cap. Deg. Spare Util Satn Flow HV Flow HV Flow Satn Cap. veh/h % veh/h % pcu/h veh/h xp % % x South: Strasburg Road 8T T * 8R R * East: Blair Creek Drive 1L L R R L L T T * Maximum degree of saturation
147 Detailed Output about:blank Page 3 of /01/24 Movement Performance Site:Strasburg Road-N-Blair Creek Drive-Weekday PM Mov Total Total Aver. Eff. Total Perf. Tot.Trav. Tot.Trav. Aver. ID Delay Delay Delay Stop Stops Index Distance Time Speed (veh-h/h)(pers-h/h)(sec) Rate (veh-km/h)(veh-h/h) (km/h) South: Strasburg Road 8T T R R East: Blair Creek Drive 1L L R R L L T T Fuel Consumption, Emissions and Cost (Total) Site:Strasburg Road-N-Blair Creek Drive-Weekday PM 2016 Mov Cost Fuel CO2 CO HC NOX ID Total Total Total Total Total Total $/h L/h kg/h kg/h kg/h kg/h South: Strasburg Road 8T T R R East: Blair Creek Drive 1L L R R L L T T INTERSECTION: Fuel Consumption, Emissions and Cost (Rate) Site:Strasburg Road-N-Blair Creek Drive-Weekday PM 2016 Mov Cost Fuel CO2 CO HC NOX ID Rate Rate Rate Rate Rate Rate $/km L/100km g/km g/km g/km g/km South: Strasburg Road 8T T R R
148 Detailed Output about:blank Page 4 of /01/24 East: Blair Creek Drive 1L L R R L L T T INTERSECTION: Intersection Negotiation Data Site:Strasburg Road-N-Blair Creek Drive-Weekday PM Negn Negn Negn Appr. Downstream Distance From To Radius Speed Dist. Dist Approach Approach Turn m km/h m m m User Spec? South: Strasburg Road East Right No North Thru No East: Blair Creek Drive South Left No North Right No South Thru No East Left No Maximum Negotiation (Design) Speed = 50.0 km/h Downstream distance is distance travelled from the stopline until exit cruise speed is reached (includes negotiation distance). Acceleration distance is weighted for light and heavy vehicles. The same distance applies for both stopped and unstopped vehicles. Movement Speeds and Geometric Delay Site:Strasburg Road-N-Blair Creek Drive-Weekday PM Queue Move-up App. Speeds Exit Speeds Av. Section Spd Geom Mov st 2nd Delay ID Cruise Negn Negn Cruise Grn Grn Running Overall sec South: Strasburg Road 8T T R R East: Blair Creek Drive 1L L R R L L T T "Running Speed" is the average speed excluding stopped periods. HCM Delay Formula option used: Geometric Delay is not included in Control Delay.
149 Detailed Output about:blank Page 5 of /01/24 Lanes Lane Performance Site:Strasburg Road-N-Blair Creek Drive-Weekday PM 2016 Q u e u e Flow Cap Deg. Aver. Eff. 95% Back Lane Lane Satn Delay Stop Length No. veh/h veh/h x sec Rate veh m m South: Strasburg Road 1 T TR East: Blair Creek Drive 1 LR LT T Lane Flow and Capacity Information Site:Strasburg Road-N-Blair Creek Drive-Weekday PM Lane Dem Flow (veh/h) Min Tot Deg. Lane No Cap Cap Satn Util Lef Thru Rig Tot veh/h veh/h x % South: Strasburg Road 1 T TR East: Blair Creek Drive 1 LR LT T The capacity value for priority and continuous movements is obtained by adjusting the basic saturation flow for heavy vehicle and turning vehicle effects. Saturation flow scale applies if specified. Lane, Approach and Intersection Performance Site:Strasburg Road-N-Blair Creek Drive-Weekday PM Lane Demand Flow (veh/h) Adj. Eff Grn Deg Aver. Longest Shrt No %HV Basic (sec) Sat Delay Queue Lane L T R Tot Satf. 1st 2nd x sec m m South: Strasburg Road 1 T TR
150 Detailed Output about:blank Page 6 of /01/ East: Blair Creek Drive 1 LR LT T ========================================================================== ALL VEHICLES Total % Max Aver. Max Flow HV X Delay Queue ========================================================================== Peak flow period = 15 minutes. Queue values in this table are 95% queue (metres) Note: Basic Saturation Flows are not adjusted at roundabouts or signcontrolled intersections and apply only to continuous lanes. Driver Characteristics Site:Strasburg Road-N-Blair Creek Drive-Weekday PM Average Driver Lane Satn Satn Satn Satn Queue Response No. Speed Flow Hdwy Spacing Space Time km/h veh/h sec m m sec South: Strasburg Road 1 T TR East: Blair Creek Drive 1 LR LT T Saturation Flow and Saturation Headway are derived from follow-up headway. Lane Delays Site:Strasburg Road-N-Blair Creek Drive-Weekday PM Delay (seconds/veh) Deg. Stop-line Delay Acc. Queuing Stopd Lane Satn 1st 2nd Total Dec. Total MvUp (Idle) Geom Control No. x d1 d2 dsl dn dq dqm di dig dic South: Strasburg Road 1 T TR East: Blair Creek Drive 1 LR LT T HCM Delay Formula option used: (i) Control Delay does not include Geometric Delay, (ii) Stop-line Delay is treated as being same as Control Delay.
151 Detailed Output about:blank Page 7 of /01/24 dsl: Stop-line delay (=d1+d2) dn: Average stop-start delay for all vehicles queued and unqueued dq: Queuing delay (the part of the stop-line delay that includes stopped delay and queue move-up delay) dqm: Queue move-up delay di: Stopped delay (stopped (idling) time at near-zero speed) dig: Geometric delay dic: Intersection control delay (sum of stop-line and geometric delays) Lane Queues (Vehicles) Site:Strasburg Road-N-Blair Creek Drive-Weekday PM Deg. Ovrfl. Back of Queue (veh) Queue Prob. P'ile Cyc-Av. Queue Lane Satn Queue Stor. Block Block No. x No Nb1 Nb2 Nb 95% Ratio % % Nc 95% South: Strasburg Road 1 T TR East: Blair Creek Drive 1 LR LT T HCM Delay Formula option used: Cycle-Average Queue is calculated using average delay from the HCM equation. (i.e. HCM delays are treated as stop-line delays for this purpose). SIDRA Standard models are used for Back of Queue estimation since HCM only gives Cycle-Average Queues for unsignalised intersections. Lane Queues (Distance) Site:Strasburg Road-N-Blair Creek Drive-Weekday PM Deg. Ovrfl. Back of Queue (m) Queue Prob. P'ile Cyc-Av. Queue Lane Satn Queue Stor. Block Block No. x No Nb1 Nb2 Nb 95% Ratio % % Nc 95% South: Strasburg Road 1 T TR East: Blair Creek Drive 1 LR LT T HCM Delay Formula option used: Cycle-Average Queue is calculated using average delay from the HCM equation. (i.e. HCM delays are treated as stop-line delays for this purpose). SIDRA Standard models are used for Back of Queue estimation since HCM only gives Cycle-Average Queues for unsignalised intersections. Lane Queue Percentiles (Vehicles) Site:Strasburg Road-N-Blair Creek Drive-Weekday PM 2016
152 Detailed Output about:blank Page 8 of /01/ Deg. Percentile Back of Queue (veh) Lane Satn No. x 50% 70% 85% 90% 95% 98% South: Strasburg Road 1 T TR East: Blair Creek Drive 1 LR LT T SIDRA Standard models are used for Back of Queue estimation since HCM only gives Cycle-Average Queues for unsignalised intersections. Lane Queue Percentiles (Distance) Site:Strasburg Road-N-Blair Creek Drive-Weekday PM Deg. Percentile Back of Queue (metres) Lane Satn No. x 50% 70% 85% 90% 95% 98% South: Strasburg Road 1 T TR East: Blair Creek Drive 1 LR LT T SIDRA Standard models are used for Back of Queue estimation since HCM only gives Cycle-Average Queues for unsignalised intersections. Lane Stops Site:Strasburg Road-N-Blair Creek Drive-Weekday PM Queue Total Deg. -- Effective Stop Rate -- Total Move-up Queue Prop. Lane Satn Geom. Overall Stops Rate Move-ups Queued No. x he1 he2 hig h H hqm Hqm pq South: Strasburg Road 1 T TR East: Blair Creek Drive 1 LR LT T hig is the average value for all movements in a shared lane hqm is average queue move-up rate for all vehicles queued and unqueued
153 Detailed Output about:blank Page 9 of /01/24 Flow Rates and Demand Analysis Movement Definitions and Flow Rates (O-D) Site:Strasburg Road-N-Blair Creek Drive-Weekday PM From To Mov Flow Rate Flow Scale Peak Flow Approach Approach ID Turn LV HV Fixed Var Factor South: Strasburg Road East 8R Right North 8T Thru East: Blair Creek Drive South 1L Left North 6R Right South 4T Thru East 7L Left Unit Time for Volumes = 60 minutes Peak Flow Period = 15 minutes Flow Rates include effects of Flow Scale and Peak Flow Factor Flow Rates (Separate Light and Heavy Vehicles) Site:Strasburg Road-N-Blair Creek Drive-Weekday PM 2016 Mov Left Through Right ID LV HV LV HV LV HV Demand flows in veh/h as used by the program South: Strasburg Road 8T T R R East: Blair Creek Drive 1L L R R L L T T Unit Time for Volumes = 60 minutes Peak Flow Period = 15 minutes Flow Rates include effects of Flow Scale and Peak Flow Factor Flow Rates (Total Vehicles and Percent Heavy) Site:Strasburg Road-N-Blair Creek Drive-Weekday PM Mov Left Through Right ID Total %HV Total %HV Total %HV ---
154 Detailed Output Page 10 of 10 Demand flows in veh/h as used by the program South: Strasburg Road 8T T R R East: Blair Creek Drive 1L L R R L L T T Unit Time for Volumes = 60 minutes Peak Flow Period = 15 minutes Flow Rates include effects of Flow Scale and Peak Flow Factor Other Model Settings Site:Strasburg Road-N-Blair Creek Drive-Weekday PM 2016 * Basic Parameters: Intersection Type: Driving on the right-hand side of the road Input data specified in Metric units Model Defaults: US HCM (Metric) Peak Flow Period (for performance): 15 minutes Unit time (for volumes): 60 minutes. HCM Delay Model option used HCM Queue Model option used Level of Service based on: Delay (HCM 2000) Queue percentile: 95% Parameters Used in Cost Calculations Site:Strasburg Road-N-Blair Creek Drive-Weekday PM 2016 Pump price of fuel ($/L) = Fuel resource cost factor = 0.70 Ratio of running cost to fuel cost = 3.0 Average income ($/h) = Time value factor = 0.40 Light vehicle mass (1000 kg) = 1.4 Heavy vehicle mass (1000 kg) = 11.0 Light vehicle idle fuel rate (L/h) = Heavy vehicle idle fuel rate (L/h) = Diagnostics Site:Strasburg Road-N-Blair Creek Drive-Weekday PM 2016 Processed: January 24, :18:27 PM SIDRA INTERSECTION Copyright Akcelik and Associates Pty Ltd Project: H:\DATA\ Transportation Planning\Working\Strasburg Road\SIDRA Files\PC\Robert Ferrie Drive and Blair Creek Drive - Final.sip , SNC-LAVALIN INC, SINGLE about:blank 2012/01/24
155 Detailed Output DETAILED OUTPUT Strasburg Road-N-Blair Creek Drive Page 1 of 10 Strasburg Road-N-Blair Creek Drive- Weekday AM 2031 OUTPUT TABLE LINKS s Basic Parameters Gap Acceptance Parameters Movements Movement Capacity Parameters Movement Performance Fuel Consumption, Emissions and Cost (Total) Fuel Consumption, Emissions and Cost (Rate) Intersection Negotiation Data Movement Speeds and Geometric Delay Lanes Lane Performance Lane Flow and Capacity Information Lane, Approach and Intersection Performance Driver Characteristics Lane Delays Lane Queues (Vehicles) Lane Queues (Distance) Lane Queue Percentiles (Vehicles) Lane Queue Percentiles (Distance) Lane Stops Flow Rates and Demand Analysis Movement Definitions and Flow Rates (O-D) Flow Rates (Separate Light and Heavy Vehicles) Flow Rates (Total Vehicles and Percent Heavy) Other Model Settings Parameters Used in Cost Calculations Diagnostics s Basic Parameters Site:Strasburg Road-N-Blair Creek Drive-Weekday AM Circulating/Exiting Stream Cent Circ Insc Ent Ent Cir Ent Av.Ent Island Width Diam. Rad Ang Lan Lan Lane Flow %HV Adjust. %Exit Cap. O-D Diam Width Flow Incl. Constr. Factor m m m m deg m veh/h pcu/h Effect South: Strasburg Road Environment Factor: 1.20 Entry/Circulating Flow Adjustment: Medium N East: Blair Creek Drive Environment Factor: 1.20 Entry/Circulating Flow Adjustment: Medium N Environment Factor: 1.20 Entry/Circulating Flow Adjustment: Medium N Capacity Model: SIDRA Standard HV Method for Gap Acceptance: Include HV Effect for all percentages about:blank 2012/01/24
156 Detailed Output Page 2 of 10 Gap Acceptance Parameters Site:Strasburg Road-N-Blair Creek Drive-Weekday AM Turn Lane Lane ---- Circulating/Exiting Stream --- Critical Gap No. Type Flow Aver Aver In-Bnch Prop Foll-up Rate Speed Dist Headway Bunched Hdwy Dist Headway pcu/h km/h m sec sec m sec South: Strasburg Road Environment Factor: 1.20 Entry/Circulating Flow Adjustment: Medium Thru 1 Subdominant Dominant Right 2 Dominant East: Blair Creek Drive Environment Factor: 1.20 Entry/Circulating Flow Adjustment: Medium Left 1 Dominant Right 1 Dominant Environment Factor: 1.20 Entry/Circulating Flow Adjustment: Medium Left 1 Subdominant Thru 1 Subdominant Dominant Capacity Model: SIDRA Standard Priority sharing is implied for some movements (Follow-up Headway plus Intra-bunch Headway is larger than the Critical Gap). The O-D Factor ( Basic Parameters table) allows for priority sharing and priority emphasis. Dist (Distance): Spacing, i.e. distance between the front ends of two successive vehicles across all lanes in the circulating or exiting stream Movements Movement Capacity Parameters Site:Strasburg Road-N-Blair Creek Drive-Weekday AM Mov Opposing Movement Total Prac. Prac. Lane Deg. ID Demand Adjust. Cap. Deg. Spare Util Satn Flow HV Flow HV Flow Satn Cap. veh/h % veh/h % pcu/h veh/h xp % % x South: Strasburg Road 8T T R R East: Blair Creek Drive 1L L * 6R R * L L T T * Maximum degree of saturation Movement Performance Site:Strasburg Road-N-Blair Creek Drive-Weekday AM 2031 about:blank 2012/01/24
157 Detailed Output Page 3 of Mov Total Total Aver. Eff. Total Perf. Tot.Trav. Tot.Trav. Aver. ID Delay Delay Delay Stop Stops Index Distance Time Speed (veh-h/h)(pers-h/h)(sec) Rate (veh-km/h)(veh-h/h) (km/h) South: Strasburg Road 8T T R R East: Blair Creek Drive 1L L R R L L T T Fuel Consumption, Emissions and Cost (Total) Site:Strasburg Road-N-Blair Creek Drive-Weekday AM 2031 Mov Cost Fuel CO2 CO HC NOX ID Total Total Total Total Total Total $/h L/h kg/h kg/h kg/h kg/h South: Strasburg Road 8T T R R East: Blair Creek Drive 1L L R R L L T T INTERSECTION: Fuel Consumption, Emissions and Cost (Rate) Site:Strasburg Road-N-Blair Creek Drive-Weekday AM 2031 Mov Cost Fuel CO2 CO HC NOX ID Rate Rate Rate Rate Rate Rate $/km L/100km g/km g/km g/km g/km South: Strasburg Road 8T T R R East: Blair Creek Drive 1L L R R L L T T about:blank 2012/01/24
158 about:blank 2012/01/24 Detailed Output INTERSECTION: Page 4 of 10 Intersection Negotiation Data Site:Strasburg Road-N-Blair Creek Drive-Weekday AM Negn Negn Negn Appr. Downstream Distance From To Radius Speed Dist. Dist Approach Approach Turn m km/h m m m User Spec? South: Strasburg Road East Right No North Thru No East: Blair Creek Drive South Left No North Right No South Thru No East Left No Maximum Negotiation (Design) Speed = 50.0 km/h Downstream distance is distance travelled from the stopline until exit cruise speed is reached (includes negotiation distance). Acceleration distance is weighted for light and heavy vehicles. The same distance applies for both stopped and unstopped vehicles. Movement Speeds and Geometric Delay Site:Strasburg Road-N-Blair Creek Drive-Weekday AM Queue Move-up App. Speeds Exit Speeds Av. Section Spd Geom Mov st 2nd Delay ID Cruise Negn Negn Cruise Grn Grn Running Overall sec South: Strasburg Road 8T T R R East: Blair Creek Drive 1L L R R L L T T "Running Speed" is the average speed excluding stopped periods. HCM Delay Formula option used: Geometric Delay is not included in Control Delay. Lanes Lane Performance Site:Strasburg Road-N-Blair Creek Drive-Weekday AM 2031
159 Detailed Output Q u e u e Flow Cap Deg. Aver. Eff. 95% Back Lane Lane Satn Delay Stop Length No. veh/h veh/h x sec Rate veh m m South: Strasburg Road 1 T TR East: Blair Creek Drive 1 LR LT T Page 5 of 10 Lane Flow and Capacity Information Site:Strasburg Road-N-Blair Creek Drive-Weekday AM Lane Dem Flow (veh/h) Min Tot Deg. Lane No Cap Cap Satn Util Lef Thru Rig Tot veh/h veh/h x % South: Strasburg Road 1 T TR East: Blair Creek Drive 1 LR LT T The capacity value for priority and continuous movements is obtained by adjusting the basic saturation flow for heavy vehicle and turning vehicle effects. Saturation flow scale applies if specified. Lane, Approach and Intersection Performance Site:Strasburg Road-N-Blair Creek Drive-Weekday AM Lane Demand Flow (veh/h) Adj. Eff Grn Deg Aver. Longest Shrt No %HV Basic (sec) Sat Delay Queue Lane L T R Tot Satf. 1st 2nd x sec m m South: Strasburg Road 1 T TR East: Blair Creek Drive 1 LR LT T ========================================================================== ALL VEHICLES Total % Max Aver. Max Flow HV X Delay Queue ========================================================================== about:blank 2012/01/24
160 Detailed Output Peak flow period = 15 minutes. Page 6 of 10 Queue values in this table are 95% queue (metres) Note: Basic Saturation Flows are not adjusted at roundabouts or signcontrolled intersections and apply only to continuous lanes. Driver Characteristics Site:Strasburg Road-N-Blair Creek Drive-Weekday AM Average Driver Lane Satn Satn Satn Satn Queue Response No. Speed Flow Hdwy Spacing Space Time km/h veh/h sec m m sec South: Strasburg Road 1 T TR East: Blair Creek Drive 1 LR LT T Saturation Flow and Saturation Headway are derived from follow-up headway. Lane Delays Site:Strasburg Road-N-Blair Creek Drive-Weekday AM Delay (seconds/veh) Deg. Stop-line Delay Acc. Queuing Stopd Lane Satn 1st 2nd Total Dec. Total MvUp (Idle) Geom Control No. x d1 d2 dsl dn dq dqm di dig dic South: Strasburg Road 1 T TR East: Blair Creek Drive 1 LR LT T HCM Delay Formula option used: (i) Control Delay does not include Geometric Delay, (ii) Stop-line Delay is treated as being same as Control Delay. dsl: Stop-line delay (=d1+d2) dn: Average stop-start delay for all vehicles queued and unqueued dq: Queuing delay (the part of the stop-line delay that includes stopped delay and queue move-up delay) dqm: Queue move-up delay di: Stopped delay (stopped (idling) time at near-zero speed) dig: Geometric delay dic: Intersection control delay (sum of stop-line and geometric delays) Lane Queues (Vehicles) Site:Strasburg Road-N-Blair Creek Drive-Weekday AM about:blank 2012/01/24
161 about:blank 2012/01/24 Detailed Output Deg. Ovrfl. Back of Queue (veh) Queue Prob. P'ile Cyc-Av. Queue Lane Satn Queue Stor. Block Block No. x No Nb1 Nb2 Nb 95% Ratio % % Nc 95% South: Strasburg Road 1 T TR East: Blair Creek Drive 1 LR LT T Page 7 of 10 HCM Delay Formula option used: Cycle-Average Queue is calculated using average delay from the HCM equation. (i.e. HCM delays are treated as stop-line delays for this purpose). SIDRA Standard models are used for Back of Queue estimation since HCM only gives Cycle-Average Queues for unsignalised intersections. Lane Queues (Distance) Site:Strasburg Road-N-Blair Creek Drive-Weekday AM Deg. Ovrfl. Back of Queue (m) Queue Prob. P'ile Cyc-Av. Queue Lane Satn Queue Stor. Block Block No. x No Nb1 Nb2 Nb 95% Ratio % % Nc 95% South: Strasburg Road 1 T TR East: Blair Creek Drive 1 LR LT T HCM Delay Formula option used: Cycle-Average Queue is calculated using average delay from the HCM equation. (i.e. HCM delays are treated as stop-line delays for this purpose). SIDRA Standard models are used for Back of Queue estimation since HCM only gives Cycle-Average Queues for unsignalised intersections. Lane Queue Percentiles (Vehicles) Site:Strasburg Road-N-Blair Creek Drive-Weekday AM Deg. Percentile Back of Queue (veh) Lane Satn No. x 50% 70% 85% 90% 95% 98% South: Strasburg Road 1 T TR East: Blair Creek Drive 1 LR LT T SIDRA Standard models are used for Back of Queue estimation since HCM only gives Cycle-Average Queues for unsignalised intersections.
162 Detailed Output Page 8 of 10 Lane Queue Percentiles (Distance) Site:Strasburg Road-N-Blair Creek Drive-Weekday AM Deg. Percentile Back of Queue (metres) Lane Satn No. x 50% 70% 85% 90% 95% 98% South: Strasburg Road 1 T TR East: Blair Creek Drive 1 LR LT T SIDRA Standard models are used for Back of Queue estimation since HCM only gives Cycle-Average Queues for unsignalised intersections. Lane Stops Site:Strasburg Road-N-Blair Creek Drive-Weekday AM Queue Total Deg. -- Effective Stop Rate -- Total Move-up Queue Prop. Lane Satn Geom. Overall Stops Rate Move-ups Queued No. x he1 he2 hig h H hqm Hqm pq South: Strasburg Road 1 T TR East: Blair Creek Drive 1 LR LT T hig is the average value for all movements in a shared lane hqm is average queue move-up rate for all vehicles queued and unqueued Flow Rates and Demand Analysis Movement Definitions and Flow Rates (O-D) Site:Strasburg Road-N-Blair Creek Drive-Weekday AM From To Mov Flow Rate Flow Scale Peak Flow Approach Approach ID Turn LV HV Fixed Var Factor South: Strasburg Road East 8R Right North 8T Thru East: Blair Creek Drive South 1L Left North 6R Right about:blank 2012/01/24
163 about:blank 2012/01/24 Detailed Output South 4T Thru East 7L Left Unit Time for Volumes = 60 minutes Peak Flow Period = 15 minutes Flow Rates include effects of Flow Scale and Peak Flow Factor Page 9 of 10 Flow Rates (Separate Light and Heavy Vehicles) Site:Strasburg Road-N-Blair Creek Drive-Weekday AM 2031 Mov Left Through Right ID LV HV LV HV LV HV Demand flows in veh/h as used by the program South: Strasburg Road 8T T R R East: Blair Creek Drive 1L L R R L L T T Unit Time for Volumes = 60 minutes Peak Flow Period = 15 minutes Flow Rates include effects of Flow Scale and Peak Flow Factor Flow Rates (Total Vehicles and Percent Heavy) Site:Strasburg Road-N-Blair Creek Drive-Weekday AM Mov Left Through Right ID Total %HV Total %HV Total %HV --- Demand flows in veh/h as used by the program South: Strasburg Road 8T T R R East: Blair Creek Drive 1L L R R L L T T Unit Time for Volumes = 60 minutes Peak Flow Period = 15 minutes Flow Rates include effects of Flow Scale and Peak Flow Factor Other Model Settings Site:Strasburg Road-N-Blair Creek Drive-Weekday AM 2031
164 about:blank 2012/01/24 Detailed Output Page 10 of 10 * Basic Parameters: Intersection Type: Driving on the right-hand side of the road Input data specified in Metric units Model Defaults: US HCM (Metric) Peak Flow Period (for performance): 15 minutes Unit time (for volumes): 60 minutes. HCM Delay Model option used HCM Queue Model option used Level of Service based on: Delay (HCM 2000) Queue percentile: 95% Parameters Used in Cost Calculations Site:Strasburg Road-N-Blair Creek Drive-Weekday AM 2031 Pump price of fuel ($/L) = Fuel resource cost factor = 0.70 Ratio of running cost to fuel cost = 3.0 Average income ($/h) = Time value factor = 0.40 Light vehicle mass (1000 kg) = 1.4 Heavy vehicle mass (1000 kg) = 11.0 Light vehicle idle fuel rate (L/h) = Heavy vehicle idle fuel rate (L/h) = Diagnostics Site:Strasburg Road-N-Blair Creek Drive-Weekday AM 2031 Processed: January 24, :19:41 PM SIDRA INTERSECTION Copyright Akcelik and Associates Pty Ltd Project: H:\DATA\ Transportation Planning\Working\Strasburg Road\SIDRA Files\PC\Robert Ferrie Drive and Blair Creek Drive - Final.sip , SNC-LAVALIN INC, SINGLE
165 Detailed Output about:blank Page 1 of /01/24 DETAILED OUTPUT Strasburg Road-N-Blair Creek Drive Strasburg Road-N-Blair Creek Drive- Weekday PM 2031 OUTPUT TABLE LINKS s Basic Parameters Gap Acceptance Parameters Movements Movement Capacity Parameters Movement Performance Fuel Consumption, Emissions and Cost (Total) Fuel Consumption, Emissions and Cost (Rate) Intersection Negotiation Data Movement Speeds and Geometric Delay Lanes Lane Performance Lane Flow and Capacity Information Lane, Approach and Intersection Performance Driver Characteristics Lane Delays Lane Queues (Vehicles) Lane Queues (Distance) Lane Queue Percentiles (Vehicles) Lane Queue Percentiles (Distance) Lane Stops Flow Rates and Demand Analysis Movement Definitions and Flow Rates (O-D) Flow Rates (Separate Light and Heavy Vehicles) Flow Rates (Total Vehicles and Percent Heavy) Other Model Settings Parameters Used in Cost Calculations Diagnostics s Basic Parameters Site:Strasburg Road-N-Blair Creek Drive-Weekday PM Circulating/Exiting Stream Cent Circ Insc Ent Ent Cir Ent Av.Ent Island Width Diam. Rad Ang Lan Lan Lane Flow %HV Adjust. %Exit Cap. O-D Diam Width Flow Incl. Constr. Factor m m m m deg m veh/h pcu/h Effect South: Strasburg Road Environment Factor: 1.20 Entry/Circulating Flow Adjustment: Medium N East: Blair Creek Drive Environment Factor: 1.20 Entry/Circulating Flow Adjustment: Medium N Environment Factor: 1.20 Entry/Circulating Flow Adjustment: Medium N 0.973
166 Detailed Output about:blank Page 2 of /01/ Capacity Model: SIDRA Standard HV Method for Gap Acceptance: Include HV Effect for all percentages Gap Acceptance Parameters Site:Strasburg Road-N-Blair Creek Drive-Weekday PM Turn Lane Lane ---- Circulating/Exiting Stream --- Critical Gap No. Type Flow Aver Aver In-Bnch Prop Foll-up Rate Speed Dist Headway Bunched Hdwy Dist Headway pcu/h km/h m sec sec m sec South: Strasburg Road Environment Factor: 1.20 Entry/Circulating Flow Adjustment: Medium Thru 1 Subdominant Dominant Right 2 Dominant East: Blair Creek Drive Environment Factor: 1.20 Entry/Circulating Flow Adjustment: Medium Left 1 Dominant Right 1 Dominant Environment Factor: 1.20 Entry/Circulating Flow Adjustment: Medium Left 1 Subdominant Thru 1 Subdominant Dominant Capacity Model: SIDRA Standard Priority sharing is implied for some movements (Follow-up Headway plus Intra-bunch Headway is larger than the Critical Gap). The O-D Factor ( Basic Parameters table) allows for priority sharing and priority emphasis. Dist (Distance): Spacing, i.e. distance between the front ends of two successive vehicles across all lanes in the circulating or exiting stream Movements Movement Capacity Parameters Site:Strasburg Road-N-Blair Creek Drive-Weekday PM Mov Opposing Movement Total Prac. Prac. Lane Deg. ID Demand Adjust. Cap. Deg. Spare Util Satn Flow HV Flow HV Flow Satn Cap. veh/h % veh/h % pcu/h veh/h xp % % x South: Strasburg Road 8T T R R East: Blair Creek Drive 1L L * 6R R * L L T T * Maximum degree of saturation
167 Detailed Output about:blank Page 3 of /01/24 Movement Performance Site:Strasburg Road-N-Blair Creek Drive-Weekday PM Mov Total Total Aver. Eff. Total Perf. Tot.Trav. Tot.Trav. Aver. ID Delay Delay Delay Stop Stops Index Distance Time Speed (veh-h/h)(pers-h/h)(sec) Rate (veh-km/h)(veh-h/h) (km/h) South: Strasburg Road 8T T R R East: Blair Creek Drive 1L L R R L L T T Fuel Consumption, Emissions and Cost (Total) Site:Strasburg Road-N-Blair Creek Drive-Weekday PM 2031 Mov Cost Fuel CO2 CO HC NOX ID Total Total Total Total Total Total $/h L/h kg/h kg/h kg/h kg/h South: Strasburg Road 8T T R R East: Blair Creek Drive 1L L R R L L T T INTERSECTION: Fuel Consumption, Emissions and Cost (Rate) Site:Strasburg Road-N-Blair Creek Drive-Weekday PM 2031 Mov Cost Fuel CO2 CO HC NOX ID Rate Rate Rate Rate Rate Rate $/km L/100km g/km g/km g/km g/km South: Strasburg Road 8T T R R
168 Detailed Output about:blank Page 4 of /01/24 East: Blair Creek Drive 1L L R R L L T T INTERSECTION: Intersection Negotiation Data Site:Strasburg Road-N-Blair Creek Drive-Weekday PM Negn Negn Negn Appr. Downstream Distance From To Radius Speed Dist. Dist Approach Approach Turn m km/h m m m User Spec? South: Strasburg Road East Right No North Thru No East: Blair Creek Drive South Left No North Right No South Thru No East Left No Maximum Negotiation (Design) Speed = 50.0 km/h Downstream distance is distance travelled from the stopline until exit cruise speed is reached (includes negotiation distance). Acceleration distance is weighted for light and heavy vehicles. The same distance applies for both stopped and unstopped vehicles. Movement Speeds and Geometric Delay Site:Strasburg Road-N-Blair Creek Drive-Weekday PM Queue Move-up App. Speeds Exit Speeds Av. Section Spd Geom Mov st 2nd Delay ID Cruise Negn Negn Cruise Grn Grn Running Overall sec South: Strasburg Road 8T T R R East: Blair Creek Drive 1L L R R L L T T "Running Speed" is the average speed excluding stopped periods. HCM Delay Formula option used: Geometric Delay is not included in Control Delay.
169 Detailed Output about:blank Page 5 of /01/24 Lanes Lane Performance Site:Strasburg Road-N-Blair Creek Drive-Weekday PM 2031 Q u e u e Flow Cap Deg. Aver. Eff. 95% Back Lane Lane Satn Delay Stop Length No. veh/h veh/h x sec Rate veh m m South: Strasburg Road 1 T TR East: Blair Creek Drive 1 LR LT T Lane Flow and Capacity Information Site:Strasburg Road-N-Blair Creek Drive-Weekday PM Lane Dem Flow (veh/h) Min Tot Deg. Lane No Cap Cap Satn Util Lef Thru Rig Tot veh/h veh/h x % South: Strasburg Road 1 T TR East: Blair Creek Drive 1 LR LT T The capacity value for priority and continuous movements is obtained by adjusting the basic saturation flow for heavy vehicle and turning vehicle effects. Saturation flow scale applies if specified. Lane, Approach and Intersection Performance Site:Strasburg Road-N-Blair Creek Drive-Weekday PM Lane Demand Flow (veh/h) Adj. Eff Grn Deg Aver. Longest Shrt No %HV Basic (sec) Sat Delay Queue Lane L T R Tot Satf. 1st 2nd x sec m m South: Strasburg Road 1 T TR
170 Detailed Output about:blank Page 6 of /01/ East: Blair Creek Drive 1 LR LT T ========================================================================== ALL VEHICLES Total % Max Aver. Max Flow HV X Delay Queue ========================================================================== Peak flow period = 15 minutes. Queue values in this table are 95% queue (metres) Note: Basic Saturation Flows are not adjusted at roundabouts or signcontrolled intersections and apply only to continuous lanes. Driver Characteristics Site:Strasburg Road-N-Blair Creek Drive-Weekday PM Average Driver Lane Satn Satn Satn Satn Queue Response No. Speed Flow Hdwy Spacing Space Time km/h veh/h sec m m sec South: Strasburg Road 1 T TR East: Blair Creek Drive 1 LR LT T Saturation Flow and Saturation Headway are derived from follow-up headway. Lane Delays Site:Strasburg Road-N-Blair Creek Drive-Weekday PM Delay (seconds/veh) Deg. Stop-line Delay Acc. Queuing Stopd Lane Satn 1st 2nd Total Dec. Total MvUp (Idle) Geom Control No. x d1 d2 dsl dn dq dqm di dig dic South: Strasburg Road 1 T TR East: Blair Creek Drive 1 LR LT T HCM Delay Formula option used: (i) Control Delay does not include Geometric Delay, (ii) Stop-line Delay is treated as being same as Control Delay.
171 Detailed Output about:blank Page 7 of /01/24 dsl: Stop-line delay (=d1+d2) dn: Average stop-start delay for all vehicles queued and unqueued dq: Queuing delay (the part of the stop-line delay that includes stopped delay and queue move-up delay) dqm: Queue move-up delay di: Stopped delay (stopped (idling) time at near-zero speed) dig: Geometric delay dic: Intersection control delay (sum of stop-line and geometric delays) Lane Queues (Vehicles) Site:Strasburg Road-N-Blair Creek Drive-Weekday PM Deg. Ovrfl. Back of Queue (veh) Queue Prob. P'ile Cyc-Av. Queue Lane Satn Queue Stor. Block Block No. x No Nb1 Nb2 Nb 95% Ratio % % Nc 95% South: Strasburg Road 1 T TR East: Blair Creek Drive 1 LR LT T HCM Delay Formula option used: Cycle-Average Queue is calculated using average delay from the HCM equation. (i.e. HCM delays are treated as stop-line delays for this purpose). SIDRA Standard models are used for Back of Queue estimation since HCM only gives Cycle-Average Queues for unsignalised intersections. Lane Queues (Distance) Site:Strasburg Road-N-Blair Creek Drive-Weekday PM Deg. Ovrfl. Back of Queue (m) Queue Prob. P'ile Cyc-Av. Queue Lane Satn Queue Stor. Block Block No. x No Nb1 Nb2 Nb 95% Ratio % % Nc 95% South: Strasburg Road 1 T TR East: Blair Creek Drive 1 LR LT T HCM Delay Formula option used: Cycle-Average Queue is calculated using average delay from the HCM equation. (i.e. HCM delays are treated as stop-line delays for this purpose). SIDRA Standard models are used for Back of Queue estimation since HCM only gives Cycle-Average Queues for unsignalised intersections. Lane Queue Percentiles (Vehicles) Site:Strasburg Road-N-Blair Creek Drive-Weekday PM 2031
172 Detailed Output about:blank Page 8 of /01/ Deg. Percentile Back of Queue (veh) Lane Satn No. x 50% 70% 85% 90% 95% 98% South: Strasburg Road 1 T TR East: Blair Creek Drive 1 LR LT T SIDRA Standard models are used for Back of Queue estimation since HCM only gives Cycle-Average Queues for unsignalised intersections. Lane Queue Percentiles (Distance) Site:Strasburg Road-N-Blair Creek Drive-Weekday PM Deg. Percentile Back of Queue (metres) Lane Satn No. x 50% 70% 85% 90% 95% 98% South: Strasburg Road 1 T TR East: Blair Creek Drive 1 LR LT T SIDRA Standard models are used for Back of Queue estimation since HCM only gives Cycle-Average Queues for unsignalised intersections. Lane Stops Site:Strasburg Road-N-Blair Creek Drive-Weekday PM Queue Total Deg. -- Effective Stop Rate -- Total Move-up Queue Prop. Lane Satn Geom. Overall Stops Rate Move-ups Queued No. x he1 he2 hig h H hqm Hqm pq South: Strasburg Road 1 T TR East: Blair Creek Drive 1 LR LT T hig is the average value for all movements in a shared lane hqm is average queue move-up rate for all vehicles queued and unqueued
173 Detailed Output about:blank Page 9 of /01/24 Flow Rates and Demand Analysis Movement Definitions and Flow Rates (O-D) Site:Strasburg Road-N-Blair Creek Drive-Weekday PM From To Mov Flow Rate Flow Scale Peak Flow Approach Approach ID Turn LV HV Fixed Var Factor South: Strasburg Road East 8R Right North 8T Thru East: Blair Creek Drive South 1L Left North 6R Right South 4T Thru East 7L Left Unit Time for Volumes = 60 minutes Peak Flow Period = 15 minutes Flow Rates include effects of Flow Scale and Peak Flow Factor Flow Rates (Separate Light and Heavy Vehicles) Site:Strasburg Road-N-Blair Creek Drive-Weekday PM 2031 Mov Left Through Right ID LV HV LV HV LV HV Demand flows in veh/h as used by the program South: Strasburg Road 8T T R R East: Blair Creek Drive 1L L R R L L T T Unit Time for Volumes = 60 minutes Peak Flow Period = 15 minutes Flow Rates include effects of Flow Scale and Peak Flow Factor Flow Rates (Total Vehicles and Percent Heavy) Site:Strasburg Road-N-Blair Creek Drive-Weekday PM Mov Left Through Right ID Total %HV Total %HV Total %HV ---
174 Detailed Output Page 10 of 10 Demand flows in veh/h as used by the program South: Strasburg Road 8T T R R East: Blair Creek Drive 1L L R R L L T T Unit Time for Volumes = 60 minutes Peak Flow Period = 15 minutes Flow Rates include effects of Flow Scale and Peak Flow Factor Other Model Settings Site:Strasburg Road-N-Blair Creek Drive-Weekday PM 2031 * Basic Parameters: Intersection Type: Driving on the right-hand side of the road Input data specified in Metric units Model Defaults: US HCM (Metric) Peak Flow Period (for performance): 15 minutes Unit time (for volumes): 60 minutes. HCM Delay Model option used HCM Queue Model option used Level of Service based on: Delay (HCM 2000) Queue percentile: 95% Parameters Used in Cost Calculations Site:Strasburg Road-N-Blair Creek Drive-Weekday PM 2031 Pump price of fuel ($/L) = Fuel resource cost factor = 0.70 Ratio of running cost to fuel cost = 3.0 Average income ($/h) = Time value factor = 0.40 Light vehicle mass (1000 kg) = 1.4 Heavy vehicle mass (1000 kg) = 11.0 Light vehicle idle fuel rate (L/h) = Heavy vehicle idle fuel rate (L/h) = Diagnostics Site:Strasburg Road-N-Blair Creek Drive-Weekday PM 2031 Processed: January 24, :20:34 PM SIDRA INTERSECTION Copyright Akcelik and Associates Pty Ltd Project: H:\DATA\ Transportation Planning\Working\Strasburg Road\SIDRA Files\PC\Robert Ferrie Drive and Blair Creek Drive - Final.sip , SNC-LAVALIN INC, SINGLE about:blank 2012/01/24
175 Detailed Output about:blank Page 1 of /01/25 DETAILED OUTPUT New Dundee Road and Strasburg Road New Dundee Road -N-Strasburg Road - Weekday AM 2016 OUTPUT TABLE LINKS s Basic Parameters Gap Acceptance Parameters Pedestrian Effects Movements Movement Capacity Parameters Movement Performance Fuel Consumption, Emissions and Cost (Total) Fuel Consumption, Emissions and Cost (Rate) Intersection Negotiation Data Movement Speeds and Geometric Delay Lanes Lane Performance Lane Flow and Capacity Information Lane, Approach and Intersection Performance Driver Characteristics Lane Delays Lane Queues (Vehicles) Lane Queues (Distance) Lane Queue Percentiles (Vehicles) Lane Queue Percentiles (Distance) Lane Stops Flow Rates and Demand Analysis Movement Definitions and Flow Rates (O-D) Flow Rates (Separate Light and Heavy Vehicles) Flow Rates (Total Vehicles and Percent Heavy) Other Model Settings Parameters Used in Cost Calculations Diagnostics s Basic Parameters Site:New Dundee Road -N-Strasburg Road - Weekday AM Circulating/Exiting Stream Cent Circ Insc Ent Ent Cir Ent Av.Ent Island Width Diam. Rad Ang Lan Lan Lane Flow %HV Adjust. %Exit Cap. O-D Diam Width Flow Incl. Constr. Factor m m m m deg m veh/h pcu/h Effect South: Cameron Road Environment Factor: 1.20 Entry/Circulating Flow Adjustment: None N Environment Factor: 1.20 Entry/Circulating Flow Adjustment: Medium N
176 Detailed Output about:blank Page 2 of /01/25 Environment Factor: 1.20 Entry/Circulating Flow Adjustment: Medium N Environment Factor: 1.20 Entry/Circulating Flow Adjustment: Medium N Capacity Model: SIDRA Standard HV Method for Gap Acceptance: Include HV Effect for all percentages Gap Acceptance Parameters Site:New Dundee Road -N-Strasburg Road - Weekday AM Turn Lane Lane ---- Circulating/Exiting Stream --- Critical Gap No. Type Flow Aver Aver In-Bnch Prop Foll-up Rate Speed Dist Headway Bunched Hdwy Dist Headway pcu/h km/h m sec sec m sec South: Cameron Road Environment Factor: 1.20 Entry/Circulating Flow Adjustment: None Left 1 Subdominant Thru 1 Subdominant Dominant Right 2 Dominant Environment Factor: 1.20 Entry/Circulating Flow Adjustment: Medium Left 1 Subdominant Thru 1 Subdominant Dominant Right 2 Dominant Environment Factor: 1.20 Entry/Circulating Flow Adjustment: Medium Left 1 Subdominant Thru 2 Dominant Right 2 Dominant Environment Factor: 1.20 Entry/Circulating Flow Adjustment: Medium Left 1 Dominant Thru 1 Dominant Subdominant Right 2 Subdominant Capacity Model: SIDRA Standard Priority sharing is implied for some movements (Follow-up Headway plus Intra-bunch Headway is larger than the Critical Gap). The O-D Factor ( Basic Parameters table) allows for priority sharing and priority emphasis. Dist (Distance): Spacing, i.e. distance between the front ends of two successive vehicles across all lanes in the circulating or exiting stream Pedestrian Effects Site:New Dundee Road -N-Strasburg Road - Weekday AM 2016 ROUNDABOUT ENTRY Turn Pedestrian Circulating Adjustment Flow Rate Flow Rate Factor South: Cameron Road Left Thru Right
177 Detailed Output about:blank Page 3 of /01/ Left Thru Right Left Thru Right Left Thru Right ROUNDABOUT EXIT Pedestrian Conflict Critical Follow-up Exit Lane Total Average Flow Rate Zone Length Gap Headway Capacity Exit Flow Exit Flow (ped/h) (m) (sec) (sec) (veh/h) (veh/h) (veh/h/lane) South: Cameron Road Movements Movement Capacity Parameters Site:New Dundee Road -N-Strasburg Road - Weekday AM Mov Opposing Movement Total Prac. Prac. Lane Deg. ID Demand Adjust. Cap. Deg. Spare Util Satn Flow HV Flow HV Flow Satn Cap. veh/h % veh/h % pcu/h veh/h xp % % x South: Cameron Road 3 L T R L L T T R R L L T T R R L L * 2T T * 2R R * Maximum degree of saturation
178 Detailed Output about:blank Page 4 of /01/25 Movement Performance Site:New Dundee Road -N-Strasburg Road - Weekday AM Mov Total Total Aver. Eff. Total Perf. Tot.Trav. Tot.Trav. Aver. ID Delay Delay Delay Stop Stops Index Distance Time Speed (veh-h/h)(pers-h/h)(sec) Rate (veh-km/h)(veh-h/h) (km/h) South: Cameron Road 3 L T R L L T T R R L L T T R R L L T T R R Fuel Consumption, Emissions and Cost (Total) Site:New Dundee Road -N-Strasburg Road - Weekday AM 2016 Mov Cost Fuel CO2 CO HC NOX ID Total Total Total Total Total Total $/h L/h kg/h kg/h kg/h kg/h South: Cameron Road 3 L T R L L T T R R L L T T R R L L T T R R INTERSECTION:
179 Detailed Output about:blank Page 5 of /01/25 Fuel Consumption, Emissions and Cost (Rate) Site:New Dundee Road -N-Strasburg Road - Weekday AM 2016 Mov Cost Fuel CO2 CO HC NOX ID Rate Rate Rate Rate Rate Rate $/km L/100km g/km g/km g/km g/km South: Cameron Road 3 L T R L L T T R R L L T T R R L L T T R R INTERSECTION: Intersection Negotiation Data Site:New Dundee Road -N-Strasburg Road - Weekday AM Negn Negn Negn Appr. Downstream Distance From To Radius Speed Dist. Dist Approach Approach Turn m km/h m m m User Spec? South: Cameron Road East Right No North Thru No West Left No South Left No North Right No West Thru No South Thru No East Left No West Right No South Right No East Thru No North Left No
180 Detailed Output about:blank Page 6 of /01/25 Maximum Negotiation (Design) Speed = 50.0 km/h Downstream distance is distance travelled from the stopline until exit cruise speed is reached (includes negotiation distance). Acceleration distance is weighted for light and heavy vehicles. The same distance applies for both stopped and unstopped vehicles. Movement Speeds and Geometric Delay Site:New Dundee Road -N-Strasburg Road - Weekday AM Queue Move-up App. Speeds Exit Speeds Av. Section Spd Geom Mov st 2nd Delay ID Cruise Negn Negn Cruise Grn Grn Running Overall sec South: Cameron Road 3 L T R L L T T R R L L T T R R L L T T R R "Running Speed" is the average speed excluding stopped periods. HCM Delay Formula option used: Geometric Delay is not included in Control Delay. Lanes Lane Performance Site:New Dundee Road -N-Strasburg Road - Weekday AM 2016 Q u e u e Flow Cap Deg. Aver. Eff. 95% Back Lane Lane Satn Delay Stop Length No. veh/h veh/h x sec Rate veh m m South: Cameron Road 1 LT TR LT TR T 1 L TR LT TR T
181 Detailed Output about:blank Page 7 of /01/25 T Short lane due to specification of Turn Bay Lane Flow and Capacity Information Site:New Dundee Road -N-Strasburg Road - Weekday AM Lane Dem Flow (veh/h) Min Tot Deg. Lane No Cap Cap Satn Util Lef Thru Rig Tot veh/h veh/h x % South: Cameron Road 1 LT TR LT TR L TR LT TR D D Lane under-utilisation due to downstream effects The capacity value for priority and continuous movements is obtained by adjusting the basic saturation flow for heavy vehicle and turning vehicle effects. Saturation flow scale applies if specified. Lane, Approach and Intersection Performance Site:New Dundee Road -N-Strasburg Road - Weekday AM Lane Demand Flow (veh/h) Adj. Eff Grn Deg Aver. Longest Shrt No %HV Basic (sec) Sat Delay Queue Lane L T R Tot Satf. 1st 2nd x sec m m South: Cameron Road 1 LT TR LT TR L TR LT TR U ========================================================================== ALL VEHICLES Total % Max Aver. Max Flow HV X Delay Queue ==========================================================================
182 Detailed Output about:blank Page 8 of /01/25 Peak flow period = 15 minutes. Queue values in this table are 95% queue (metres) Note: Basic Saturation Flows are not adjusted at roundabouts or signcontrolled intersections and apply only to continuous lanes. U Lane under-utilisation specified by the "User" Driver Characteristics Site:New Dundee Road -N-Strasburg Road - Weekday AM Average Driver Lane Satn Satn Satn Satn Queue Response No. Speed Flow Hdwy Spacing Space Time km/h veh/h sec m m sec South: Cameron Road 1 LT TR LT TR NA - Short Lane L TR LT TR NA - Short Lane Saturation Flow and Saturation Headway are derived from follow-up headway. Lane Delays Site:New Dundee Road -N-Strasburg Road - Weekday AM Delay (seconds/veh) Deg. Stop-line Delay Acc. Queuing Stopd Lane Satn 1st 2nd Total Dec. Total MvUp (Idle) Geom Control No. x d1 d2 dsl dn dq dqm di dig dic South: Cameron Road 1 LT TR LT TR L TR LT TR HCM Delay Formula option used: (i) Control Delay does not include Geometric Delay, (ii) Stop-line Delay is treated as being same as Control Delay. dsl: Stop-line delay (=d1+d2) dn: Average stop-start delay for all vehicles queued and unqueued dq: Queuing delay (the part of the stop-line delay that includes stopped delay and queue move-up delay) dqm: Queue move-up delay
183 Detailed Output about:blank Page 9 of /01/25 di: Stopped delay (stopped (idling) time at near-zero speed) dig: Geometric delay dic: Intersection control delay (sum of stop-line and geometric delays) Lane Queues (Vehicles) Site:New Dundee Road -N-Strasburg Road - Weekday AM Deg. Ovrfl. Back of Queue (veh) Queue Prob. P'ile Cyc-Av. Queue Lane Satn Queue Stor. Block Block No. x No Nb1 Nb2 Nb 95% Ratio % % Nc 95% South: Cameron Road 1 LT TR LT TR L TR LT TR HCM Delay Formula option used: Cycle-Average Queue is calculated using average delay from the HCM equation. (i.e. HCM delays are treated as stop-line delays for this purpose). SIDRA Standard models are used for Back of Queue estimation since HCM only gives Cycle-Average Queues for unsignalised intersections. Lane Queues (Distance) Site:New Dundee Road -N-Strasburg Road - Weekday AM Deg. Ovrfl. Back of Queue (m) Queue Prob. P'ile Cyc-Av. Queue Lane Satn Queue Stor. Block Block No. x No Nb1 Nb2 Nb 95% Ratio % % Nc 95% South: Cameron Road 1 LT TR LT TR L TR LT TR HCM Delay Formula option used: Cycle-Average Queue is calculated using average delay from the HCM equation. (i.e. HCM delays are treated as stop-line delays for this purpose). SIDRA Standard models are used for Back of Queue estimation since HCM only gives Cycle-Average Queues for unsignalised intersections.
184 Detailed Output about:blank Page 10 of /01/25 Lane Queue Percentiles (Vehicles) Site:New Dundee Road -N-Strasburg Road - Weekday AM Deg. Percentile Back of Queue (veh) Lane Satn No. x 50% 70% 85% 90% 95% 98% South: Cameron Road 1 LT TR LT TR L TR LT TR SIDRA Standard models are used for Back of Queue estimation since HCM only gives Cycle-Average Queues for unsignalised intersections. Lane Queue Percentiles (Distance) Site:New Dundee Road -N-Strasburg Road - Weekday AM Deg. Percentile Back of Queue (metres) Lane Satn No. x 50% 70% 85% 90% 95% 98% South: Cameron Road 1 LT TR LT TR L TR LT TR SIDRA Standard models are used for Back of Queue estimation since HCM only gives Cycle-Average Queues for unsignalised intersections. Lane Stops Site:New Dundee Road -N-Strasburg Road - Weekday AM Queue Total Deg. -- Effective Stop Rate -- Total Move-up Queue Prop. Lane Satn Geom. Overall Stops Rate Move-ups Queued
185 Detailed Output about:blank Page 11 of /01/25 No. x he1 he2 hig h H hqm Hqm pq South: Cameron Road 1 LT TR LT TR L TR LT TR hig is the average value for all movements in a shared lane hqm is average queue move-up rate for all vehicles queued and unqueued Flow Rates and Demand Analysis Movement Definitions and Flow Rates (O-D) Site:New Dundee Road -N-Strasburg Road - Weekday AM From To Mov Flow Rate Flow Scale Peak Flow Approach Approach ID Turn LV HV Fixed Var Factor South: Cameron Road East 18 Right North 8 Thru West 3 Left South 1L Left North 6R Right West 6T Thru South 4T Thru East 7L Left West 4R Right South 2R Right East 2T Thru North 5L Left Unit Time for Volumes = 60 minutes Peak Flow Period = 15 minutes Flow Rates include effects of Flow Scale and Peak Flow Factor Flow Rates (Separate Light and Heavy Vehicles) Site:New Dundee Road -N-Strasburg Road - Weekday AM 2016 Mov Left Through Right ID LV HV LV HV LV HV Demand flows in veh/h as used by the program South: Cameron Road 3 L
186 Detailed Output about:blank Page 12 of /01/25 8 T R L L T T R R L L T T R R L L T T R R Unit Time for Volumes = 60 minutes Peak Flow Period = 15 minutes Flow Rates include effects of Flow Scale and Peak Flow Factor Flow Rates (Total Vehicles and Percent Heavy) Site:New Dundee Road -N-Strasburg Road - Weekday AM Mov Left Through Right ID Total %HV Total %HV Total %HV --- Demand flows in veh/h as used by the program South: Cameron Road 3 L T R L L T T R R L L T T R R L L T T R R Unit Time for Volumes = 60 minutes Peak Flow Period = 15 minutes Flow Rates include effects of Flow Scale and Peak Flow Factor Other Model Settings Site:New Dundee Road -N-Strasburg Road - Weekday AM 2016 * Basic Parameters: Intersection Type: Driving on the right-hand side of the road Input data specified in Metric units
187 Detailed Output Page 13 of 13 Model Defaults: US HCM (Metric) Peak Flow Period (for performance): 15 minutes Unit time (for volumes): 60 minutes. HCM Delay Model option used HCM Queue Model option used Level of Service based on: Delay (HCM 2000) Queue percentile: 95% Parameters Used in Cost Calculations Site:New Dundee Road -N-Strasburg Road - Weekday AM 2016 Pump price of fuel ($/L) = Fuel resource cost factor = 0.70 Ratio of running cost to fuel cost = 3.0 Average income ($/h) = Time value factor = 0.40 Light vehicle mass (1000 kg) = 1.4 Heavy vehicle mass (1000 kg) = 11.0 Light vehicle idle fuel rate (L/h) = Heavy vehicle idle fuel rate (L/h) = Diagnostics Site:New Dundee Road -N-Strasburg Road - Weekday AM 2016 Processed: January 25, :22:48 PM SIDRA INTERSECTION Copyright Akcelik and Associates Pty Ltd Project: H:\DATA\ Transportation Planning\Working\Strasburg Road\SIDRA Files\PC\New Dundee Road and Strasburg Road -Final.sip , SNC-LAVALIN INC, SINGLE about:blank 2012/01/25
188 Detailed Output DETAILED OUTPUT New Dundee Road and Strasburg Road Page 1 of 13 New Dundee Road -N-Strasburg Road - Weekday PM 2016 OUTPUT TABLE LINKS s Basic Parameters Gap Acceptance Parameters Pedestrian Effects Movements Movement Capacity Parameters Movement Performance Fuel Consumption, Emissions and Cost (Total) Fuel Consumption, Emissions and Cost (Rate) Intersection Negotiation Data Movement Speeds and Geometric Delay Lanes Lane Performance Lane Flow and Capacity Information Lane, Approach and Intersection Performance Driver Characteristics Lane Delays Lane Queues (Vehicles) Lane Queues (Distance) Lane Queue Percentiles (Vehicles) Lane Queue Percentiles (Distance) Lane Stops Flow Rates and Demand Analysis Movement Definitions and Flow Rates (O-D) Flow Rates (Separate Light and Heavy Vehicles) Flow Rates (Total Vehicles and Percent Heavy) Other Model Settings Parameters Used in Cost Calculations Diagnostics s Basic Parameters Site:New Dundee Road -N-Strasburg Road - Weekday PM Circulating/Exiting Stream Cent Circ Insc Ent Ent Cir Ent Av.Ent Island Width Diam. Rad Ang Lan Lan Lane Flow %HV Adjust. %Exit Cap. O-D Diam Width Flow Incl. Constr. Factor m m m m deg m veh/h pcu/h Effect South: Cameron Road Environment Factor: 1.20 Entry/Circulating Flow Adjustment: None N Environment Factor: 1.20 Entry/Circulating Flow Adjustment: Medium N Environment Factor: 1.20 Entry/Circulating Flow Adjustment: Medium N about:blank 2012/01/25
189 Detailed Output Environment Factor: 1.20 Entry/Circulating Flow Adjustment: Medium N Capacity Model: SIDRA Standard HV Method for Gap Acceptance: Include HV Effect for all percentages Page 2 of 13 Gap Acceptance Parameters Site:New Dundee Road -N-Strasburg Road - Weekday PM Turn Lane Lane ---- Circulating/Exiting Stream --- Critical Gap No. Type Flow Aver Aver In-Bnch Prop Foll-up Rate Speed Dist Headway Bunched Hdwy Dist Headway pcu/h km/h m sec sec m sec South: Cameron Road Environment Factor: 1.20 Entry/Circulating Flow Adjustment: None Left 1 Subdominant Thru 1 Subdominant Dominant Right 2 Dominant Environment Factor: 1.20 Entry/Circulating Flow Adjustment: Medium Left 1 Subdominant Thru 1 Subdominant Dominant Right 2 Dominant Environment Factor: 1.20 Entry/Circulating Flow Adjustment: Medium Left 1 Subdominant Thru 2 Dominant Right 2 Dominant Environment Factor: 1.20 Entry/Circulating Flow Adjustment: Medium Left 1 Dominant Thru 1 Dominant Subdominant Right 2 Subdominant Capacity Model: SIDRA Standard Priority sharing is implied for some movements (Follow-up Headway plus Intra-bunch Headway is larger than the Critical Gap). The O-D Factor ( Basic Parameters table) allows for priority sharing and priority emphasis. Dist (Distance): Spacing, i.e. distance between the front ends of two successive vehicles across all lanes in the circulating or exiting stream Pedestrian Effects Site:New Dundee Road -N-Strasburg Road - Weekday PM 2016 ROUNDABOUT ENTRY Turn Pedestrian Circulating Adjustment Flow Rate Flow Rate Factor South: Cameron Road Left Thru Right Left Thru Right about:blank 2012/01/25
190 Detailed Output Left Thru Right Left Thru Right Page 3 of 13 ROUNDABOUT EXIT Pedestrian Conflict Critical Follow-up Exit Lane Total Average Flow Rate Zone Length Gap Headway Capacity Exit Flow Exit Flow (ped/h) (m) (sec) (sec) (veh/h) (veh/h) (veh/h/lane) South: Cameron Road Movements Movement Capacity Parameters Site:New Dundee Road -N-Strasburg Road - Weekday PM Mov Opposing Movement Total Prac. Prac. Lane Deg. ID Demand Adjust. Cap. Deg. Spare Util Satn Flow HV Flow HV Flow Satn Cap. veh/h % veh/h % pcu/h veh/h xp % % x South: Cameron Road 3 L T R L L T T R R L L T T * 4R R * L L T T R R * Maximum degree of saturation Movement Performance Site:New Dundee Road -N-Strasburg Road - Weekday PM about:blank 2012/01/25
191 Detailed Output Mov Total Total Aver. Eff. Total Perf. Tot.Trav. Tot.Trav. Aver. ID Delay Delay Delay Stop Stops Index Distance Time Speed (veh-h/h)(pers-h/h)(sec) Rate (veh-km/h)(veh-h/h) (km/h) South: Cameron Road 3 L T R L L T T R R L L T T R R L L T T R R Page 4 of 13 Fuel Consumption, Emissions and Cost (Total) Site:New Dundee Road -N-Strasburg Road - Weekday PM 2016 Mov Cost Fuel CO2 CO HC NOX ID Total Total Total Total Total Total $/h L/h kg/h kg/h kg/h kg/h South: Cameron Road 3 L T R L L T T R R L L T T R R L L T T R R INTERSECTION: Fuel Consumption, Emissions and Cost (Rate) Site:New Dundee Road -N-Strasburg Road - Weekday PM 2016 Mov Cost Fuel CO2 CO HC NOX ID Rate Rate Rate Rate Rate Rate $/km L/100km g/km g/km g/km g/km about:blank 2012/01/25
192 about:blank 2012/01/25 Detailed Output South: Cameron Road 3 L T R L L T T R R L L T T R R L L T T R R INTERSECTION: Page 5 of 13 Intersection Negotiation Data Site:New Dundee Road -N-Strasburg Road - Weekday PM Negn Negn Negn Appr. Downstream Distance From To Radius Speed Dist. Dist Approach Approach Turn m km/h m m m User Spec? South: Cameron Road East Right No North Thru No West Left No South Left No North Right No West Thru No South Thru No East Left No West Right No South Right No East Thru No North Left No Maximum Negotiation (Design) Speed = 50.0 km/h Downstream distance is distance travelled from the stopline until exit cruise speed is reached (includes negotiation distance). Acceleration distance is weighted for light and heavy vehicles. The same distance applies for both stopped and unstopped vehicles. Movement Speeds and Geometric Delay Site:New Dundee Road -N-Strasburg Road - Weekday PM 2016
193 Detailed Output Queue Move-up App. Speeds Exit Speeds Av. Section Spd Geom Mov st 2nd Delay ID Cruise Negn Negn Cruise Grn Grn Running Overall sec South: Cameron Road 3 L T R L L T T R R L L T T R R L L T T R R "Running Speed" is the average speed excluding stopped periods. HCM Delay Formula option used: Geometric Delay is not included in Control Delay. Page 6 of 13 Lanes Lane Performance Site:New Dundee Road -N-Strasburg Road - Weekday PM 2016 Q u e u e Flow Cap Deg. Aver. Eff. 95% Back Lane Lane Satn Delay Stop Length No. veh/h veh/h x sec Rate veh m m South: Cameron Road 1 LT TR LT TR T 1 L TR LT TR T T Short lane due to specification of Turn Bay Lane Flow and Capacity Information Site:New Dundee Road -N-Strasburg Road - Weekday PM Lane Dem Flow (veh/h) Min Tot Deg. Lane No Cap Cap Satn Util Lef Thru Rig Tot veh/h veh/h x % South: Cameron Road 1 LT TR about:blank 2012/01/25
194 Detailed Output LT TR L TR LT TR D D Lane under-utilisation due to downstream effects Page 7 of 13 The capacity value for priority and continuous movements is obtained by adjusting the basic saturation flow for heavy vehicle and turning vehicle effects. Saturation flow scale applies if specified. Lane, Approach and Intersection Performance Site:New Dundee Road -N-Strasburg Road - Weekday PM Lane Demand Flow (veh/h) Adj. Eff Grn Deg Aver. Longest Shrt No %HV Basic (sec) Sat Delay Queue Lane L T R Tot Satf. 1st 2nd x sec m m South: Cameron Road 1 LT TR LT TR L TR LT TR U ========================================================================== ALL VEHICLES Total % Max Aver. Max Flow HV X Delay Queue ========================================================================== Peak flow period = 15 minutes. Queue values in this table are 95% queue (metres) Note: Basic Saturation Flows are not adjusted at roundabouts or signcontrolled intersections and apply only to continuous lanes. U Lane under-utilisation specified by the "User" Driver Characteristics Site:New Dundee Road -N-Strasburg Road - Weekday PM Average Driver Lane Satn Satn Satn Satn Queue Response No. Speed Flow Hdwy Spacing Space Time km/h veh/h sec m m sec about:blank 2012/01/25
195 Detailed Output South: Cameron Road 1 LT TR LT TR NA - Short Lane L TR LT TR NA - Short Lane Page 8 of 13 Saturation Flow and Saturation Headway are derived from follow-up headway. Lane Delays Site:New Dundee Road -N-Strasburg Road - Weekday PM Delay (seconds/veh) Deg. Stop-line Delay Acc. Queuing Stopd Lane Satn 1st 2nd Total Dec. Total MvUp (Idle) Geom Control No. x d1 d2 dsl dn dq dqm di dig dic South: Cameron Road 1 LT TR LT TR L TR LT TR HCM Delay Formula option used: (i) Control Delay does not include Geometric Delay, (ii) Stop-line Delay is treated as being same as Control Delay. dsl: Stop-line delay (=d1+d2) dn: Average stop-start delay for all vehicles queued and unqueued dq: Queuing delay (the part of the stop-line delay that includes stopped delay and queue move-up delay) dqm: Queue move-up delay di: Stopped delay (stopped (idling) time at near-zero speed) dig: Geometric delay dic: Intersection control delay (sum of stop-line and geometric delays) Lane Queues (Vehicles) Site:New Dundee Road -N-Strasburg Road - Weekday PM Deg. Ovrfl. Back of Queue (veh) Queue Prob. P'ile Cyc-Av. Queue Lane Satn Queue Stor. Block Block No. x No Nb1 Nb2 Nb 95% Ratio % % Nc 95% South: Cameron Road 1 LT TR LT TR about:blank 2012/01/25
196 Detailed Output L TR LT TR Page 9 of 13 HCM Delay Formula option used: Cycle-Average Queue is calculated using average delay from the HCM equation. (i.e. HCM delays are treated as stop-line delays for this purpose). SIDRA Standard models are used for Back of Queue estimation since HCM only gives Cycle-Average Queues for unsignalised intersections. Lane Queues (Distance) Site:New Dundee Road -N-Strasburg Road - Weekday PM Deg. Ovrfl. Back of Queue (m) Queue Prob. P'ile Cyc-Av. Queue Lane Satn Queue Stor. Block Block No. x No Nb1 Nb2 Nb 95% Ratio % % Nc 95% South: Cameron Road 1 LT TR LT TR L TR LT TR HCM Delay Formula option used: Cycle-Average Queue is calculated using average delay from the HCM equation. (i.e. HCM delays are treated as stop-line delays for this purpose). SIDRA Standard models are used for Back of Queue estimation since HCM only gives Cycle-Average Queues for unsignalised intersections. Lane Queue Percentiles (Vehicles) Site:New Dundee Road -N-Strasburg Road - Weekday PM Deg. Percentile Back of Queue (veh) Lane Satn No. x 50% 70% 85% 90% 95% 98% South: Cameron Road 1 LT TR LT TR L TR LT TR about:blank 2012/01/25
197 Detailed Output Page 10 of 13 SIDRA Standard models are used for Back of Queue estimation since HCM only gives Cycle-Average Queues for unsignalised intersections. Lane Queue Percentiles (Distance) Site:New Dundee Road -N-Strasburg Road - Weekday PM Deg. Percentile Back of Queue (metres) Lane Satn No. x 50% 70% 85% 90% 95% 98% South: Cameron Road 1 LT TR LT TR L TR LT TR SIDRA Standard models are used for Back of Queue estimation since HCM only gives Cycle-Average Queues for unsignalised intersections. Lane Stops Site:New Dundee Road -N-Strasburg Road - Weekday PM Queue Total Deg. -- Effective Stop Rate -- Total Move-up Queue Prop. Lane Satn Geom. Overall Stops Rate Move-ups Queued No. x he1 he2 hig h H hqm Hqm pq South: Cameron Road 1 LT TR LT TR L TR LT TR hig is the average value for all movements in a shared lane hqm is average queue move-up rate for all vehicles queued and unqueued Flow Rates and Demand Analysis Movement Definitions and Flow Rates (O-D) Site:New Dundee Road -N-Strasburg Road - Weekday PM 2016 about:blank 2012/01/25
198 Detailed Output Page 11 of From To Mov Flow Rate Flow Scale Peak Flow Approach Approach ID Turn LV HV Fixed Var Factor South: Cameron Road East 18 Right North 8 Thru West 3 Left South 1L Left North 6R Right West 6T Thru South 4T Thru East 7L Left West 4R Right South 2R Right East 2T Thru North 5L Left Unit Time for Volumes = 60 minutes Peak Flow Period = 15 minutes Flow Rates include effects of Flow Scale and Peak Flow Factor Flow Rates (Separate Light and Heavy Vehicles) Site:New Dundee Road -N-Strasburg Road - Weekday PM 2016 Mov Left Through Right ID LV HV LV HV LV HV Demand flows in veh/h as used by the program South: Cameron Road 3 L T R L L T T R R L L T T R R L L T T R R Unit Time for Volumes = 60 minutes Peak Flow Period = 15 minutes Flow Rates include effects of Flow Scale and Peak Flow Factor Flow Rates (Total Vehicles and Percent Heavy) Site:New Dundee Road -N-Strasburg Road - Weekday PM Mov Left Through Right ID about:blank 2012/01/25
199 about:blank 2012/01/25 Detailed Output Total %HV Total %HV Total %HV --- Demand flows in veh/h as used by the program South: Cameron Road 3 L T R L L T T R R L L T T R R L L T T R R Unit Time for Volumes = 60 minutes Peak Flow Period = 15 minutes Flow Rates include effects of Flow Scale and Peak Flow Factor Page 12 of 13 Other Model Settings Site:New Dundee Road -N-Strasburg Road - Weekday PM 2016 * Basic Parameters: Intersection Type: Driving on the right-hand side of the road Input data specified in Metric units Model Defaults: US HCM (Metric) Peak Flow Period (for performance): 15 minutes Unit time (for volumes): 60 minutes. HCM Delay Model option used HCM Queue Model option used Level of Service based on: Delay (HCM 2000) Queue percentile: 95% Parameters Used in Cost Calculations Site:New Dundee Road -N-Strasburg Road - Weekday PM 2016 Pump price of fuel ($/L) = Fuel resource cost factor = 0.70 Ratio of running cost to fuel cost = 3.0 Average income ($/h) = Time value factor = 0.40 Light vehicle mass (1000 kg) = 1.4 Heavy vehicle mass (1000 kg) = 11.0 Light vehicle idle fuel rate (L/h) = Heavy vehicle idle fuel rate (L/h) = Diagnostics Site:New Dundee Road -N-Strasburg Road - Weekday PM 2016
200 about:blank 2012/01/25 Detailed Output Processed: January 25, :22:35 PM Copyright Akcelik and Associates Pty Ltd SIDRA INTERSECTION Project: H:\DATA\ Transportation Planning\Working\Strasburg Road\SIDRA Files\PC\New Dundee Road and Strasburg Road -Final.sip , SNC-LAVALIN INC, SINGLE Page 13 of 13
201 Detailed Output about:blank Page 1 of /01/25 DETAILED OUTPUT New Dundee Road and Strasburg Road New Dundee Road -N-Strasburg Road - Weekday AM 2031 OUTPUT TABLE LINKS s Basic Parameters Gap Acceptance Parameters Pedestrian Effects Movements Movement Capacity Parameters Movement Performance Fuel Consumption, Emissions and Cost (Total) Fuel Consumption, Emissions and Cost (Rate) Intersection Negotiation Data Movement Speeds and Geometric Delay Lanes Lane Performance Lane Flow and Capacity Information Lane, Approach and Intersection Performance Driver Characteristics Lane Delays Lane Queues (Vehicles) Lane Queues (Distance) Lane Queue Percentiles (Vehicles) Lane Queue Percentiles (Distance) Lane Stops Flow Rates and Demand Analysis Movement Definitions and Flow Rates (O-D) Flow Rates (Separate Light and Heavy Vehicles) Flow Rates (Total Vehicles and Percent Heavy) Other Model Settings Parameters Used in Cost Calculations Diagnostics s Basic Parameters Site:New Dundee Road -N-Strasburg Road - Weekday AM Circulating/Exiting Stream Cent Circ Insc Ent Ent Cir Ent Av.Ent Island Width Diam. Rad Ang Lan Lan Lane Flow %HV Adjust. %Exit Cap. O-D Diam Width Flow Incl. Constr. Factor m m m m deg m veh/h pcu/h Effect South: Cameron Road Environment Factor: 1.20 Entry/Circulating Flow Adjustment: None N Environment Factor: 1.20 Entry/Circulating Flow Adjustment: Medium N
202 Detailed Output about:blank Page 2 of /01/25 Environment Factor: 1.20 Entry/Circulating Flow Adjustment: Medium N Environment Factor: 1.20 Entry/Circulating Flow Adjustment: Medium N Capacity Model: SIDRA Standard HV Method for Gap Acceptance: Include HV Effect for all percentages Gap Acceptance Parameters Site:New Dundee Road -N-Strasburg Road - Weekday AM Turn Lane Lane ---- Circulating/Exiting Stream --- Critical Gap No. Type Flow Aver Aver In-Bnch Prop Foll-up Rate Speed Dist Headway Bunched Hdwy Dist Headway pcu/h km/h m sec sec m sec South: Cameron Road Environment Factor: 1.20 Entry/Circulating Flow Adjustment: None Left 1 Subdominant Thru 1 Subdominant Dominant Right 2 Dominant Environment Factor: 1.20 Entry/Circulating Flow Adjustment: Medium Left 1 Subdominant Thru 1 Subdominant Dominant Right 2 Dominant Environment Factor: 1.20 Entry/Circulating Flow Adjustment: Medium Left 1 Subdominant Thru 2 Dominant Right 2 Dominant Environment Factor: 1.20 Entry/Circulating Flow Adjustment: Medium Left 1 Dominant Thru 1 Dominant Subdominant Right 2 Subdominant Capacity Model: SIDRA Standard Priority sharing is implied for some movements (Follow-up Headway plus Intra-bunch Headway is larger than the Critical Gap). The O-D Factor ( Basic Parameters table) allows for priority sharing and priority emphasis. Dist (Distance): Spacing, i.e. distance between the front ends of two successive vehicles across all lanes in the circulating or exiting stream Pedestrian Effects Site:New Dundee Road -N-Strasburg Road - Weekday AM 2031 ROUNDABOUT ENTRY Turn Pedestrian Circulating Adjustment Flow Rate Flow Rate Factor South: Cameron Road Left Thru Right
203 Detailed Output about:blank Page 3 of /01/ Left Thru Right Left Thru Right Left Thru Right ROUNDABOUT EXIT Pedestrian Conflict Critical Follow-up Exit Lane Total Average Flow Rate Zone Length Gap Headway Capacity Exit Flow Exit Flow (ped/h) (m) (sec) (sec) (veh/h) (veh/h) (veh/h/lane) South: Cameron Road Movements Movement Capacity Parameters Site:New Dundee Road -N-Strasburg Road - Weekday AM Mov Opposing Movement Total Prac. Prac. Lane Deg. ID Demand Adjust. Cap. Deg. Spare Util Satn Flow HV Flow HV Flow Satn Cap. veh/h % veh/h % pcu/h veh/h xp % % x South: Cameron Road 3 L T R L L T T R R L L T T R R L L * 2T T * 2R R * Maximum degree of saturation
204 Detailed Output about:blank Page 4 of /01/25 Movement Performance Site:New Dundee Road -N-Strasburg Road - Weekday AM Mov Total Total Aver. Eff. Total Perf. Tot.Trav. Tot.Trav. Aver. ID Delay Delay Delay Stop Stops Index Distance Time Speed (veh-h/h)(pers-h/h)(sec) Rate (veh-km/h)(veh-h/h) (km/h) South: Cameron Road 3 L T R L L T T R R L L T T R R L L T T R R Fuel Consumption, Emissions and Cost (Total) Site:New Dundee Road -N-Strasburg Road - Weekday AM 2031 Mov Cost Fuel CO2 CO HC NOX ID Total Total Total Total Total Total $/h L/h kg/h kg/h kg/h kg/h South: Cameron Road 3 L T R L L T T R R L L T T R R L L T T R R INTERSECTION:
205 Detailed Output about:blank Page 5 of /01/25 Fuel Consumption, Emissions and Cost (Rate) Site:New Dundee Road -N-Strasburg Road - Weekday AM 2031 Mov Cost Fuel CO2 CO HC NOX ID Rate Rate Rate Rate Rate Rate $/km L/100km g/km g/km g/km g/km South: Cameron Road 3 L T R L L T T R R L L T T R R L L T T R R INTERSECTION: Intersection Negotiation Data Site:New Dundee Road -N-Strasburg Road - Weekday AM Negn Negn Negn Appr. Downstream Distance From To Radius Speed Dist. Dist Approach Approach Turn m km/h m m m User Spec? South: Cameron Road East Right No North Thru No West Left No South Left No North Right No West Thru No South Thru No East Left No West Right No South Right No East Thru No North Left No
206 Detailed Output about:blank Page 6 of /01/25 Maximum Negotiation (Design) Speed = 50.0 km/h Downstream distance is distance travelled from the stopline until exit cruise speed is reached (includes negotiation distance). Acceleration distance is weighted for light and heavy vehicles. The same distance applies for both stopped and unstopped vehicles. Movement Speeds and Geometric Delay Site:New Dundee Road -N-Strasburg Road - Weekday AM Queue Move-up App. Speeds Exit Speeds Av. Section Spd Geom Mov st 2nd Delay ID Cruise Negn Negn Cruise Grn Grn Running Overall sec South: Cameron Road 3 L T R L L T T R R L L T T R R L L T T R R "Running Speed" is the average speed excluding stopped periods. HCM Delay Formula option used: Geometric Delay is not included in Control Delay. Lanes Lane Performance Site:New Dundee Road -N-Strasburg Road - Weekday AM 2031 Q u e u e Flow Cap Deg. Aver. Eff. 95% Back Lane Lane Satn Delay Stop Length No. veh/h veh/h x sec Rate veh m m South: Cameron Road 1 LT TR LT TR T 1 L TR LT TR T
207 Detailed Output about:blank Page 7 of /01/25 T Short lane due to specification of Turn Bay Lane Flow and Capacity Information Site:New Dundee Road -N-Strasburg Road - Weekday AM Lane Dem Flow (veh/h) Min Tot Deg. Lane No Cap Cap Satn Util Lef Thru Rig Tot veh/h veh/h x % South: Cameron Road 1 LT TR LT TR L TR LT TR D D Lane under-utilisation due to downstream effects The capacity value for priority and continuous movements is obtained by adjusting the basic saturation flow for heavy vehicle and turning vehicle effects. Saturation flow scale applies if specified. Lane, Approach and Intersection Performance Site:New Dundee Road -N-Strasburg Road - Weekday AM Lane Demand Flow (veh/h) Adj. Eff Grn Deg Aver. Longest Shrt No %HV Basic (sec) Sat Delay Queue Lane L T R Tot Satf. 1st 2nd x sec m m South: Cameron Road 1 LT TR LT TR L TR LT TR U ========================================================================== ALL VEHICLES Total % Max Aver. Max Flow HV X Delay Queue ==========================================================================
208 Detailed Output about:blank Page 8 of /01/25 Peak flow period = 15 minutes. Queue values in this table are 95% queue (metres) Note: Basic Saturation Flows are not adjusted at roundabouts or signcontrolled intersections and apply only to continuous lanes. U Lane under-utilisation specified by the "User" Driver Characteristics Site:New Dundee Road -N-Strasburg Road - Weekday AM Average Driver Lane Satn Satn Satn Satn Queue Response No. Speed Flow Hdwy Spacing Space Time km/h veh/h sec m m sec South: Cameron Road 1 LT TR LT TR NA - Short Lane L TR LT TR NA - Short Lane Saturation Flow and Saturation Headway are derived from follow-up headway. Lane Delays Site:New Dundee Road -N-Strasburg Road - Weekday AM Delay (seconds/veh) Deg. Stop-line Delay Acc. Queuing Stopd Lane Satn 1st 2nd Total Dec. Total MvUp (Idle) Geom Control No. x d1 d2 dsl dn dq dqm di dig dic South: Cameron Road 1 LT TR LT TR L TR LT TR HCM Delay Formula option used: (i) Control Delay does not include Geometric Delay, (ii) Stop-line Delay is treated as being same as Control Delay. dsl: Stop-line delay (=d1+d2) dn: Average stop-start delay for all vehicles queued and unqueued dq: Queuing delay (the part of the stop-line delay that includes stopped delay and queue move-up delay) dqm: Queue move-up delay
209 Detailed Output about:blank Page 9 of /01/25 di: Stopped delay (stopped (idling) time at near-zero speed) dig: Geometric delay dic: Intersection control delay (sum of stop-line and geometric delays) Lane Queues (Vehicles) Site:New Dundee Road -N-Strasburg Road - Weekday AM Deg. Ovrfl. Back of Queue (veh) Queue Prob. P'ile Cyc-Av. Queue Lane Satn Queue Stor. Block Block No. x No Nb1 Nb2 Nb 95% Ratio % % Nc 95% South: Cameron Road 1 LT TR LT TR L TR LT TR HCM Delay Formula option used: Cycle-Average Queue is calculated using average delay from the HCM equation. (i.e. HCM delays are treated as stop-line delays for this purpose). SIDRA Standard models are used for Back of Queue estimation since HCM only gives Cycle-Average Queues for unsignalised intersections. Lane Queues (Distance) Site:New Dundee Road -N-Strasburg Road - Weekday AM Deg. Ovrfl. Back of Queue (m) Queue Prob. P'ile Cyc-Av. Queue Lane Satn Queue Stor. Block Block No. x No Nb1 Nb2 Nb 95% Ratio % % Nc 95% South: Cameron Road 1 LT TR LT TR L TR LT TR HCM Delay Formula option used: Cycle-Average Queue is calculated using average delay from the HCM equation. (i.e. HCM delays are treated as stop-line delays for this purpose). SIDRA Standard models are used for Back of Queue estimation since HCM only gives Cycle-Average Queues for unsignalised intersections.
210 Detailed Output about:blank Page 10 of /01/25 Lane Queue Percentiles (Vehicles) Site:New Dundee Road -N-Strasburg Road - Weekday AM Deg. Percentile Back of Queue (veh) Lane Satn No. x 50% 70% 85% 90% 95% 98% South: Cameron Road 1 LT TR LT TR L TR LT TR SIDRA Standard models are used for Back of Queue estimation since HCM only gives Cycle-Average Queues for unsignalised intersections. Lane Queue Percentiles (Distance) Site:New Dundee Road -N-Strasburg Road - Weekday AM Deg. Percentile Back of Queue (metres) Lane Satn No. x 50% 70% 85% 90% 95% 98% South: Cameron Road 1 LT TR LT TR L TR LT TR SIDRA Standard models are used for Back of Queue estimation since HCM only gives Cycle-Average Queues for unsignalised intersections. Lane Stops Site:New Dundee Road -N-Strasburg Road - Weekday AM Queue Total Deg. -- Effective Stop Rate -- Total Move-up Queue Prop. Lane Satn Geom. Overall Stops Rate Move-ups Queued
211 Detailed Output about:blank Page 11 of /01/25 No. x he1 he2 hig h H hqm Hqm pq South: Cameron Road 1 LT TR LT TR L TR LT TR hig is the average value for all movements in a shared lane hqm is average queue move-up rate for all vehicles queued and unqueued Flow Rates and Demand Analysis Movement Definitions and Flow Rates (O-D) Site:New Dundee Road -N-Strasburg Road - Weekday AM From To Mov Flow Rate Flow Scale Peak Flow Approach Approach ID Turn LV HV Fixed Var Factor South: Cameron Road East 18 Right North 8 Thru West 3 Left South 1L Left North 6R Right West 6T Thru South 4T Thru East 7L Left West 4R Right South 2R Right East 2T Thru North 5L Left Unit Time for Volumes = 60 minutes Peak Flow Period = 15 minutes Flow Rates include effects of Flow Scale and Peak Flow Factor Flow Rates (Separate Light and Heavy Vehicles) Site:New Dundee Road -N-Strasburg Road - Weekday AM 2031 Mov Left Through Right ID LV HV LV HV LV HV Demand flows in veh/h as used by the program South: Cameron Road 3 L
212 Detailed Output about:blank Page 12 of /01/25 8 T R L L T T R R L L T T R R L L T T R R Unit Time for Volumes = 60 minutes Peak Flow Period = 15 minutes Flow Rates include effects of Flow Scale and Peak Flow Factor Flow Rates (Total Vehicles and Percent Heavy) Site:New Dundee Road -N-Strasburg Road - Weekday AM Mov Left Through Right ID Total %HV Total %HV Total %HV --- Demand flows in veh/h as used by the program South: Cameron Road 3 L T R L L T T R R L L T T R R L L T T R R Unit Time for Volumes = 60 minutes Peak Flow Period = 15 minutes Flow Rates include effects of Flow Scale and Peak Flow Factor Other Model Settings Site:New Dundee Road -N-Strasburg Road - Weekday AM 2031 * Basic Parameters: Intersection Type: Driving on the right-hand side of the road Input data specified in Metric units
213 Detailed Output Page 13 of 13 Model Defaults: US HCM (Metric) Peak Flow Period (for performance): 15 minutes Unit time (for volumes): 60 minutes. HCM Delay Model option used HCM Queue Model option used Level of Service based on: Delay (HCM 2000) Queue percentile: 95% Parameters Used in Cost Calculations Site:New Dundee Road -N-Strasburg Road - Weekday AM 2031 Pump price of fuel ($/L) = Fuel resource cost factor = 0.70 Ratio of running cost to fuel cost = 3.0 Average income ($/h) = Time value factor = 0.40 Light vehicle mass (1000 kg) = 1.4 Heavy vehicle mass (1000 kg) = 11.0 Light vehicle idle fuel rate (L/h) = Heavy vehicle idle fuel rate (L/h) = Diagnostics Site:New Dundee Road -N-Strasburg Road - Weekday AM 2031 Processed: January 25, :24:17 PM SIDRA INTERSECTION Copyright Akcelik and Associates Pty Ltd Project: H:\DATA\ Transportation Planning\Working\Strasburg Road\SIDRA Files\PC\New Dundee Road and Strasburg Road -Final.sip , SNC-LAVALIN INC, SINGLE about:blank 2012/01/25
214 Detailed Output DETAILED OUTPUT New Dundee Road and Strasburg Road Page 1 of 13 New Dundee Road -N-Strasburg Road - Weekday PM 2031 OUTPUT TABLE LINKS s Basic Parameters Gap Acceptance Parameters Pedestrian Effects Movements Movement Capacity Parameters Movement Performance Fuel Consumption, Emissions and Cost (Total) Fuel Consumption, Emissions and Cost (Rate) Intersection Negotiation Data Movement Speeds and Geometric Delay Lanes Lane Performance Lane Flow and Capacity Information Lane, Approach and Intersection Performance Driver Characteristics Lane Delays Lane Queues (Vehicles) Lane Queues (Distance) Lane Queue Percentiles (Vehicles) Lane Queue Percentiles (Distance) Lane Stops Flow Rates and Demand Analysis Movement Definitions and Flow Rates (O-D) Flow Rates (Separate Light and Heavy Vehicles) Flow Rates (Total Vehicles and Percent Heavy) Other Model Settings Parameters Used in Cost Calculations Diagnostics s Basic Parameters Site:New Dundee Road -N-Strasburg Road - Weekday PM Circulating/Exiting Stream Cent Circ Insc Ent Ent Cir Ent Av.Ent Island Width Diam. Rad Ang Lan Lan Lane Flow %HV Adjust. %Exit Cap. O-D Diam Width Flow Incl. Constr. Factor m m m m deg m veh/h pcu/h Effect South: Cameron Road Environment Factor: 1.20 Entry/Circulating Flow Adjustment: None N Environment Factor: 1.20 Entry/Circulating Flow Adjustment: Medium N Environment Factor: 1.20 Entry/Circulating Flow Adjustment: Medium N about:blank 2012/01/25
215 Detailed Output Environment Factor: 1.20 Entry/Circulating Flow Adjustment: Medium N Capacity Model: SIDRA Standard HV Method for Gap Acceptance: Include HV Effect for all percentages Page 2 of 13 Gap Acceptance Parameters Site:New Dundee Road -N-Strasburg Road - Weekday PM Turn Lane Lane ---- Circulating/Exiting Stream --- Critical Gap No. Type Flow Aver Aver In-Bnch Prop Foll-up Rate Speed Dist Headway Bunched Hdwy Dist Headway pcu/h km/h m sec sec m sec South: Cameron Road Environment Factor: 1.20 Entry/Circulating Flow Adjustment: None Left 1 Subdominant Thru 1 Subdominant Dominant Right 2 Dominant Environment Factor: 1.20 Entry/Circulating Flow Adjustment: Medium Left 1 Subdominant Thru 1 Subdominant Dominant Right 2 Dominant Environment Factor: 1.20 Entry/Circulating Flow Adjustment: Medium Left 1 Subdominant Thru 1 Subdominant Dominant Right 2 Dominant Environment Factor: 1.20 Entry/Circulating Flow Adjustment: Medium Left 1 Dominant Thru 1 Dominant Subdominant Right 2 Subdominant Capacity Model: SIDRA Standard Priority sharing is implied for some movements (Follow-up Headway plus Intra-bunch Headway is larger than the Critical Gap). The O-D Factor ( Basic Parameters table) allows for priority sharing and priority emphasis. Dist (Distance): Spacing, i.e. distance between the front ends of two successive vehicles across all lanes in the circulating or exiting stream Pedestrian Effects Site:New Dundee Road -N-Strasburg Road - Weekday PM 2031 ROUNDABOUT ENTRY Turn Pedestrian Circulating Adjustment Flow Rate Flow Rate Factor South: Cameron Road Left Thru Right Left Thru Right about:blank 2012/01/25
216 about:blank 2012/01/25 Detailed Output Left Thru Right Left Thru Right Page 3 of 13 ROUNDABOUT EXIT Pedestrian Conflict Critical Follow-up Exit Lane Total Average Flow Rate Zone Length Gap Headway Capacity Exit Flow Exit Flow (ped/h) (m) (sec) (sec) (veh/h) (veh/h) (veh/h/lane) South: Cameron Road Movements Movement Capacity Parameters Site:New Dundee Road -N-Strasburg Road - Weekday PM Mov Opposing Movement Total Prac. Prac. Lane Deg. ID Demand Adjust. Cap. Deg. Spare Util Satn Flow HV Flow HV Flow Satn Cap. veh/h % veh/h % pcu/h veh/h xp % % x South: Cameron Road 3 L T R L L * 6T T * 6R R * L L T T R R L L T T R R * Maximum degree of saturation Movement Performance Site:New Dundee Road -N-Strasburg Road - Weekday PM 2031
217 Detailed Output Mov Total Total Aver. Eff. Total Perf. Tot.Trav. Tot.Trav. Aver. ID Delay Delay Delay Stop Stops Index Distance Time Speed (veh-h/h)(pers-h/h)(sec) Rate (veh-km/h)(veh-h/h) (km/h) South: Cameron Road 3 L T R L L T T R R L L T T R R L L T T R R Page 4 of 13 Fuel Consumption, Emissions and Cost (Total) Site:New Dundee Road -N-Strasburg Road - Weekday PM 2031 Mov Cost Fuel CO2 CO HC NOX ID Total Total Total Total Total Total $/h L/h kg/h kg/h kg/h kg/h South: Cameron Road 3 L T R L L T T R R L L T T R R L L T T R R INTERSECTION: Fuel Consumption, Emissions and Cost (Rate) Site:New Dundee Road -N-Strasburg Road - Weekday PM 2031 Mov Cost Fuel CO2 CO HC NOX ID Rate Rate Rate Rate Rate Rate about:blank 2012/01/25
218 Detailed Output $/km L/100km g/km g/km g/km g/km South: Cameron Road 3 L T R L L T T R R L L T T R R L L T T R R INTERSECTION: Page 5 of 13 Intersection Negotiation Data Site:New Dundee Road -N-Strasburg Road - Weekday PM Negn Negn Negn Appr. Downstream Distance From To Radius Speed Dist. Dist Approach Approach Turn m km/h m m m User Spec? South: Cameron Road East Right No North Thru No West Left No South Left No North Right No West Thru No South Thru No East Left No West Right No South Right No East Thru No North Left No Maximum Negotiation (Design) Speed = 50.0 km/h Downstream distance is distance travelled from the stopline until exit cruise speed is reached (includes negotiation distance). Acceleration distance is weighted for light and heavy vehicles. The same distance applies for both stopped and unstopped vehicles. Movement Speeds and Geometric Delay Site:New Dundee Road -N-Strasburg Road - Weekday PM 2031 about:blank 2012/01/25
219 Detailed Output Page 6 of Queue Move-up App. Speeds Exit Speeds Av. Section Spd Geom Mov st 2nd Delay ID Cruise Negn Negn Cruise Grn Grn Running Overall sec South: Cameron Road 3 L T R L L T T R R L L T T R R L L T T R R "Running Speed" is the average speed excluding stopped periods. HCM Delay Formula option used: Geometric Delay is not included in Control Delay. Lanes Lane Performance Site:New Dundee Road -N-Strasburg Road - Weekday PM 2031 Q u e u e Flow Cap Deg. Aver. Eff. 95% Back Lane Lane Satn Delay Stop Length No. veh/h veh/h x sec Rate veh m m South: Cameron Road 1 LT TR LT TR T 1 LT TR LT TR T T Short lane due to specification of Turn Bay Lane Flow and Capacity Information Site:New Dundee Road -N-Strasburg Road - Weekday PM Lane Dem Flow (veh/h) Min Tot Deg. Lane No Cap Cap Satn Util Lef Thru Rig Tot veh/h veh/h x % South: Cameron Road 1 LT about:blank 2012/01/25
220 Detailed Output 2 TR LT TR LT TR LT TR D D Lane under-utilisation due to downstream effects Page 7 of 13 The capacity value for priority and continuous movements is obtained by adjusting the basic saturation flow for heavy vehicle and turning vehicle effects. Saturation flow scale applies if specified. Lane, Approach and Intersection Performance Site:New Dundee Road -N-Strasburg Road - Weekday PM Lane Demand Flow (veh/h) Adj. Eff Grn Deg Aver. Longest Shrt No %HV Basic (sec) Sat Delay Queue Lane L T R Tot Satf. 1st 2nd x sec m m South: Cameron Road 1 LT TR LT TR LT TR LT TR U ========================================================================== ALL VEHICLES Total % Max Aver. Max Flow HV X Delay Queue ========================================================================== Peak flow period = 15 minutes. Queue values in this table are 95% queue (metres) Note: Basic Saturation Flows are not adjusted at roundabouts or signcontrolled intersections and apply only to continuous lanes. U Lane under-utilisation specified by the "User" Driver Characteristics Site:New Dundee Road -N-Strasburg Road - Weekday PM Average Driver Lane Satn Satn Satn Satn Queue Response No. Speed Flow Hdwy Spacing Space Time km/h veh/h sec m m sec about:blank 2012/01/25
221 Detailed Output South: Cameron Road 1 LT TR LT TR NA - Short Lane LT TR LT TR NA - Short Lane Page 8 of 13 Saturation Flow and Saturation Headway are derived from follow-up headway. Lane Delays Site:New Dundee Road -N-Strasburg Road - Weekday PM Delay (seconds/veh) Deg. Stop-line Delay Acc. Queuing Stopd Lane Satn 1st 2nd Total Dec. Total MvUp (Idle) Geom Control No. x d1 d2 dsl dn dq dqm di dig dic South: Cameron Road 1 LT TR LT TR LT TR LT TR HCM Delay Formula option used: (i) Control Delay does not include Geometric Delay, (ii) Stop-line Delay is treated as being same as Control Delay. dsl: Stop-line delay (=d1+d2) dn: Average stop-start delay for all vehicles queued and unqueued dq: Queuing delay (the part of the stop-line delay that includes stopped delay and queue move-up delay) dqm: Queue move-up delay di: Stopped delay (stopped (idling) time at near-zero speed) dig: Geometric delay dic: Intersection control delay (sum of stop-line and geometric delays) Lane Queues (Vehicles) Site:New Dundee Road -N-Strasburg Road - Weekday PM Deg. Ovrfl. Back of Queue (veh) Queue Prob. P'ile Cyc-Av. Queue Lane Satn Queue Stor. Block Block No. x No Nb1 Nb2 Nb 95% Ratio % % Nc 95% South: Cameron Road 1 LT TR LT about:blank 2012/01/25
222 Detailed Output 2 TR LT TR LT TR Page 9 of 13 HCM Delay Formula option used: Cycle-Average Queue is calculated using average delay from the HCM equation. (i.e. HCM delays are treated as stop-line delays for this purpose). SIDRA Standard models are used for Back of Queue estimation since HCM only gives Cycle-Average Queues for unsignalised intersections. Lane Queues (Distance) Site:New Dundee Road -N-Strasburg Road - Weekday PM Deg. Ovrfl. Back of Queue (m) Queue Prob. P'ile Cyc-Av. Queue Lane Satn Queue Stor. Block Block No. x No Nb1 Nb2 Nb 95% Ratio % % Nc 95% South: Cameron Road 1 LT TR LT TR LT TR LT TR HCM Delay Formula option used: Cycle-Average Queue is calculated using average delay from the HCM equation. (i.e. HCM delays are treated as stop-line delays for this purpose). SIDRA Standard models are used for Back of Queue estimation since HCM only gives Cycle-Average Queues for unsignalised intersections. Lane Queue Percentiles (Vehicles) Site:New Dundee Road -N-Strasburg Road - Weekday PM Deg. Percentile Back of Queue (veh) Lane Satn No. x 50% 70% 85% 90% 95% 98% South: Cameron Road 1 LT TR LT TR LT TR LT TR about:blank 2012/01/25
223 about:blank 2012/01/25 Detailed Output Page 10 of 13 SIDRA Standard models are used for Back of Queue estimation since HCM only gives Cycle-Average Queues for unsignalised intersections. Lane Queue Percentiles (Distance) Site:New Dundee Road -N-Strasburg Road - Weekday PM Deg. Percentile Back of Queue (metres) Lane Satn No. x 50% 70% 85% 90% 95% 98% South: Cameron Road 1 LT TR LT TR LT TR LT TR SIDRA Standard models are used for Back of Queue estimation since HCM only gives Cycle-Average Queues for unsignalised intersections. Lane Stops Site:New Dundee Road -N-Strasburg Road - Weekday PM Queue Total Deg. -- Effective Stop Rate -- Total Move-up Queue Prop. Lane Satn Geom. Overall Stops Rate Move-ups Queued No. x he1 he2 hig h H hqm Hqm pq South: Cameron Road 1 LT TR LT TR LT TR LT TR hig is the average value for all movements in a shared lane hqm is average queue move-up rate for all vehicles queued and unqueued Flow Rates and Demand Analysis Movement Definitions and Flow Rates (O-D) Site:New Dundee Road -N-Strasburg Road - Weekday PM 2031
224 Detailed Output Page 11 of From To Mov Flow Rate Flow Scale Peak Flow Approach Approach ID Turn LV HV Fixed Var Factor South: Cameron Road East 18 Right North 8 Thru West 3 Left South 1L Left North 6R Right West 6T Thru South 4T Thru East 7L Left West 4R Right South 2R Right East 2T Thru North 5L Left Unit Time for Volumes = 60 minutes Peak Flow Period = 15 minutes Flow Rates include effects of Flow Scale and Peak Flow Factor Flow Rates (Separate Light and Heavy Vehicles) Site:New Dundee Road -N-Strasburg Road - Weekday PM 2031 Mov Left Through Right ID LV HV LV HV LV HV Demand flows in veh/h as used by the program South: Cameron Road 3 L T R L L T T R R L L T T R R L L T T R R Unit Time for Volumes = 60 minutes Peak Flow Period = 15 minutes Flow Rates include effects of Flow Scale and Peak Flow Factor Flow Rates (Total Vehicles and Percent Heavy) Site:New Dundee Road -N-Strasburg Road - Weekday PM Mov Left Through Right about:blank 2012/01/25
225 about:blank 2012/01/25 Detailed Output ID Total %HV Total %HV Total %HV --- Demand flows in veh/h as used by the program South: Cameron Road 3 L T R L L T T R R L L T T R R L L T T R R Unit Time for Volumes = 60 minutes Peak Flow Period = 15 minutes Flow Rates include effects of Flow Scale and Peak Flow Factor Page 12 of 13 Other Model Settings Site:New Dundee Road -N-Strasburg Road - Weekday PM 2031 * Basic Parameters: Intersection Type: Driving on the right-hand side of the road Input data specified in Metric units Model Defaults: US HCM (Metric) Peak Flow Period (for performance): 15 minutes Unit time (for volumes): 60 minutes. HCM Delay Model option used HCM Queue Model option used Level of Service based on: Delay (HCM 2000) Queue percentile: 95% Parameters Used in Cost Calculations Site:New Dundee Road -N-Strasburg Road - Weekday PM 2031 Pump price of fuel ($/L) = Fuel resource cost factor = 0.70 Ratio of running cost to fuel cost = 3.0 Average income ($/h) = Time value factor = 0.40 Light vehicle mass (1000 kg) = 1.4 Heavy vehicle mass (1000 kg) = 11.0 Light vehicle idle fuel rate (L/h) = Heavy vehicle idle fuel rate (L/h) = Diagnostics Site:New Dundee Road -N-Strasburg Road - Weekday PM 2031
226 Detailed Output Page 13 of 13 Processed: January 25, :25:59 PM SIDRA INTERSECTION Copyright Akcelik and Associates Pty Ltd Project: H:\DATA\ Transportation Planning\Working\Strasburg Road\SIDRA Files\PC\New Dundee Road and Strasburg Road -Final.sip , SNC-LAVALIN INC, SINGLE about:blank 2012/01/25
227 Strasburg Road Extension Environmental Study Report From North of Stauffer Drive to New Dundee Road October 2013 APPENDIX D.1 (b) ROUNDABOUT SCREENING ASSESSMENT E-Rev 1
228 November 28, 2008 REGION OF WATERLOO ROUNDABOUT FEASIBILITY INITIAL SCREENING TOOL VERSION 1.0 The intent of this screening tool is to provide a relatively quick assessment of the feasibility of a modern roundabout at a particular intersection in comparison to other appropriate forms of traffic control or road improvements including auxiliary lanes, traffic control signals, four-way stop, etc. The intended outcome of this tool is to provide enough information to assist staff in deciding whether or not to proceed to an Intersection Control Study to further investigate in more detail the feasibility of a roundabout. 1) Project Name/File No.: 2) Intersection Location (Street/Road Names, distance from major intersection, etc.): 3) Brief Description of Intersection (Number of Legs, Lanes on each leg, total AADT, AADT on each road, etc. Attach or sketch diagram showing existing and horizon-year turning movements.): 4) What operational problems are being experienced at this location? DOCS # Page 1 of 5
229 REGION OF WATERLOO ROUNDABOUT FEASIBILITY INITIAL SCREENING TOOL VERSION 1.0 5) Is it a new intersection or is it a retrofit of an existing intersection? If existing, what is the existing traffic control? 6) Is the intersection in the vicinity of a railroad crossing or another intersection? If so, how close and what type of traffic control exists at the adjacent intersection(s)? Will queues be a problem? 7) Would the intersection be located within a coordinated signal system? 8) Would the intersection be located on a Preferred Corridor? 9) Is the intersection located within a corridor that is scheduled for improvements in the 10 Year Transportation Capital Program? What is the ultimate cross-section of the approach roads? DOCS # Page 2 of 5
230 REGION OF WATERLOO ROUNDABOUT FEASIBILITY INITIAL SCREENING TOOL VERSION ) What is the collision history of the intersection over the past five years? Is there a collision problem that needs to be addressed? 11) Are persons with disabilities or horse and buggies frequent users of this intersection? 12) What traditional road improvements are proposed for this intersection? (eg. traffic signals, all-way stop, auxiliary lanes, etc.) Please attach a sketch of the traditional road improvements. A sample sketch is attached (DOCS #529440). 13) If traffic control signals are being considered, are the traffic signal warrants met for the horizon year? DOCS # Page 3 of 5
231 REGION OF WATERLOO ROUNDABOUT FEASIBILITY INITIAL SCREENING TOOL VERSION ) What size of roundabout is being considered for this intersection? (eg. Single-lane, two-lane entry or three-lane entry?) Please attach a Traffic Flow Worksheet and lane configuration diagram. Please attach a sketch showing how a roundabout would fit into the right-of-way. A sample sketch is attached (DOCS #529433). 15) 20-Year Life Cycle Cost Estimate Injury Collision Cost (ICC): Discount Rate: (i): 20 YEAR LIFE-CYCLE COST COMPARISON Cost Item Other Traffic Control Implementation Cost $ $ Injury Collision Cost (Present Value) $ $ Total Life Cycle Cost X Y Notes: Implementation Cost = sum of costs for construction, property utility relocations, illumination, engineering (20%), contingency (20%) and maintenance (5%); Present Value of 20 Year Injury Collision Cost = expected annual collision frequency x ICC ((1 + i) 20-1) / i(1+i) 20 Monte Carlo Analysis may be required. If so, a range for the implementation cost (i.e. 10%, 50%, 90% probability) is required DOCS # Page 4 of 5
232 REGION OF WATERLOO ROUNDABOUT FEASIBILITY INITIAL SCREENING TOOL VERSION 1.0 Conclusions and Recommendation DOCS # Page 5 of 5
233 Strasburg Road and New Dundee Road Intersection Options Summary of Pros and Cons Option Pros Cons Option A (without reverse curve approach design) Option B (with reverse curve approach design) 4 Leg Signal Control (at current intersection location) Staggered Signal Control 4 Leg Signal Control (shifted to the west by about 200 metres from the current intersection location) Fewer expected injury collisions than a signal control Less delays and better LOS performance than a signal control, especially during off peaks Consistent with the City s initiative of implementing roundabouts at the other two new intersections on Strasburg Road Drivers in the area are more familiar with this roundabout design Fewer expected injury collisions than a signal control Less delays and better LOS performance than a signal control, especially during off peaks Consistent with the City s initiative of implementing roundabouts at the other two new intersections on Strasburg Road The reverse curve approaches would help to restrict the vehicle speed in entering the roundabout Less conflict movements and thus less traffic delays than two staggered intersections Minimal property impact A more economic solution if the Region considers having an EB left turn signal would be acceptable as an alternative measure to the vertical profile correction The minimum decision sight distance requirement is achieved by having the intersection shifted to the west by approximately 200 metres The minimum decision sight distance requirement is achieved by having the intersection shifted to the west by approximately 200 metres Less conflict movements and thus less traffic delays than two staggered intersections Since the roundabout is located at the hill crest, some special treatments to increase the visibility of the roundabout centre island would be required such as by providing raised chevron, signs and appropriate landscaping (costs included) Drivers may not necessarily reduce the speed of their vehicles before entering the roundabout Since the roundabout is located at the hill crest, some special treatments to increase the visibility of the roundabout centre island would be required such as by providing raised chevron, signs and appropriate landscaping (costs included) Drivers in the area may not be familiar with the reverse curve approach design for the roundabout Higher expected injury collisions than a roundabout A vertical profile correction is required in order to achieve the minimum decision sight distance requirement An EB left turn signal phase is required in the case of no vertical profile correction The introduction of an EB left turn signal phase means that it will reduce the green time for the critical WB movement during the peak hours Higher expected injury collisions than a roundabout as well as a 4 leg signal control intersection Not preferred from traffic operational viewpoint as two staggered intersections will create additional conflict movements and thus traffic delays than a single 4 leg intersection The close intersection spacing does not permit signal progression and hence, traffic mobility cannot be optimized Having the intersection shifted by 200 metres means that the Strasburg Road alignment would also have to be shifted which makes it less supportive from transit catchment perspective Additional costs will be incurred due to the shifting of Strasburg Road alignment Higher expected injury collisions than a roundabout Significant property impact Additional costs will be incurred due to the shifting of both Strasburg Road and Cameron Road alignments The most costly option among the others Implementation Cost (2012 Value) Injury Collision Cost (2012 Value) 20 Year Life Cycle Cost (2012 Value) $3,000,000 $200,000 $3,200,000 $3,000,000 (assumed having a similar order as Option A) $2,900,000 with vertical profile correction $2,500,000 without vertical profile correction $200,000 $3,200,000 $800,000 $3,700,000 with vertical profile correction $3,300,000 without vertical profile correction $4,400,000 $1,000,000 $5,400,000 $6,900,000 $800,000 $7,700,
234 Ontario Traffic Manual Book 12 Justification 7B - Projected Volumes New Dundee Road & Strasburg Road Major Road: No. of lanes: 1 Lane 2 or more lanes 2 Minor Road: No. of lanes: 1 Lane 2 or more lanes 2 Main Northbound Approach Minor Eastbound Approach Main Southbound Approach Minor Westbound Approach Pedestrians Crossing LT TH RT LT TH RT LT TH RT LT TH RT Main Road AM Peak PM Peak Total Justification 1. Minimum Vehicular Volume 2. Delay to cross traffic Description A. Vechicle volume, all approaches (average hour) B. Vehicle volume, along minor streets (average hour) A. Vehicle volume, major street (average hour) B. Combined vehicle and pedestrian volume crossing artery from minor streets Minimum Requirement Minimum Requirement Compliance 1 Lane Highways 2 or more lanes Sectional Free Flow Restr. Flow Free Flow Restr. Flow Numerical % % % % % Entire % 100% 88% RESULTS 1. Minimum Vehicular Volume Justification Compliance A Total Volume 100% B Crossing Volume 100% A Main Road 77% B Crossing Road 100% A Justificaton 1 100% B Justification 2 77% Signal Justified? 2. Delay to Cross Traffic NO 3. Combination NO YES
235 Ontario Traffic Manual Book 12 Justification 7B - Projected Volumes New Dundee Road & Strasburg Road Major Road: No. of lanes: 1 Lane 2 or more lanes 2 Minor Road: No. of lanes: 1 Lane 2 or more lanes 2 Main Northbound Approach Minor Eastbound Approach Main Southbound Approach Minor Westbound Approach Pedestrians Crossing LT TH RT LT TH RT LT TH RT LT TH RT Main Road AM Peak PM Peak Total , Justification 1. Minimum Vehicular Volume 2. Delay to cross traffic Description A. Vechicle volume, all approaches (average hour) B. Vehicle volume, along minor streets (average hour) A. Vehicle volume, major street (average hour) B. Combined vehicle and pedestrian volume crossing artery from minor streets Minimum Requirement Minimum Requirement Compliance 1 Lane Highways 2 or more lanes Sectional Free Flow Restr. Flow Free Flow Restr. Flow Numerical % % % % % Entire % 100% 100% RESULTS 1. Minimum Vehicular Volume Justification Compliance A Total Volume 100% B Crossing Volume 100% A Main Road 100% B Crossing Road 100% A Justificaton 1 100% B Justification 2 100% Signal Justified? 2. Delay to Cross Traffic YES 3. Combination YES YES
236
237
238
239
240
241 REGION OF WATERLOO ROUNDABOUT Project: Strasburg Road Extension Class EA Drawn By: A. Tam TRAFFIC Project No.: Sheet 1 of 2 FLOW SHEET Intersection: New Dundee / Strasburg Road VERSION 1.0 AUG 22, 2008 Time Period: 2031 AM PEAK Strasburg Road 946 TR% N 8 TR% 8 New Dundee Road New Dundee Road TR % Cameron Road TR% Capacity Guidelines RODEL Inputs 1. Single Lane service volumes < 900vph vph Leg PCU 1st Exit 2nd Exit 3rd Exit U-turn 2. Exit flow < 900vph vph for single lane exit Strasburg Road Entry flow + circulating flow < 1400vph use single lane entry New Dundee Road vph < Entry + Circ. flow < 2200vph use two-lane entry Cameron Road Entry flow + circulating flow > 2200vph use three-lane entry New Dundee Road
242 REGION OF WATERLOO ROUNDABOUT Project: Strasburg Road Extension Class EA Drawn By: A. Tam TRAFFIC Project No.: Sheet 2 of 2 FLOW SHEET Intersection: New Dundee / Strasburg Road VERSION 1.0 AUG 22, 2008 Time Period: 2031 PM PEAK Strasburg Road 976 TR% ,120 N 8 TR% 8 New Dundee Road New Dundee Road TR % Cameron Road TR% Capacity Guidelines RODEL Inputs 1. Single Lane service volumes < 900vph vph Leg PCU 1st Exit 2nd Exit 3rd Exit U-turn 2. Exit flow < 900vph vph for single lane exit Strasburg Road Entry flow + circulating flow < 1400vph use single lane entry New Dundee Road vph < Entry + Circ. flow < 2200vph use two-lane entry Cameron Road Entry flow + circulating flow > 2200vph use three-lane entry New Dundee Road
243
244
245


246 NEW DUNDEE ROAD STRASBURG ROAD CAMERON ROAD NEW DUNDEE ROAD


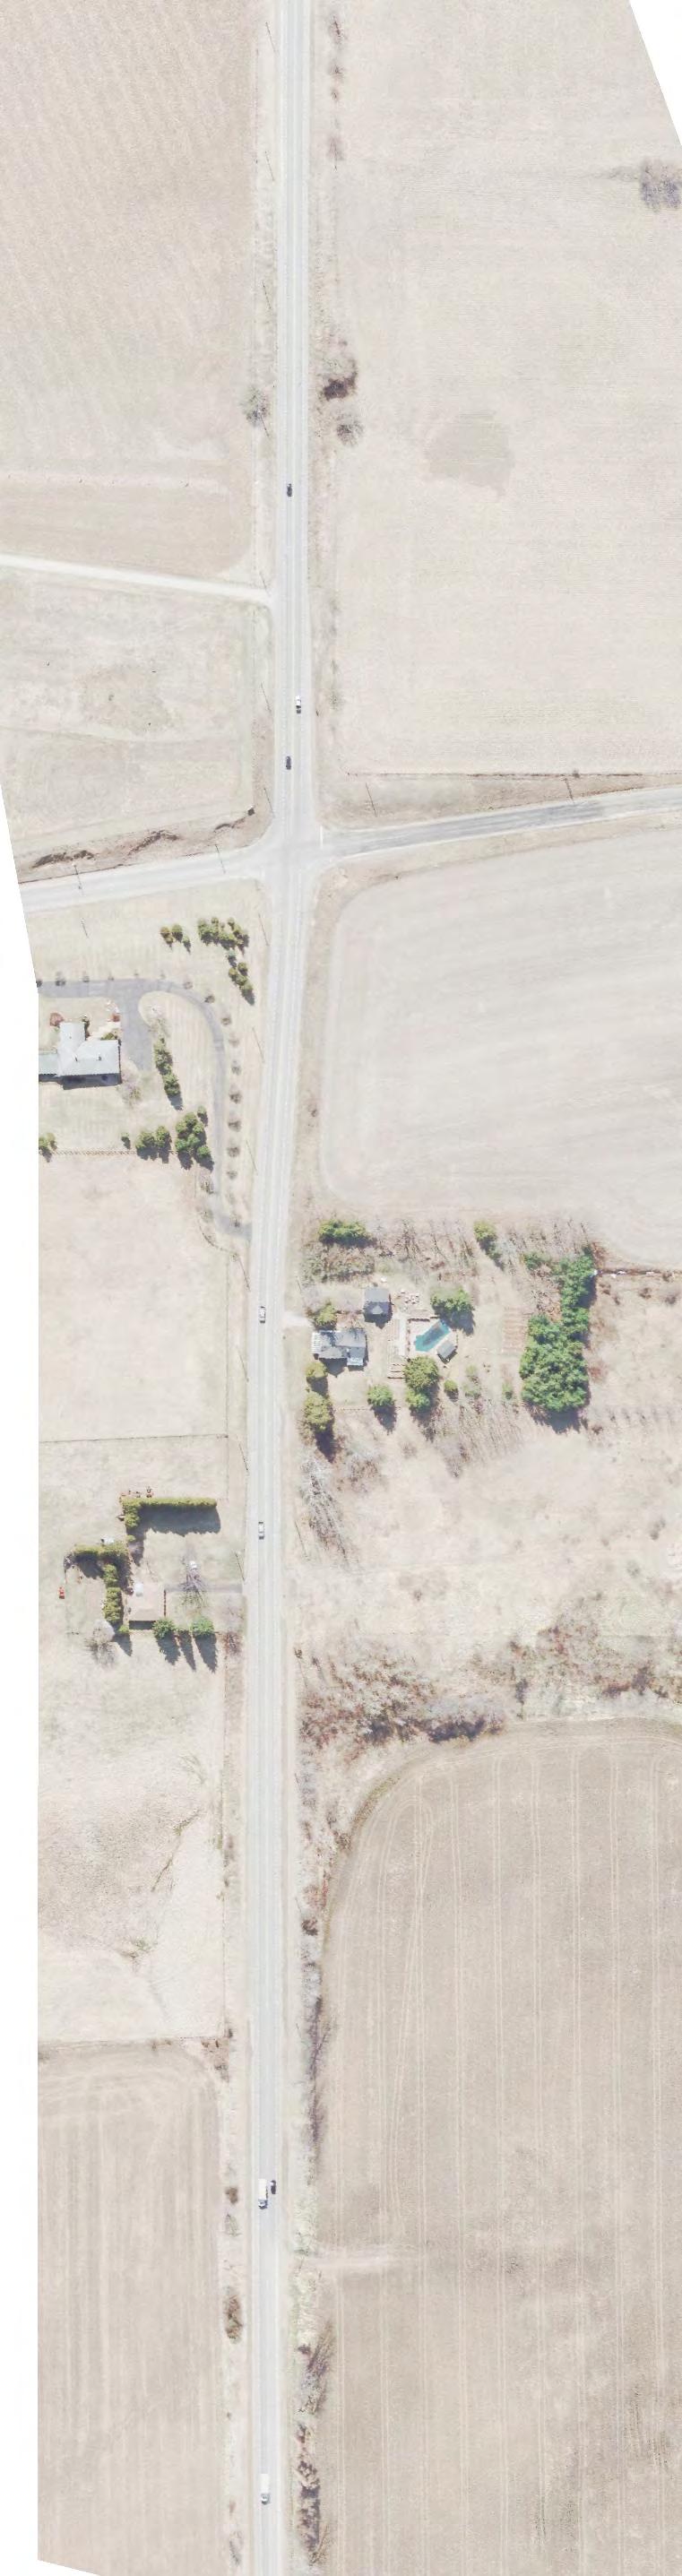

247 N NEW DUNDEE ROAD NEW DUNDEE ROAD STRASBURG ROAD CAMERON ROAD
248 November 28, 2008 REGION OF WATERLOO ROUNDABOUT FEASIBILITY INITIAL SCREENING TOOL VERSION 1.0 The intent of this screening tool is to provide a relatively quick assessment of the feasibility of a modern roundabout at a particular intersection in comparison to other appropriate forms of traffic control or road improvements including auxiliary lanes, traffic control signals, four-way stop, etc. The intended outcome of this tool is to provide enough information to assist staff in deciding whether or not to proceed to an Intersection Control Study to further investigate in more detail the feasibility of a roundabout. 1) Project Name/File No.: 2) Intersection Location (Street/Road Names, distance from major intersection, etc.): 3) Brief Description of Intersection (Number of Legs, Lanes on each leg, total AADT, AADT on each road, etc. Attach or sketch diagram showing existing and horizon-year turning movements.): 4) What operational problems are being experienced at this location? DOCS # Page 1 of 5
249 REGION OF WATERLOO ROUNDABOUT FEASIBILITY INITIAL SCREENING TOOL VERSION 1.0 5) Is it a new intersection or is it a retrofit of an existing intersection? If existing, what is the existing traffic control? 6) Is the intersection in the vicinity of a railroad crossing or another intersection? If so, how close and what type of traffic control exists at the adjacent intersection(s)? Will queues be a problem? 7) Would the intersection be located within a coordinated signal system? 8) Would the intersection be located on a Preferred Corridor? 9) Is the intersection located within a corridor that is scheduled for improvements in the 10 Year Transportation Capital Program? What is the ultimate cross-section of the approach roads? DOCS # Page 2 of 5
250 REGION OF WATERLOO ROUNDABOUT FEASIBILITY INITIAL SCREENING TOOL VERSION ) What is the collision history of the intersection over the past five years? Is there a collision problem that needs to be addressed? 11) Are persons with disabilities or horse and buggies frequent users of this intersection? 12) What traditional road improvements are proposed for this intersection? (eg. traffic signals, all-way stop, auxiliary lanes, etc.) Please attach a sketch of the traditional road improvements. A sample sketch is attached (DOCS #529440). 13) If traffic control signals are being considered, are the traffic signal warrants met for the horizon year? DOCS # Page 3 of 5
251 REGION OF WATERLOO ROUNDABOUT FEASIBILITY INITIAL SCREENING TOOL VERSION ) What size of roundabout is being considered for this intersection? (eg. Single-lane, two-lane entry or three-lane entry?) Please attach a Traffic Flow Worksheet and lane configuration diagram. Please attach a sketch showing how a roundabout would fit into the right-of-way. A sample sketch is attached (DOCS #529433). 15) 20-Year Life Cycle Cost Estimate Injury Collision Cost (ICC): Discount Rate: (i): 20 YEAR LIFE-CYCLE COST COMPARISON Cost Item Other Traffic Control Implementation Cost $ $ Injury Collision Cost (Present Value) $ $ Total Life Cycle Cost X Y Notes: Implementation Cost = sum of costs for construction, property utility relocations, illumination, engineering (20%), contingency (20%) and maintenance (5%); Present Value of 20 Year Injury Collision Cost = expected annual collision frequency x ICC ((1 + i) 20-1) / i(1+i) 20 Monte Carlo Analysis may be required. If so, a range for the implementation cost (i.e. 10%, 50%, 90% probability) is required DOCS # Page 4 of 5
252 REGION OF WATERLOO ROUNDABOUT FEASIBILITY INITIAL SCREENING TOOL VERSION 1.0 Conclusions and Recommendation DOCS # Page 5 of 5
253 Ontario Traffic Manual Book 12 Justification 7B - Projected Volumes Robert Ferrie Drive & Strasburg Road Major Road: No. of lanes: 1 Lane 2 or more lanes 2 Minor Road: No. of lanes: 1 Lane 2 or more lanes 2 Main Northbound Approach Minor Eastbound Approach Main Southbound Approach Minor Westbound Approach Pedestrians Crossing LT TH RT LT TH RT LT TH RT LT TH RT Main Road AM Peak PM Peak Total 0 1, , Justification 1. Minimum Vehicular Volume 2. Delay to cross traffic Description A. Vechicle volume, all approaches (average hour) B. Vehicle volume, along minor streets (average hour) A. Vehicle volume, major street (average hour) B. Combined vehicle and pedestrian volume crossing artery from minor streets Minimum Requirement Minimum Requirement Compliance 1 Lane Highways 2 or more lanes Sectional Free Flow Restr. Flow Free Flow Restr. Flow Numerical % % % % % Entire % 100% 63% RESULTS 1. Minimum Vehicular Volume Justification Compliance A Total Volume 100% B Crossing Volume 100% A Main Road 82% B Crossing Road 44% A Justificaton 1 100% B Justification 2 44% Signal Justified? 2. Delay to Cross Traffic NO 3. Combination NO YES
254
255 REGION OF WATERLOO ROUNDABOUT Project: Strasburg Road Extension Class EA Drawn By: A. Tam TRAFFIC Project No.: Sheet 1 of 2 FLOW SHEET Intersection: Robert Ferrie Drive / Strasburg Road VERSION 1.0 AUG 22, 2008 Time Period: 2031 AM PEAK Strasburg Road 759 TR% N 8 TR% , Blair Creek Drive TR % TR% Strasburg Road Capacity Guidelines RODEL Inputs 1. Single Lane service volumes < 900vph vph Leg PCU 1st Exit 2nd Exit 3rd Exit U-turn 2. Exit flow < 900vph vph for single lane exit Strasburg Road Entry flow + circulating flow < 1400vph use single lane entry vph < Entry + Circ. flow < 2200vph use two-lane entry Strasburg Road Entry flow + circulating flow > 2200vph use three-lane entry Blair Creek Drive
256 REGION OF WATERLOO ROUNDABOUT Project: Strasburg Road Extension Class EA Drawn By: A. Tam TRAFFIC Project No.: Sheet 2 of 2 FLOW SHEET Intersection: Robert Ferrie Drive / Strasburg Road VERSION 1.0 AUG 22, 2008 Time Period: 2031 PM PEAK Strasburg Road 1,297 TR% ,020 N 8 TR% , Blair Creek Drive TR % TR% Strasburg Road Capacity Guidelines RODEL Inputs 1. Single Lane service volumes < 900vph vph Leg PCU 1st Exit 2nd Exit 3rd Exit U-turn 2. Exit flow < 900vph vph for single lane exit Strasburg Road Entry flow + circulating flow < 1400vph use single lane entry vph < Entry + Circ. flow < 2200vph use two-lane entry Strasburg Road Entry flow + circulating flow > 2200vph use three-lane entry Blair Creek Drive
257
258 November 28, 2008 REGION OF WATERLOO ROUNDABOUT FEASIBILITY INITIAL SCREENING TOOL VERSION 1.0 The intent of this screening tool is to provide a relatively quick assessment of the feasibility of a modern roundabout at a particular intersection in comparison to other appropriate forms of traffic control or road improvements including auxiliary lanes, traffic control signals, four-way stop, etc. The intended outcome of this tool is to provide enough information to assist staff in deciding whether or not to proceed to an Intersection Control Study to further investigate in more detail the feasibility of a roundabout. 1) Project Name/File No.: 2) Intersection Location (Street/Road Names, distance from major intersection, etc.): 3) Brief Description of Intersection (Number of Legs, Lanes on each leg, total AADT, AADT on each road, etc. Attach or sketch diagram showing existing and horizon-year turning movements.): 4) What operational problems are being experienced at this location? DOCS # Page 1 of 5
259 REGION OF WATERLOO ROUNDABOUT FEASIBILITY INITIAL SCREENING TOOL VERSION 1.0 5) Is it a new intersection or is it a retrofit of an existing intersection? If existing, what is the existing traffic control? 6) Is the intersection in the vicinity of a railroad crossing or another intersection? If so, how close and what type of traffic control exists at the adjacent intersection(s)? Will queues be a problem? 7) Would the intersection be located within a coordinated signal system? 8) Would the intersection be located on a Preferred Corridor? 9) Is the intersection located within a corridor that is scheduled for improvements in the 10 Year Transportation Capital Program? What is the ultimate cross-section of the approach roads? DOCS # Page 2 of 5
260 REGION OF WATERLOO ROUNDABOUT FEASIBILITY INITIAL SCREENING TOOL VERSION ) What is the collision history of the intersection over the past five years? Is there a collision problem that needs to be addressed? 11) Are persons with disabilities or horse and buggies frequent users of this intersection? 12) What traditional road improvements are proposed for this intersection? (eg. traffic signals, all-way stop, auxiliary lanes, etc.) Please attach a sketch of the traditional road improvements. A sample sketch is attached (DOCS #529440). 13) If traffic control signals are being considered, are the traffic signal warrants met for the horizon year? DOCS # Page 3 of 5
261 REGION OF WATERLOO ROUNDABOUT FEASIBILITY INITIAL SCREENING TOOL VERSION ) What size of roundabout is being considered for this intersection? (eg. Single-lane, two-lane entry or three-lane entry?) Please attach a Traffic Flow Worksheet and lane configuration diagram. Please attach a sketch showing how a roundabout would fit into the right-of-way. A sample sketch is attached (DOCS #529433). 15) 20-Year Life Cycle Cost Estimate Injury Collision Cost (ICC): Discount Rate: (i): 20 YEAR LIFE-CYCLE COST COMPARISON Cost Item Other Traffic Control Implementation Cost $ $ Injury Collision Cost (Present Value) $ $ Total Life Cycle Cost X Y Notes: Implementation Cost = sum of costs for construction, property utility relocations, illumination, engineering (20%), contingency (20%) and maintenance (5%); Present Value of 20 Year Injury Collision Cost = expected annual collision frequency x ICC ((1 + i) 20-1) / i(1+i) 20 Monte Carlo Analysis may be required. If so, a range for the implementation cost (i.e. 10%, 50%, 90% probability) is required DOCS # Page 4 of 5

262 REGION OF WATERLOO ROUNDABOUT FEASIBILITY INITIAL SCREENING TOOL VERSION 1.0 Conclusions and Recommendation DOCS # Page 5 of 5
263 Ontario Traffic Manual Book 12 Justification 7B - Projected Volumes Blair Creek Drive & Strasburg Road Major Road: No. of lanes: 1 Lane 2 or more lanes 2 Minor Road: No. of lanes: 1 Lane 2 or more lanes 2 Main Northbound Approach Minor Eastbound Approach Main Southbound Approach Minor Westbound Approach Pedestrians Crossing LT TH RT LT TH RT LT TH RT LT TH RT Main Road AM Peak PM Peak Total 0 1, , Justification 1. Minimum Vehicular Volume 2. Delay to cross traffic Description A. Vechicle volume, all approaches (average hour) B. Vehicle volume, along minor streets (average hour) A. Vehicle volume, major street (average hour) B. Combined vehicle and pedestrian volume crossing artery from minor streets Minimum Requirement Minimum Requirement Compliance 1 Lane Highways 2 or more lanes Sectional Free Flow Restr. Flow Free Flow Restr. Flow Numerical % % % % % Entire % 100% 54% RESULTS 1. Minimum Vehicular Volume Justification Compliance A Total Volume 100% B Crossing Volume 100% A Main Road 86% B Crossing Road 23% A Justificaton 1 100% B Justification 2 23% Signal Justified? 2. Delay to Cross Traffic NO 3. Combination NO YES
264
265 REGION OF WATERLOO ROUNDABOUT Project: Strasburg Road Extension Class EA Drawn By: A. Tam TRAFFIC Project No.: Sheet 1 of 2 FLOW SHEET Intersection: Blair Creek Drive / Strasburg Road VERSION 1.0 AUG 22, 2008 Time Period: 2031 AM PEAK Strasburg Road 893 TR% N 8 TR% , Blair Creek Drive TR % TR% Strasburg Road Capacity Guidelines RODEL Inputs 1. Single Lane service volumes < 900vph vph Leg PCU 1st Exit 2nd Exit 3rd Exit U-turn 2. Exit flow < 900vph vph for single lane exit Strasburg Road Entry flow + circulating flow < 1400vph use single lane entry vph < Entry + Circ. flow < 2200vph use two-lane entry Strasburg Road Entry flow + circulating flow > 2200vph use three-lane entry Blair Creek Drive


266 REGION OF WATERLOO ROUNDABOUT Project: Strasburg Road Extension Class EA Drawn By: A. Tam TRAFFIC Project No.: Sheet 2 of 2 FLOW SHEET Intersection: Blair Creek Drive / Strasburg Road VERSION 1.0 AUG 22, 2008 Time Period: 2031 PM PEAK Strasburg Road 1,159 TR% ,119 N 8 TR% , Blair Creek Drive TR % TR% Strasburg Road Capacity Guidelines RODEL Inputs 1. Single Lane service volumes < 900vph vph Leg PCU 1st Exit 2nd Exit 3rd Exit U-turn 2. Exit flow < 900vph vph for single lane exit Strasburg Road Entry flow + circulating flow < 1400vph use single lane entry vph < Entry + Circ. flow < 2200vph use two-lane entry Strasburg Road Entry flow + circulating flow > 2200vph use three-lane entry Blair Creek Drive
267
268 May 23, 2012 REGION OF WATERLOO ROUNDABOUT FEASIBILITY INITIAL SCREENING TOOL VERSION 1.0 The intent of this screening tool is to provide a relatively quick assessment of the feasibility of a modern roundabout at a particular intersection in comparison to other appropriate forms of traffic control or road improvements including auxiliary lanes, traffic control signals, four-way stop, etc. The intended outcome of this tool is to provide enough information to assist staff in deciding whether or not to proceed to an Intersection Control Study to further investigate in more detail the feasibility of a roundabout. 1) Project Name/File No.: 2) Intersection Location (Street/Road Names, distance from major intersection, etc.): 3) Brief Description of Intersection (Number of Legs, Lanes on each leg, total AADT, AADT on each road, etc. Attach or sketch diagram showing existing and horizon-year turning movements.): 4) What operational problems are being experienced at this location? Document Number: Version: 6 Document Name: SVDK 2006 ROUNDABOUT FEASIBILITY INITIAL SCREENING TOOL
269 REGION OF WATERLOO ROUNDABOUT FEASIBILITY INITIAL SCREENING TOOL VERSION 1.0 5) Is it a new intersection or is it a retrofit of an existing intersection? If existing, what is the existing traffic control? 6) Is the intersection in the vicinity of a railroad crossing or another intersection? If so, how close and what type of traffic control exists at the adjacent intersection(s)? Will queues be a problem? 7) Would the intersection be located within a coordinated signal system? 8) Would the intersection be located on a Preferred Corridor? 9) Is the intersection located within a corridor that is scheduled for improvements in the 10 Year Transportation Capital Program? What is the ultimate cross-section of the approach roads? Document Number: Version: 6 Document Name: SVDK 2006 ROUNDABOUT FEASIBILITY INITIAL SCREENING TOOL
270 REGION OF WATERLOO ROUNDABOUT FEASIBILITY INITIAL SCREENING TOOL VERSION ) What is the collision history of the intersection over the past five years? Is there a collision problem that needs to be addressed? 11) Are persons with disabilities or horse and buggies frequent users of this intersection? 12) What traditional road improvements are proposed for this intersection? (eg. traffic signals, all-way stop, auxiliary lanes, etc.) Please attach a sketch of the traditional road improvements. A sample sketch is attached (DOCS #529440). 13) If traffic control signals are being considered, are the traffic signal warrants met for the horizon year? Document Number: Version: 6 Document Name: SVDK 2006 ROUNDABOUT FEASIBILITY INITIAL SCREENING TOOL
271 REGION OF WATERLOO ROUNDABOUT FEASIBILITY INITIAL SCREENING TOOL VERSION ) What size of roundabout is being considered for this intersection? (eg. Single-lane, two-lane entry or three-lane entry?) Please attach a Traffic Flow Worksheet and lane configuration diagram. Please attach a sketch showing how a roundabout would fit into the right-of-way. A sample sketch is attached (DOCS #529433). 15) 20-Year Life Cycle Cost Estimate 10-Year AADT: Injury Collision Cost (ICC): Discount Rate: (i): 20 YEAR LIFE-CYCLE COST COMPARISON Cost Item Other Traffic Control Implementation Cost $ $ Injury Collision Cost (Present Value) $ $ Total Life Cycle Cost X Y Notes: Implementation Cost = sum of costs for construction, property utility relocations, illumination, engineering (20%), contingency (20%) and maintenance (5%); Present Value of 20 Year Injury Collision Cost = expected annual collision frequency x ICC ((1 + i) 20-1) / i(1+i) 20 Document Number: Version: 6 Document Name: SVDK 2006 ROUNDABOUT FEASIBILITY INITIAL SCREENING TOOL
272 Monte Carlo Analysis may be required. If so, a range for the implementation cost (i.e. 10%, 50%, 90% probability) is required REGION OF WATERLOO ROUNDABOUT FEASIBILITY INITIAL SCREENING TOOL VERSION 1.0 Conclusions and Recommendation Document Number: Version: 6 Document Name: SVDK 2006 ROUNDABOUT FEASIBILITY INITIAL SCREENING TOOL
273 Ontario Traffic Manual Book 12 Justification 7B - Projected Volumes New Dundee Road & Strasburg Road Major Road: No. of lanes: Justification Adjustment Factors 2 each direction "T" intersection factor: 1.5 Minor Road: No. of lanes: 2 each direction AHV factor: 1.5 Time Minor Northbound Approach Major Eastbound Approach Minor Southbound Approach Major Westbound Approach Pedestrians Crossing LT TH RT LT TH RT LT TH RT LT TH RT Major Road AM Peak hour PM Peak hour Total , , ,182 1,520 0 Justification 1. Minimum Vehicular Volume 2. Delay to cross traffic Description A. Vehicle volume, all approaches (average hour) B. Vehicle volume, along minor streets (average hour) A. Vehicle volume, major street (average hour) B. Combined vehicle and pedestrian volume crossing artery from minor streets Adjusted Justification 7 Values Minimum Requirement Minimum Requirement Compliance 1 Lane Highways 2 or more lanes Sectional Free Flow Restr. Flow Free Flow Restr. Flow Numerical % % % % % (Per OTM Book 12 March 2012: note that for "T" intersections, the values for 1B are increased by 50%) (Per OTM Book 12 March 2012: note that for using AHV estimates, Justification 7 values are increased by 50% for a future roadway) Entire % 100% 91% 1. Minimum Vehicular Volume Justification RESULTS Compliance A Total Volume 100% B Crossing Volume 100% A Main Road 91% B Crossing Road 100% A Justification 1 100% B Justification 2 91% Signal Justified? 2. Delay to Cross Traffic NO 3. Combination YES YES
274
275 REGION OF WATERLOO ROUNDABOUT Project: PROJECT NAME Drawn By: C. Tse TRAFFIC Project No.: Sheet 1 of 2 FLOW SHEET Intersection: New Dundee / Strasburg Road VERSION 1.0 AUG 22, 2008 Time Period: 2031 AM PEAK E + C = 1289 Strasburg Road 927 TR% N TR% New Dundee Road E + C = New Dundee Road E + C = 919 TR % 0 0 E + C = 1600 TR% Capacity Guidelines RODEL Inputs 1. Single Lane service volumes < 900vph vph Leg PCU 1st Exit 2nd Exit 3rd Exit U-turn 2. Exit flow < 900vph vph for single lane exit Strasburg Road Entry flow + circulating flow < 1400vph use single lane entry New Dundee Road vph < Entry + Circ. flow < 2200vph use two-lane entry Entry flow + circulating flow > 2200vph use three-lane entry New Dundee Road DOCS # ROUNDABOUT TRAFFIC FLOW WORKSHEET
276 REGION OF WATERLOO ROUNDABOUT Project: PROJECT NAME Drawn By: C. Tse TRAFFIC Project No.: Sheet 2 of 2 FLOW SHEET Intersection: New Dundee / Strasburg Road VERSION 1.0 AUG 22, 2008 Time Period: 2031 PM PEAK E + C = 1750 Strasburg Road 930 TR% N TR% New Dundee Road E + C = New Dundee Road E + C = 1810 TR % 0 0 E + C = 1401 TR% Capacity Guidelines RODEL Inputs 1. Single Lane service volumes < 900vph vph Leg PCU 1st Exit 2nd Exit 3rd Exit U-turn 2. Exit flow < 900vph vph for single lane exit Strasburg Road Entry flow + circulating flow < 1400vph use single lane entry New Dundee Road vph < Entry + Circ. flow < 2200vph use two-lane entry Entry flow + circulating flow > 2200vph use three-lane entry New Dundee Road DOCS # ROUNDABOUT TRAFFIC FLOW WORKSHEET
277 Detailed Output about:blank Page 1 of /06/07 DETAILED OUTPUT New Dundee Road and Strasburg Road New Dundee Road -N-Strasburg Road - Weekday AM 2031 OUTPUT TABLE LINKS s Basic Parameters Gap Acceptance Parameters Movements Movement Capacity Parameters Movement Performance Fuel Consumption, Emissions and Cost (Total) Fuel Consumption, Emissions and Cost (Rate) Intersection Negotiation Data Movement Speeds and Geometric Delay Lanes Lane Performance Lane Flow and Capacity Information Lane, Approach and Intersection Performance Driver Characteristics Lane Delays Lane Queues (Vehicles) Lane Queues (Distance) Lane Queue Percentiles (Vehicles) Lane Queue Percentiles (Distance) Lane Stops Flow Rates and Demand Analysis Movement Definitions and Flow Rates (O-D) Flow Rates (Separate Light and Heavy Vehicles) Flow Rates (Total Vehicles and Percent Heavy) Other Model Settings Parameters Used in Cost Calculations Diagnostics s Basic Parameters Site:New Dundee Road -N-Strasburg Road - Weekday AM Circulating/Exiting Stream Cent Circ Insc Ent Ent Cir Ent Av.Ent Island Width Diam. Rad Ang Lan Lan Lane Flow %HV Adjust. %Exit Cap. O-D Diam Width Flow Incl. Constr. Factor m m m m deg m veh/h pcu/h Effect Environment Factor: 1.20 Entry/Circulating Flow Adjustment: Medium N Environment Factor: 1.20 Entry/Circulating Flow Adjustment: Medium N Environment Factor: 1.20 Entry/Circulating Flow Adjustment: Medium N HV Method for Gap Acceptance: Include HV Effect for all percentages
278 Detailed Output about:blank Page 2 of /06/07 Capacity Model: SIDRA Standard Gap Acceptance Parameters Site:New Dundee Road -N-Strasburg Road - Weekday AM Turn Lane Lane ---- Circulating/Exiting Stream --- Critical Gap No. Type Flow Aver Aver In-Bnch Prop Foll-up Rate Speed Dist Headway Bunched Hdwy Dist Headway pcu/h km/h m sec sec m sec Environment Factor: 1.20 Entry/Circulating Flow Adjustment: Medium Thru 1 Subdominant Right 2 Dominant Environment Factor: 1.20 Entry/Circulating Flow Adjustment: Medium Left 1 Subdominant Dominant Right 2 Dominant Environment Factor: 1.20 Entry/Circulating Flow Adjustment: Medium Left 1 Subdominant Thru 1 Subdominant Dominant Capacity Model: SIDRA Standard Priority sharing is implied for some movements (Follow-up Headway plus Intra-bunch Headway is larger than the Critical Gap). The O-D Factor ( Basic Parameters table) allows for priority sharing and priority emphasis. Dist (Distance): Spacing, i.e. distance between the front ends of two successive vehicles across all lanes in the circulating or exiting stream Movements Movement Capacity Parameters Site:New Dundee Road -N-Strasburg Road - Weekday AM Mov Opposing Movement Total Prac. Prac. Lane Deg. ID Demand Adjust. Cap. Deg. Spare Util Satn Flow HV Flow HV Flow Satn Cap. veh/h % veh/h % pcu/h veh/h xp % % x T T R R L L R R L L * 2T T * * Maximum degree of saturation Movement Performance Site:New Dundee Road -N-Strasburg Road - Weekday AM 2031
279 Detailed Output about:blank Page 3 of /06/ Mov Total Total Aver. Eff. Total Perf. Tot.Trav. Tot.Trav. Aver. ID Delay Delay Delay Stop Stops Index Distance Time Speed (veh-h/h)(pers-h/h)(sec) Rate (veh-km/h)(veh-h/h) (km/h) T T R R L L R R L L T T Fuel Consumption, Emissions and Cost (Total) Site:New Dundee Road -N-Strasburg Road - Weekday AM 2031 Mov Cost Fuel CO2 CO HC NOX ID Total Total Total Total Total Total $/h L/h kg/h kg/h kg/h kg/h 6T T R R L L R R L L T T INTERSECTION: Fuel Consumption, Emissions and Cost (Rate) Site:New Dundee Road -N-Strasburg Road - Weekday AM 2031 Mov Cost Fuel CO2 CO HC NOX ID Rate Rate Rate Rate Rate Rate $/km L/100km g/km g/km g/km g/km 6T T R R L L R R
280 Detailed Output about:blank Page 4 of /06/ L L T T INTERSECTION: Intersection Negotiation Data Site:New Dundee Road -N-Strasburg Road - Weekday AM Negn Negn Negn Appr. Downstream Distance From To Radius Speed Dist. Dist Approach Approach Turn m km/h m m m User Spec? North Right No West Thru No East Left No West Right No East Thru No North Left No Maximum Negotiation (Design) Speed = 50.0 km/h Downstream distance is distance travelled from the stopline until exit cruise speed is reached (includes negotiation distance). Acceleration distance is weighted for light and heavy vehicles. The same distance applies for both stopped and unstopped vehicles. Movement Speeds and Geometric Delay Site:New Dundee Road -N-Strasburg Road - Weekday AM Queue Move-up App. Speeds Exit Speeds Av. Section Spd Geom Mov st 2nd Delay ID Cruise Negn Negn Cruise Grn Grn Running Overall sec T T R R L L R R L L T T "Running Speed" is the average speed excluding stopped periods. HCM Delay Formula option used: Geometric Delay is not included in Control Delay. Lanes
281 Detailed Output about:blank Page 5 of /06/07 Lane Performance Site:New Dundee Road -N-Strasburg Road - Weekday AM 2031 Q u e u e Flow Cap Deg. Aver. Eff. 95% Back Lane Lane Satn Delay Stop Length No. veh/h veh/h x sec Rate veh m m 1 T R L LR LT T Lane Flow and Capacity Information Site:New Dundee Road -N-Strasburg Road - Weekday AM Lane Dem Flow (veh/h) Min Tot Deg. Lane No Cap Cap Satn Util Lef Thru Rig Tot veh/h veh/h x % T P 2 R L LR LT T P Lane under-utilisation found by the "Program". This includes cases where the value of lane under-utilisation due to downstream effects has been modified by the program during lane flow calculations (e.g. a de facto exclusive lane has been found). The capacity value for priority and continuous movements is obtained by adjusting the basic saturation flow for heavy vehicle and turning vehicle effects. Saturation flow scale applies if specified. Lane, Approach and Intersection Performance Site:New Dundee Road -N-Strasburg Road - Weekday AM Lane Demand Flow (veh/h) Adj. Eff Grn Deg Aver. Longest Shrt No %HV Basic (sec) Sat Delay Queue Lane L T R Tot Satf. 1st 2nd x sec m m T R
282 Detailed Output about:blank Page 6 of /06/ L LR LT T ========================================================================== ALL VEHICLES Total % Max Aver. Max Flow HV X Delay Queue ========================================================================== Peak flow period = 15 minutes. Queue values in this table are 95% queue (metres) Note: Basic Saturation Flows are not adjusted at roundabouts or signcontrolled intersections and apply only to continuous lanes. Driver Characteristics Site:New Dundee Road -N-Strasburg Road - Weekday AM Average Driver Lane Satn Satn Satn Satn Queue Response No. Speed Flow Hdwy Spacing Space Time km/h veh/h sec m m sec T R L LR LT T Saturation Flow and Saturation Headway are derived from follow-up headway. Lane Delays Site:New Dundee Road -N-Strasburg Road - Weekday AM Delay (seconds/veh) Deg. Stop-line Delay Acc. Queuing Stopd Lane Satn 1st 2nd Total Dec. Total MvUp (Idle) Geom Control No. x d1 d2 dsl dn dq dqm di dig dic T R L LR LT T HCM Delay Formula option used:
283 Detailed Output about:blank Page 7 of /06/07 (i) Control Delay does not include Geometric Delay, (ii) Stop-line Delay is treated as being same as Control Delay. dsl: Stop-line delay (=d1+d2) dn: Average stop-start delay for all vehicles queued and unqueued dq: Queuing delay (the part of the stop-line delay that includes stopped delay and queue move-up delay) dqm: Queue move-up delay di: Stopped delay (stopped (idling) time at near-zero speed) dig: Geometric delay dic: Intersection control delay (sum of stop-line and geometric delays) Lane Queues (Vehicles) Site:New Dundee Road -N-Strasburg Road - Weekday AM Deg. Ovrfl. Back of Queue (veh) Queue Prob. P'ile Cyc-Av. Queue Lane Satn Queue Stor. Block Block No. x No Nb1 Nb2 Nb 95% Ratio % % Nc 95% T R L LR LT T HCM Delay Formula option used: Cycle-Average Queue is calculated using average delay from the HCM equation. (i.e. HCM delays are treated as stop-line delays for this purpose). SIDRA Standard models are used for Back of Queue estimation since HCM only gives Cycle-Average Queues for unsignalised intersections. Lane Queues (Distance) Site:New Dundee Road -N-Strasburg Road - Weekday AM Deg. Ovrfl. Back of Queue (m) Queue Prob. P'ile Cyc-Av. Queue Lane Satn Queue Stor. Block Block No. x No Nb1 Nb2 Nb 95% Ratio % % Nc 95% T R L LR LT T HCM Delay Formula option used: Cycle-Average Queue is calculated using average delay from the HCM equation. (i.e. HCM delays are treated as stop-line delays for this purpose). SIDRA Standard models are used for Back of Queue estimation since HCM only gives Cycle-Average Queues for unsignalised intersections. Lane Queue Percentiles (Vehicles)
284 Detailed Output about:blank Page 8 of /06/07 Site:New Dundee Road -N-Strasburg Road - Weekday AM Deg. Percentile Back of Queue (veh) Lane Satn No. x 50% 70% 85% 90% 95% 98% T R L LR LT T SIDRA Standard models are used for Back of Queue estimation since HCM only gives Cycle-Average Queues for unsignalised intersections. Lane Queue Percentiles (Distance) Site:New Dundee Road -N-Strasburg Road - Weekday AM Deg. Percentile Back of Queue (metres) Lane Satn No. x 50% 70% 85% 90% 95% 98% T R L LR LT T SIDRA Standard models are used for Back of Queue estimation since HCM only gives Cycle-Average Queues for unsignalised intersections. Lane Stops Site:New Dundee Road -N-Strasburg Road - Weekday AM Queue Total Deg. -- Effective Stop Rate -- Total Move-up Queue Prop. Lane Satn Geom. Overall Stops Rate Move-ups Queued No. x he1 he2 hig h H hqm Hqm pq T R L LR
285 Detailed Output about:blank Page 9 of /06/07 1 LT T hig is the average value for all movements in a shared lane hqm is average queue move-up rate for all vehicles queued and unqueued Flow Rates and Demand Analysis Movement Definitions and Flow Rates (O-D) Site:New Dundee Road -N-Strasburg Road - Weekday AM From To Mov Flow Rate Flow Scale Peak Flow Approach Approach ID Turn LV HV Fixed Var Factor North 6R Right West 6T Thru East 7L Left West 4R Right East 2T Thru North 5L Left Unit Time for Volumes = 60 minutes Peak Flow Period = 15 minutes Flow Rates include effects of Flow Scale and Peak Flow Factor Flow Rates (Separate Light and Heavy Vehicles) Site:New Dundee Road -N-Strasburg Road - Weekday AM 2031 Mov Left Through Right ID LV HV LV HV LV HV Demand flows in veh/h as used by the program 6T T R R L L R R L L T T Unit Time for Volumes = 60 minutes Peak Flow Period = 15 minutes Flow Rates include effects of Flow Scale and Peak Flow Factor Flow Rates (Total Vehicles and Percent Heavy) Site:New Dundee Road -N-Strasburg Road - Weekday AM 2031
286 Detailed Output about:blank Page 10 of /06/ Mov Left Through Right ID Total %HV Total %HV Total %HV --- Demand flows in veh/h as used by the program 6T T R R L L R R L L T T Unit Time for Volumes = 60 minutes Peak Flow Period = 15 minutes Flow Rates include effects of Flow Scale and Peak Flow Factor Other Model Settings Site:New Dundee Road -N-Strasburg Road - Weekday AM 2031 * Basic Parameters: Intersection Type: Driving on the right-hand side of the road Input data specified in Metric units Model Defaults: US HCM (Metric) Peak Flow Period (for performance): 15 minutes Unit time (for volumes): 60 minutes. HCM Delay Model option used HCM Queue Model option used Level of Service based on: Delay (HCM 2000) Queue percentile: 95% Parameters Used in Cost Calculations Site:New Dundee Road -N-Strasburg Road - Weekday AM 2031 Pump price of fuel ($/L) = Fuel resource cost factor = 0.70 Ratio of running cost to fuel cost = 3.0 Average income ($/h) = Time value factor = 0.40 Light vehicle mass (1000 kg) = 1.4 Heavy vehicle mass (1000 kg) = 11.0 Light vehicle idle fuel rate (L/h) = Heavy vehicle idle fuel rate (L/h) = Diagnostics Site:New Dundee Road -N-Strasburg Road - Weekday AM 2031 Processed: June 7, :22:39 AM SIDRA INTERSECTION Copyright Akcelik and Associates Pty Ltd Project: C:\Users\knigc2\Desktop\Strasburg\SIDRA Files\W1\New Dundee Road and Strasburg
287 Detailed Output about:blank Page 11 of /06/07 Road_2031_W1.sip , SNC-LAVALIN INC, SINGLE
288 Detailed Output about:blank Page 1 of /06/07 DETAILED OUTPUT New Dundee Road and Strasburg Road New Dundee Road -N-Strasburg Road - Weekday PM 2031 OUTPUT TABLE LINKS s Basic Parameters Gap Acceptance Parameters Movements Movement Capacity Parameters Movement Performance Fuel Consumption, Emissions and Cost (Total) Fuel Consumption, Emissions and Cost (Rate) Intersection Negotiation Data Movement Speeds and Geometric Delay Lanes Lane Performance Lane Flow and Capacity Information Lane, Approach and Intersection Performance Driver Characteristics Lane Delays Lane Queues (Vehicles) Lane Queues (Distance) Lane Queue Percentiles (Vehicles) Lane Queue Percentiles (Distance) Lane Stops Flow Rates and Demand Analysis Movement Definitions and Flow Rates (O-D) Flow Rates (Separate Light and Heavy Vehicles) Flow Rates (Total Vehicles and Percent Heavy) Other Model Settings Parameters Used in Cost Calculations Diagnostics s Basic Parameters Site:New Dundee Road -N-Strasburg Road - Weekday PM Circulating/Exiting Stream Cent Circ Insc Ent Ent Cir Ent Av.Ent Island Width Diam. Rad Ang Lan Lan Lane Flow %HV Adjust. %Exit Cap. O-D Diam Width Flow Incl. Constr. Factor m m m m deg m veh/h pcu/h Effect Environment Factor: 1.20 Entry/Circulating Flow Adjustment: Medium N Environment Factor: 1.20 Entry/Circulating Flow Adjustment: Medium N Environment Factor: 1.20 Entry/Circulating Flow Adjustment: Medium N HV Method for Gap Acceptance: Include HV Effect for all percentages
289 Detailed Output about:blank Page 2 of /06/07 Capacity Model: SIDRA Standard Gap Acceptance Parameters Site:New Dundee Road -N-Strasburg Road - Weekday PM Turn Lane Lane ---- Circulating/Exiting Stream --- Critical Gap No. Type Flow Aver Aver In-Bnch Prop Foll-up Rate Speed Dist Headway Bunched Hdwy Dist Headway pcu/h km/h m sec sec m sec Environment Factor: 1.20 Entry/Circulating Flow Adjustment: Medium Thru 1 Subdominant Right 2 Dominant Environment Factor: 1.20 Entry/Circulating Flow Adjustment: Medium Left 1 Subdominant Dominant Right 2 Dominant Environment Factor: 1.20 Entry/Circulating Flow Adjustment: Medium Left 1 Subdominant Thru 1 Subdominant Dominant Capacity Model: SIDRA Standard Priority sharing is implied for some movements (Follow-up Headway plus Intra-bunch Headway is larger than the Critical Gap). The O-D Factor ( Basic Parameters table) allows for priority sharing and priority emphasis. Dist (Distance): Spacing, i.e. distance between the front ends of two successive vehicles across all lanes in the circulating or exiting stream Movements Movement Capacity Parameters Site:New Dundee Road -N-Strasburg Road - Weekday PM Mov Opposing Movement Total Prac. Prac. Lane Deg. ID Demand Adjust. Cap. Deg. Spare Util Satn Flow HV Flow HV Flow Satn Cap. veh/h % veh/h % pcu/h veh/h xp % % x T T R R L L * 4R R * L L T T * Maximum degree of saturation Movement Performance Site:New Dundee Road -N-Strasburg Road - Weekday PM 2031
290 Detailed Output about:blank Page 3 of /06/ Mov Total Total Aver. Eff. Total Perf. Tot.Trav. Tot.Trav. Aver. ID Delay Delay Delay Stop Stops Index Distance Time Speed (veh-h/h)(pers-h/h)(sec) Rate (veh-km/h)(veh-h/h) (km/h) T T R R L L R R L L T T Fuel Consumption, Emissions and Cost (Total) Site:New Dundee Road -N-Strasburg Road - Weekday PM 2031 Mov Cost Fuel CO2 CO HC NOX ID Total Total Total Total Total Total $/h L/h kg/h kg/h kg/h kg/h 6T T R R L L R R L L T T INTERSECTION: Fuel Consumption, Emissions and Cost (Rate) Site:New Dundee Road -N-Strasburg Road - Weekday PM 2031 Mov Cost Fuel CO2 CO HC NOX ID Rate Rate Rate Rate Rate Rate $/km L/100km g/km g/km g/km g/km 6T T R R L L R R
291 Detailed Output about:blank Page 4 of /06/ L L T T INTERSECTION: Intersection Negotiation Data Site:New Dundee Road -N-Strasburg Road - Weekday PM Negn Negn Negn Appr. Downstream Distance From To Radius Speed Dist. Dist Approach Approach Turn m km/h m m m User Spec? North Right No West Thru No East Left No West Right No East Thru No North Left No Maximum Negotiation (Design) Speed = 50.0 km/h Downstream distance is distance travelled from the stopline until exit cruise speed is reached (includes negotiation distance). Acceleration distance is weighted for light and heavy vehicles. The same distance applies for both stopped and unstopped vehicles. Movement Speeds and Geometric Delay Site:New Dundee Road -N-Strasburg Road - Weekday PM Queue Move-up App. Speeds Exit Speeds Av. Section Spd Geom Mov st 2nd Delay ID Cruise Negn Negn Cruise Grn Grn Running Overall sec T T R R L L R R L L T T "Running Speed" is the average speed excluding stopped periods. HCM Delay Formula option used: Geometric Delay is not included in Control Delay. Lanes
292 Detailed Output about:blank Page 5 of /06/07 Lane Performance Site:New Dundee Road -N-Strasburg Road - Weekday PM 2031 Q u e u e Flow Cap Deg. Aver. Eff. 95% Back Lane Lane Satn Delay Stop Length No. veh/h veh/h x sec Rate veh m m 1 T R L LR LT T Lane Flow and Capacity Information Site:New Dundee Road -N-Strasburg Road - Weekday PM Lane Dem Flow (veh/h) Min Tot Deg. Lane No Cap Cap Satn Util Lef Thru Rig Tot veh/h veh/h x % T P 2 R L LR LT T P Lane under-utilisation found by the "Program". This includes cases where the value of lane under-utilisation due to downstream effects has been modified by the program during lane flow calculations (e.g. a de facto exclusive lane has been found). The capacity value for priority and continuous movements is obtained by adjusting the basic saturation flow for heavy vehicle and turning vehicle effects. Saturation flow scale applies if specified. Lane, Approach and Intersection Performance Site:New Dundee Road -N-Strasburg Road - Weekday PM Lane Demand Flow (veh/h) Adj. Eff Grn Deg Aver. Longest Shrt No %HV Basic (sec) Sat Delay Queue Lane L T R Tot Satf. 1st 2nd x sec m m T R
293 Detailed Output about:blank Page 6 of /06/ L LR LT T ========================================================================== ALL VEHICLES Total % Max Aver. Max Flow HV X Delay Queue ========================================================================== Peak flow period = 15 minutes. Queue values in this table are 95% queue (metres) Note: Basic Saturation Flows are not adjusted at roundabouts or signcontrolled intersections and apply only to continuous lanes. Driver Characteristics Site:New Dundee Road -N-Strasburg Road - Weekday PM Average Driver Lane Satn Satn Satn Satn Queue Response No. Speed Flow Hdwy Spacing Space Time km/h veh/h sec m m sec T R L LR LT T Saturation Flow and Saturation Headway are derived from follow-up headway. Lane Delays Site:New Dundee Road -N-Strasburg Road - Weekday PM Delay (seconds/veh) Deg. Stop-line Delay Acc. Queuing Stopd Lane Satn 1st 2nd Total Dec. Total MvUp (Idle) Geom Control No. x d1 d2 dsl dn dq dqm di dig dic T R L LR LT T HCM Delay Formula option used:
294 Detailed Output about:blank Page 7 of /06/07 (i) Control Delay does not include Geometric Delay, (ii) Stop-line Delay is treated as being same as Control Delay. dsl: Stop-line delay (=d1+d2) dn: Average stop-start delay for all vehicles queued and unqueued dq: Queuing delay (the part of the stop-line delay that includes stopped delay and queue move-up delay) dqm: Queue move-up delay di: Stopped delay (stopped (idling) time at near-zero speed) dig: Geometric delay dic: Intersection control delay (sum of stop-line and geometric delays) Lane Queues (Vehicles) Site:New Dundee Road -N-Strasburg Road - Weekday PM Deg. Ovrfl. Back of Queue (veh) Queue Prob. P'ile Cyc-Av. Queue Lane Satn Queue Stor. Block Block No. x No Nb1 Nb2 Nb 95% Ratio % % Nc 95% T R L LR LT T HCM Delay Formula option used: Cycle-Average Queue is calculated using average delay from the HCM equation. (i.e. HCM delays are treated as stop-line delays for this purpose). SIDRA Standard models are used for Back of Queue estimation since HCM only gives Cycle-Average Queues for unsignalised intersections. Lane Queues (Distance) Site:New Dundee Road -N-Strasburg Road - Weekday PM Deg. Ovrfl. Back of Queue (m) Queue Prob. P'ile Cyc-Av. Queue Lane Satn Queue Stor. Block Block No. x No Nb1 Nb2 Nb 95% Ratio % % Nc 95% T R L LR LT T HCM Delay Formula option used: Cycle-Average Queue is calculated using average delay from the HCM equation. (i.e. HCM delays are treated as stop-line delays for this purpose). SIDRA Standard models are used for Back of Queue estimation since HCM only gives Cycle-Average Queues for unsignalised intersections. Lane Queue Percentiles (Vehicles)
295 Detailed Output about:blank Page 8 of /06/07 Site:New Dundee Road -N-Strasburg Road - Weekday PM Deg. Percentile Back of Queue (veh) Lane Satn No. x 50% 70% 85% 90% 95% 98% T R L LR LT T SIDRA Standard models are used for Back of Queue estimation since HCM only gives Cycle-Average Queues for unsignalised intersections. Lane Queue Percentiles (Distance) Site:New Dundee Road -N-Strasburg Road - Weekday PM Deg. Percentile Back of Queue (metres) Lane Satn No. x 50% 70% 85% 90% 95% 98% T R L LR LT T SIDRA Standard models are used for Back of Queue estimation since HCM only gives Cycle-Average Queues for unsignalised intersections. Lane Stops Site:New Dundee Road -N-Strasburg Road - Weekday PM Queue Total Deg. -- Effective Stop Rate -- Total Move-up Queue Prop. Lane Satn Geom. Overall Stops Rate Move-ups Queued No. x he1 he2 hig h H hqm Hqm pq T R L LR
296 Detailed Output about:blank Page 9 of /06/07 1 LT T hig is the average value for all movements in a shared lane hqm is average queue move-up rate for all vehicles queued and unqueued Flow Rates and Demand Analysis Movement Definitions and Flow Rates (O-D) Site:New Dundee Road -N-Strasburg Road - Weekday PM From To Mov Flow Rate Flow Scale Peak Flow Approach Approach ID Turn LV HV Fixed Var Factor North 6R Right West 6T Thru East 7L Left West 4R Right East 2T Thru North 5L Left Unit Time for Volumes = 60 minutes Peak Flow Period = 15 minutes Flow Rates include effects of Flow Scale and Peak Flow Factor Flow Rates (Separate Light and Heavy Vehicles) Site:New Dundee Road -N-Strasburg Road - Weekday PM 2031 Mov Left Through Right ID LV HV LV HV LV HV Demand flows in veh/h as used by the program 6T T R R L L R R L L T T Unit Time for Volumes = 60 minutes Peak Flow Period = 15 minutes Flow Rates include effects of Flow Scale and Peak Flow Factor Flow Rates (Total Vehicles and Percent Heavy) Site:New Dundee Road -N-Strasburg Road - Weekday PM 2031
297 Detailed Output about:blank Page 10 of /06/ Mov Left Through Right ID Total %HV Total %HV Total %HV --- Demand flows in veh/h as used by the program 6T T R R L L R R L L T T Unit Time for Volumes = 60 minutes Peak Flow Period = 15 minutes Flow Rates include effects of Flow Scale and Peak Flow Factor Other Model Settings Site:New Dundee Road -N-Strasburg Road - Weekday PM 2031 * Basic Parameters: Intersection Type: Driving on the right-hand side of the road Input data specified in Metric units Model Defaults: US HCM (Metric) Peak Flow Period (for performance): 15 minutes Unit time (for volumes): 60 minutes. HCM Delay Model option used HCM Queue Model option used Level of Service based on: Delay (HCM 2000) Queue percentile: 95% Parameters Used in Cost Calculations Site:New Dundee Road -N-Strasburg Road - Weekday PM 2031 Pump price of fuel ($/L) = Fuel resource cost factor = 0.70 Ratio of running cost to fuel cost = 3.0 Average income ($/h) = Time value factor = 0.40 Light vehicle mass (1000 kg) = 1.4 Heavy vehicle mass (1000 kg) = 11.0 Light vehicle idle fuel rate (L/h) = Heavy vehicle idle fuel rate (L/h) = Diagnostics Site:New Dundee Road -N-Strasburg Road - Weekday PM 2031 Processed: June 7, :26:46 AM SIDRA INTERSECTION Copyright Akcelik and Associates Pty Ltd Project: C:\Users\knigc2\Desktop\Strasburg\SIDRA Files\W1\New Dundee Road and Strasburg
298 Detailed Output about:blank Page 11 of /06/07 Road_2031_W1.sip , SNC-LAVALIN INC, SINGLE
299 Strasburg Road Extension Environmental Study Report From North of Stauffer Drive to New Dundee Road October 2013 APPENDIX D.1 (c) ADDITIONAL TRAFFIC SCOPE TECHNICAL MEMORANDUM E-Rev 1

300 MEMORANDUM 195 The West Mall Toronto ON Telephone: Canada M9C 5K1 Fax: TO: File FROM: Don Cleghorn, Cindy Tse DATE: September 4, 2013 CC: RE: Additional Traffic Scope for the Strasburg Road Extension, Rush Meadow Street to New Dundee Road 1.0 Background A study report assessing the impact of the alternative alignments of the Strasburg Road Extension (Strasburg Road Extension - Rush Meadow Street to New Dundee Road Final Traffic Report for the Class EA) was submitted to the City in January, In that study report, five alternative alignments which were based on refinements of the Official Plan alignment for Strasburg Road were assessed. The report found that the eastern alignment options, E2 and E4 were more preferable from the traffic and transportation perspectives. 2.0 Purpose of this Memorandum Following the completion of the above study report, the City provided new traffic data and included two new alternative alignments for analysis. The purpose of this memo is to: explain the additional traffic scope that was added since the Final Traffic Report for the Class EA was issued in January 2012; document any additional data collection and analysis results; and summarize findings and the resulting evaluation of alternatives from the traffic perspective. 1
301 3.0 Major Difference between Previous and Current Data and Assumptions 3.1 Proposed Development Schedule The Final Traffic Report for the Class EA assumed two specific horizon years for the proposed developments around the Brigadoon and Doon South communities, as well as areas to the west of the proposed Strasburg Road and south of Huron Road. It assumes 2031 is the full build-out horizon year. The latest schedule assumes the full build-out horizon year is Traffic Data The Final Traffic Report for the Class EA report extracted the 2008 traffic volumes from the turning volumes reported in the Paradigm 1 report. The 2008 traffic volumes were factored with a growth rate of 1% per annum to update the traffic volumes to In January 2013, the City provided 2010 observed traffic volumes for 12 intersections in the area as listed below: 1) Fischer-Hallman Road and Huron Road 2) Huron Road and Strasburg Road 3) Huron Road and Battler Road 4) Huron Road and Trillium Drive 5) Homer Watson Boulevard and Manitou Drive / Doon Village Road 6) Doon Village Road and Pioneer Drive 7) Homer Watson Boulevard and Pioneer Drive 8) Homer Watson Boulevard and Doon South Drive 9) Homer Watson Boulevard and Conestoga College Boulevard 10) Homer Watson Boulevard and Highway 401 WB Ramp/New Dundee Road 11) New Dundee Road and Reichert Drive 12) Fischer-Hallman Road and New Dundee Road The background traffic in the current analysis consists of the new 2010 observed traffic volumes (12 intersections) with the 2010 projected volumes (12 intersections) that were used in the previous analysis. The 2010 projected volumes were used for the intersections that do not have new observed traffic data. It is anticipated that traffic will be diverted from the existing road network to use the New Strasburg Road. The amount of traffic diversion was estimated from the Regional Transportation Model and was included in the future background traffic conditions on Strasburg Road. Growth of 1% per annum was applied to estimate the background traffic volumes during the weekday peak hours under future background traffic conditions for 2018 and Moreover, the forecast traffic volumes under the 2031 horizon years were estimated by adding 1 Doon South Community and Broader Study Area Traffic Impact Study, prepared by Paradigm Transportation Solutions Ltd., November
302 the future background volumes and the net additional development volumes additional development volumes for all the intersections on Strasburg Road. and the net Figure 1 and 2 illustrate the future total traffic volumes on Strasburg Road. Note that for convenience the examples in the Figures assume Strasburg Road connects to New Dundee Road at a 4-leg intersection with Cameron Road, but this is not the case for all the Strasburg Road extension alternatives under consideration. 3
303 Huron Road Huron Road Rush Meadow Street Rush Meadow Street Rockcliffe Drive Rockcliffe Drive Biehn Drive Biehn Drive Robert Ferrie Drive Robert Ferrie Drive Blair Creek Drive Blair Creek Drive New Dundee Road New Dundee Road Weekday AM Peak Hour 2018 Weekday PM Peak Hour Figure 1: Estimated 2018 Total Traffic Volumes along Strasburg Road 4
304 Huron Road Huron Road Rush Meadow Street Rush Meadow Street Rockcliffe Drive ockcliffe Drive Biehn Drive Biehn Drive Robert Ferrie Drive Robert Ferrie Drive Blair Creek Drive Blair Creek Drive New Dundee Road New Dundee Road Weekday AM Peak Hour 2031 Weekday PM Peak Hour Figure 2: Estimated 2031 Total Traffic Volumes along Strasburg Road 5

305 3.3 Alternative Alignments In the Final Traffic Report for the Class EA report, the city had shortlisted five alternative alignments. As shown in Figure 3, the current analysis introduced two new alignments, E4 Modified and W2 Modified. Figure 3: Alternative alignments for the Strasburg Road Extension 6
306 4.0 Results 4.1 Average Annual Daily Traffic (AADT) Volumes The 2018 and 2031 AADT volumes on each section of Strasburg Road and surrounding roads with respect to the various alignment options are shown in Table 1 to Table 4 below. Alignment E2/E4 draws the most traffic from the new development in Doon South and therefore gives the greatest predicted intersection turning volumes which translates to two-way AADT volumes on the Strasburg Road Extension ranging, depending on the section of Strasburg Road, from 17,080 to 19,920 in 2018, and from 18,340 to 20,990 in The other alignment options result in slightly lower but similar order of magnitude AADT forecasts, as shown in Tables 1 to 4 below. The volumes decrease as the alignment moves west, due to reduced attraction of traffic from the new developments. The one location where there is a significant distinction among the alternatives is the section of New Dundee Road between Cameron Road and the new Strasburg Road intersection, for those alignment options that do not terminate at Cameron Road. This can be seen in Table 2 below: when the alignment does not connect at Cameron Road the AADTs east of Strasburg Road and East of Cameron Road differ considerably. 4.2 Intersection Performance Analysis Evaluation of the performance measures for the above new intersections has been completed under future traffic conditions for the year Analysis of unsignalized and signalized intersections was undertaken using Synchro, Version 8 traffic signal timing software package, and results were taken from Synchro Lanes, Volumes Timing Report for signalized intersections and HCM 2000 Unsignalized report for stop controlled intersections. The intersection operation is typically described based on Level of Service (LOS) ratings that are expressed on a scale of A to F, where A is considered excellent (i.e., very little delay) and F is considered unacceptable (i.e., very congested, very long delays), as outlined in Table 5. The roundabout controlled intersections were analyzed using the SIDRA Version 6.0 software package. Again, results were taken from outputs that evaluated delays and LOS based on the HCM methodology. The performance measures of the intersections for W1 and E2/E4 alignments for the horizon years of 2031 are summarized respectively in Tables 6 to 8 below. There are a total of 25 intersections, with 8 intersections along Strasburg Road and 18 intersections elsewhere in the surrounding network. Note that both signalized and roundabout options are provided for the New Dundee and Strasburg Road intersection. The W1 and E2/E4 alignments respectively represent the extreme cases for Strasburg Road attracting new development traffic, so that the W1 alignment provides the least relief to the surrounding network, while the E2/E4 provides the most relief. However the difference is not large and the results for the surrounding network are very similar. Essentially, similar conditions (and hence needs for improvement) will be experienced at the intersections examined in the surrounding network regardless of the alternative selected for the Strasburg Road extension. 7
307 Table 1: AADT Volumes on Strasburg Road Strasburg Road No Strasburg Road Extension Western Alignment (W1) Western Alignment Central Alignment Eastern Alignment Eastern Alignment Eastern Alignment (W2 Modified) (C2) (E3) (E2 & E4) (E4 Modified) Rockcliffe Drive Biehn Drive n/a n/a 17,820 18,910 18,650 19,730 19,090 20,170 19,090 20,170 19,920 20,990 19,920 20,990 Biehn Drive Robert Ferrie Drive n/a n/a 17,150 18,230 17,910 19,000 18,320 19,410 18,320 19,410 19,090 20,170 19,090 20,170 Robert Ferrie Drive Blair Creek Drive n/a n/a 17,100 18,360 17,740 19,000 18,080 19,340 18,080 19,340 18,730 19,980 18,730 19,980 Blair Creek Drive New Dundee Road 1,160 1,340 15,760 17,020 16,280 17,540 16,560 17,820 16,560 17,820 17,080 18,340 17,080 18,340 Table 2: AADT Volumes on New Dundee Road New Dundee Road No Strasburg Road Extension Western Alignment (W1) Western Alignment Central Alignment Eastern Alignment Eastern Alignment Eastern Alignment (W2 Modified) (C2) (E3) (E2 & E4) (E4 Modified) East of Cameron Road 4,880 5,670 15,740 16,630 15,960 16,860 16,090 16,980 16,090 16,980 16,320 17,200 16,320 17,200 East of Strasburg Road 4,880 5,670 26,330 28,380 26,700 28,750 16,090 16,980 26,890 28,930 16,320 17,200 16,320 17,200 West of Strasburg Road 6,410 7,440 11,600 12,480 11,440 12,330 11,350 12,240 11,350 12,240 11,200 12,090 11,290 12,090 Table 3: AADT Volumes on Cameron Road Cameron Road No Strasburg Road Extension Western Alignment (W1) Western Alignment Central Alignment Eastern Alignment Eastern Alignment Eastern Alignment (W2 Modified) (C2) (E3) (E2 & E4) (E4 Modified) South of New Dundee Road 2,790 3,240 11,010 12,230 11,150 12,370 11,220 12, ,440 11,350 12,580 11,350 12,580 8
308 Table 4: AADT Volumes on access to Strasburg Road Access to Strasburg Road No Strasburg Road Extension Western Alignment (W1) Western Alignment Central Alignment Eastern Alignment Eastern Alignment Eastern Alignment (W2 Modified) (C2) (E3) (E2 & E4) (E4 Modified) Robert Ferrie Drive n/a n/a 7,250 7,430 7,790 7,970 8,070 8,250 8,070 8,250 8,620 8,800 8,620 8,800 Blair Creek Drive n/a n/a 5,960 5,960 6,500 6,500 6,790 6,790 6,790 6,790 7,330 7,330 7,330 7,330 Table 5: Level of Service Description LEVEL OF SERVICE Signalized Intersection Delay* Unsignalized Intersection Delay** A 10 sec 10 sec B sec sec C sec sec D sec sec E sec sec F 80 sec 50 sec * HCM 2000 Exhibit 16-2 ** HCM 2000 Exhibit
309 Table 6: Capacity Analysis Results Unsignalized Intersections Future Traffic Conditions (2031) Alternative W1 results are first for each location, with E2/E4 results immediately below. Intersections Max V/C Ratio Strasburg Road/Rush Meadow Street Weekday AM Peak Hour 2018 Weekday PM Peak Hour 2018 Average Delay (s) Level of Service (LOS) Max V/C Ratio Average Delay (s) Level of Service (LOS) W A A E2/E A A Strasburg Road/Biehn Drive W A A E2/E A A Strasburg Road /Rockcliffe Drive W A A E2/E A A Huron Road/Homer Watson W1 Err Err F Err Err F E2/E4 Err Err F Err Err F New Dundee Road/Collector A W A A E2/E A A Conestoga College/New Dundee Road W E Err Err F E2/E D Err Err F New Dundee Road/Collector B W A A E2/E A A New Dundee Road/Reichert Drive W A D E2/E A D 10
310 Table 7: Capacity Analysis Results Signalized Intersections Future Traffic Conditions (2031) Alternative W1 results are first for each location, with E2/E4 results immediately below. Intersections V/C Ratio Weekday AM Peak Hour 2031 Weekday PM Peak Hour 2031 Average Delay (s) New Dundee Road/Cameron Road (W1 only) Level of Service (LOS) V/C Ratio Average Delay (s) Level of Service (LOS) W C D E2/E4 New Dundee Road/Fischer-Hallman Road W F E E2/E F E Strasburg Road / New Dundee Road (note W1 and E2/E4 configurations here are different and not comparable) W C C E2/E F F Strasburg Road / Blair Creek Drive W A A E2/E B B Strasburg Road / Robert Ferrie Drive W B C E2/E B E Battler Road/Huron Road W D E E2/E D E Huron Road/Trillium Drive W A B E2/E A B Homer Watson/Manitou Drive W F F E2/E F F Homer Watson/Doon South Drive W D C E2/E D C Pioneer Drive/Manitou Drive W C B E2/E C C Homer Watson/Pioneer Drive W E F E2/E E F Homer Watson Blvd/Conestoga College Blvd W F F E2/E F F N/A 11
311 Homer Watson Blvd/Highway 401 Ramp W F F E2/E F F New Dundee Road/Thomas Slee Drive W C E E2/E C E Table 8: Capacity Analysis Results Intersections on Strasburg Road Future Traffic Conditions (2031) Alternative W1 results are first for each location, with E2/E4 results immediately below. Intersections V/C Ratio Strasburg Road / Robert Ferrie Drive Weekday AM Peak Hour 2031 Weekday PM Peak Hour 2031 Average Delay (s) Level of Service (LOS) V/C Ratio Average Delay (s) Level of Service (LOS) W A A E2/E A A Strasburg Road / New Dundee Road / Cameron Road (Cameron Road included only for Alternative E2/E4) W B C E2/E D D Strasburg Road / Huron Road W C C E2/E D D Strasburg Road / Blair Creek Drive W A A E2/E A B Huron Road/Fischer-Hallman Road W A C E2/E B D Robert Ferrie Drive/New Dundee Road W A A E2/E A A 4.3 Initial Screening Analysis The Region of Waterloo requires that an initial roundabout screening analysis be completed for any intersections created/modified as a part of the Strasburg Road extension. An initial roundabout screening analysis has been conducted for the Strasburg Road and New Dundee intersection (attached to this memo). The previous traffic report included the (favourable) roundabout screening analysis for Strasburg Road at both Robert Ferrie Drive and Blair Creek Drive, and as both these future intersections will be subject to separate assessments, they are not discussed in further detail in this memo. The intent of the initial roundabout screening analysis is to provide a relatively quick feasibility assessment of a modern roundabout at a particular intersection in comparison to other 12
312 appropriate forms of traffic control or road improvements. The intended outcome of this tool is to provide enough information to assist the Region in deciding whether or not to proceed with an intersection control study to further investigate the feasibility of a roundabout. The initial roundabout screening analysis requires a comparison of the 20 year life-cycle costs between a roundabout option and a signal control option. The 20 year life-cycle cost is the sum of the implementation cost and the 20 year injury collision cost related to the type of intersection control and discounted into a present value. The following assumptions were used when calculating the 20 year injury collision costs for the concerned intersections: Table 9: 20 Year Injury Collision Cost Assumptions Item Value Injury Collision Cost $30,000 Discount Rate 6% Average Injury Collision Rate for Signal Control Intersection 0.14 collisions/mve with AADT entering volumes greater than 25,000 for a 3-leg intersection Ratio of Annual Injury Collision Frequency for a versus a Signal Control Intersection 25% Table 10 summarizes the 20 year life-cycle cost comparison between a roundabout option and a signal control option for the Strasburg Road and New Dundee Road intersection. Table 10: 20 Year Life-Cycle Cost Comparison - Strasburg Road/New Dundee Road Cost Item Signal Control Implementation Cost $2.0 million $2.4 million Injury Collision Cost (Present Value) $0.6 million $0.3 million Total Life Cycle Cost $2.6 million $2.7 million As shown in Table 10, the roundabout option has a slightly higher life-cycle cost than a signal control by a ratio of less than Given the planning level of the analysis, this is not considered a significant difference and as a result the City may wish to consider implementing a roundabout at this intersection, so an intersection control study is recommended. The completed Region of Waterloo Feasibility Initial Screening Tool is provided in Appendix A. The conceptual roundabout layout was developed and is also included in Appendix A. Final design details of the roundabout will be developed during the detailed design stage. 4.4 Detailed Assessment of Short-Listed Alignment Alternatives Table 11 provides a detailed assessment of short-listed alignment alternatives. The evaluation of the alternatives was based on the following factors: Transportation Network 13
313 Traffic Operations Transportation Policy Initiatives Regardless of the alignment options, the geometry of the future Strasburg Road would be established according to design criteria consistent with a minimum design speed of 70 km/h (i.e., minimum 10 km/h over proposed posted speed of 60 km/h), and assumes a continuous 4- lane road cross-section with a boulevard extending to the ROW limit consistent with the City of Kitchener s Secondary Arterial standard cross-section. From access, traffic operations and transit service viewpoints, Options E2, E4 and E4 Modified are preferred among the other options. Many of the intersections along the vicinity arterials are identified to have capacity issues under current and future traffic conditions, Strasburg Road is considered necessary to provide an alternate north-south arterial connector for the Doon South Community, and relieve future demand on Homer Watson Boulevard, Huron Road and Fischer Hallman Road. It will also provide a good arterial connection to the existing interchange at Highway 401 and Cedar Creek Road in the south via Cameron Road. A single new roundabout will be implemented at Strasburg Road/Cameron Road and New Dundee Road for these easterly alignment options. These easterly alignment options are also within walkable distance for the Doon South Community residents, allowing for viable transit service along Strasburg Road. Similar to Options E2, E4 and E4 Modified, Option C2 will also provide a good arterial connection to the existing interchange at Hwy 401 and Cedar Creek Road in the south via Cameron Road and form a single new roundabout at Strasburg Road/Cameron Road and New Dundee Road. In Option C2, the Robert Ferrie Drive would have to extend westward by about 260 m as compared to the above easterly alignment options, which increases the walk distance for portion of Doon South community residents in accessing the future transit service on Strasburg Road. Options E3, W1 and W2 Modified would have the southerly terminus of Strasburg Road intersecting with New Dundee Road in a T-intersection formation and offset from Cameron Road. These staggered intersection configurations are not supported from the functional viewpoint since it creates additional turning volumes, requires 4 lanes on New Dundee Road west of Cameron Road, and slows down traffic on New Dundee Road. The staggered intersections also suggest a lesser degree of network connectivity, providing indirect travel between Strasburg Road and Cameron Road for pedestrians and cyclists. However, should a staggered intersection be necessary, the larger the separation the better for traffic operations, although that would increase the affected length of New Dundee Road. For Options W1 and W2 Modified, since their alignments would be shifted by more than 800 m and 400 m respectively outward from the boundary of the new Doon South residential development area, such shifting would therefore make these alignment options less attractive for transit ridership among the other alignment options unless the future bus service is going to be diverted and travel entirely on local roads (reducing transit speeds) instead of the future Strasburg Road. These westerly alignment options are therefore not supported from the transit service perspective. 14
314 An evaluation matrix containing numeric ratings corresponding to this evaluation is shown in Table 12, and formed the Transportation component of the overall project evaluation of alternatives. 15
315 Table 11: Detailed Assessment of Short-Listed Alignment Alternatives TRANSPORTATION ASSESSMENT Alignment Alternatives Factor Description E2 E3 E4 E4 Modified C2 W1 W2 Modified Transportation Network - Same as E2 alignment - Same as E2 and E4 alignments - Provision of Doon South Community access (Robert Ferrie Drive; Blair Creek Drive) - Average Annual Daily Traffic (AADT) - Compatibility with RMOW s New Dundee Road proposal - Relieve future demand on Homer Watson Boulevard, Huron Road and Fischer Hallman Road - Potential impacts to local roads/intersections - There are eight intersections in the surrounding road network that are considered critical and having LOS E/F for the critical approaches during the 2031 AM/PM peak. - These critical intersections are: Hwy 401 / Homer Watson Blvd; Conestoga College Blvd / Homer Watson Blvd Doon South Drive / Homer Watson Blvd; Pioneer Drive / Homer Watson Blvd; Manitou Drive / Homer Watson Blvd; Doon Village Road / Pioneer Drive; Battler Road / Huron Road; and Fischer-Hallman Road/New Dundee Road (see attached the intersection map). - All these critical intersections are on the surrounding arterial roads except for Doon Village Road / Pioneer Drive, which is on neighborhood roads. - Strasburg Road is considered necessary to provide an alternate north-south arterial connector for the Doon South Community, and relieve future demand on Homer Watson Blvd, Huron Road and Fischer Hallman Road. It also provides a good arterial connection to the existing - About 28% of Doon South Community traffic will use Strasburg Road and do so via future Robert Ferrie Drive and Blair Creek Drive AADT volumes of 8,070 vehicles on Robert Ferrie Drive and 6,790 vehicles on Blair Creek Drive. - By 2031, the AADT on New Dundee Road (east of Cameron Road) would reach about 16,090 vehicles. - This alignment option has the same Level of Service as E2 alignment at those critical intersections since there is only a slight variance of traffic flows from the E2 alignment option. - The southerly terminus of Strasburg Road intersects with New Dundee Road in a T- intersection formation. This intersection is offset approximately 260 m from Cameron Road. This configuration may redivert the southbound traffic movements back to Fischer Hallman Road. - Same as E3 alignment expect that a single intersection will be formed at Strasburg Road/Cameron Road and New Dundee Road instead of a staggered intersection in the E3 alignment option. - This alignment option also has more or less the same Level of Service as E2 alignment at those critical intersections since there is only a slight variance of traffic flows from the E2 alignment option. - Similar to E2, E4 and E4 Modified alignments, this alignment also provides a good arterial connection to the existing interchange at Hwy. 401 and Cedar Creek Road in the south via Cameron Road. - About 24% Doon South Community traffic will use Strasburg Road and do so via future Robert Ferrie Drive and Blair Creek Drive AADT volumes of 7,250 vehicles on Robert Ferrie Drive and 5,960 vehicles on Blair Creek Drive. - By 2031, the AADT on New Dundee Road (east of Cameron Road) would reach about 16,630 vehicles. - This alignment option also has the same Level of Service as E2 alignment at those critical intersections since there is only a slight variance of traffic flows from the E2 alignment option. - The southerly terminus of Strasburg Road intersects with New Dundee Road in a T- intersection formation. This intersection is offset approximately 730 m from Cameron Road. This configuration may redivert the southbound traffic movements back to Fischer Hallman Road. - About 26% of Doon South Community traffic will use Strasburg Road and do so via future Robert Ferrie Drive and Blair Creek Drive AADT volumes of 7,790 vehicles on Robert Ferrie Drive and 6,500 vehicles on Blair Creek. - By 2031, the AADT on New Dundee Road (east of Cameron Road) would reach about 16,860 vehicles. - This alignment option also has the same Level of Service as E2 alignment at those critical intersections since there is only a slight variance of traffic flows from the E2 alignment option. - The southerly terminus of Strasburg Road intersects with New Dundee Road in a T-intersection formation. This intersection is offset approximately 420 m from Cameron Road. This configuration may re-divert the southbound traffic movements back to Fischer Hallman Road. 16
316 TRANSPORTATION ASSESSMENT Alignment Alternatives Factor Description E2 E3 E4 E4 Modified C2 W1 W2 Modified interchange at Hwy 401 and Cedar Creek Road in the south via Cameron Road. - The other closest north-south arterial road is Fischer- Hallman Road which is approximately 2 km away to the west and the intersection at Fischer-Hallman Road/New Dundee Road has also been identified having capacity issues. - About 30% of Doon South Community traffic will use Strasburg Road and do so via future Robert Ferrie Drive and Blair Creek Drive AADT volumes of 8,620 vehicles on Robert Ferrie Drive and 7,330 vehicles on Blair Creek Drive are in the upper range limit for residential collector roads - According to the Draft Connector Classification Map for the Region of Waterloo, New Dundee Road is classified as a Neighbourhood Connector/Avenue. Traffic Operations - Road safety and accessibility (sight distance; turning movements) - A single roundabout will be formed at Strasburg Road/Cameron Road and New Dundee Road - s are preferably sited on - A staggered intersection (with north and south legs 260 m apart) will be formed at Strasburg Road/Cameron Road and New Dundee Road - A single roundabout will be formed at Strasburg Road/Cameron Road and New Dundee Road - The Strasburg Road arm will form a skew - A single roundabout will be formed at Strasburg Road/Cameron Road and New Dundee Road - Same as E4, the Strasburg Road arm - A single roundabout will be formed at Strasburg Road/Cameron Road and New Dundee Road - Same as E2, a minimum stopping - An additional intersection will be formed at Strasburg Road and New Dundee Road about 730 m west of the existing intersection at Reidel Drive/Cameron Road and New - An additional intersection will be formed at Strasburg Road and New Dundee Road about 420 m west of the existing intersection at Reidel Drive/Cameron Road and New 17
317 TRANSPORTATION ASSESSMENT Alignment Alternatives Factor Description E2 E3 E4 E4 Modified C2 W1 W2 Modified level ground or in sags rather than at or near the crests of hills because it is difficult for drivers to appreciate the layout when approaching on an up gradient. A minimum stopping sight distance of 200 m and object height of 0.15 m for the westbound drivers should be provided for the proposed roundabout. - From the traffic operational perspective, by staggering Cameron Road with the future Strasburg Road, it creates additional turning volumes; requires 4 lanes on New Dundee Road west of Cameron Road; and slows down traffic on New Dundee Road which should be a regional arterial road in the future. angle at the proposed roundabout which may reduce the speed when entering the roundabout from Strasburg Road SB. will form a skew angle at the proposed roundabout which may reduce the speed when entering the roundabout from Strasburg Road SB. sight distance of 200 m and object height of 0.15 m for the westbound drivers should be provided for the proposed roundabout. Dundee Road - Similar to E3, by staggering Cameron Road with the future Strasburg Road, it creates additional turning volumes; requires 4 lanes on New Dundee Road west of Cameron Road; and slows down traffic on New Dundee Road. Dundee Road - Similar to E3 and W1, by staggering Cameron Road with the future Strasburg Road, it creates additional turning volumes; requires 4 lanes on New Dundee Road west of Cameron Road; and slows down traffic on New Dundee Road. - s are preferably sited on level ground or in sags rather than at or near the crests of hills because it is difficult for drivers to appreciate the layout when approaching on an up gradient. A minimum stopping sight distance of 200 m and object height of 0.15 m for the westbound drivers should be provided for the proposed roundabout. - s are preferably sited on level ground or in sags rather than at or near the crests of hills because it is difficult for drivers to appreciate the layout when approaching on an up gradient. A minimum stopping sight distance of 200 m and object height of 0.15 m for the westbound drivers should be provided for the proposed roundabout. 18
318 TRANSPORTATION ASSESSMENT Alignment Alternatives Factor Description E2 E3 E4 E4 Modified C2 W1 W2 Modified Transportation Policy Initiatives - Capability to support municipal policy initiatives (transit, active transportation, roundabouts) - Most preferred in terms of its capability to support municipal policy on transit, active transportation and roundabout provisions. This alignment is within walkable distance for the Doon South Community residents. - As a general rule of thumb, the primary catchment area of a transit stop is typically 400 m in radius and the secondary catchment area might be extended up to 800 m in radius at the maximum, which is what an average person would be willing to walk to a transit stop - equivalent to about 10 minutes in walking. - The Blair Creek Drive would have to extend westward by about 260 m as compared to the E2 alignment. Therefore, the walking distance to/from the transit stops on future Strasburg Road would be longer compared to the E2 alignment for portion of Doon South community residents. - The staggered intersections suggest a lesser degree of network connectivity, providing indirect travel between Strasburg Road and Cameron Road for pedestrians and cyclists. - Since this alignment is very similar to E2, it is also preferred in terms of its capability to support municipal policy on transit, active transportation and roundabout provisions. - Since this alignment is very similar to E2 and E4, it is also preferred in terms of its capability to support municipal policy on transit, active transportation and roundabout provisions. - The Robert Ferrie Drive would have to extend westward by about 260 m as compared to the E2 alignment. Therefore, the walking distance to/from the transit stops on future Strasburg Road would be longer compared to the E2 alignment for portion of Doon South community residents. - The attractiveness of using the public transit for residents living in areas beyond 800 m from the transit stops would be very minimal and is not desirable. According to the Regional Transportation Plan, bus services would be running on the future Strasburg Road. Since this alignment would be shifted by more than 800 m outward from the boundary of the new Doon South residential development area, such shifting would therefore make this alignment the least attractive option for transit ridership among the other alignment options unless the future bus service is going to be diverted and travel entirely on local roads instead of the future Strasburg Road. - The staggered intersections also suggest a lesser degree of network connectivity, providing indirect travel between Strasburg Road and Cameron Road for pedestrians and cyclists. - Since this alignment also requires shifting by more than 400 m outward from the boundary of the new Doon South residential development area, such shifting would therefore make this alignment a less attractive option for transit ridership among the other eastern alignment options unless the future bus service is going to be diverted and travel entirely on local roads instead of the future Strasburg Road. - - The staggered intersections also suggest a lesser degree of network connectivity, providing indirect travel between Strasburg Road and Cameron Road for pedestrians and cyclists. 19
319 Table 12: Evaluation Matrix FACTOR ALIGNMENT ALTERNATIVE E2 E3 E4 E4 MODIFIED C2 W1 W2 MODIFIED TRANSPORTATION TRANSPORTATION NETWORK TRAFFIC OPERATIONS TRANSPORTATION POLICY INITIATIVES AGGREGATE SCORE FACTOR GROUP SCORE
320 May 23, 2012 REGION OF WATERLOO ROUNDABOUT FEASIBILITY INITIAL SCREENING TOOL VERSION 1.0 The intent of this screening tool is to provide a relatively quick assessment of the feasibility of a modern roundabout at a particular intersection in comparison to other appropriate forms of traffic control or road improvements including auxiliary lanes, traffic control signals, four-way stop, etc. The intended outcome of this tool is to provide enough information to assist staff in deciding whether or not to proceed to an Intersection Control Study to further investigate in more detail the feasibility of a roundabout. 1) Project Name/File No.: 2) Intersection Location (Street/Road Names, distance from major intersection, etc.): 3) Brief Description of Intersection (Number of Legs, Lanes on each leg, total AADT, AADT on each road, etc. Attach or sketch diagram showing existing and horizon-year turning movements.): 4) What operational problems are being experienced at this location? Document Number: Version: 6 Document Name: SVDK 2006 ROUNDABOUT FEASIBILITY INITIAL SCREENING TOOL
321 REGION OF WATERLOO ROUNDABOUT FEASIBILITY INITIAL SCREENING TOOL VERSION 1.0 5) Is it a new intersection or is it a retrofit of an existing intersection? If existing, what is the existing traffic control? 6) Is the intersection in the vicinity of a railroad crossing or another intersection? If so, how close and what type of traffic control exists at the adjacent intersection(s)? Will queues be a problem? 7) Would the intersection be located within a coordinated signal system? 8) Would the intersection be located on a Preferred Corridor? 9) Is the intersection located within a corridor that is scheduled for improvements in the 10 Year Transportation Capital Program? What is the ultimate cross-section of the approach roads? Document Number: Version: 6 Document Name: SVDK 2006 ROUNDABOUT FEASIBILITY INITIAL SCREENING TOOL
322 REGION OF WATERLOO ROUNDABOUT FEASIBILITY INITIAL SCREENING TOOL VERSION ) What is the collision history of the intersection over the past five years? Is there a collision problem that needs to be addressed? 11) Are persons with disabilities or horse and buggies frequent users of this intersection? 12) What traditional road improvements are proposed for this intersection? (eg. traffic signals, all-way stop, auxiliary lanes, etc.) Please attach a sketch of the traditional road improvements. A sample sketch is attached (DOCS #529440). 13) If traffic control signals are being considered, are the traffic signal warrants met for the horizon year? Document Number: Version: 6 Document Name: SVDK 2006 ROUNDABOUT FEASIBILITY INITIAL SCREENING TOOL
323 REGION OF WATERLOO ROUNDABOUT FEASIBILITY INITIAL SCREENING TOOL VERSION ) What size of roundabout is being considered for this intersection? (eg. Single-lane, two-lane entry or three-lane entry?) Please attach a Traffic Flow Worksheet and lane configuration diagram. Please attach a sketch showing how a roundabout would fit into the right-of-way. A sample sketch is attached (DOCS #529433). 15) 20-Year Life Cycle Cost Estimate 10-Year AADT: Injury Collision Cost (ICC): Discount Rate: (i): 20 YEAR LIFE-CYCLE COST COMPARISON Cost Item Other Traffic Control Implementation Cost $ $ Injury Collision Cost (Present Value) $ $ Total Life Cycle Cost X Y Notes: Implementation Cost = sum of costs for construction, property utility relocations, illumination, engineering (20%), contingency (20%) and maintenance (5%); Present Value of 20 Year Injury Collision Cost = expected annual collision frequency x ICC ((1 + i) 20-1) / i(1+i) 20 Document Number: Version: 6 Document Name: SVDK 2006 ROUNDABOUT FEASIBILITY INITIAL SCREENING TOOL
324 Monte Carlo Analysis may be required. If so, a range for the implementation cost (i.e. 10%, 50%, 90% probability) is required REGION OF WATERLOO ROUNDABOUT FEASIBILITY INITIAL SCREENING TOOL VERSION 1.0 Conclusions and Recommendation Document Number: Version: 6 Document Name: SVDK 2006 ROUNDABOUT FEASIBILITY INITIAL SCREENING TOOL
325 Ontario Traffic Manual Book 12 Justification 7B - Projected Volumes New Dundee Road & Strasburg Road Major Road: No. of lanes: Justification Adjustment Factors 2 each direction "T" intersection factor: 1.5 Minor Road: No. of lanes: 2 each direction AHV factor: 1.5 Time Minor Northbound Approach Major Eastbound Approach Minor Southbound Approach Major Westbound Approach Pedestrians Crossing LT TH RT LT TH RT LT TH RT LT TH RT Major Road AM Peak hour PM Peak hour Total , , ,182 1,520 0 Justification 1. Minimum Vehicular Volume 2. Delay to cross traffic Description A. Vehicle volume, all approaches (average hour) B. Vehicle volume, along minor streets (average hour) A. Vehicle volume, major street (average hour) B. Combined vehicle and pedestrian volume crossing artery from minor streets Adjusted Justification 7 Values Minimum Requirement Minimum Requirement Compliance 1 Lane Highways 2 or more lanes Sectional Free Flow Restr. Flow Free Flow Restr. Flow Numerical % % % % % (Per OTM Book 12 March 2012: note that for "T" intersections, the values for 1B are increased by 50%) (Per OTM Book 12 March 2012: note that for using AHV estimates, Justification 7 values are increased by 50% for a future roadway) Entire % 100% 91% 1. Minimum Vehicular Volume Justification RESULTS Compliance A Total Volume 100% B Crossing Volume 100% A Main Road 91% B Crossing Road 100% A Justification 1 100% B Justification 2 91% Signal Justified? 2. Delay to Cross Traffic NO 3. Combination YES YES
326
327 REGION OF WATERLOO ROUNDABOUT Project: PROJECT NAME Drawn By: C. Tse TRAFFIC Project No.: Sheet 1 of 2 FLOW SHEET Intersection: New Dundee / Strasburg Road VERSION 1.0 AUG 22, 2008 Time Period: 2031 AM PEAK E + C = 1289 Strasburg Road 927 TR% N TR% New Dundee Road E + C = New Dundee Road E + C = 919 TR % 0 0 E + C = 1600 TR% Capacity Guidelines RODEL Inputs 1. Single Lane service volumes < 900vph vph Leg PCU 1st Exit 2nd Exit 3rd Exit U-turn 2. Exit flow < 900vph vph for single lane exit Strasburg Road Entry flow + circulating flow < 1400vph use single lane entry New Dundee Road vph < Entry + Circ. flow < 2200vph use two-lane entry Entry flow + circulating flow > 2200vph use three-lane entry New Dundee Road DOCS # ROUNDABOUT TRAFFIC FLOW WORKSHEET

328 REGION OF WATERLOO ROUNDABOUT Project: PROJECT NAME Drawn By: C. Tse TRAFFIC Project No.: Sheet 2 of 2 FLOW SHEET Intersection: New Dundee / Strasburg Road VERSION 1.0 AUG 22, 2008 Time Period: 2031 PM PEAK E + C = 1750 Strasburg Road 930 TR% N TR% New Dundee Road E + C = New Dundee Road E + C = 1810 TR % 0 0 E + C = 1401 TR% Capacity Guidelines RODEL Inputs 1. Single Lane service volumes < 900vph vph Leg PCU 1st Exit 2nd Exit 3rd Exit U-turn 2. Exit flow < 900vph vph for single lane exit Strasburg Road Entry flow + circulating flow < 1400vph use single lane entry New Dundee Road vph < Entry + Circ. flow < 2200vph use two-lane entry Entry flow + circulating flow > 2200vph use three-lane entry New Dundee Road DOCS # ROUNDABOUT TRAFFIC FLOW WORKSHEET
OFFICIAL PLAN AMENDMENT AND SCHEDULE C CLASS ENVIRONMENTAL ASSESSMENT
 ROBERT FERRIE DRIVE OFFICIAL PLAN AMENDMENT AND SCHEDULE C CLASS ENVIRONMENTAL ASSESSMENT Presentation to Planning and Strategic Initiatives Committee June 9 th, 2014 1 Background Official Plan requires
Shannon Noonan, City of Cambridge Don Drackley, IBI Group Scott Johnson, IBI Group PTSL
 100 175 Galaxy Boulevard Toronto ON M9W 0C9 Canada tel 416 679 1930 fax 416 675 4620 ibigroup.com Memorandum To/Attention From cc Shannon Noonan, City of Cambridge Don Drackley, IBI Group Scott Johnson,
City of Brantford Chapter 3 TABLE OF CONTENTS
 Chapter 3 The Land Use & Transportation Connection TABLE OF CONTENTS 3.1 THE LAND USE & TRANSPORTATION LINK... 1 3.2 POPULATION & EMPLOYMENT GROWTH FORECASTS... 3 3.2.1 Proposed Places to Grow Plan Forecasts
APPENDIX B. Public Works and Development Engineering Services Division Guidelines for Traffic Impact Studies
 APPENDIX B Public Works and Development Engineering Services Division Guidelines for Traffic Impact Studies Revised December 7, 2010 via Resolution # 100991 Reformatted March 18, 2011 TABLE OF CONTENTS
Transportation and Works Department The Regional Municipality of York Yonge Street Newmarket, Ontario L3Y 6Z1
 TRANSPORTATION IMPACT STUDY (TIS) GUIDELINES FOR DEVELOPMENT APPLICATIONS Transportation and Works Department The Regional Municipality of York 17250 Yonge Street Newmarket, Ontario L3Y 6Z1 August, 2007
Welcome to the Public Information Centre. Red Hill Business Park South Transportation Master Plan Addendum. June 25, :00 p.m. to 8:00 p.m.
 Welcome Welcome to the Transportation Master Plan Addendum June 25, 2012 6:00 p.m. to 8:00 p.m. Please sign-in Background In 2006 the City of Hamilton completed the North Glanbrook Industrial Business
The Folded Interchange: An Unconventional Design for the Reconstruction of Cloverleaf Interchanges
 The Folded Interchange: An Unconventional Design for the Reconstruction of Cloverleaf Interchanges I. ABSTRACT Keith A. Riniker, PE, PTOE This paper presents the Folded Interchange design and compares
RER New Stations Initial Business Case BRESLAU STATION. Kitchener Corridor. July Draft
 RER New Stations Initial Business Case BRESLAU STATION Kitchener Corridor July 2016 Draft Draft: v1.2 Metrolinx RER New Stations Initial Business Case BRESLAU Draft Prepared by: IBI Group 55 St. Clair
CITY OF CLOVIS Traffic Impact Study Guidelines
 CITY OF CLOVIS Traffic Impact Study Guidelines CLOVIS, A WAY OF LIFE Approved August 25, 2014 City Council Resolution 2014-79 Prepared by City of Clovis Engineering Division Steve White, City Engineer
Woodburn Interchange Project Transportation Technical Report
 Final Report Woodburn Interchange Project Transportation Technical Report Prepared for Oregon Department of Transportation April 212 Prepared by DKS Associates Contents Methodologies... 4 Volume Development...
LAS VEGAS STREET RAILROAD CROSSING RR/PUC CONNECTION AND PRELIMINARY DESIGN
 LAS VEGAS STREET RAILROAD CROSSING RR/PUC CONNECTION AND PRELIMINARY DESIGN Prepared for: City of Colorado Springs Prepared by: Felsburg Holt & Ullevig 508 South Tejon Street Colorado Springs, CO 80903
WELCOME IL 47. Community Advisory Group Meeting #5 Waubonsee Community College Wednesday, May 31, 2017
 WELCOME IL 47 Community Advisory Group Meeting #5 Waubonsee Community College Wednesday, May 31, 2017 MEETING PURPOSE MEETING AGENDA 1. Welcome/Introduction 2. Review Previous Public Involvement 3. Process/Schedule
FLORIDA DEPARTMENT OF TRANSPORTATION Planning and Environmental Management Office INTERCHANGE MODIFICATION REPORT
 FLORIDA DEPARTMENT OF TRANSPORTATION Planning and Environmental Management Office INTERCHANGE MODIFICATION REPORT District 2 1109 South Marion Avenue Lake City, FL 32025-5874 INTERSTATE 10 (SR 8) / SR
Memorandum. 921 SW Washington Street, Suite 468, Portland, OR tel fax
 Date: September 16, 2010 To: I-84/US 395 IAMP Project Team From: Shayna Rehberg, AICP Darci Rudzinski, AICP Re: I-84/US 395 Interchange Area Management Plan Proposed IAMP Policies and Code Amendments L
CE 452 Traffic Impact Assessment
 CE 452 Traffic Impact Assessment 1 Why Required? New developments Produce/ attract new traffic Production: Residences Attraction: Shops, Offices, Schools, Hospitals etc. etc. Changes in traffic pattern
Transit Service Guidelines
 G R E AT E R VA N CO U V E R T R A N S P O RTAT I O N A U T H O R I T Y Transit Service Guidelines PUBLIC SUMMARY REPORT JUNE 2004 Greater Vancouver Transportation Authority TRANSIT SERVICE GUIDELINES
NW La Center Road/I-5 Interchange Improvement Project (MP 16.80)
") FINAL DRAFT - NW La Center Road/I-5 Interchange Improvement Project (MP 16.80) La Center, Washington February 2015 FINAL DRAFT - NW La Center Road/I-5 Interchange Improvement Project (MP 16.80) La Center,
FINAL DRAFT - NW La Center Road/I-5 Interchange Improvement Project (MP 16.80) La Center, Washington February 2015 FINAL DRAFT - NW La Center Road/I-5 Interchange Improvement Project (MP 16.80) La Center,
Niagara Region Transportation Master Plan Niagara-Hamilton Trade Corridor Technical Paper
 Niagara-Hamilton Trade Corridor Technical Paper 1. Purpose In the report to Council on the Regional Council Strategic Priorities Implementation Plan, pursuing Provincial commitment for the Niagara to Greater
Interchange Workshop Report (August 2004)
") U.S. Highway 14 Corridor Study New Ulm to North Mankato Table of Contents Section Interchange Workshop Report (August 2004) Page 1. Introduction and Next Steps 1 2. Interchange Workshop Participants &
U.S. Highway 14 Corridor Study New Ulm to North Mankato Table of Contents Section Interchange Workshop Report (August 2004) Page 1. Introduction and Next Steps 1 2. Interchange Workshop Participants &
Appendix B Highway 407 Interchange Review - Cochrane Street Area
 Appendix B Highway 407 Interchange Review - Cochrane Street Area AECOM 300 ater Street hitby, ON, Canada L1N 9J2 www.aecom.com Memorandum To Michael May, P.Eng., Town of hitby Page 1 CC Subject Greg Hardy,
MULTIMODAL TRANSPORTATION IMPACT STUDY GUIDELINES
 MULTIMODAL TRANSPORTATION IMPACT STUDY GUIDELINES 1 st Edition City of San Luis Obispo 2035 Circulation Element 1 Table of Contents Introduction... 2 Process... 2 When Impact Studies Are Required... 3
DEVELOPMENT, ANALYSIS, AND DESIGN OF A NEW PARKWAY AT GRADE INTERSECTION (PAGI)
") 2013 ITE Western District Annual Meeting COCEPT DEVELOPMET, AALYSIS, AD DESIG OF A EW PARKWAY AT GRADE ITERSECTIO (PAGI) Lead Author: James M. Witkowski, PhD Supporting Author: Darrell Truitt, PE The Pima
2013 ITE Western District Annual Meeting COCEPT DEVELOPMET, AALYSIS, AD DESIG OF A EW PARKWAY AT GRADE ITERSECTIO (PAGI) Lead Author: James M. Witkowski, PhD Supporting Author: Darrell Truitt, PE The Pima
Appendix D: Functional Classification Criteria and Characteristics, and MnDOT Access Guidance
 APPENDICES Appendix D: Functional Classification Criteria and Characteristics, and MnDOT Access Guidance D.1 Functional classification identifies the role a highway or street plays in the transportation
SPRINGBANK Phase 1 Background Report
 Phase 1 Background Report Table of Contents 1.0 CONTEXT... 4 CENTRAL ASP... 4 NORTH ASP... 4 MODDLE ASP... 5 2.0 PROJECT SCOPE... 5 3.0 PLANNING POLICY FRAMEWORK... 6 COUNTY PLAN (BYLAW C-7280-2013)...
THE PROJECT. Executive Summary. City of Industry. City of Diamond Bar. 57/60 Confluence.
 THE PROJECT A freeway segment ranked 6th worst in the Nation, with levels of congestion, pollution and accidents that are simply unacceptable and which have Statewide and National implications. Executive
DRAFT. Report C: Area Transportation System Problems and Opportunities. Highway 7&8 Transportation Corridor Planning and Class EA Study
 Ministry of Transportation Highway 7&8 Transportation Corridor Planning and Class EA Study Greater Stratford to New Hamburg Area MTO Group Work Project # 13-00-00 Report C: Area Transportation System Problems
VICTORIA REGIONAL TRANSIT SYSTEM
 VICTORIA REGIONAL TRANSIT SYSTEM WESTSHORE: LOCAL AREA TRANSIT PLAN Aligns transit investments with community develoent Better matches existing service to demand with service to new neighbourhoods and
Airport Road from 1 km North of Mayfield Road to 0.6 km North of King Street Public Information Centre #1
 Municipal Class Environmental Assessment Airport Road from 1 km North of Mayfield Road to 0.6 km North of King Street Public Information Centre #1 Date: Thursday, June 20, 2013 Time: 6:30 p.m. 8:30 p.m.
Master Plan. Summary
 R e g i o n a l Tr a n s p ortat i o n Master Plan Summary Executive Summary With an increasing population and changing demographics, Waterloo Region must ensure that growth is both sustainable and affordable.
GRAND NIAGARA Proposed Secondary Plan
 GRAND NIAGARA Proposed Secondary Plan Public Open House #3 January 17. 2017 scope + process BUILT Grand Niagara Secondary Plan The Grand Niagara Secondary Plan will establish a framework for the future
Quantifying the performance of a traffic data collection system: Scout Connect match rate evaluation
 Technology Showcase Miovision Scout Quantifying the performance of a traffic data collection system: Scout Connect match rate evaluation Contents Executive summary 2 Elements of the study 2 Objectives
Chapter 2: Alternatives
 Chapter 2: Alternatives Introduction An Environmental Impact Statement (EIS) is a procedural document. In other words, the environmental planning process follows a logical sequence of development. Subsequent
2 Purpose and Need. 2.1 Study Area. I-81 Corridor Improvement Study Tier 1 Draft Environmental Impact Statement
 2 Purpose and Need 2.1 Study Area Interstate 81 (I-81) is relied upon for local and regional travel and interstate travel in the eastern United States. It extends 855 miles from Tennessee to New York at
5 INFORMATION UPDATE TRAFFIC NOISE ASSESSMENT TESTON ROAD CITY OF VAUGHAN
 Report No. 3 of the Transportation Services Committee Regional Council Meeting of March 24, 2011 5 INFORMATION UPDATE TRAFFIC NOISE ASSESSMENT TESTON ROAD CITY OF VAUGHAN The Transportation Services Committee
Executive Summary HIGHWAYS 1 & 3 NETWORK FUNCTIONAL PLANNING STUDY FUTURE REALIGNMENT CITY OF MEDICINE HAT STUDY BACKGROUND
 Executive Summary STUDY BACKGROUND Both Highways 1 and 3 are classified as core routes in the NHS. As part of the NHS, a set of roadway standards have been identified, which includes a minimum posted speed
3. Environmental Setting, Impacts, and Mitigation
 Draft Environmental Impact Statement Page 3-1 3. Environmental Setting, Impacts, and Mitigation 3.1. Transportation Cameron Engineering performed a detailed investigation of the traffic impacts of the
APPENDIX A TIER 1 ANALYSIS
 SPN H.004100 FEASIBILITY STUDY APPENDIX A TIER 1 ANALYSIS 040-012-042AH Appendices Lead Sheets PROVIDENCE STATE PROJECT. H.004100 The following worksheets analyze various project alternatives at various
I-15 South, MP 0 to MP 16 Environmental Assessment. Public Hearing. August 7, :00 PM to 7:00 PM
 I-15 South, MP 0 to MP 16 Environmental Assessment Public Hearing August 7, 2012 5:00 PM to 7:00 PM 1 PROJECT OVERVIEW The Federal Highway Administration (FHWA) and the Utah Department of Transportation
Jim Alexander Director of Design and Engineering, Southwest Light Rail Transit Project
 Memorandum Date: January 15, 2014 To: CC: From: Subject: Jim Alexander Director of Design and Engineering, Southwest Light Rail Transit Project Paul Danielson, P.E. Project Manager, Southwest Light Rail
West Transitway Extension Bayshore Station to West of Moodie Drive
 West Transitway Extension Bayshore Station to West of Moodie Drive Document 4 Assessment of Effects and Comparative Evaluation of Route Alternatives (AECERA) TABLE OF CONTENTS EXECUTIVE SUMMARY...V CHAPTER
Transportation Master Plan Update
 Final Report Transportation Master Plan Update by IBI Group March 2016 IBI GROUP FINAL REPORT TRANSPORTATION MASTER PLAN UPDATE Document Control Page CLIENT: PROJECT NAME: REPORT TITLE: County of Brant
TRANSPORTATION IMPACT STUDIES
 January 28, 2009 POLICIES AND PROCEDURES FOR TRANSPORTATION IMPACT STUDIES Related to Highway Occupancy Permits Pennsylvania Department of Transportation Bureau of Highway Safety and Traffic Engineering
1.1 Purpose of the Project
 Chapter 1 Purpose and Need for East Link Project 1.1 Purpose of the Project The purpose of the East Link Project is to expand the Sound Transit Link light rail system from Seattle to Mercer Island, Bellevue
Volume to Capacity Estimation of Signalized Road Networks for Metropolitan Transportation Planning. Hiron Fernando, BSCE. A Thesis CIVIL ENGINEERING
 Volume to Capacity Estimation of Signalized Road Networks for Metropolitan Transportation Planning by Hiron Fernando, BSCE A Thesis In CIVIL ENGINEERING Submitted to the Graduate Faculty of Texas Tech
CHAPTER 2B - PHASE I, INITIAL ROADWAY INVESTIGATION & PRELIMINARY FIELD INSPECTION
 CHAPTER 2B - PHASE I, INITIAL ROADWAY INVESTIGATION & PRELIMINARY FIELD INSPECTION SECTION 2B 1 - GROUND SURVEYS Survey Authorization... 2B-1 Interstate... 2B-1 Principal / Minor Arterial... 2B-1 Urban...
Chapter 4: Alternatives Analysis
 Chapter 4: Alternatives Analysis 4.0 Introduction and Alternatives Analysis Process Detailed analysis and evaluation of the alternatives was a critical step in the development of comprehensive and workable
Overall project. The $288 million Phase 2 DesignBuild project starts construction. this spring, with completion by December 31, 2016
 Overall project Johnson County Gateway Interchange Project Improvements 87th Street The $288 million Phase 2 DesignBuild project starts construction this spring, with completion by December 31, 2016 Phase
TRAFFIC & TRANSPORTATION COMMISSION AGENDA REPORT
 TRAFFIC & TRANSPORTATION COMMISSION AGENDA REPORT AGENDA ITEM #4 T/T MTG: 092616 DATE: SEPTEMBER 26, 2016 TO: TRAFFIC & TRANSPORTATION COMMISSION FROM: BENJAMIN CHAN, P.E, T.E., DEPUTY PUBLIC WORKS DIRECTOR
LUNDY S LANE COMMUNITY IMPROVEMENT PLAN STUDY
 PUBLIC INFORMATION MEETING # October, 0 LUNDY S LANE COMMUNITY IMPROVEMENT PLAN STUDY AGENDA :00 to :0pm: Open House :0 to :pm: Presentation : to :00pm: Individual paced workshop with the Study Team PUBLIC
ENVIRONMENTAL NOISE ASSESSMENT
 ENVIRONMENTAL NOISE ASSESSMENT LAKEVIEW BOULEVARD ENVIRONMENTAL ASSESSMENT LAKEVIEW BOULEVARD BETWEEN POPLAR AVENUE AND MAPLE AVENUE TOWN OF AJAX PREPARED FOR: TMIG February 2017 Y1610 TABLE OF CONTENTS
Greenhouse Gas Emission Reduction Strategies
 Greenhouse Gas Emission Reduction Strategies 2011 ITE Quad Conference April 18 19, 2011, Embassy Suites; Lynnwood, WA Victor L. Sl Salemann, PE Senior Associate David Evans and Associates Bellevue, WA
APPENDIX H: TRAVEL DEMAND MODEL VALIDATION AND ANALYSIS
 APPENDIX H: TRAVEL DEMAND MODEL VALIDATION AND ANALYSIS Travel demand models (TDM) simulate current travel conditions and forecast future travel patterns and conditions based on planned system improvements
Mayor Savage and Members of Halifax Regional Council. Original Signed
 HALIFAX P.O. Box 1749 Halifax, Nova Scotia B3J 3A5 Canada Item No. 14.3.1 Halifax Regional Council December 1, 2015 TO: SUBMITTED BY: Mayor Savage and Members of Halifax Regional Council Original Signed
Qualitative Hot Spot Analysis for PM2.5 February 4, 2008
 Technical Guidance for TG-POL-01-08 Qualitative Hot Spot Analysis for PM2.5 February 4, 2008 This technical guidance provides general guidelines for performance of a qualitative hot spot analysis for particulate
LOCATION AND DESIGN DIVISION
 VIRGINIA DEPARTMENT OF TRANSPORTATION LOCATION AND DESIGN DIVISION INSTRUCTIONAL AND INFORMATIONAL MEMORANDUM GENERAL SUBJECT: Interstate, NHS Non-Interstate and Non-NHS (IJR / IMR Guidance) SPECIFIC SUBJECT:
Appendix B. Benefit-Cost Technical Memorandum
 Appendix B Benefit-Cost Technical Memorandum This Page Left Blank Intentionally MEMORANDUM TO: FROM: Michael Kalnbach MnDOT District 1 Project Manager Graham Johnson, PE DATE: September 2, 2014 RE: TH
OVERVIEW ORDINANCE: ORD # APPLICATION: 2014C-002
 PROPOSED SMALL-SCALE FUTURE LAND USE MAP (FLUM) AMENDMENT OVERVIEW ORDINANCE: ORD # 2014-191 APPLICATION: 2014C-002 APPLICANT: PAUL M. HARDEN PROPERTY LOCATION: 8101 Southside Boulevard Acreage: 1.76 Acres
Executive Summary October 2017
 Executive Summary The King of Prussia Rail Draft Environmental Impact Statement/Draft Section 4(f) Evaluation (DEIS) describes and summarizes the transportation and environmental benefits and impacts of
Stage One Reference Design Enhancements. Date: 2 October Cabinet-in-Confidence
 Stage One Reference Design Enhancements Date: 2 October 2013 Introduction This paper provides further information regarding the proposed enhancements to the Reference Design that have been identified since
Scope of Work. Project Approach and Understanding. Task 1: Study Initiation and Administration
 Scope of Work Route 116/Hinesburg Growth Center Corridor Study Town of Hinesburg and CCRPC Project Approach and Understanding Route 116 through Hinesburg had seen substantial changes in the past 15 years,
November 8, RE: Harrah s Station Square Casino Transportation Analysis Detailed Traffic Impact Study Review. Dear Mr. Rowe:
 November 8, 2006 Mr. Glenn Rowe, P.E. Pennsylvania Department of Transportation Bureau of Highway Safety and Traffic Engineering Commonwealth Keystone Building 400 North Street, 6 th Floor Harrisburg,
200 th Street Interchange Review
 200 th Street Interchange Review September 7, 2001 Ministry of Transportation 200 th Street Interchange Review September 7, 2001 Prepared by Dirk Nyland P.Eng, Chief Engineer Ministry of Transportation
3 PROJECT DESCRIPTION
 3.1 PROJECT OVERVIEW 3 PROJECT DESCRIPTION The Rocklin 60 project (proposed project) includes the subdivision of 56.9 acres of land, construction of 179 single-family, detached dwelling units, and installation
To provide an update on the progress of the Peel Goods Movement Task Force and Peel Goods Movement Strategic Plan.
 8.4-1 REPORT Meeting Date: 2014-06-26 Regional Council For Information DATE: June 17, 2014 REPORT TITLE: PEEL GOODS MOVEMENT STRATEGIC PLAN UPDATE 2014 FROM: Dan Labrecque, Commissioner of Public Works
SR 29 Project Development & Environment Study. Presentation to SR 29 Stakeholders Advisory Committee. January 23, 2014
 SR 29 Project Development & Environment Study Presentation to SR 29 Stakeholders Advisory Committee January 23, 2014 Purpose and Need Enhancing Economic Competitiveness Improving Emergency Evacuation Capabilities
ADDENDUM TO THE EIR. Specifically, Section of the CEQA Guidelines states:
 ADDENDUM TO THE EIR Section 15160 of the CEQA Guidelines explains that there are several mechanisms, and variations in environmental documents, that can be tailored to different situations and intended
MDX Contract #: RFP MDX Work Program #: ETDM #: 11501
 SR 874/Don Shula Expressway Ramp Connector Project Development & Environment (PD&E) Study PUBLIC HEARING December 8, 2011 MDX Contract #: RFP-09-04 MDX Work Program #: 87410.011 ETDM #: 11501 1 This Public
TravelSmart: Planning for Sustainable Urban Transportation
 Case Studies in Sustainable Transportation KAMLOOPS, BRITISH COLUMBIA CASE STUDY 3 TravelSmart: Planning for Sustainable Urban Transportation Organization City of Kamloops Transportation Department, Community
Bonnie Doon Grade Separation
 6. 2 Bonnie Doon Grade Separation Recommendation: That the April 18, 2017, Integrated Infrastructure Services report CR_4461, be received for information. Report Summary This report provides information
Alico Road. Connector Study. Lee County Department of Transportation. Prepared by. Lee County, Florida
 Alico Road Connector Study Lee County Department of Transportation Lee County, Florida Prepared by July 2009 TABLE OF CONTENTS SECTION PAGE 1.0 INTRODUCTION... 1 1.1 Project Description and Purpose...
ENVIRONMENTAL ASSESSMENT. Trunk Highway 100 Reconstruction in St. Louis Park State Project: Minnesota Project Number: not yet available
 ENVIRONMENTAL ASSESSMENT Trunk Highway 100 Reconstruction in St. Louis Park State Project: 2734-33 Minnesota Project Number: not yet available (Highway Reference Point: 005+00.480 to 007+00.2) From West
City of Palo Alto (ID # 7047) City Council Staff Report
 City Council Staff Report") City of Palo Alto (ID # 7047) City Council Staff Report Report Type: Consent Calendar Meeting Date: 6/13/2016 Summary Title: East Palo Alto Comment Letter Title: Approval and Authorization for the City
City of Palo Alto (ID # 7047) City Council Staff Report Report Type: Consent Calendar Meeting Date: 6/13/2016 Summary Title: East Palo Alto Comment Letter Title: Approval and Authorization for the City
City of Oxnard. Public Works Integrated Master Plan
 City of Oxnard This document is released for the purpose of information exchange review and planning only under the authority of Hugh Steve McDonald, December 20, State of California, PE No. 44074 and
3. SYSTEM ANALYSIS Future (2031) AADT and SADT Estimates
 AADT and SADT Estimates") 3. SYSTEM ANALYSIS 3.1 Congestion Analysis As indicated in Section 2.1, a key component of the GTAW Corridor Planning and Environmental Assessment Study is the assessment of the inter-regional travel demands
3. SYSTEM ANALYSIS 3.1 Congestion Analysis As indicated in Section 2.1, a key component of the GTAW Corridor Planning and Environmental Assessment Study is the assessment of the inter-regional travel demands
Draft Environmental Assessment Terminal B/C Redevelopment, Secure National Hall, and Related Improvements
 JUNE 2016 RONALD REAGAN WASHINGTON NATIONAL AIRPORT Draft Environmental Assessment Terminal B/C Redevelopment, Secure National Hall, and Related Improvements PREPARED BY: Ricondo & Associates, Inc. IN
Rapid Transit in Winnipeg. Winnipeg TOD Summit November 17, 2014
 Rapid Transit in Winnipeg Winnipeg TOD Summit November 17, 2014 Presentation Overview Rapid Transit (RT) in Winnipeg What is RT? What are our RT plans? Near term Longer term Comments re: TOD OurWinnipeg
BOSTON REGION METROPOLITAN PLANNING ORGANIZATION
 PLANNING ORGANIZATIO BOSTON REGION MPO NMETROPOLITAN BOSTON REGION METROPOLITAN PLANNING ORGANIZATION Stephanie Pollack, MassDOT Secretary and CEO and MPO Chair Karl H. Quackenbush, Executive Director,
- - {,. Date. Planner
 - - - Planner Date {,. West Side Waterloo, Draft Plan of Subdivision and Zone Change Applications Page 2 EXECUTIVE SUMMARY: In 1985, the Region of Waterloo completed a comprehensive Land Needs Analysis
500 Interchange Design
 500 Interchange Design Table of Contents 501 Interchange Design... 5-1 July 2015 501.1 General... 5-1 501.2 Interchange Type... 5-1 501.2.1 General... 5-1 502 Interchange Design Considerations... 5-2 502.1
State of the Practice, Case Studies and Analysis Tools on Unconventional Intersection & Interchange Designs in Maryland
 State of the Practice, Case Studies and Analysis Tools on Unconventional Intersection & Interchange Designs in Maryland Saed Rahwanji and Minseok Kim Office of Traffic & Safety Maryland State Highway Administration
The rezoning application and proposed transportation facility warrants consideration.
 Date: November 11, 2014 To: Re: Chair and Members Planning & Development Committee PDE File Number: REZ1400020 275 Conception Bay South Bypass Road, Ward 5 Application to Rezone Land to Industrial General
Road Transport Upgrade through Kapiti. Transportation Review for Kapiti Coast District Council
 Transportation Review for Kapiti Coast District Council September 2009 Project: Title: Document Reference: Prepared by: Reviewed by: Revisions: Road Transport Upgrade through Kapiti Transportation Review
SLATER ROAD /I-5 INTERCHANGE IMPROVEMENT PROJECT. Application for FASTLANE Funding PROJECT SUMMARY TABLE. Interchange Improvements NO
 SLATER ROAD /I-5 INTERCHANGE IMPROVEMENT PROJECT PROJECT SUMMARY TABLE Project Name Was a FASTLANE application for this project submitted previously? If yes, what was the name of the project in the previous
REPORT /TA WORKING DRAFT NTS EDEN WESTWOOD TRANSPORT ASSESSMENT WORKING DRAFT NON TECHNICAL SUMMARY
 REPORT 62102063-200/TA WORKING DRAFT NTS EDEN WESTWOOD TRANSPORT ASSESSMENT WORKING DRAFT NON TECHNICAL SUMMARY CONSULTATION DRAFT AUGUST 2016 EDEN WESTWOOD TRANSPORT ASSESSMENT WORKING DRAFT NON TECHNICAL
State Route 8 Bridge Replacement Project
 OPEN HOUSE PUBLIC INVOLVEMENT MEETING Celebration Church 688 Dan Street, Akron, Ohio Tuesday, July 14, 2015 5:00 PM to 7:00 PM State Route 8 Bridge Replacement Project Existing Bridge Future Bridges: Steel
CITY OF REDLANDS MASTER PLAN OF DRAINAGE San Bernardino County, California
 CITY OF REDLANDS MASTER PLAN OF DRAINAGE San Bernardino County, California Prepared for City of Redlands 35 Cajon Street Redlands, California 92373 Prepared by 14725 Alton Parkway Irvine, CA 92618 Contact
Construction Alternative Screening with Regional Travel Demand Model
 Construction Alternative Screening with Regional Travel Demand Model By: Marty Milkovits (Corresponding Author) Cambridge Systematics, Inc. 100 CambridgePark Drive, Suite 400 Cambridge, MA 02140 Phone:
TYPE 2 CATEGORICAL EXCLUSION DETERMINATION FORM
 1. GENERAL INFORMATION County: Project Name: Project Limits STATE OF FLORIDA DEPARTMENT OF TRANSPORTATION TYPE 2 CATEGORICAL EXCLUSION DETERMINATION FORM Collier I-75 at SR 951 Interchange Improvement
3.14 TRANSPORTATION AND TRAFFIC
 3.14 TRANSPORTATION AND TRAFFIC 3.14.1 INTRODUCTION This section presents an overview of the existing traffic and circulation system in the area surrounding the project site. It also discusses the potential
1RUWKZHVW#:LFKLWD 0DMRU#,QYHVWPHQW#6WXG\
 1RUWKZHVW#:LFKLWD 0DMRU#,QYHVWPHQW#6WXG\ Executive Summary 3UHSDUHGýIRUã 3UHSDUHGýE\ã.DQVDVý'HSDUWPHQWýRI 7UDQVSRUWDWLRQ,QýDVVRFLDWLRQýZLWKã (DUWKý7HFKý,QFï EXECUTIVE SUMMARY Introduction This Northwest
CHAPTER 4 GRADE SEPARATIONS AND INTERCHANGES
 CHAPTER 4 GRADE SEPARATIONS AND INTERCHANGES 4.0 INTRODUCTION The ability to accommodate high volumes of intersecting traffic safely and efficiently through the arrangement of one or more interconnecting
TRANSPORTATION IMPACT ANALYSIS GUIDELINES
 TRANSPORTATION IMPACT ANALYSIS GUIDELINES SANTA CLARA COUNTY TRANSPORTATION AUTHORITY CONGESTION MANAGEMENT PROGRAM ADOPTED MARCH 2009 TABLE OF CONTENTS PART I - STATUTE AND AUTHORITY...1 CHAPTER 1. CMP
A+ ACADEMY HIGH SCHOOL
 TRAFFIC MANAGEMENT PLAN FOR A+ ACADEMY HIGH SCHOOL IN DALLAS, TEXAS Prepared for: A+ Charter Schools, Inc. 8225 Bruton Road Dallas, Texas 75217 Prepared by: Texas Registered Engineering Firm F-3199 400
Environmental Impact Statement for the Slave Falls Tramway Conversion Project
 Environmental Impact Statement for the Slave Falls Tramway Conversion Project Prepared for Submitted by 41844.101 March 2008 ENVIRONMENTAL IMPACT STATEMENT FOR THE SLAVE FALLS TRAMWAY CONVERSION PROJECT
3 INTERSTATES. The Carolina Crossroads Project Team Welcomes You
 The Carolina Crossroads Project Team Welcomes You 3 INTERSTATES + 12 = KEY INTERCHANGES We re here to: Discuss the Carolina Crossroads I-20/26/126 Corridor Project Gather your input on study issues We
LAND USE POLICIES BY COMMUNITY DESIGNATION
 137 2040 138 Land Use Policies by Community Designation As discussed earlier in Thrive MSP 2040, the Council assigns a community designation to each city and township. This designation indicates the overall
6.0 Indirect Effects and Cumulative Impacts
 6.0 Effects and Impacts 6.1 Introduction This chapter of the Draft EIS addresses potential indirect and cumulative impacts of the Bottineau Transitway project. effects are those that are caused by the
HORIZON 2030: Plan Projects November 2005
 Horizon PROJECTS 2030 Projects 10-1 10-2 The Horizon 2030 Project Information section is comprised of individual project information in alphabetical order by project name. The information provided for
SP Old Florida Investment Resources, LLC SMR Aggregates SR 64 Borrow Pit (DTS # )
") H.O. 03/24/14 SP-14-01 Old Florida Investment Resources, LLC SMR Aggregates SR 64 Borrow Pit (DTS #201400001) Request: Approval of a Special Permit for major earthmoving in the A (General Agriculture)
H.O. 03/24/14 SP-14-01 Old Florida Investment Resources, LLC SMR Aggregates SR 64 Borrow Pit (DTS #201400001) Request: Approval of a Special Permit for major earthmoving in the A (General Agriculture)
High-Speed Rail - Chicago to St. Louis Alton Regional Multimodal Transportation Center Project
 High-Speed Rail - Chicago to St. Louis Alton Regional Multimodal May 2012 Draft Report: Alternatives Screening Version 1.0 1.0 Introduction This document outlines the alternatives screening process used