Nature Structural and Molecular Biology: doi: /nsmb.2959
|
|
|
- Gloria Murphy
- 6 years ago
- Views:
Transcription
1
2 Supplementary Figure 1 EIciNAs were pulled down with an antibody to Pol II. (a) Western blot showing that pol II was efficiently pulled down with a pol II antibody in HeLa cell lysates. (b) The enrichment of 15 circnas in pol II CLIP was verified by qt-pc together with known pol II-associated U1 snna in HeLa cells. U7 snna was used as a negative control. CD1as is a circular NA and known microna sponge, which showed enrichment in Ago2 CLIP but not in pol II CLIP. (c)the same experiment as in b was performed with HEK293 cells, and the data also showed enrichment for circnas in pol II CLIP. (d) Pol II NA IP followed with DNase digestion treatment demonstrated that the association of circnas with pol II was abolished, indicating that pull down of EIciNAs by pol II is mediated by genomic DNA i.e., both pol II and EIciNAs might bind to chromatin for interaction. (e) T-PC gels show that CD1as is enriched but circeif3j and circpaip2 is not in Ago2 CLIP. (f) T-PC gels show that circcltc is expressed in HeLa cells but not in HEK293 cells although CLTC mna was expressed in both HeLa and HEK293 cells. T-PC primers (black arrows) for CLTC mna and circcltc are indicated beneath the gel. *, P value < 0.05, **, P value < P values were determined with the two-tailed Student s t-test. All data were from triplicate experiments. Error bars represent the s.e.m.
3
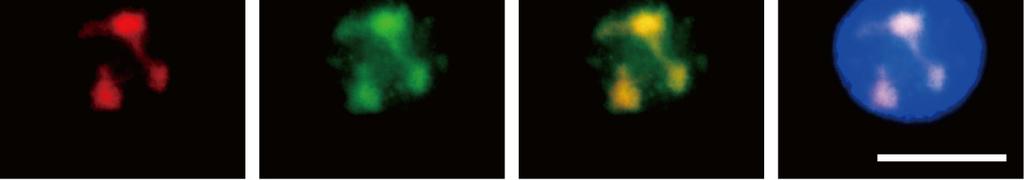
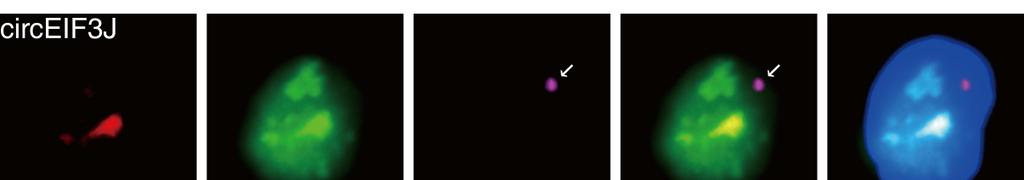
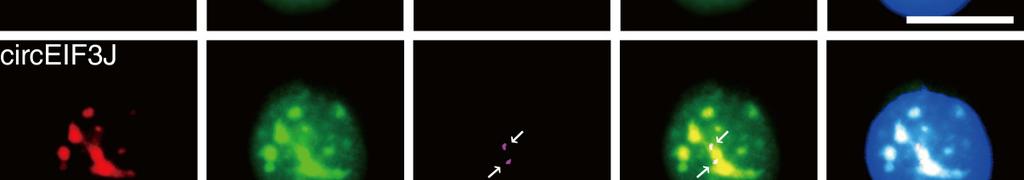
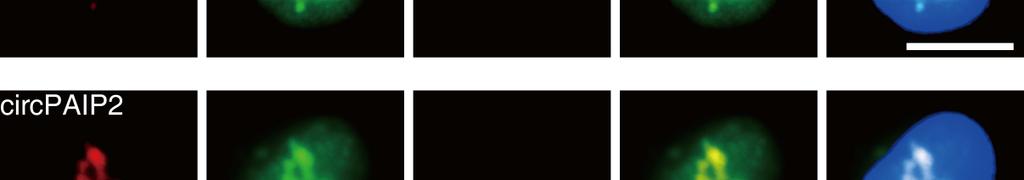
4 Supplementary Figure 2 Verification of circnas with T-PC and FISH. (a) T-PC was performed with divergent primers corresponding to intron (primer set 1) or exon (primer set 2) sequences in circeif3j and circpaip2. PC products show that introns were retained in circeif3j and circpaip2. (b) T-PC was performed with divergent primers corresponding to the 5 exon and upstream intron closest to the 3 exon. PC products show that at least the upstream intron closest to the 3 exon was retained in all of the other 13 circnas. (c) Separate channels are shown for FISH images for circeif3j and circpaip2 in Fig. 1f. From these and subsequent FISH images, it is clear that circeif3j and circpaip2 are localized in the nucleus, but both also have some cellular heterogeneity in the nuclear distribution and perhaps copy number. (d) Separate channels are shown for the FISH images of EIF3J and PAIP2 mna in Fig. 1f. (e) Double FISH of the parental gene loci and a downstream intron of the indicated circna in the parental gene pre-mna. Essentially no FISH signal of the downstream intron was observed for the downstream intron. For EIF3J, only one (indicated with a white arrowhead) out of 38 cells imaged showed a positive FISH signal for the downstream intron (n=38 cells for EIF3J, and 30 cells for PAIP2). (f) FISH Images of circnas with or without sina knockdown of the indicated circna. (g) Dual FISH of circnas and mna of the parental genes after treatment with Nase. No FISH signal was detected for the mna. For all FISH images for circnas, junction probes were used unless specified. All FISH images were with HEK293 cells.
5
6 Supplementary Figure 3 Overexpression of circna and effects of EIciNA or mna knockdown. (a) Gel images show the size of the T-PC products with the divergent primers. Except for the vector control and the circ-exon constructs, the overexpressed circnas were also intron retaining examined with the primer set 1. The T-PC bands show the size of the PC product, and the band intensity does not represent relative expression levels. The junction in the circna produced by the circeif3j_1 kb plasmid was different from that of circeif3j, and this difference is shown in the gel image and sequence diagram below. (b) Knockdown of circeif3j or circpaip2 with the sina resulted in a decrease in the parental gene mna level in HEK293 cells. (c) ASO sequences for the knockdown of circeif3j and circpaip2. circeif3j ASO was used to target the intron contained in circeif3j, and a control ASO targeted intron 4 in the EIF3J gene; circpaip2 ASO targeted the junction of circpaip2, and a scrambled ASO was used as a control. Sequences in black indicated DNA, and sequences in green indicate NA. (d) Knockdown of circeif3j had no effect on the mna level of PAIP2 and CTDSPL2 (the 5 neighbouring gene of EIF3J); knockdown of circpaip2 had no effect on the mna level of EIF3J or MAT3 (the 5 neighbouring gene of PAIP2). (e) sina knockdown efficiency of circeif3j and circpaip2 for the experiments shown in Fig 3c. (f) Nuclear run-on experiments showed that mna knockdown had no effect on the transcription of the indicated genes. sina knockdown efficiency of EIF3J or PAIP2 mna is shown below the nuclear run-on data. All data were from triplicate experiments. Error bars represent the s.e.m. **, P value < P values were determined with two-tailed Student s t-test.
7
8 Supplementary Figure 4 Effect of parental gene knockdown and circna overexpression. (a-c) Knockdown of EIF3J or PAIP2 mna with shna plasmids or sina had no effect on the level of circna. The diagrams below the bar figures show the positions of the shna- or sina-targeted sites in EIF3J or PAIP2. (d and e) Overexpression of circeif3j or circpaip2 with plasmids had no effect on the level of EIF3J or PAIP2 mna in HeLa (d) and HEK293 cells (e). All data were from triplicate experiments. Error bars represent the s.e.m. *, P value < 0.05, **, P value < P values were determined with the two-tailed Student s t-test.
9
10 Supplementary Figure 5 EIciNA pulldown. (a) Biotin-labeled oligos (circeif3j oligo and circpaip2 oligo) complementary to the junction and intron sequences of the circnas were used for pulldown experiments. Oligos complementary to a downstream exon were used as control (cie-con and cip-con). circeif3j and circpaip2 could be pulled down by circna oligos as demonstrated by comparison with control oligos. The pulldown efficiency of the circnas and U7 snna (using biotin-labeled oligos complementary to U7) as percentage of input is shown in the right panel. PremNA of EIF3J and PAIP2 was not detected (N. D.) in the pulldown materials as examined with primer pairs corresponding to the last intron and exon of the gene. Semi-quantitative T-PC gels for circna (115 bp amplicon for circeif3j, and 166 bp circpaip2) and parental gene mna (97 bp amplicon for EIF3J mna, and 147 bp PAIP2) from the pulldown experiments are shown below. (b) Enrichment of U1, U2, U4, U5, and U6 snna in pol II CLIP was verified by qt-pc using HeLa cells. U7 snna and 5s rna were used as negative controls. (c) T-PC gel of U2 snna co-precipitated with circna. (d) Interactions between molecules were crosslinked, pol II was pre-cleared by immunoprecipitation (7.7% pol II remained), and pulldown of the circnas still yielded a significant amount of U1 snna compared with a pulldown without pol II pre-clearing. This result indicates that the interaction between U1 snna and circeif3j or circpaip2 does not necessarily require the presence of pol II. In contrast, it appears that most, if not all, U2 snna may interact with circna indirectly via association with pol II. (e and f) The pulldown experiments were carried out with Biotin-labeled oligos against the exonic sequences in the EIciNA (cieif3j-e oligo and cipaip2-e oligo); Oligos complementary to downstream exons in the mna were used as control (cie-con-e and cip-con- E). Similar results were obtained as compared to data with exon-intron oligos, although the pulldown efficiency of cieif3j-e oligo and cipaip2-e oligo was lower. N.D. (not detected, CT>35). All data were from triplicate experiments. Error bars represent the s.e.m. **, P value < P values were determined with a two-tailed Student s t-test.
11
12 Supplementary Figure 6 ChIP of circna. (a) PC gels show that CHIP of the indicated circnas could pull down the promoters of corresponding parent genes (up panel) but not the promoters of the corresponding neighbouring genes (lower panel). peif3j (B), the B site shown in Fig. 3d was examined; ppaip2 (D), the D site shown in Fig. 3d was examined. Promoter sites for CTDSPL2 and MAT3 are shown in the diagram below the gel images. (b) Generally, gene bodies corresponding to parent genes could not be pulled down with CHIP. One site for each gene body (D site for EIF3J; G site for PAIP2) showed some enrichment although to lesser degree compared with the enrichment found at the promoter (Fig. 5d). D for EIF3J and G for PAIP2 are sites in the large introns just upstream of the circna sequences. Sites examined in the gene body are shown below the bar figures. Error bars represent the s.e.m. * P value < 0.05, P values were determined with a two-tailed Student s t-test. (c) ChIP results using the U1A, U1C, U2AF35, or U2AF65 antibodies for the promoter of the neighbouring genes (CTDSPL2 for EIF3J and MAT3 for PAIP2) are shown as a comparison for Fig. 3f. These results indicate that U1 snnp (U1A & U1C) binds to promoters of genes such as EIF3J and PAIP2 but not to the promoters of CTDSPL2 and MAT3. All data were from triplicate experiments.


13
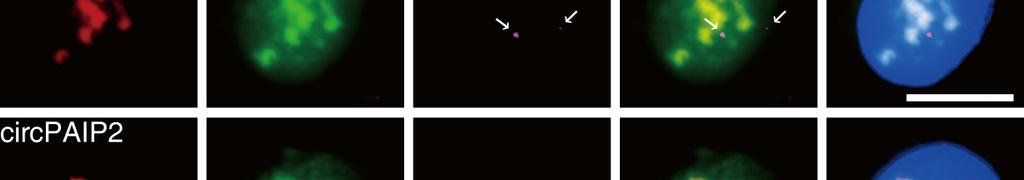
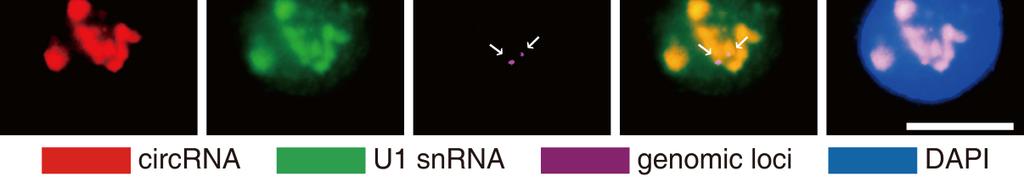
14 Supplementary Figure 7 FISH images of circna, U1 snna and parental gene loci. (a) Additional representative Dual FISH images of circna and U1 snna. The Y/G ratio (Y refers to the yellow area, which is the colocalisation signal of circna and U1 snna; G refers to the green area and U1 snna signal) and the Y/ ratio ( refers to the red area and the circna signal) were calculated for each cell, and the data shown in Fig. 3g are the average ± standard deviation. n=80 cells for each circna. (b) epresentative FISH images for circna (red)/ U1 snna(green) /parent genomic loci (purple). The parental genomic loci are indicated with white arrowheads. For each circna, the upper panels provide examples in which the parental genomic loci are not localised to the circna (red)/ U1 snna(green) enriched region. The lower panels demonstrate examples in which parental genomic loci are localised to circna (red)/ U1 snna (green) enriched regions (same situation as shown in Fig. 4f). In ~65.4% (for EIF3J) and ~51.3% of cells (for PAIP2), the two parent gene loci are localised to regions concentrated with EIciNA and U1 snna (n=52 cells for EIF3J, 39 cells for PAIP2). FISH images capture the NA locations and genomic loci at a particular moment, and we speculate that the localisation of the genomic loci and/or NA in the nucleus may be dynamic. FISH signals for circna were detected with a junction probe.
15
16 Supplementary Figure 8 ChIP assay results. (a) Flow chart of the experimental setup for pol II, U1A, and U1C ChIP after sina knockdown. (b) Semiquantitative PC corresponding to the real-time PC results shown in Fig. 6e. (c) Association between pol II (pol II ChIP) and the gene body decreased upon sina-mediated knockdown of circna. eal-time PC results are shown, and the sites examined within the gene body are the same as those shown in Supplementary Figure. 6b. All data are from triplicate experiments. Error bars represent the s.e.m. *, P value < 0.05, and **, P value < P values were determined with a two-tailed Student s t-test. (d) sina-mediated knockdown of circeif3j had no effect on the association between pol II and the PAIP2 gene body or vice versa. (e) Binding of pol II to parental gene promoters was not altered by knockdown of parental mna. The sites examined within the gene promoter are the same as those shown in Fig. 5d.
17 Supplementary Table circular NAs with top reads # name chromosome start end distance of splice site reads (Pol II/IgG) DNA coding strand 1 circeif3j chr /0 + 2 circpaip2 chr /0 + 3 circsc1 chr /0 + 4 circfundc1 chrx /0-5 circmie1 chr /0 + 6 circss1 chr /0-7 circwd60 chr /0 + 8 circbm33 chr /0 + 9 circman1a2-1 chr / circman1a2-2 chr / circnap1l4 chr /0-12 circbptf chr / circman1a2-3 chr / circcltc chr / circcdk11b chr /2 -
18 Supplementary Table 2. circnas from Pol II CLIP Pol II CLIP seq # chrom start end n_reads strand n_uniq best_q ual_a best_q ual_b spliced_at _begin distance_o f_splicesit e 1 chr chr E chr E chr E chr E chr E chr chr chrx chr chr chr E chr E chr chr chr E chr chr E chr E chr chr chr E chr E chr chr chr E chr E chr chr chr chr E chr chrx chr chr
19 36 chr E chr chr chr E chr chr chr chr chr E chr E chrun chrun chr chr E chr E chr chr chr chrun chrun chr chr E chr chr chrun chr chr chr chr chr E chr E chr chr E chr E chr chr E chr chr chr chr E chr chr chr E chr
20 80 chr chr chr chr E chr chr chr chr chr chr chr chr chr chr chr E chr chr chr E chr E chr chr chr E chr E chr chr chr chr chr chr chr chr E chr chr chr chr E chr chr All reads have only one breakpoints. chrun means chrun_gl
21 Supplementary Table 3. circnas from IgG control IgG CLIP seq # chro m start end n_read s strand n_uniq best_ qual_ A best_ qual_ B spliced_ at_begin distance_ of_splicesi te 1 chr5 1.4E E chr6 1.4E E chr2 7.2E chr19 4.2E chr3 1E+08 1E chr2 5.8E chr5 1.7E E chr17 4.9E chr10 1E E chr3 4.1E chr13 1.1E E chr1 1.2E E chr12 1E E chr2 1.1E E chr3 1.3E E chrx 1.8E chr13 9.6E chr4 4E chr20 1.8E chr6 1.5E E chrun chr2 2.9E chr18 1.9E chr6 4.3E chr8 1.4E E chr All reads have only one breakpoints. chrun means chrun_gl
22 Supplementary Table 4. Oligos used in the study Oligo name Sequence (5' - 3') Purpose Amplicon circeif3j_div-f circeif3j_div- AAAAGAGAAAGAACGGCAACA CCTGGTTTTACTTCTGCTTCC Divergent primers for eal-time PC and T-PC detection of circeif3j in cdna or genomic DNA(gDNA) 115 bp circpaip2_div-f circpaip2_div- AGCTCGAGATCTCCCACAAA ACTGCTGCGACTTGGATCTT Divergent primers for eal-time PC and T-PC detection of circpaip2 in cdna or genomic DNA(gDNA) 166 bp circfundc1_div- TGATTTCAGGTGCTGCTTTG F circfundc1_div- AGCATTTTGCCATCTGAAGC hsa-circna2_div- TGTGGGAAGCAAGGAGGAACTT F GA hsa-circna2_div- TCTTGAAGTGAGCTGTGTCAGG CA Divergent primers for eal-time PC and T-PC detection of circfundc1 in cdna or genomic DNA(gDNA) Divergent primers for eal-time PC and T-PC detection of hsacircna2 in cdna or genomic DNA(gDNA) 180 bp 130 bp β-actin_div-f β-actin_div- AAAGGCGAGGCTCTGTGCT GGGCTTACCTGTACACTGACTTG A Divergent primers for T-PC detection of circular β-actin in cdna or genomic DNA(gDNA) circeif3j_con-f circeif3j_con- AGCTGGGAAAGGTTTGGTCT TCTTGCCTTTTCTTCTGTTGC convergent primers for T-PC detection of circeif3j in cdna or gdna 187 bp circpaip2_con-f circpaip2_con- TCCTTAGCATGGAAGCAGAAA CCTCTTCCAGCATTTCTTGG convergent primers for T-PC detection of circpaip2 in cdna or gdna 199 bp circfundc1_con- CCCGGTCACATTTTCTGCTA F circfundc1_con- GCAGCACCTGAAATCAACAA hsa-circna2_con- CAGTAGTGGTAATAGCCAAAGG F AGA hsa-circna2_con- CAATCAGTCTTTTTCATCCTGTT TT convergent primers for T-PC detection of circfundc1 in cdna or gdna convergent primers for T-PC detection of hsa-circna2 in cdna or gdna 125 bp 170 bp β-actin_con-f β-actin_con- TTGTTACAGGAAGTCCCTTGCC) ATGCTATCACCTCCCCTGTGTG convergent primers for T-PC and real-time PC detection of β-actin in cdna or gdna 101 bp circsc1-f circsc1- TATGGCTCCAGAAGGAAACG GGACCGTCTACGGTGTTTCT circsc1 175 bp
23 circmie1-f circmie1- GATTATGGTGGGCTCCATGT TTCCTCTTCTTCCTCTTCCTCA circmie1 173 bp circss1-f circss1- TTGTGCCACTGCTAACAAGC GGAAGAAGATGTGTCTGGTGAA circss1 100 bp circwd60-f circwd60- GAAAGATGAAGACTCTGAAAGA GG CTGAGGTCATCTGCTTTCCA circwd bp circbm33-f circbm33- CCACGAAGCTGAGTTGACAG GCCAGATAGCAAATCTTCTCCA circbm bp circman1a2-1-f circman1a2-1- ATGGGCAAAGATGGATTGAA TGCTCGAATTTCCTCTCTTGA circman1a bp circman1a2-2-f circman1a2-2- GGAGGCCTACTTGCAGCATA GCTTCTTCCAAGGCCTTCTC circman1a bp circman1a2-3-f circman1a2-3- GCAATTGGCTGAGAAACTCC GCTTCTTCCAAGGCCTTCTC circman1a bp circnap1l4-f circnap1l4- TCCACGGAATCTGAAGGAAC GGAGAAGACGAGGATGATGC circnap1l4 108 bp circbptf-f circbptf- TCCAAGTGACTCCCCATTTT CTTCTGCTGGACCCACACTT circbptf 192 bp circcltc-f circcltc- TGCCCTATTTCATCCAGGTC GGGCCTGCTCTCCTACTTTT and circcltc 150 bp circcdk11b-f circcdk11b- TGGTTTGATGGCCAAAGAAT CCGCATGGAGATCACAATAA circcdk11b 100 bp CD1as-F CD1as- AACTACCCAGTCTTCCATCA AGACTTGAAGTCGCTGGAAG CD1as 168 bp
24 U1-F U1- CTCGCTTCGGCAGCACATAT ACACGCAAATTCGTGAAGCG U1 NA 164 bp U2-F U2- CTCGGCCTTTTGGCTAAGAT TATTCCATCTCCCTGCTCCA U2 NA 116bp U4-F U4- TGGCAGTATCGTAGCCAATG CTGTCAAAAATTGCCAGTGC U4 NA 117bp U5-F U5- TGGTTTCTCTTCAGATCGCATA CAAAGCAAGGCCTCAAAAA U5 NA 102bp U6-F U6- ACTCTTACCTCGGCAGGGGAG GGAAAGCGCGAACGCAGTCC U6 NA 92 bp U7-F U7- CAGTGTTACAGCTCTTTTAG AGGGGCTTTCCGGTAAAAAG U7 NA 63bp 5s rna-f 5s rna- CCTACAGCACCCGGTATTC CTACGGCCATACCACCCTG 5s rna 121bp 7SK-F TGATCGCCAGGGTTGATT 7SK- GGGATGGTCGTCCTCTTC eal-time PC for 7SK NA GAPDH-F GAPDH- CCACTCCTCCACCTTTGAC ACCCTGTTGCTGTAGCCA eal-time PC for GAPDH mna EIF3J-F EIF3J- TTGGAAGTCTTAGTTCGAGATGT G TTCACTGCAAAGCACAGTCA EIF3J mna 97bp PAIP2-F PAIP2- AGCTCGAGATCTCCCACAAA TTCACCCCAGGAACAAACTC PAIP2 mna 147bp pre-eif3j-f pre-eif3j- CCAGATAAGATGCCCATAGCA TTTAATCCCCCTCCAGGAAC eal-time PC for EIF3J pre-mna
25 pre-paip2-f pre-paip2- GGAAGATGTTTTTGCATGAGG TCCTTTGCATTTGGATTCAG eal-time PC for PAIP2 premna CLTC-F CLTC- AAGCTCATCTTTGGGCAGAA ACGGTTTCACCAGTGGTAGC T-PC for CLTC mna 291bp CTDSPL2-F CTDSPL2- GAATGAAACCGGCTTGTTGT TCTCCTGCTCTTGGTGTTGA eal-time PC for CTDSPL2 mna MAT3-F MAT3- CCATGGACTCTTACCGAAGG GACGACTGTGACTTGCTCCA eal-time PC for MAT3 mna promoter-eif3j-a- F promoter-eif3j-a- promoter-eif3j-b- F promoter-eif3j-b- promoter-eif3j-c- F promoter-eif3j-c- promoter-eif3j-d- F promoter-eif3j-d- TGCTTTTTGTGGCAGTCATC GAGGCCAGCACATTGATTTT AAGGGAAAAGCCTCGAAGAC GACCCCAGAGGGAGTCGT ACAGTGACCAGAGGGACAGC GGAAACGTAAGTGCCAGGAA CAGCACCACGAACTCCAGTA GTAAGAAGTGGGCGGGGAAC eal-time PC for promoter of EIF3J gene promoter of EIF3J gene promoter of EIF3J gene eal-time PC for promoter of EIF3J gene 169bp 134bp promoter-eif3j-e-f GTCAGCCACGGTCCCATC promoter-eif3j-e- AGCGTGTGTGAGAGGGAGAG promoter-paip2-a- F CAGGAAGGAAGCATGGGTAA promoter-paip2-a- CTGGATGCAAACGCAAAATA promoter-paip2-b- F GTGCCTGCACATGTCTGAGT promoter-paip2-b- ACCCATACACACCCCAAGAA promoter-paip2-c- F GTCAGGGTGCTCTTCAGTCC promoter-paip2-c- TTCTCTCTGGAAGGCAGGAA eal-time PC for the first exon of EIF3J gene eal-time PC for promoter of PAIP2 gene eal-time PC for promoter of PAIP2 gene eal-time PC for promoter of PAIP2 gene
26 promoter-paip2-d- F AGCTCTCTATCCGGGTCCTC promoter-paip2-d- GCAGGCGTAAAGTGGGTAGA promoter-paip2-e- F AGCTGACAGCCTTTGACGTT promoter-paip2-e- CAAACACAACCTACGCCAGA promoter of PAIP2 gene eal-time PC for the first exon of PAIP2 gene 165bp pctdspl2_a-f pctdspl2_a- TCAGCCTCTCTTGCCATCTT GTGTTGCAGGGGAAGAGTGT eal-time PC for promoter of CTDSPL2 gene pctdspl2_b-f pctdspl2_b- ACAAAAATTAGCCGGTCGTG ATACTGCCTTCCCCAAAGGT eal-time PC for promoter of CTDSPL2 gene pctdspl2_c-f pctdspl2_c- AGGCTTGGTTTTCCGATACC CCTATGTTGGCGGTGATTCT promoter of CTDSPL2 gene 157bp pctdspl2_d-f pctdspl2_d- ATGAGCTGGAAAGGGAACCT TAGGTGGAGCTGAGGGGATA eal-time PC for promoter of CTDSPL2 gene pctdspl2_e-f pctdspl2_e- CTACGGAGGCCCCTAATGTA CCGTGAAGAGCGTTGAAGTT eal-time PC for the first exon of CTDSPL2 gene pmat3_a-f pmat3_a- CTGCATAGCTCCCTGTCCTC TTTCGCTTTCTTTCCTTCCA eal-time PC for promoter of MAT3 gene pmat3_b-f pmat3_b- CGGATGTGGGCATTGATTAT CATAGGCTCTGGTTGGGAAA eal-time PC for promoter of MAT3 gene pmat3_c-f pmat3_c- TTGTAGGCCTTCCACTCTGG GTCAGGCAGAGTCCTTGGTC promoter of MAT3 gene 132bp pmat3_d-f pmat3_d- TGCAGAGGTCAGCAGTAGGA TCCCACGCATATCCTTTTTC eal-time PC for promoter of MAT3 gene pmat3_e-f pmat3_e- TGGCTCCACTAGGACACACA GCAGAGGTGAACCTGCTTCT eal-time PC for the first exon of MAT3 gene
27 EIF3J-A'-F EIF3J-A'- ACGAGGACGAGGACGTCAAG AAGCGGAGGGGAAGAGAG EIF3J gene EIF3J-B'-F EIF3J-B'- ATGTGTGGGCCGAAGACT CGATGCTGTCACCTTTCGT EIF3J gene EIF3J-C'-F EIF3J-C'- TCCTCAGCCTCCTAAAATGC AGCCTTGTCTGCAACTCCTC EIF3J gene EIF3J-D'-F EIF3J-D'- CTCAGCCTCCCAAGTAGCTG AGGCAGATCACGAGGTCAAG EIF3J gene EIF3J-E'-F EIF3J-E'- CCATGCCCACCTAATTTTTG CCTTCATGGATCCCACTCTC EIF3J gene EIF3J-F'-F EIF3J-F'- CAGAACGCTCACAAAATGGA GGCAGGGCTTAGATCATTCA EIF3J gene EIF3J-G'-F EIF3J-G'- AGACCATCCTGGCTAACACG GCCTCCTGAGTTCACACCAT EIF3J gene EIF3J-H'-F EIF3J-H'- GCGAGGGCTACAGGTGAATA TGGTGGTGGCATGTATCTGT EIF3J gene EIF3J-I'-F EIF3J-I'- ACTGGGGGTGTGTTAATGGA AACACACCATTGCTCAACCA EIF3J gene EIF3J-J'-F EIF3J-J'- AAGTGGAAAACAAGACCATCAT C TCTTAGCCCTTGTCTGCCTTA EIF3J gene PAIP2-A'-F PAIP2-A'- TTTCACCCTCTTTTGGTCAGA TCAACCAAATTGCTGTGCTAA PAIP2 gene PAIP2-B'-F PAIP2-B'- ACCTCTGCCCCCTTGTAATC ACTTGCTCTGCCCATTTCAC PAIP2 gene
28 PAIP2-C'-F PAIP2-C'- TCTCCCTCTGATGCTCAGGT CCCCGTCTCTAAAAATGCAA PAIP2 gene PAIP2-D'-F PAIP2-D'- GGGAGGCAGAGGTTACAGTG CCACCACACCTGGCTAACTT PAIP2 gene PAIP2-E'-F PAIP2-E'- CCTGGGCAACAAGAATGAAA GGCCCTAATTTGCTTGAATG PAIP2 gene PAIP2-F'-F PAIP2-F'- CTCCCTTGGGGACAGTTTCT TGTTGGGATTACAGGCGTAAG PAIP2 gene PAIP2-G'-F PAIP2-G'- ACGTGGTGAAACCCTGTCTC TGCCTCCTGGTTCAAGAGAT PAIP2 gene PAIP2-H'-F PAIP2-H'- CCAGGCTTAACTGCTTACGG AAGGCAGTGGTTTCCACATC PAIP2 gene PAIP2-I'-F PAIP2-I'- TGGTGTCGTTGCACTCTAGC GACCCAGCCAGTTCTCACTC PAIP2 gene PAIP2-J'-F PAIP2-J'- GAGTGGTGCTTTTCCTTGCT GGCAGCTTAACCTACCCAAA PAIP2 gene circeif3j_intron-f CAAGTGTCCTTCCATTCCCA circeif3j_intron- GAGCGTTCTGTCATTTGTCT primer set 1 for circeif3j Full length PC 620bp circeif3j_exon4_ DivF circeif3j_exon4_ Div AACGGCAACAGAAGAAAAGG TTTTTCTTTTCTGAAATTTTTACC T primer set 2 for circeif3j Full length PC 622bp circpaip2-intron-f AGAGCTCTCAGATGGTTCCA circpaip2-intron- TCCTGATTCAGACATCTCTA primer set 1 for circpaip2 Full length PC 956bp circpaip2_exon3_ DivF circpaip2_exon3_ Div GACCAAATCCAAGACCAGTTT CGAGCTGGAATAAACCATTCA primer set 2 for circpaip2 Full length PC 968bp
29 circsc1_intron- F circsc1_intron- circfundc1_intro n-f circfundc1_intro n- circmie1_intron- F circmie1_intron- GCTTCCAGGAAACAGTGAGA ACGAGGCTGAAGATCTCTGG CCCGGTCACATTTTCTGCTA GCCAGAGTCTCTAGGGCAAG TTATGGTGGGCTCCATGTTT ACAGGGGATTTCCAATTTTT divergent primers corresponding to the 5 exon and the upstream intron closest to the 3 exon of circsc1 divergent primers corresponding to the 5 exon and the upstream intron closest to the 3 exon of circfundc1 divergent primers corresponding to the 5 exon and the upstream intron closest to the 3 exon of circmie1 426bp 330bp 399bp circss1_intron-f circss1_intron- TTGTGCCACTGCTAACAAGC TGAGTCGGAGTCTTGCATTG divergent primers corresponding to the 5 exon and the upstream intron closest to the 3 exon of circss1 437bp circwd60_intron- TCTTGAGTTGGAGGCATGTG F circwd60_intron- CTGAGGTCATCTGCTTTCCAG circbm33_intron- GGGCTATATGCATTGCCAGT F circbm33_intron- GCCAGATAGCAAATCTTCTCCA circman1a2- TACACTGAATGTGAAGGGAATC 1_Intron-F TT circman1a2- AATAGGGACTGGTGGCAGTG 1_Intron- circman1a2- AATGGCTTGTTGGTTTCAGG 2_Intron-F circman1a2- AATAGGGACTGGTGGCAGTG 2_Intron- circnap1l4_intron CCCTCAATCCACAAAACAAAA -F circnap1l4_intron GGAGAAGACGAGGATGATGC - circbptf_intron-f TAACCTCCAGGGTGAACCAG circbptf_intron- CTTCTGCTGGACCCACACTT divergent primers corresponding to the 5 exon and the upstream intron closest to the 3 exon of circwd60 divergent primers corresponding to the 5 exon and the upstream intron closest to the 3 exon of circbm33 divergent primers corresponding to the 5 exon and the upstream intron closest to the 3 exon of circman1a2-1 divergent primers corresponding to the 5 exon and the upstream intron closest to the 3 exon of circman1a2-2 divergent primers corresponding to the 5 exon and the upstream intron closest to the 3 exon of circnap1l4 divergent primers corresponding to the 5 exon and the upstream intron closest to the 3 exon of circbptf 284bp 618bp 400bp 403bp 406bp 429bp circman1a2-3_intron-f circman1a2-3_intron- TCTCTGATTGCCAAATGCTG AATAGGGACTGGTGGCAGTG divergent primers corresponding to the 5 exon and the upstream intron closest to the 3 exon of circman1a bp circcltc_intron-f CCCCTTGCAAAACCAGATT circcltc_intron- GGGCCTGCTCTCCTACTTTT divergent primers corresponding to the 5 exon and the upstream intron closest to the 3 exon of circcltc 437bp
30 circcdk11b_intro n-f circcdk11b_intro n- Bio-ciE-con Bio-circEIF3J-1 Bio-circEIF3J-2 Bio-circEIF3J-3 Bio-circEIF3J-4 Bio-ciE-con-E-1 Bio-ciE-con-E-2 Bio-ciE-con-E-3 Bio-ciE-con-E-4 Bio-ciE-con-E-5 Bio-circEIF3J-E-1 Bio-circEIF3J-E-2 Bio-circEIF3J-E-3 Bio-circEIF3J-E-4 Bio-circEIF3J-E-5 Bio-ciP-con Bio-circPAIP2-1 Bio-circPAIP2-2 Bio-circPAIP2-3 Bio-circPAIP2-4 Bio-ciP-con-E-1 Bio-ciP-con-E-2 Bio-ciP-con-E-3 GCTCTCTCTGGTTTTCGGTCT divergent primers corresponding to the 5 exon and the upstream intron CCGCATGGAGATCACAATAA closest to the 3 exon of circcdk11b TTCATGGTGGCTTTTAATCCCCC TCCAGGA As control of circeif3j pull-down GTCATCCCAGTTATCCCTCTTTT 5'-biotin-labeled oligonucleotide for TAATTTC circeif3j pull-down CTTCTGCTTCCTCTTTTTTTTCAT 5'-biotin-labeled oligonucleotide for CATCAT circeif3j pull-down TTTCTTCTTGCCTTTTCTTCTGTT 5'-biotin-labeled oligonucleotide for GCCGTT circeif3j pull-down CTTCTCTGCTATTTTTTTCTTTTC 5'-biotin-labeled oligonucleotide for TGAAAT circeif3j pull-down TTCATGGTGGCTTTTAATCCCCC TCCAGGA As control of circeif3j pull-down CCTTTGCTAATTCGAGGTCTGAC As control of circeif3j pull-down TCTTCCT CTGGTGTTAGCACTTTAGGTTCT TCGGGTT As control of circeif3j pull-down CACATCTCGAACTAAGACTTCC AAAAAACT As control of circeif3j pull-down GTCATCTCTTGAAGATGGGTTCA As control of circeif3j pull-down TAGCATC GTCATCCCAGTTATCCCTCTTTT 5'-biotin-labeled oligonucleotide for TAATTTC circeif3j pull-down GGTTTTACTTCTGCTTCCTCTTTT 5'-biotin-labeled oligonucleotide for TTTTCA circeif3j pull-down TTTTTCATCATCATCGTCATCCC 5'-biotin-labeled oligonucleotide for AGTTATC circeif3j pull-down CTTGCCTTTTCTTCTGTTGCCGT 5'-biotin-labeled oligonucleotide for TCTTTCT circeif3j pull-down CTTTTATCTTCTCTGCTATTTTTT 5'-biotin-labeled oligonucleotide for TCTTTT circeif3j pull-down CTTCACCCCAGGAACAAACTCC TTTGCATT As control of circpaip2 pull-down GTTGTCGTTTTTAACCACAAGAT 5'-biotin-labeled oligonucleotide for CTTCCAG circpaip2 pull-down CCATCCACATGTACTCTGCAAAT 5'-biotin-labeled oligonucleotide for GGATTGT circpaip2 pull-down CTTGGGCTAGTACTGCTGCGACT 5'-biotin-labeled oligonucleotide for TGGATCT circpaip2 pull-down TGGTCCATAGTTTGTGGGAGATC 5'-biotin-labeled oligonucleotide for TCGAGCT circpaip2 pull-down CTTCACCCCAGGAACAAACTCC TTTGCATT As control of circpaip2 pull-down CAGCTGGATTATGGGTTGGTATT As control of circpaip2 pull-down GGTCATA GGCTGGACTGGCACTCATCTGCT As control of circpaip2 pull-down GACTAAC 456bp
31 Bio-ciP-con-E-4 Bio-ciP-con-E-5 Bio-circPAIP2-E-1 Bio-circPAIP2-E-2 Bio-circPAIP2-E-3 Bio-circPAIP2-E-4 Bio-circPAIP2-E-5 Bio-U7-probe1 Bio-U7-probe2 Bio-U7-probe3 circeif3j_exon-f circeif3j_exon- circeif3j_flanking -F circeif3j_flanking - circeif3j_1kb-f1 circeif3j_1kb-1 circeif3j_1kb-f2 circeif3j_1kb-2 circpaip2_exon-f circpaip2_exon- circpaip2_flankin g-f circpaip2_flankin g- circpaip2_1kb-f1 circpaip2_1kb-1 CATCAAGCCATGGGGCCAATTC TATTTTCA As control of circpaip2 pull-down GAAATTGTGCTACATCCACCAA AAGAGGGC As control of circpaip2 pull-down GTTGTCGTTTTTAACCACAAGAT 5'-biotin-labeled oligonucleotide for CTTCCAG circpaip2 pull-down CACATCTTCATTGATGATGCTTG 5'-biotin-labeled oligonucleotide for GGCTAGT circpaip2 pull-down TGCTGCGACTTGGATCTTTCATG 5'-biotin-labeled oligonucleotide for GCTGATG circpaip2 pull-down GTCATTAAACTGGTCTTGGATTT 5'-biotin-labeled oligonucleotide for GGTCCAT circpaip2 pull-down CTCTTCCAGCATTTCTTGGAAAC 5'-biotin-labeled oligonucleotide for AGCGTTC circpaip2 pull-down AGGGGCTTTCCGGTAAAAAGCC 5'-biotin-labeled oligonucleotide for AGAAAGCC U7 snna pull-down TACTAGACAAATTCTAAAAGAG 5'-biotin-labeled oligonucleotide for CTGTAACA U7 snna pull-down CGGTAAAAAGCCAGAAAGCCTA 5'-biotin-labeled oligonucleotide for CTAGACAA U7 snna pull-down GGGGTACCAAGGATAACTGGGA plasmid construction for TGACGATG circeif3j_exon and circeif3j_exon/intron TTCTTCTTGC GGGGTACCTTGTAGTGAGCCTA GATCATGCCATTG plasmid construction for CGGGATCCATAGCACATGGCAC circeif3j_flanking AGAAATGAACAA CCCAAGCTTGTGAGCTGAGATC GTGACATTGCAC plasmid construction for GGGGTACCACCCTCTTTTTAATT circeif3j_1kb TCTTCTTGC CGGGATCCGTGAGCTGAGATCG TGACATTGCAC plasmid construction for GGGGTACCCTTGCATGTTTGCTT circeif3j_1kb TTCTATGTGA GGGGTACCTCAGGTTAAAAACG plasmid construction for ACAACCAAC circpaip2_exon and circpaip2_exon/intron CCAGAGAAG TCAAGCTTTGCTGGGATTACAG GCATGA plasmid construction for GTGGATCCTCACAGGCATGTGC circpaip2_flanking TACCAT GGGGTACCTTCACCATGTTAGG CTGGTCTC plasmid construction for GGGGGCCCACCACAAGATCTTC circpaip2_1kb CAGAGAAG
32 circpaip2_1kb-f2 circpaip2_1kb-2 circeif3j(exon probe)-f circeif3j(exon probe)- circeif3j(intron probe)-f circeif3j(intron probe)- circpaip2(exon probe)-f circpaip2(exon probe)- circpaip2(intron probe)-f circpaip2(intron probe)- EIF3J_genomic loci-f1 EIF3J_genomic loci-1 EIF3J_genomic loci-f2 EIF3J_genomic loci-2 EIF3J_genomic loci-f3 EIF3J_genomic loci-3 PAIP2_genomic loci-f1 PAIP2_genomic loci-1 PAIP2_genomic loci-f2 PAIP2_genomic loci-2 PAIP2_genomic loci-f3 PAIP2_genomic loci-3 U1 NA_FISH-F U1 NA_FISH- CGGGATCCTTCACCATGTTAGGC TGGTCTC plasmid construction for GGGGGCCCGAACAACAGCACAG circpaip2_1kb TTAATTTAC AGGTAAAAATTTCAGAAAAG TAATACGACTCACTATAGGGCC TCTTTTTAATTTCTTC CTTGCTGTAT TTCTGTATGA TAATACGACTCACTATAGGGCC CTAAGATCCAAATATCTC GAGGAGTTATGGGAAGAAGA TAATACGACTCACTATAGGGCA AGATCTTCCAGAGAAGAG GGCTGCTGATTACTACCAGG TAATACGACTCACTATAGGGGA CTGCTCAATGGAACCATC CACTGCACCTGGCCTATTTA CATGTGCTACCACGAACTGG TTGCCACTCAGCTTCAAATG TATCGGCAAGACCCAGTCTC ACTGGGGGTGTGTTAATGGA AAGGCAGGCAGGTAACTTGA ATGACAGGAAGGAAGCATGG AACTGTGTGACCATGGCAAG CGACACCACACCTGGCTAC ACACTTCTTCCCTCCCCAAT GCAGAGTCTCACGACATGGA ACTGGGCCCATACTCAAGTG TAATACGACTCACTATAGGGCA GGGGAAAGCGCGAACGCA ATACTTACCTGGCAGGGGAG For Northern blot probe of both EIF3J mna and circeif3j For Northern blot probe of circeif3j only for Northern blot probe of both PAIP2 mna and circpaip2 for Northern blot probe of circpaip2 only For EIF3J loci DNA FISH probe For EIF3J loci DNA FISH probe For EIF3J loci DNA FISH probe For PAIP2 loci DNA FISH probe For PAIP2 loci DNA FISH probe For PAIP2 loci DNA FISH probe For U1 NA FISH probe
33 EIF3J_downstream intron_fish-f GTTCATTCTAGTCAGCAGTA EIF3J_downstream intron_fish- TAATACGACTCACTATAGGGGC TTGAATTCGGGAGGCAGA PAIP2_downstream ACCAGCCTGGCCAACGTGGT intron_fish-f PAIP2_downstream TAATACGACTCACTATAGGGCC intron_fish- TCCGCCTCCCAGATTCAA EIF3J mna_fish-f CAGATAAACTGCGGCTAAAG EIF3J mna_fish- CTTGAAGATGGGTTCATAGC PAIP2 mna_fish-f GGAGTTTGTTCCTGGGGTGA PAIP2 mna_fish- TAACACAGTGACAAGAGAGC circeif3j_junction probe_fish-f AAAAGAGAAAGAACGGCAACA circeif3j_junction probe_fish- CCTGGTTTTACTTCTGCTTCC circpaip2_junction probe_fish-f AGCTCGAGATCTCCCACAAA circpaip2_junction probe_fish-f ACTGCTGCGACTTGGATCTT circeif3j_intron probe_fish-f CTTGCTGTATTTCTGTATGA circeif3j_intron TAATACGACTCACTATAGGGCC probe_fish- CTAAGATCCAAATATCTC circpaip2_intron probe_fish-f GGCTGCTGATTACTACCAGG circpaip2_intron TAATACGACTCACTATAGGGGA probe_fish- CTGCTCAATGGAACCATC CTPSPL2_genomic loci-f1 CTTAATCGACCCAGTACTAA CTPSPL2_genomic loci-1 TGTCTGGCTTAGATATATGC CTPSPL2_genomic loci-f2 AGGTAGTTGACTGTGTGGTA CTPSPL2_genomic loci-2 CCAAGCTGGTCTTGAACTCC CTPSPL2_genomic loci-f3 ATGCCTGTAATCCCAGCTAC CTPSPL2_genomic loci-3 CCTGGTCAATATGGTGAAAC CTPSPL2_genomic loci-f4 ATCAGGTTGTTGCTGATGTT CTPSPL2_genomic loci-4 TCTAATTATCACGGAAATGC For EIF3J downstream intron (intron4) FISH probe For PAIP2 downstream intron (intron3) FISH probe For EIF3J mna FISH probe For PAIP2 mna FISH probe For of circeif3j NA probe against junction region For of circpaip2 NA probe against junction region circpaip2 NA probe against junction region For of circeif3j NA probe against intron region For of circpaip2 NA probe against intron region For CTPSPL2 loci DNA FISH probe For CTPSPL2 loci DNA FISH probe For CTPSPL2 loci DNA FISH probe For CTPSPL2 loci DNA FISH probe
34 PATL2_genomic loci-f1 PATL2_genomic loci-1 PATL2_genomic loci-f2 PATL2_genomic loci-2 PATL2_genomic loci-f3 PATL2_genomic loci-3 PATL2_genomic loci-f4 PATL2_genomic loci-4 MAT3_genomic loci-f1 MAT3_genomic loci-1 MAT3_genomic loci-f2 MAT3_genomic loci-2 MAT3_genomic loci-f3 MAT3_genomic loci-3 MAT3_genomic loci-f4 MAT3_genomic loci-4 POB1_genomic loci-f1 POB1_genomic loci-1 POB1_genomic loci-f2 POB1_genomic loci-2 GACACAGAGAAAAGTGGCTG AGTCAGTAAGGATGACATGG CCTTCCAGAGGCTGGCAATG TAGTAGTCTCAGTTCCATCA GTGCCATGTGGCTGACTTTG GCCAGGTGGCAACAGCGTTA ATTGCTGCTGATGTGAGTCT CCCAAGCCATTCAACCTAAG CTGGGTCTGTTTTACTCGTC AAGACATGAGCCACCACATC GAGCCCAGGAGTTGGAGACC CCTTGGCATCTGCCAACATG GCAATGGTGCCAGGTGCAAG CTTGTCTCTACTAAAGCCTG CTGGCCTGGAATGCTAATCT GCCTGAGTGAGACCTTGTCA TGCTCCTCACTCTACTGAAG GCTTGAAGGGCTTCGCCGTG CCAGCATCTTCCTTCAGTCA CTAAGAGCAGACTCGACAGC For PATL2 loci DNA FISH probe For PATL2 loci DNA FISH probe For PATL2 loci DNA FISH probe For PATL2 loci DNA FISH probe For MAT3 loci DNA FISH probe For MAT3 loci DNA FISH probe For MAT3 loci DNA FISH probe For MAT3 loci DNA FISH probe For POB1 loci DNA FISH probe For POB1 loci DNA FISH probe scramble sina UUCUCCGAACGUGUCACGU scramble sina control circeif3j sina UCAUCCCAGUUAUCCCUCU circeif3j sina circeif3j sinacontrol UCAUCCCAGUUAUCGGCUC circeif3j sina with 5nt mismatch circpaip2 sina-1 UUUAACCACAAGAUCUUCC circpaip2 sina circpaip2 sina1- control AAAUUGCACAAGAUCUUCC circpaip2 sina with 6nt mismatch
35 circpaip2 sina-2 UGUCGUUUUUAACCACAAG circpaip2 sina circpaip2 sina2- control UGUCGUUUUUAACGUGUUC circpaip2 sina with 6nt mismatch EIF3J sina AAGCACAGUCAGUGAAUUG EIF3J mna sina PAIP2 sina AAAUAUGCUUAACAGUUGG PAIP2 mna sina scramble ASO UUGCACTGTGCAAGCCUCUU scramble ASO control circeif3j ASO circeif3j ASO control circpaip2 ASO U1 AMO U2 AMO scramble AMO circeif3j AMO circeif3j control AMO AAGACATACTCACGAACAAU ASO targeted to the intron contained in the circeif3j CUACACAATGAGAGTGUAGA circeif3j control ASO targeted to intron4 of EIF3J gene CGUUUTTAACCACAAGAUCU ASO targeted to the junction of circpaip2 GGTATCTCCCCTGCCAGGTAAGT To block U1's binding to 5 splice AT sites in Exon/Intron TGATAAGAACAGATACTACACT To block U2's binding to 3' splice TGA sites in Exon/Intron CCTCTTACCTCAGTTACAATTTA control AMO for U1 AMO and U2 TA AMO CGCCCCAGTGGCTCACCTGGTTT TA AAAGTGGGAATGGAAGGACACT TGG To block U1's binding to 5 splice sites in Exon/Intron of circeif3j circeif3j control AMO targeted to intron of circeif3j circpaip2 AMO GTACAAAAAACTAACTTGTCTG TTG To block U1's binding to 5 splice sites in Exon/Intron of circpaip2 circpaip2 control AMO TTCCGTAAGCAGTTAAGCCTGGT AG circpaip2 control AMO targeted to intron of circpaip2
Supplementary Figure 1. NORAD expression in mouse (A) and dog (B). The black boxes indicate the position of the regions alignable to the 12 repeat
 and dog (B). The black boxes indicate the position of the regions alignable to the 12 repeat") Supplementary Figure 1. NORAD expression in mouse (A) and dog (B). The black boxes indicate the position of the regions alignable to the 12 repeat units in the human genome. Annotated transposable elements
Supplementary Figure 1. NORAD expression in mouse (A) and dog (B). The black boxes indicate the position of the regions alignable to the 12 repeat units in the human genome. Annotated transposable elements
Supplementary Figure 1
 Supplementary Figure 1 Supplementary Fig. 1 shrna mediated knockdown of ZRSR2 in K562 and 293T cells. (a) ZRSR2 transcript levels in stably transduced K562 cells were determined using qrt-pcr. GAPDH was
Nature Structural and Molecular Biology: doi: /nsmb Supplementary Figure 1. Validation of CDK9-inhibitor treatment.
 Supplementary Figure 1 Validation of CDK9-inhibitor treatment. (a) Schematic of GAPDH with the middle of the amplicons indicated in base pairs. The transcription start site (TSS) and the terminal polyadenylation
SUPPLEMENTARY INFORMATION
 DOI: 10.1038/ncb3240 Supplementary Figure 1 GBM cell lines display similar levels of p100 to p52 processing but respond differentially to TWEAK-induced TERT expression according to TERT promoter mutation
Fig. S1. Effect of p120-catenin overexpression on the interaction of SCUBE2 with E-cadherin. The expression plasmid encoding FLAG.
 Fig. S1. Effect of p120-catenin overexpression on the interaction of SCUBE2 with E-cadherin. The expression plasmid encoding FLAG.SCUBE2, E-cadherin.Myc, or HA.p120-catenin was transfected in a combination
Supplementary Figures
 Supplementary Figures Supplementary Figure 1 Experimental schema for the identification of circular RNAs in six normal tissues and seven cancerous tissues. Supplementary Fiure 2 Comparison of human circrnas
Nature Structural and Molecular Biology: doi: /nsmb Supplementary Figure 1
 Supplementary Figure 1 Distribution of mirnas between lncrna and protein-coding genes. Pie chart showing distribution of human mirna between protein coding and lncrna genes. To the right, lncrna mirna
Supplemental Figure legends Figure S1. (A) (B) (C) (D) Figure S2. Figure S3. (A-E) Figure S4. Figure S5. (A, C, E, G, I) (B, D, F, H, Figure S6.
 (B) (C) (D) Figure S2. Figure S3. (A-E) Figure S4. Figure S5. (A, C, E, G, I) (B, D, F, H, Figure S6.") Supplemental Figure legends Figure S1. Map-based cloning and complementation testing for ZOP1. (A) ZOP1 was mapped to a ~273-kb interval on Chromosome 1. In the interval, a single-nucleotide G to A substitution
Supplemental Figure legends Figure S1. Map-based cloning and complementation testing for ZOP1. (A) ZOP1 was mapped to a ~273-kb interval on Chromosome 1. In the interval, a single-nucleotide G to A substitution
e15 e14 3utr i13 K36me3 / H i4 ** ** ** ** ** tss IIIb K36me2 / H IIIb BCOR (% input)
") a Epithelial cells (2) Mesenchymal cells () Alternatively spliced region i13 e14 e15 / CycA 25 15 1 5 e14 e13-e14 - - K27me3 / H3 b 2.5 c v5 K36me3 / H3 d 3.5 2.8 2.1 1.4.7 e 3.5 2.8 2.1 1.4.7 v5 K9me3
a Epithelial cells (2) Mesenchymal cells () Alternatively spliced region i13 e14 e15 / CycA 25 15 1 5 e14 e13-e14 - - K27me3 / H3 b 2.5 c v5 K36me3 / H3 d 3.5 2.8 2.1 1.4.7 e 3.5 2.8 2.1 1.4.7 v5 K9me3
Somatic Primary pirna Biogenesis Driven by cis-acting RNA Elements and Trans-Acting Yb
 Cell Reports Supplemental Information Somatic Primary pirna Biogenesis Driven by cis-acting RNA Elements and Trans-Acting Yb Hirotsugu Ishizu, Yuka W. Iwasaki, Shigeki Hirakata, Haruka Ozaki, Wataru Iwasaki,
Supplementary Materials
 Supplementary Materials Table S1. Oligonucleotide sequences and PCR conditions used to amplify the indicated genes. TA = annealing temperature; gdna = genomic DNA; cdna = complementary DNA; c = concentration.
SUPPLEMENTARY INFORMATION
 Supplementary Discussion Interestingly, a recent study demonstrated that knockdown of Tet1 alone would lead to dysregulation of differentiation genes, but only minor defects in ES maintenance and no change
SUPPLEMENTARY INFORMATION
 Gene replacements and insertions in rice by intron targeting using CRISPR Cas9 Table of Contents Supplementary Figure 1. sgrna-induced targeted mutations in the OsEPSPS gene in rice protoplasts. Supplementary
Nature Genetics: doi: /ng Supplementary Figure 1. ChIP-seq genome browser views of BRM occupancy at previously identified BRM targets.
 Supplementary Figure 1 ChIP-seq genome browser views of BRM occupancy at previously identified BRM targets. Gene structures are shown underneath each panel. Supplementary Figure 2 pref6::ref6-gfp complements
Supplementary Table 1. Sequences for BTG2 and BRCA1 sirnas.
 Supplementary Table 1. Sequences for BTG2 and BRCA1 sirnas. Target Gene Non-target / Control BTG2 BRCA1 NFE2L2 Target Sequence ON-TARGET plus Non-targeting sirna # 1 (Cat# D-001810-01-05) sirna1: GAACCGACAUGCUCCCGGA
Supplementary Figures Montero et al._supplementary Figure 1
 Montero et al_suppl. Info 1 Supplementary Figures Montero et al._supplementary Figure 1 Montero et al_suppl. Info 2 Supplementary Figure 1. Transcripts arising from the structurally conserved subtelomeres
Supplementary Fig. 1 Proteomic analysis of ATR-interacting proteins. ATR, ARID1A and
 Supplementary Figure Legend: Supplementary Fig. 1 Proteomic analysis of ATR-interacting proteins. ATR, ARID1A and ATRIP protein peptides identified from our mass spectrum analysis were shown. Supplementary
Supplementary Figure 1. Quantitative RT-PCR experimental validation of CRISPR/Cas9 and sgrnas expression in HEK293A transfected cells.
 Supplementary Figure 1. Quantitative RT-PCR experimental validation of CRISPR/Cas9 and sgrnas expression in HEK293A transfected cells. HEK293A cells were transfected with the indicated combinations of
SUPPLEMENTARY INFORMATION
 (Supplementary Methods and Materials) GST pull-down assay GST-fusion proteins Fe65 365-533, and Fe65 538-700 were expressed in BL21 bacterial cells and purified with glutathione-agarose beads (Sigma).
Supplementary data. sienigma. F-Enigma F-EnigmaSM. a-p53
 Supplementary data Supplemental Figure 1 A sienigma #2 sienigma sicontrol a-enigma - + ++ - - - - - - + ++ - - - - - - ++ B sienigma F-Enigma F-EnigmaSM a-flag HLK3 cells - - - + ++ + ++ - + - + + - -
Supplemental Figure 1 A
 Supplemental Figure A prebleach postbleach 2 min 6 min 3 min mh2a.-gfp mh2a.2-gfp mh2a2-gfp GFP-H2A..9 Relative Intensity.8.7.6.5 mh2a. GFP n=8.4 mh2a.2 GFP n=4.3 mh2a2 GFP n=2.2 GFP H2A n=24. GFP n=7.
GENETICS EXAM 3 FALL a) is a technique that allows you to separate nucleic acids (DNA or RNA) by size.
 is a technique that allows you to separate nucleic acids (DNA or RNA) by size.") Student Name: All questions are worth 5 pts. each. GENETICS EXAM 3 FALL 2004 1. a) is a technique that allows you to separate nucleic acids (DNA or RNA) by size. b) Name one of the materials (of the two
Student Name: All questions are worth 5 pts. each. GENETICS EXAM 3 FALL 2004 1. a) is a technique that allows you to separate nucleic acids (DNA or RNA) by size. b) Name one of the materials (of the two
Design. Construction. Characterization
 Design Construction Characterization DNA mrna (messenger) A C C transcription translation C A C protein His A T G C T A C G Plasmids replicon copy number incompatibility selection marker origin of replication
Regulation of transcription by the MLL2 complex and MLL complex-associated AKAP95
 Supplementary Information Regulation of transcription by the complex and MLL complex-associated Hao Jiang, Xiangdong Lu, Miho Shimada, Yali Dou, Zhanyun Tang, and Robert G. Roeder Input HeLa NE IP lot:
GT-rich promoters can drive RNA pol II transcription and deposition of H2A.Z in African trypanosomes
 GT-rich promoters can drive RNA pol II transcription deposition of H2A.Z in African trypanosomes Carolin Wedel, Konrad U. Förstner, Ramona Derr T. Nicolai Siegel Appendix Table of Contents Appendix Materials
Supplemental Figure 1.
 Supplemental Data. Charron et al. Dynamic landscapes of four histone modifications during de-etiolation in Arabidopsis. Plant Cell (2009). 10.1105/tpc.109.066845 Supplemental Figure 1. Immunodetection
SUPPLEMENTARY EXPEMENTAL PROCEDURES
 SUPPLEMENTARY EXPEMENTAL PROCEDURES Plasmids- Total RNAs were extracted from HeLaS3 cells and reverse-transcribed using Superscript III Reverse Transcriptase (Invitrogen) to obtain DNA template for the
Nature Genetics: doi: /ng.3556 INTEGRATED SUPPLEMENTARY FIGURE TEMPLATE. Supplementary Figure 1
 INTEGRATED SUPPLEMENTARY FIGURE TEMPLATE Supplementary Figure 1 REF6 expression in transgenic lines. (a,b) Expression of REF6 in REF6-HA ref6 and REF6ΔZnF-HA ref6 plants detected by RT qpcr (a) and immunoblot
Multiple choice questions (numbers in brackets indicate the number of correct answers)
") 1 Multiple choice questions (numbers in brackets indicate the number of correct answers) February 1, 2013 1. Ribose is found in Nucleic acids Proteins Lipids RNA DNA (2) 2. Most RNA in cells is transfer
1 Multiple choice questions (numbers in brackets indicate the number of correct answers) February 1, 2013 1. Ribose is found in Nucleic acids Proteins Lipids RNA DNA (2) 2. Most RNA in cells is transfer
A) B) Ladder. Supplementary Figure 1. Recombinant calpain 14 purification analysis. A) The general domain structure of classical
 B) Ladder. Supplementary Figure 1. Recombinant calpain 14 purification analysis. A) The general domain structure of classical") A) B) Ladder C) r4 r4 Nt- -Ct 78 kda Supplementary Figure 1. Recombinant calpain 14 purification analysis. A) The general domain structure of classical calpains is shown. The protease core consists of
A) B) Ladder C) r4 r4 Nt- -Ct 78 kda Supplementary Figure 1. Recombinant calpain 14 purification analysis. A) The general domain structure of classical calpains is shown. The protease core consists of
Selected Techniques Part I
 1 Selected Techniques Part I Gel Electrophoresis Can be both qualitative and quantitative Qualitative About what size is the fragment? How many fragments are present? Is there in insert or not? Quantitative
CRISPR RNA-guided activation of endogenous human genes
 CRISPR RNA-guided activation of endogenous human genes Morgan L Maeder, Samantha J Linder, Vincent M Cascio, Yanfang Fu, Quan H Ho, J Keith Joung Supplementary Figure 1 Comparison of VEGF activation induced
PrimePCR Assay Validation Report
 Gene Information Gene Name integrin, alpha 1 Gene Symbol Organism Gene Summary Gene Aliases RefSeq Accession No. UniGene ID Ensembl Gene ID ITGA1 Human This gene encodes the alpha 1 subunit of integrin
PrimePCR Assay Validation Report
 Gene Information Gene Name Gene Symbol Organism Gene Summary Gene Aliases RefSeq Accession No. UniGene ID Ensembl Gene ID protein kinase N1 PKN1 Human The protein encoded by this gene belongs to the protein
HPV E6 oncoprotein targets histone methyltransferases for modulating specific. Chih-Hung Hsu, Kai-Lin Peng, Hua-Ci Jhang, Chia-Hui Lin, Shwu-Yuan Wu,
 1 HPV E oncoprotein targets histone methyltransferases for modulating specific gene transcription 3 5 Chih-Hung Hsu, Kai-Lin Peng, Hua-Ci Jhang, Chia-Hui Lin, Shwu-Yuan Wu, Cheng-Ming Chiang, Sheng-Chung
Cell proliferation was measured with Cell Counting Kit-8 (Dojindo Laboratories, Kumamoto, Japan).
.") 1 2 3 4 5 6 7 8 Supplemental Materials and Methods Cell proliferation assay Cell proliferation was measured with Cell Counting Kit-8 (Dojindo Laboratories, Kumamoto, Japan). GCs were plated at 96-well
1 2 3 4 5 6 7 8 Supplemental Materials and Methods Cell proliferation assay Cell proliferation was measured with Cell Counting Kit-8 (Dojindo Laboratories, Kumamoto, Japan). GCs were plated at 96-well
SUPPLEMENTAL MATERIALS
 SUPPLEMENL MERILS Eh-seq: RISPR epitope tagging hip-seq of DN-binding proteins Daniel Savic, E. hristopher Partridge, Kimberly M. Newberry, Sophia. Smith, Sarah K. Meadows, rian S. Roberts, Mark Mackiewicz,
Nature Biotechnology: doi: /nbt Supplementary Figure 1
 Supplementary Figure 1 Schematic and results of screening the combinatorial antibody library for Sox2 replacement activity. A single batch of MEFs were plated and transduced with doxycycline inducible
Zhang et al., RepID facilitates replication Initiation. Supplemental Information:
 Supplemental Information: a b 1 Supplementary Figure 1 (a) DNA sequence of all the oligonucleotides used in this study. Only one strand is shown. The unshaded nucleotide sequences show changes from the
Supplementary Figure 1. jmj30-2 and jmj32-1 produce null mutants. (a) Schematic drawing of JMJ30 and JMJ32 genome structure showing regions amplified
 Schematic drawing of JMJ30 and JMJ32 genome structure showing regions amplified") Supplementary Figure 1. jmj30-2 and jmj32-1 produce null mutants. (a) Schematic drawing of JMJ30 and JMJ32 genome structure showing regions amplified by primers used for mrna expression analysis. Gray
Supplementary Figure 1. jmj30-2 and jmj32-1 produce null mutants. (a) Schematic drawing of JMJ30 and JMJ32 genome structure showing regions amplified by primers used for mrna expression analysis. Gray
PrimePCR Assay Validation Report
 Gene Information Gene Name keratin 78 Gene Symbol Organism Gene Summary Gene Aliases RefSeq Accession No. UniGene ID Ensembl Gene ID KRT78 Human This gene is a member of the type II keratin gene family
A Repressor Complex Governs the Integration of
 Developmental Cell 15 Supplemental Data A Repressor Complex Governs the Integration of Flowering Signals in Arabidopsis Dan Li, Chang Liu, Lisha Shen, Yang Wu, Hongyan Chen, Masumi Robertson, Chris A.
Supplementary Figure Legends
 Supplementary Figure Legends Figure S1 gene targeting strategy for disruption of chicken gene, related to Figure 1 (f)-(i). (a) The locus and the targeting constructs showing HpaI restriction sites. The
Figure S1. nuclear extracts. HeLa cell nuclear extract. Input IgG IP:ORC2 ORC2 ORC2. MCM4 origin. ORC2 occupancy
 A nuclear extracts B HeLa cell nuclear extract Figure S1 ORC2 (in kda) 21 132 7 ORC2 Input IgG IP:ORC2 32 ORC C D PRKDC ORC2 occupancy Directed against ORC2 C-terminus (sc-272) MCM origin 2 2 1-1 -1kb
Supplemental Information. Autoregulatory Feedback Controls. Sequential Action of cis-regulatory Modules. at the brinker Locus
 Developmental Cell, Volume 26 Supplemental Information Autoregulatory Feedback Controls Sequential Action of cis-regulatory Modules at the brinker Locus Leslie Dunipace, Abbie Saunders, Hilary L. Ashe,
Supplementary Information
 Supplementary Information Super-resolution imaging of fluorescently labeled, endogenous RNA Polymerase II in living cells with CRISPR/Cas9-mediated gene editing Won-Ki Cho 1, Namrata Jayanth 1, Susan Mullen
Supplementary Figure 1, related to Figure 1. GAS5 is highly expressed in the cytoplasm of hescs, and positively correlates with pluripotency.
 Supplementary Figure 1, related to Figure 1. GAS5 is highly expressed in the cytoplasm of hescs, and positively correlates with pluripotency. (a) Transfection of different concentration of GAS5-overexpressing
File name: Supplementary Information Description: Supplementary figures and supplementary tables. File name: Peer review file Description:
 File name: Supplementary Information Description: Supplementary figures and supplementary tables. File name: Peer review file Description: Supplementary Figure 1. dcas9-mq1 fusion protein induces de novo
PrimePCR Assay Validation Report
 Gene Information Gene Name Gene Symbol Organism Gene Summary Gene Aliases RefSeq Accession No. UniGene ID Ensembl Gene ID mcf.2 transforming sequence-like Mcf2l Mouse Description Not Available C130040G20Rik,
Gene Expression Technology
 Gene Expression Technology Bing Zhang Department of Biomedical Informatics Vanderbilt University bing.zhang@vanderbilt.edu Gene expression Gene expression is the process by which information from a gene
Supplementary Figure 1. RAD51 and RAD51 paralogs are enriched spontaneously onto
 Supplementary Figure legends Supplementary Figure 1. and paralogs are enriched spontaneously onto the S-phase chromatin during DN replication. () Chromatin fractionation was carried out as described in
PrimePCR Assay Validation Report
 Gene Information Gene Name minichromosome maintenance complex component 8 Gene Symbol Organism Gene Summary Gene Aliases RefSeq Accession No. UniGene ID Ensembl Gene ID MCM8 Human The protein encoded by
Reading Lecture 8: Lecture 9: Lecture 8. DNA Libraries. Definition Types Construction
 Lecture 8 Reading Lecture 8: 96-110 Lecture 9: 111-120 DNA Libraries Definition Types Construction 142 DNA Libraries A DNA library is a collection of clones of genomic fragments or cdnas from a certain
Quantitative Real Time PCR USING SYBR GREEN
 Quantitative Real Time PCR USING SYBR GREEN SYBR Green SYBR Green is a cyanine dye that binds to double stranded DNA. When it is bound to D.S. DNA it has a much greater fluorescence than when bound to
PrimePCR Assay Validation Report
 Gene Information Gene Name Gene Symbol Organism Gene Summary Gene Aliases RefSeq Accession No. UniGene ID Ensembl Gene ID Glyceraldehyde-3-phosphate dehydrogenase Gapdh Rat This gene encodes a member of
Assay Design Considerations, Optimization and Validation
 Assay Design Considerations, Optimization and Validation Ray Meng, Ph.D. International Field Applications Specialist Gene Expression Division Bio-Rad Laboratories, Inc. Assay Design Considerations Experiment
PrimePCR Assay Validation Report
 Gene Information Gene Name SRY (sex determining region Y)-box 6 Gene Symbol Organism Gene Summary Gene Aliases RefSeq Accession No. UniGene ID Ensembl Gene ID SOX6 Human This gene encodes a member of the
Computational Biology I LSM5191
 Computational Biology I LSM5191 Lecture 5 Notes: Genetic manipulation & Molecular Biology techniques Broad Overview of: Enzymatic tools in Molecular Biology Gel electrophoresis Restriction mapping DNA
SUPPLEMENTARY INFORMATION
 AS-NMD modulates FLM-dependent thermosensory flowering response in Arabidopsis NATURE PLANTS www.nature.com/natureplants 1 Supplementary Figure 1. Genomic sequence of FLM along with the splice sites. Sequencing
Schematic representation of the endogenous PALB2 locus and gene-disruption constructs
 Supplementary Figures Supplementary Figure 1. Generation of PALB2 -/- and BRCA2 -/- /PALB2 -/- DT40 cells. (A) Schematic representation of the endogenous PALB2 locus and gene-disruption constructs carrying
Supplementary Fig. 1 related to Fig. 1 Clinical relevance of lncrna candidate
 Supplementary Figure Legends Supplementary Fig. 1 related to Fig. 1 Clinical relevance of lncrna candidate BC041951 in gastric cancer. (A) The flow chart for selected candidate lncrnas in 660 up-regulated
SUPPLEMENTARY INFORMATION. LIN-28 co-transcriptionally binds primary let-7 to regulate mirna maturation in C. elegans
 SUPPLEMENTARY INFORMATION LIN-28 co-transcriptionally binds primary let-7 to regulate mirna maturation in C. elegans Priscilla M. Van Wynsberghe 1, Zoya S. Kai 1, Katlin B. Massirer 2-4, Victoria H. Burton
PrimePCR Assay Validation Report
 Gene Information Gene Name sortilin 1 Gene Symbol Organism Gene Summary Gene Aliases RefSeq Accession No. UniGene ID Ensembl Gene ID SORT1 Human This gene encodes a protein that is a multi-ligand type-1
PrimePCR Assay Validation Report
 Gene Information Gene Name Gene Symbol Organism Gene Summary Gene Aliases RefSeq Accession No. UniGene ID Ensembl Gene ID protein phosphatase, Mg2+/Mn2+ dependent, 1A PPM1A Human The protein encoded by
Fig. S1. eif6 expression in HEK293 transfected with shrna against eif6 or pcmv-eif6 vector.
 Fig. S1. eif6 expression in HEK293 transfected with shrna against eif6 or pcmv-eif6 vector. (a) Western blotting analysis and (b) qpcr analysis of eif6 expression in HEK293 T cells transfected with either
SUPPLEMENTARY INFORMATION
 doi:.38/nature899 Supplementary Figure Suzuki et al. a c p7 -/- / WT ratio (+)/(-) p7 -/- / WT ratio Log X 3. Fold change by treatment ( (+)/(-)) Log X.5 3-3. -. b Fold change by treatment ( (+)/(-)) 8
Supplemental Data. Noncoding Transcription by RNA Polymerase Pol IVb/Pol V Mediates Transcriptional Silencing of Overlapping and Adjacent Genes
 Cell, Volume 135 Supplemental Data Noncoding Transcription by RNA Polymerase Pol IVb/Pol V Mediates Transcriptional Silencing of Overlapping and Adjacent Genes Andrzej T. Wierzbicki, Jeremy R. Haag, and
Enzyme that uses RNA as a template to synthesize a complementary DNA
 Biology 105: Introduction to Genetics PRACTICE FINAL EXAM 2006 Part I: Definitions Homology: Comparison of two or more protein or DNA sequence to ascertain similarities in sequences. If two genes have
Emanuela Tumini, Sonia Barroso, Carmen Pérez Calero and Andrés Aguilera
 SUPPLEMENTARY INFORMATION Roles of human POLD1 and POLD3 in genome stability Emanuela Tumini, Sonia Barroso, Carmen Pérez Calero and Andrés Aguilera SUPPLEMENTARY METHODS Cell proliferation After sirna
Suppl. Table S1. Characteristics of DHS regions analyzed by bisulfite sequencing. No. CpGs analyzed in the amplicon. Genomic location specificity
 Suppl. Table S1. Characteristics of DHS regions analyzed by bisulfite sequencing. DHS/GRE Genomic location Tissue specificity DHS type CpG density (per 100 bp) No. CpGs analyzed in the amplicon CpG within
PrimePCR Assay Validation Report
 Gene Information Gene Name major histocompatibility complex, class II, DR beta 1 Gene Symbol Organism Gene Summary Gene Aliases RefSeq Accession No. UniGene ID Ensembl Gene ID HLA-DRB1 Human HLA-DRB1 belongs
Nature Structural & Molecular Biology: doi: /nsmb Supplementary Figure 1
 Supplementary Figure 1 Endogenous gene tagging to study subcellular localization and chromatin binding. a, b, Schematic of experimental set-up to endogenously tag RNAi factors using the CRISPR Cas9 technology,
PrimePCR Assay Validation Report
 Gene Information Gene Name collagen, type IV, alpha 1 Gene Symbol Organism Gene Summary Gene Aliases RefSeq Accession No. UniGene ID Ensembl Gene ID COL4A1 Human This gene encodes the major type IV alpha
Supplemental Data. Sethi et al. (2014). Plant Cell /tpc
. Plant Cell /tpc") Supplemental Data Supplemental Figure 1. MYC2 Binds to the E-box but not the E1-box of the MPK6 Promoter. (A) E1-box and E-box (wild type) containing MPK6 promoter fragment. The region shown in red denotes
Supplemental Data Supplemental Figure 1. MYC2 Binds to the E-box but not the E1-box of the MPK6 Promoter. (A) E1-box and E-box (wild type) containing MPK6 promoter fragment. The region shown in red denotes
7.03, 2006, Lecture 23 Eukaryotic Genes and Genomes IV
 1 Fall 2006 7.03 7.03, 2006, Lecture 23 Eukaryotic Genes and Genomes IV In the last three lectures we have thought a lot about analyzing a regulatory system in S. cerevisiae, namely Gal regulation that
Novel methods for RNA and DNA- Seq analysis using SMART Technology. Andrew Farmer, D. Phil. Vice President, R&D Clontech Laboratories, Inc.
 Novel methods for RNA and DNA- Seq analysis using SMART Technology Andrew Farmer, D. Phil. Vice President, R&D Clontech Laboratories, Inc. Agenda Enabling Single Cell RNA-Seq using SMART Technology SMART
7.05, 2005, Lecture 23 Eukaryotic Genes and Genomes IV
 7.05, 2005, Lecture 23 Eukaryotic Genes and Genomes IV In the last three lectures we have thought a lot about analyzing a regulatory system in S. cerevisiae, namely Gal regulation that involved a hand
SUPPLEMENTARY INFORMATION
 Figure S1: Activation of the ATM pathway by I-PpoI. A. HEK293T cells were either untransfected, vector transfected, transfected with an I-PpoI expression vector, or subjected to 2Gy γ-irradiation. 24 hrs
CFTR-null wt CFTR-null 1.0. Probe: Neo R. Figure S1
 A. B. 4.0 3.0 2.0 1.0 4.0 3.0 2.0 1.0 1 2 3 4 5 6 7 8 9 10 11 12 13 14 Probe: Neo R CFTR-null wt CFTR-null Figure S1 A. 1 2 3 4 5 6 7 8 9 10 11 12 13 14 15 16 17 18 10kb 8kb CFTR-null wt B. Probe: CFTR
RNA oligonucleotides and 2 -O-methylated oligonucleotides were synthesized by. 5 AGACACAAACACCAUUGUCACACUCCACAGC; Rand-2 OMe,
 Materials and methods Oligonucleotides and DNA constructs RNA oligonucleotides and 2 -O-methylated oligonucleotides were synthesized by Dharmacon Inc. (Lafayette, CO). The sequences were: 122-2 OMe, 5
Isolation of total nucleic acids from FFPE tissues using FormaPure DNA
 APPLICATION NOTE Isolation of total nucleic acids from FFPE tissues using FormaPure DNA Jung Hoon Doh, Ph.D. Senior Application Scientist Beckman Coulter Life Sciences, Indianapolis, IN USA Summary Extensive
supplementary information
 DOI: 10.1038/ncb2116 Figure S1 CDK phosphorylation of EZH2 in cells. (a) Comparison of candidate CDK phosphorylation sites on EZH2 with known CDK substrates by multiple sequence alignments. (b) CDK1 and
Fatchiyah
 Fatchiyah Email: fatchiya@yahoo.co.id RNAs: mrna trna rrna RNAi DNAs: Protein: genome DNA cdna mikro-makro mono-poly single-multi Analysis: Identification human and animal disease Finger printing Sexing
Supplementary Fig. 1
 a FL (1-2266) NL (1-1190) CL (1191-2266) HA-ICE1: - HA-ICE1: - - - FLAG-ICE2: + + + + FLAG-ELL: + + + + + + IP: anti-ha FLAG-ICE2 HA-ICE1-FL HA-ICE1-NL HA-ICE1-CL FLAG-ICE2 b IP: anti-ha FL (1-2266) NL
Sequence Annotation & Designing Gene-specific qpcr Primers (computational)
") James Madison University From the SelectedWorks of Ray Enke Ph.D. Fall October 31, 2016 Sequence Annotation & Designing Gene-specific qpcr Primers (computational) Raymond A Enke This work is licensed under
James Madison University From the SelectedWorks of Ray Enke Ph.D. Fall October 31, 2016 Sequence Annotation & Designing Gene-specific qpcr Primers (computational) Raymond A Enke This work is licensed under
Efficient Method for Isolation of High Quality Concentrated Cellular RNA with Extremely Low Levels of Genomic DNA Contamination Application
 Efficient Method for Isolation of High Quality Concentrated Cellular RNA with Extremely Low Levels of Genomic DNA Contamination Application Gene Expression Authors Ilgar Abbaszade, Claudia Robbins, John
Mapping long-range promoter contacts in human cells with high-resolution capture Hi-C
 CORRECTION NOTICE Nat. Genet. 47, 598 606 (2015) Mapping long-range promoter contacts in human cells with high-resolution capture Hi-C Borbala Mifsud, Filipe Tavares-Cadete, Alice N Young, Robert Sugar,
Supplementary Fig. 1 Identification of Nedd4 as an IRS-2-associated protein in camp-treated FRTL-5 cells.
 Supplementary Fig. 1 Supplementary Fig. 1 Identification of Nedd4 as an IRS-2-associated protein in camp-treated FRTL-5 cells. (a) FRTL-5 cells were treated with 1 mm dibutyryl camp for 24 h, and the lysates
Surrogate reporter-based enrichment of cells containing RNA-guided Cas9 nucleaseinduced
 Supplementary Data Surrogate reporter-based enrichment of cells containing RNA-guided Cas9 nucleaseinduced mutations Suresh Ramakrishna 1, Seung Woo Cho 2, Sojung Kim 2, Myungjae Song 1, Ramu Gopalappa
ENCODE DCC Antibody Validation Document
 ENCODE DCC Antibody Validation Document Date of Submission Name: Email: Lab Antibody Name: Target: Company/ Source: Catalog Number, database ID, laboratory Lot Number Antibody Description: Target Description:
Biology 105: Introduction to Genetics PRACTICE FINAL EXAM Part I: Definitions. Homology: Reverse transcriptase. Allostery: cdna library
 Biology 105: Introduction to Genetics PRACTICE FINAL EXAM 2006 Part I: Definitions Homology: Reverse transcriptase Allostery: cdna library Transformation Part II Short Answer 1. Describe the reasons for
PrimePCR Assay Validation Report
 Gene Information Gene Name peptidylprolyl isomerase A (cyclophilin A) Gene Symbol Organism Gene Summary Gene Aliases RefSeq Accession No. UniGene ID Ensembl Gene ID PPIA Human This gene encodes a member
SUPPLEMENTARY INFORMATION
 Secondary mutations as a mechanism of cisplatin resistance in BRCA2-mutated cancers Wataru Sakai, Elizabeth M. Swisher, Beth Y. Karlan, Mukesh K. Agarwal, Jake Higgins, Cynthia Friedman, Emily Villegas,
Genomic DNA fragments identified by ChIP-chip assay for MR [28] corresponding to two
![Genomic DNA fragments identified by ChIP-chip assay for MR [28] corresponding to two](/thumbs/89/98549522.jpg "Genomic DNA fragments identified by ChIP-chip assay for MR [28] corresponding to two") Supplemental Materials and Methods Genomic DNA fragments identified by ChIP-chip assay for MR [28] corresponding to two upstream regions of the human Klf9 gene (-5139 to -5771 bp and -3875 to -4211 bp)
Supplemental Materials and Methods Genomic DNA fragments identified by ChIP-chip assay for MR [28] corresponding to two upstream regions of the human Klf9 gene (-5139 to -5771 bp and -3875 to -4211 bp)
Student Learning Outcomes (SLOS)
") Student Learning Outcomes (SLOS) KNOWLEDGE AND LEARNING SKILLS USE OF KNOWLEDGE AND LEARNING SKILLS - how to use Annhyb to save and manage sequences - how to use BLAST to compare sequences - how to get
Student Learning Outcomes (SLOS) KNOWLEDGE AND LEARNING SKILLS USE OF KNOWLEDGE AND LEARNING SKILLS - how to use Annhyb to save and manage sequences - how to use BLAST to compare sequences - how to get
Applied Bioinformatics - Lecture 16: Transcriptomics
 Applied Bioinformatics - Lecture 16: Transcriptomics David Hendrix Oregon State University Feb 15th 2016 Transcriptomics High-throughput Sequencing (deep sequencing) High-throughput sequencing (also
PrimePCR Assay Validation Report
 Gene Information Gene Name keratin associated protein 9-2 Gene Symbol Organism Gene Summary Gene Aliases RefSeq Accession No. UniGene ID Ensembl Gene ID KRTAP9-2 Human This protein is a member of the keratin-associated
Relative Quantification: Data Management & Analysis Settings
 Relative Quantification: Data Management & Analysis Settings Ray Meng, Ph.D. International Field Applications Specialist Gene Expression Division Bio-Rad Laboratories Gene Expression AMPLIFICATION Assay
TALEN mediated targeted editing of GM2/GD2-synthase gene modulates anchorage independent growth by reducing anoikis resistance in mouse tumor cells
 Supplementary Information for TALEN mediated targeted editing of GM2/GD2-synthase gene modulates anchorage independent growth by reducing anoikis resistance in mouse tumor cells Barun Mahata 1, Avisek
Table 1. Primers, annealing temperatures, and product sizes for PCR amplification.
 Table 1. Primers, annealing temperatures, and product sizes for PCR amplification. Gene Direction Primer sequence (5 3 ) Annealing Temperature Size (bp) BRCA1 Forward TTGCGGGAGGAAAATGGGTAGTTA 50 o C 292