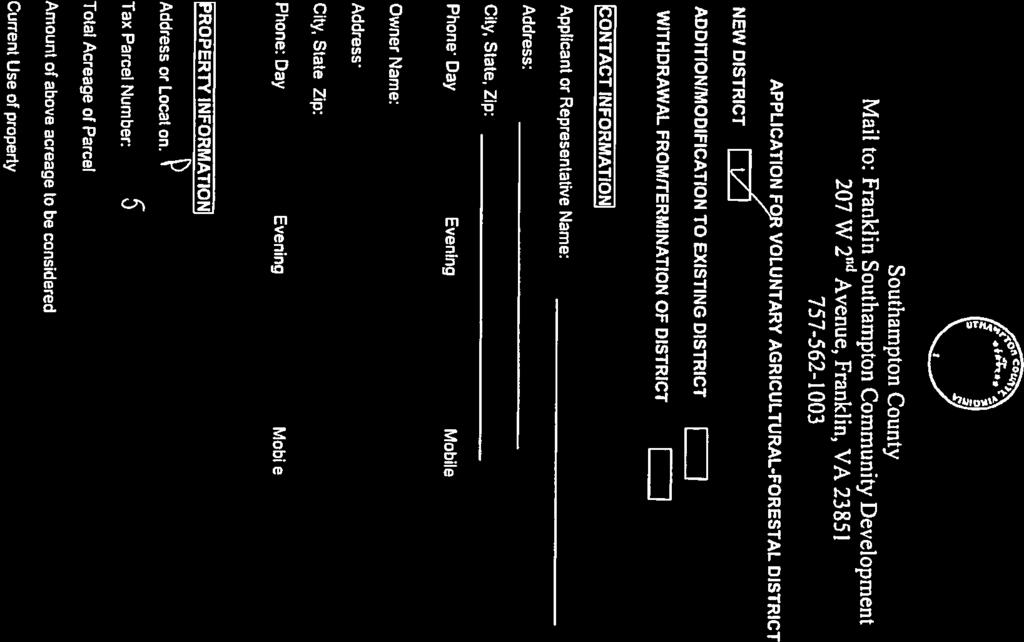
At its December 14, 2017 meeting, the Planning Commission recommended approval of the voluntary agricultural and forestal district.
|
|
|
- Percival Melvyn Morrison
- 5 years ago
- Views:
Transcription
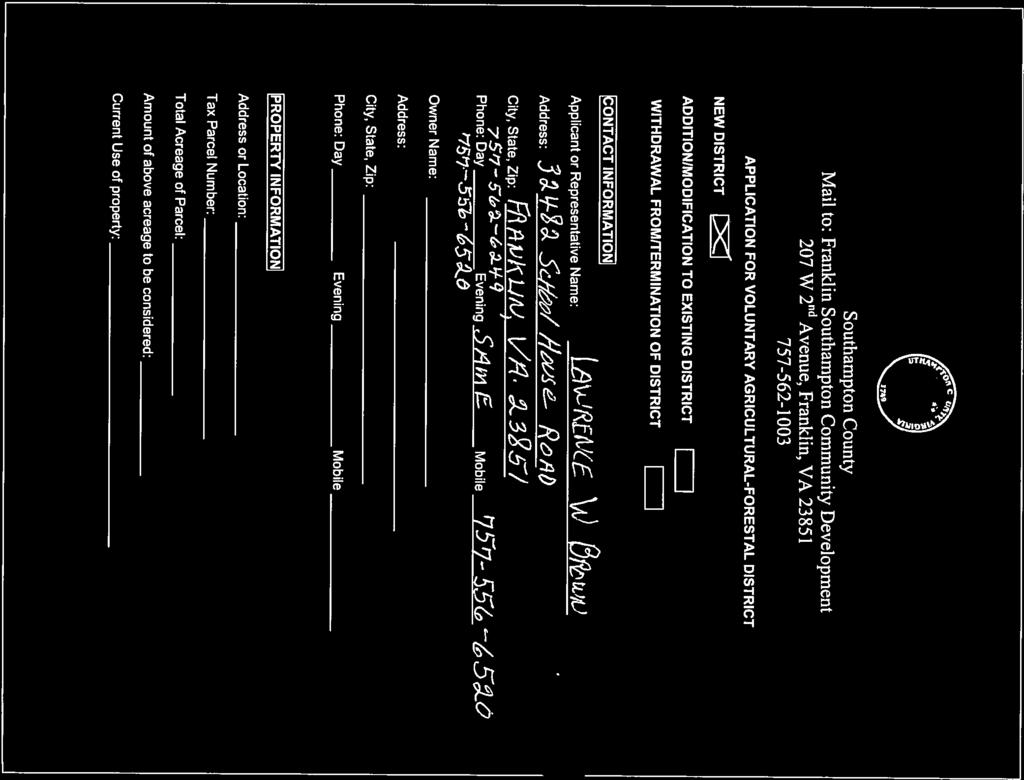
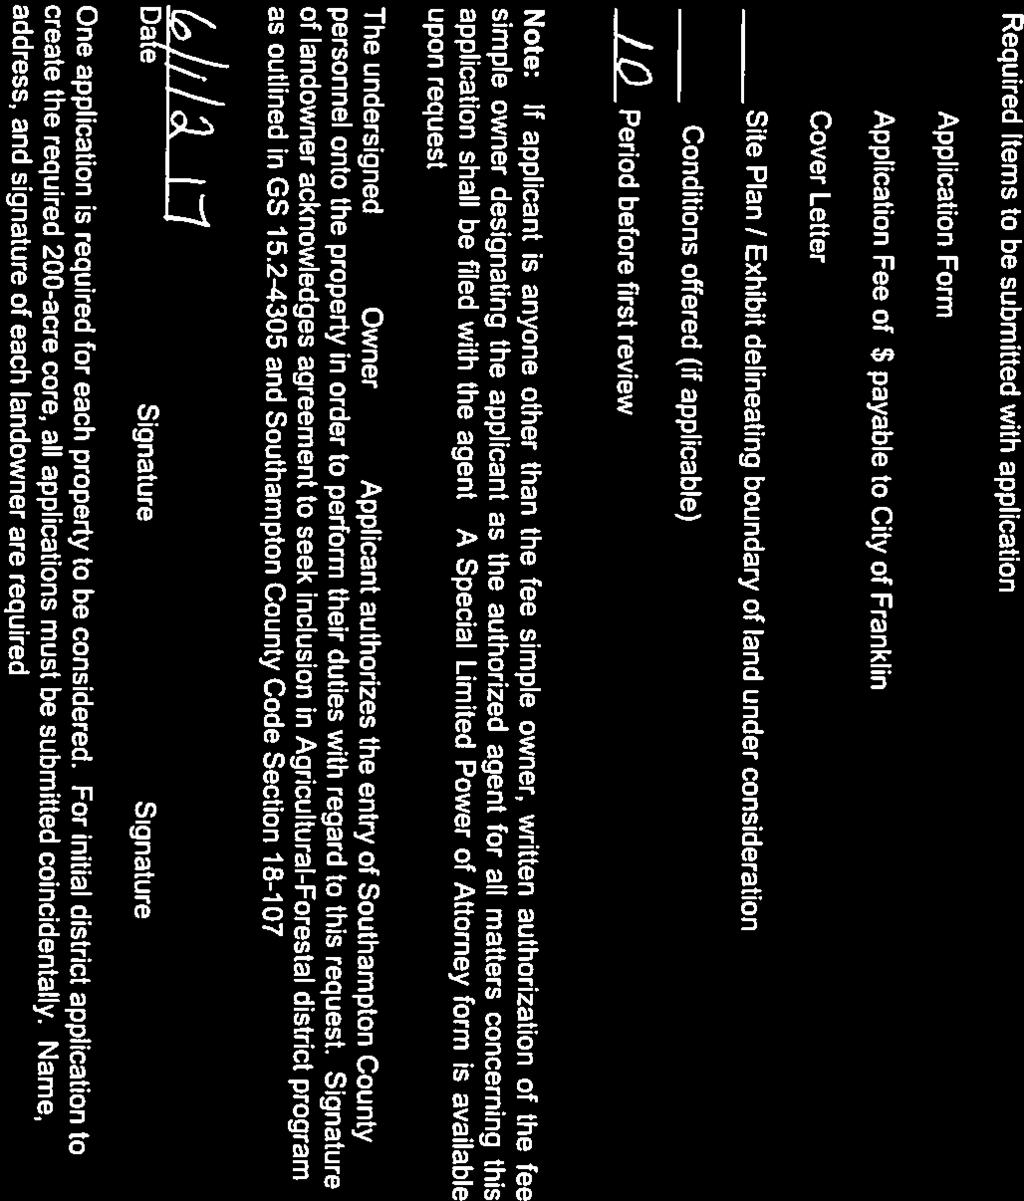
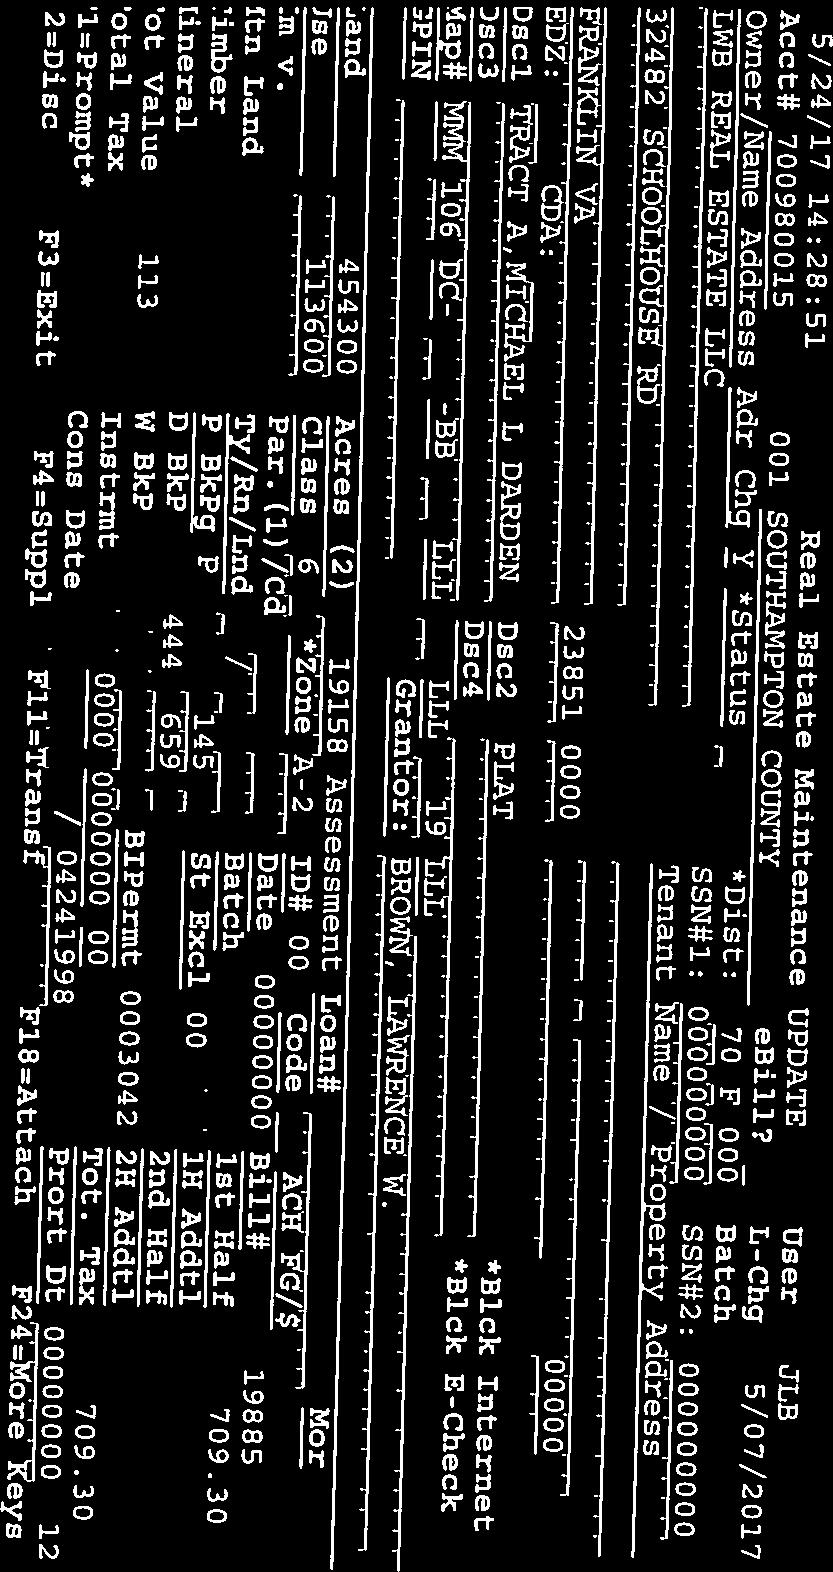
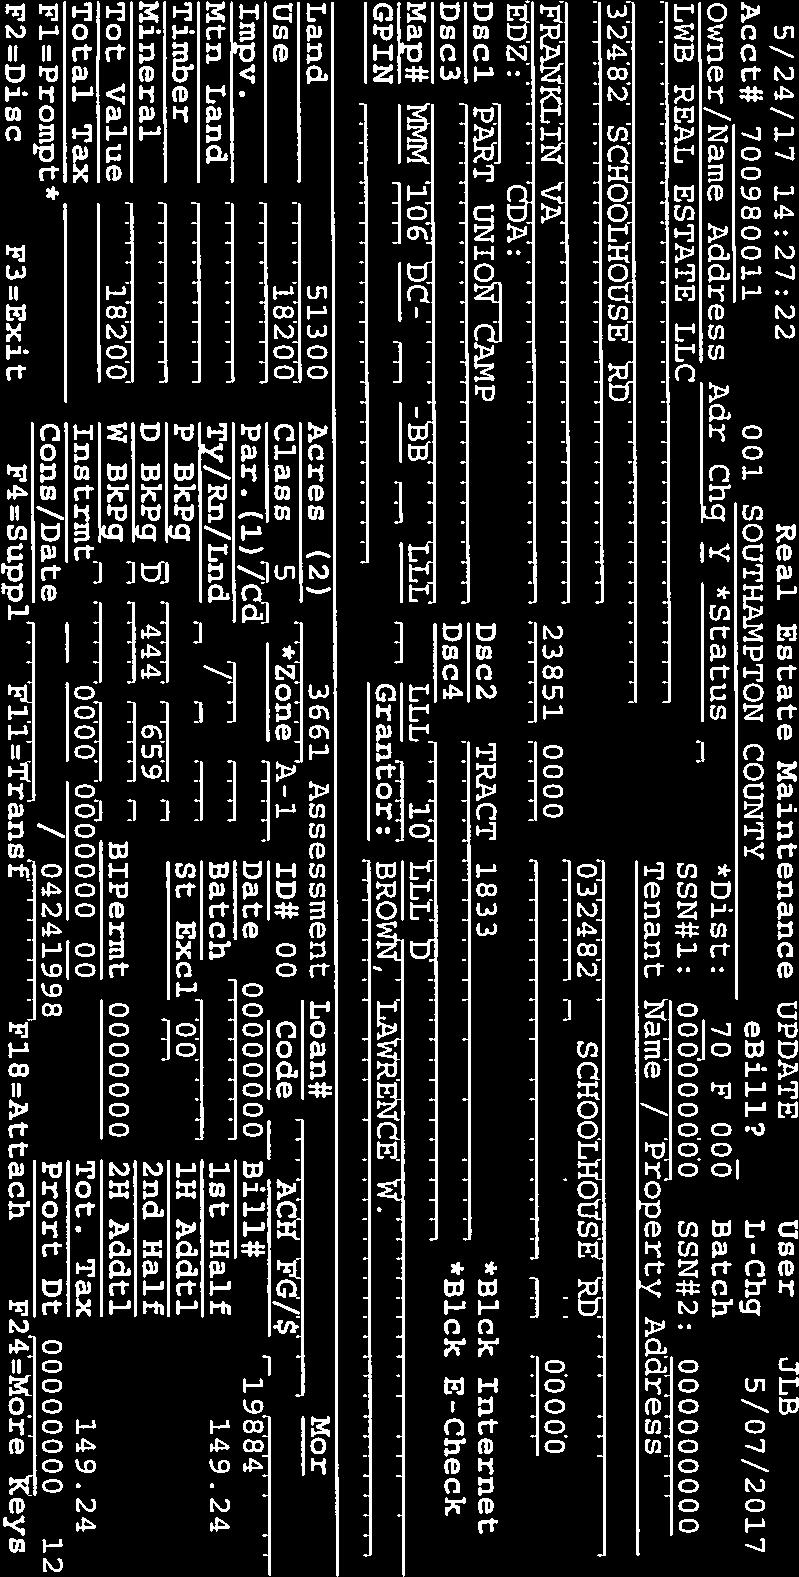
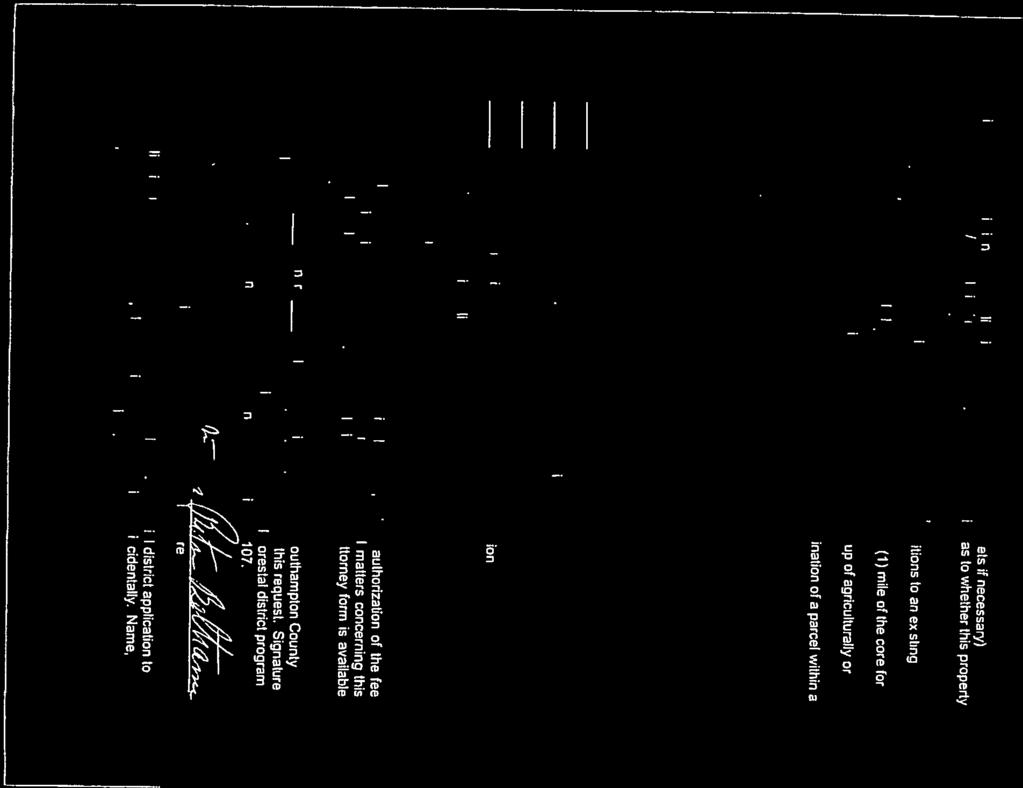
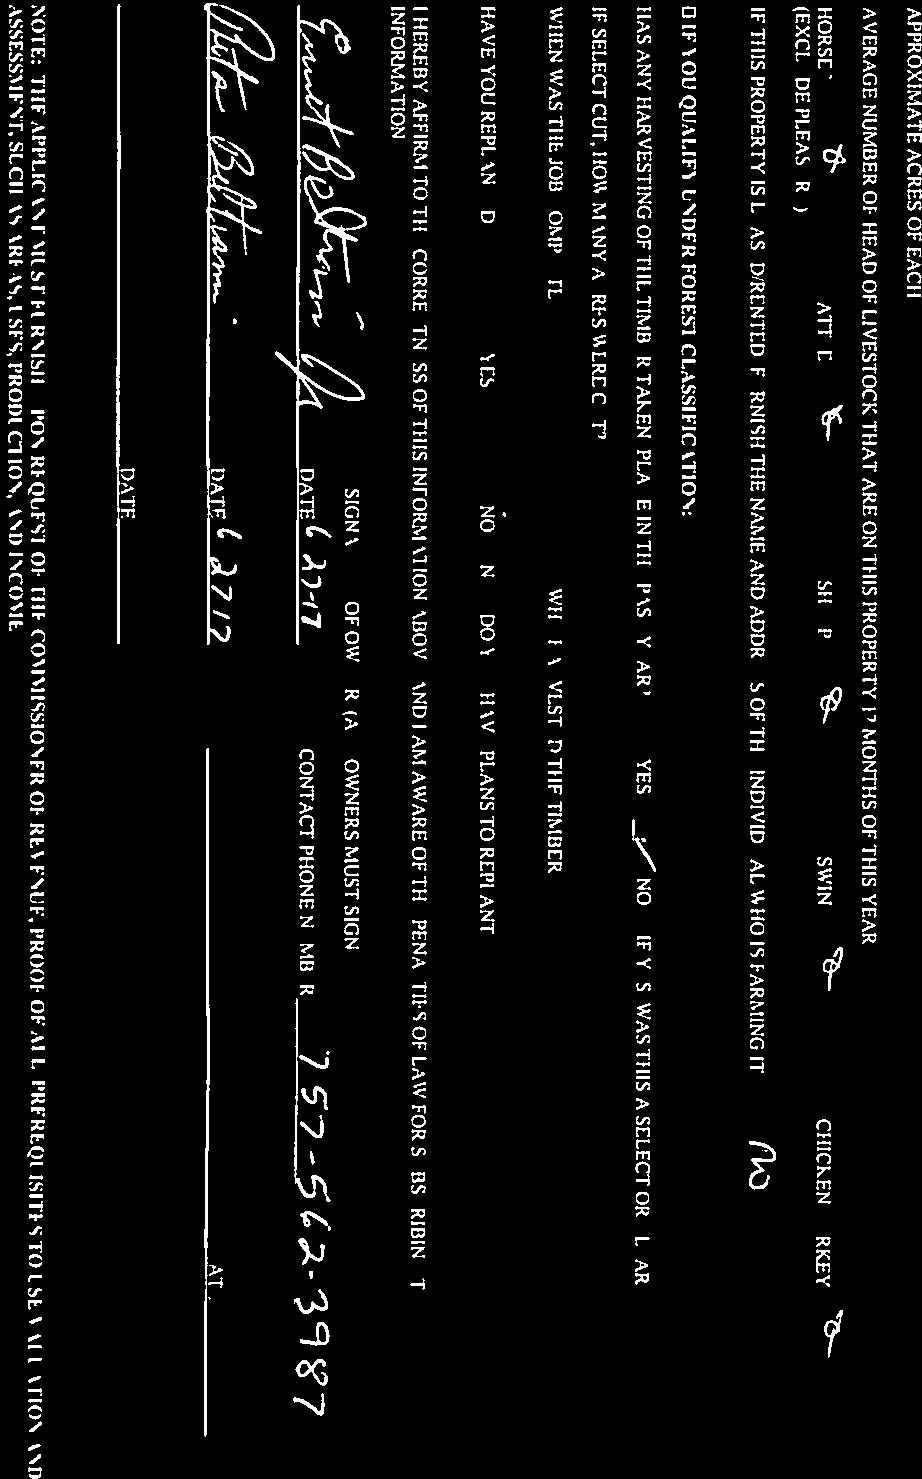
1 SOUTHAMPTON COUNTY BOARD OF SUPERVISORS Regular Session i January 22, B. PUBLIC HEARING AG & FORESTAL DISTRICT DARDEN, FALLS, BROWN, WIDMEYER AND BELTRAMI OPENING STATEMENT This public hearing is held pursuant to Section and of the Code of Virginia, 1950, as amended, to consider an application by Hunter Darden Jr., Hunter Darden III, Patricia Falls, Lawrence Brown, Francis Widmeyer, and Ernest and Rita Beltrami, Jr., owners, for the creation of a Voluntary Agriculture and Forestal District. The properties are in the Newsoms Voting and Magisterial Districts. Core Tract - Tax Parcels 106-1, 106-2, 106-2A, 106-3, 106-4, 106-5, 106-6, , , A, , , portion of , generally located west of Smiths Ferry Road and north of Schoolhouse Road. South Quay Road Tract - Tax Parcels A, C, , generally located on the south side of South Quay Road just east of its intersection with Smiths Ferry Road. Smiths Ferry Road Tract - Tax Parcel , generally located on the east side of Smiths Ferry Road at its intersection with Schoolhouse Road. Schoolhouse Road Tract - Tax Parcels 106-9, , D, , generally located on the south side of Schoolhouse Road west of its intersection with Smiths Ferry Road. Delaware Road Tract - Tax Parcels , , , generally located on both sides of Delaware Road just north of Yuma Street. At its December 14, 2017 meeting, the Planning Commission recommended approval of the voluntary agricultural and forestal district. The notice of public hearing was published in the Tidewater News on January 7, and January 14, 2018 and all adjacent landowners were notified by first class mail as required by law. After conclusion of tonight s public hearing, the Board of Supervisors will consider the comments offered this evening and will proceed to approve, deny or defer action on the proposed district. Mrs. Beth Lewis, Secretary to the Planning Commission, will provide introductory remarks after which all interested parties are invited to come forward and express their views. MOTION REQUIRED: If the Board is so inclined, a motion is required to adopt the attached ordinance.
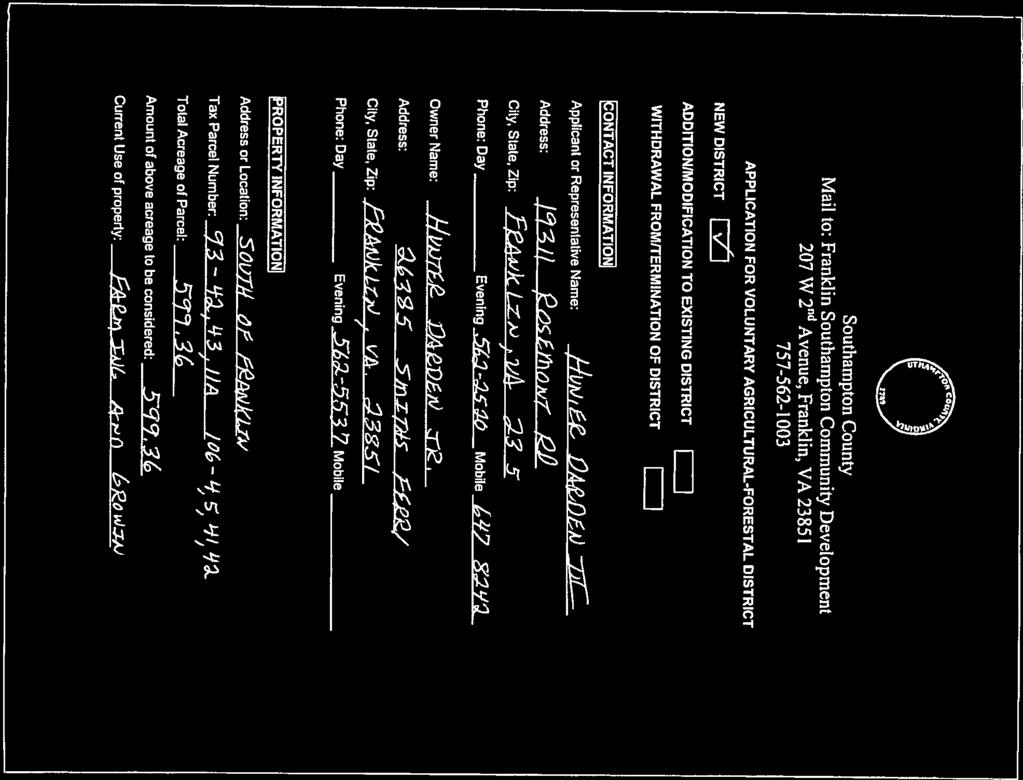
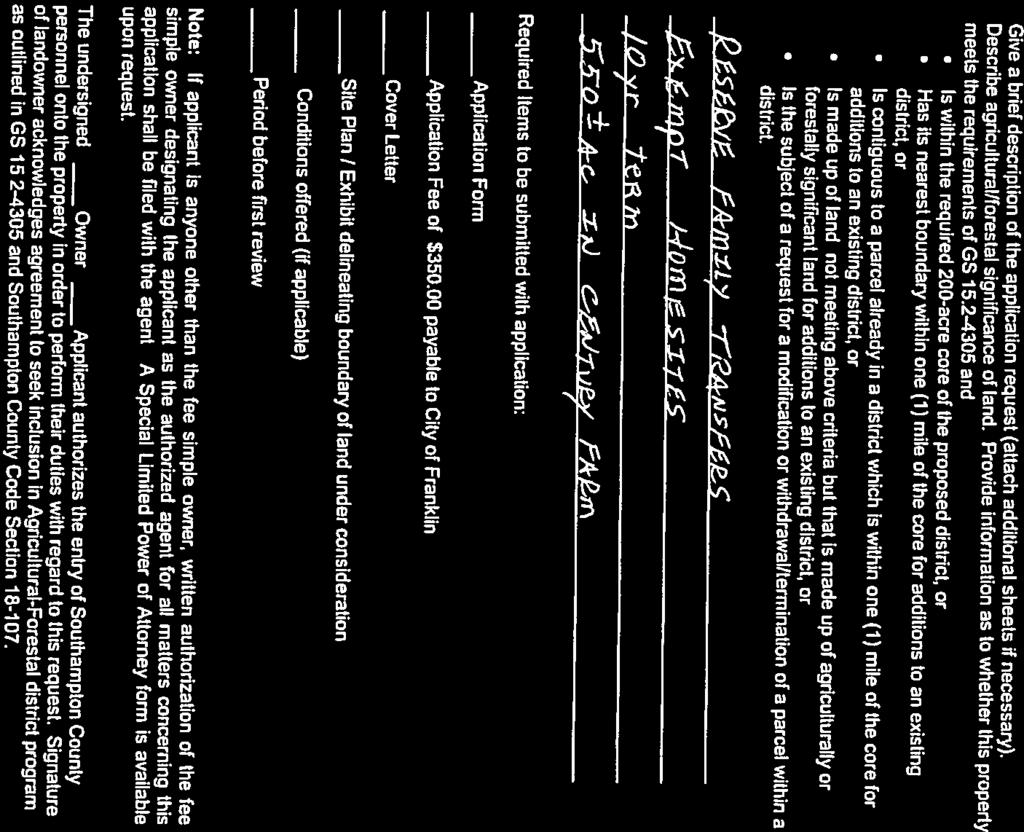
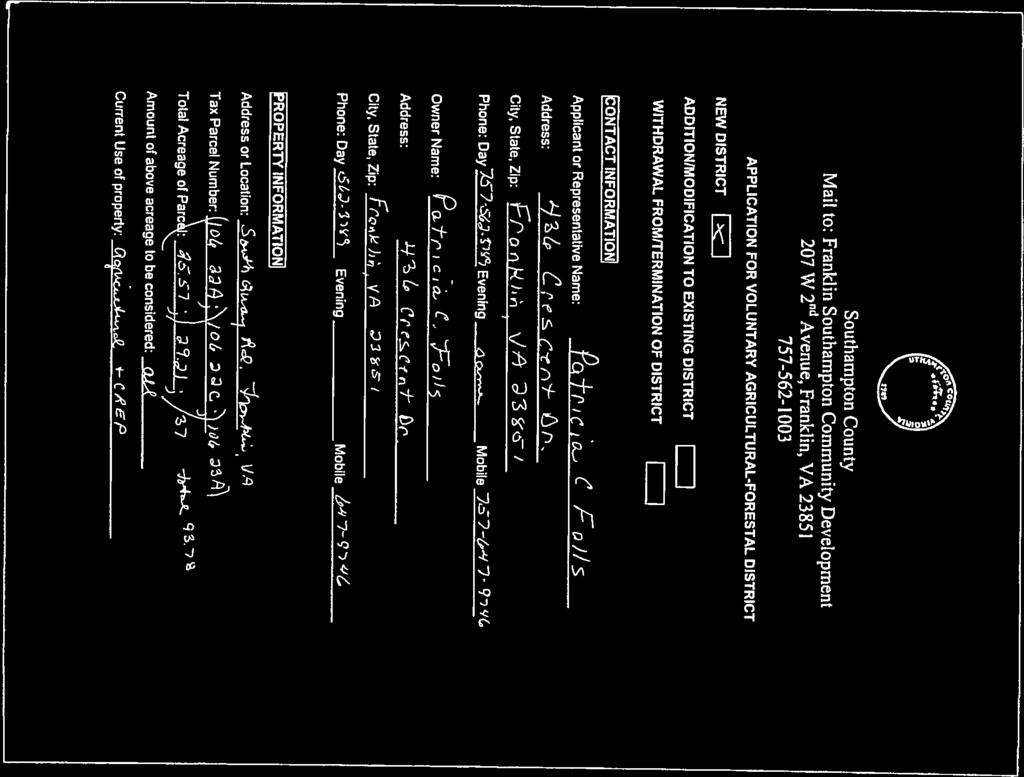
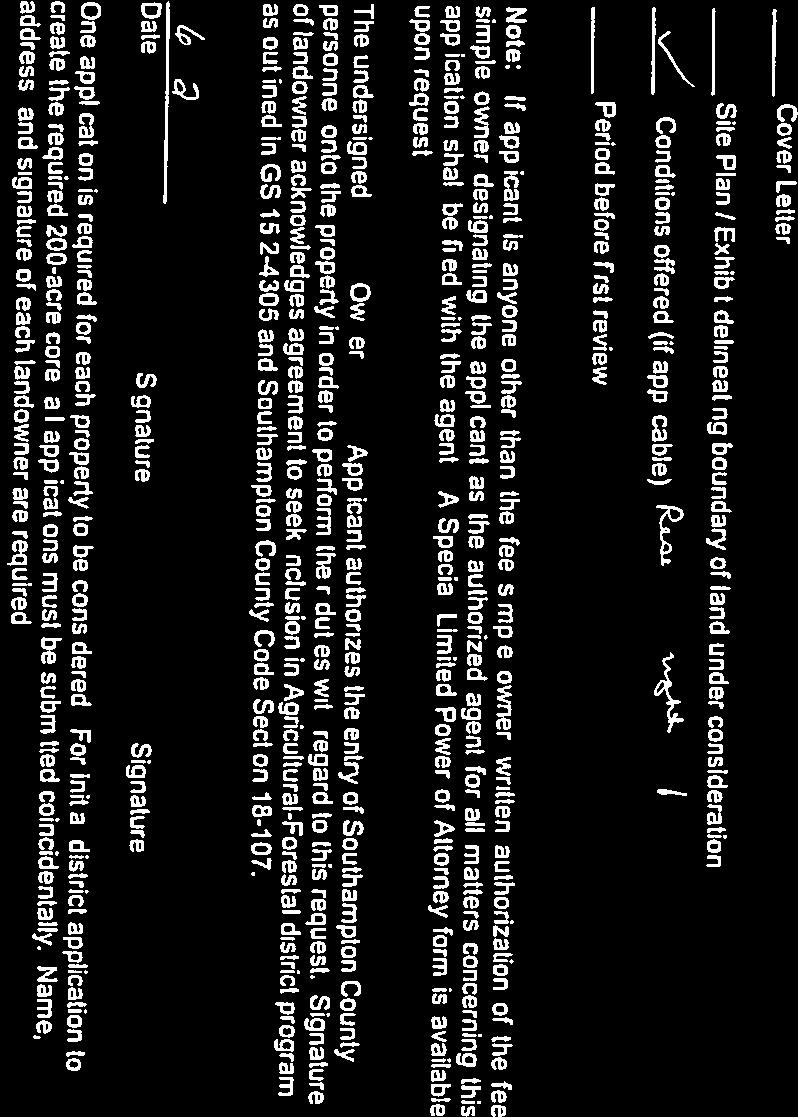
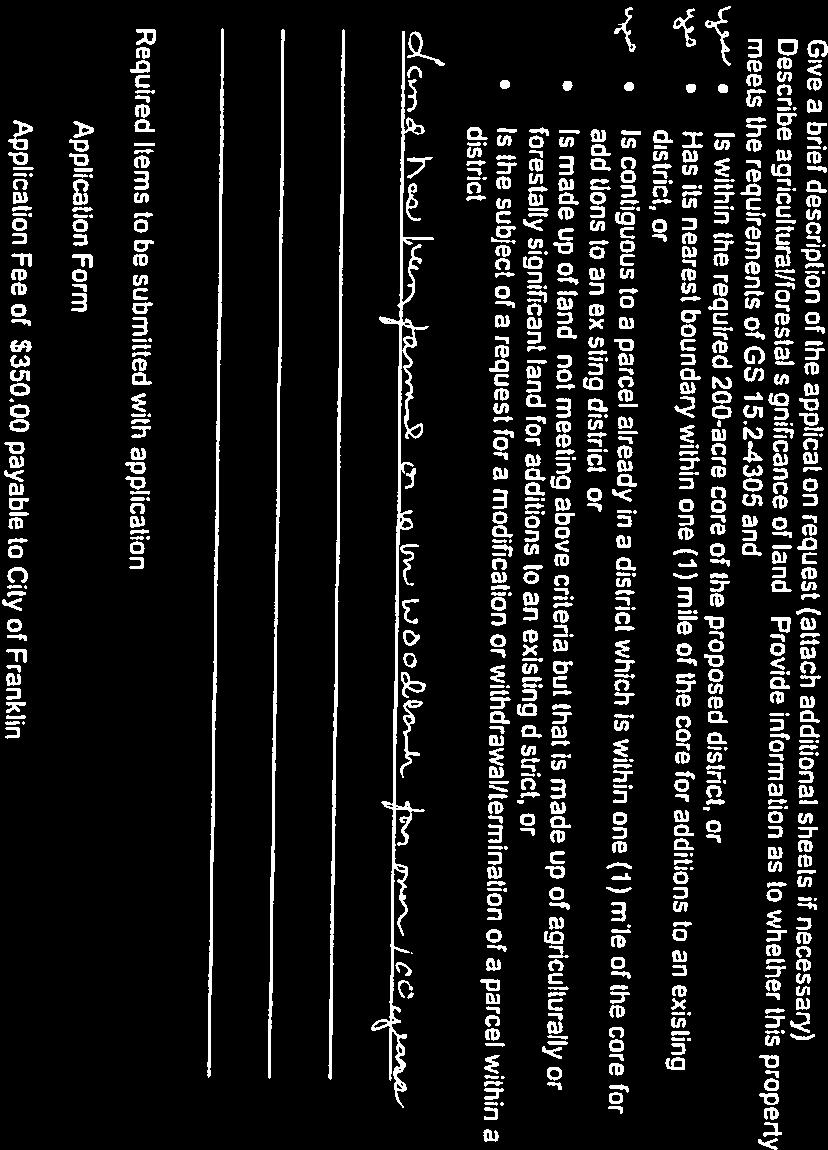
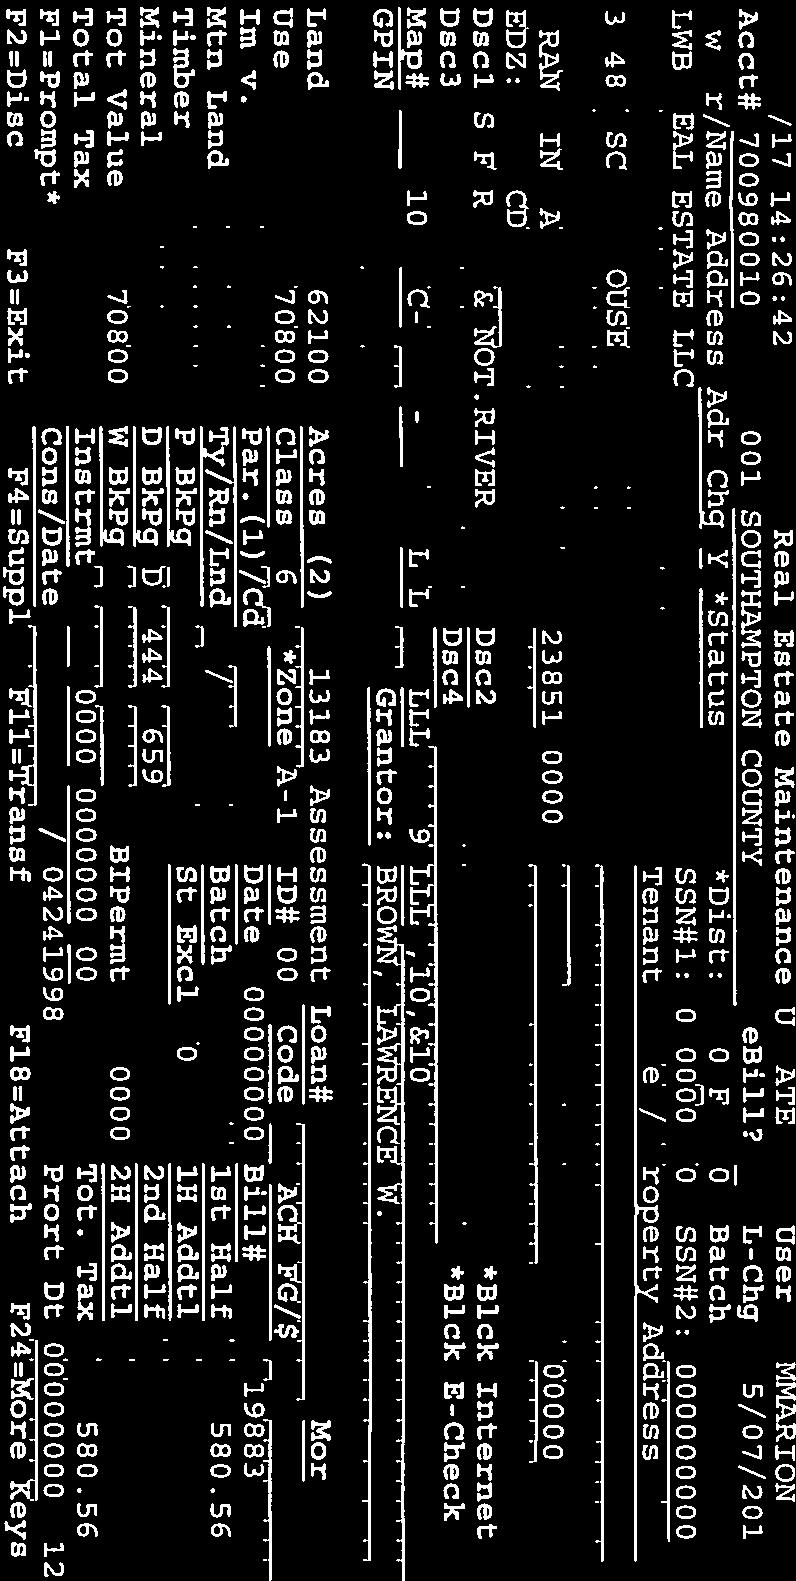
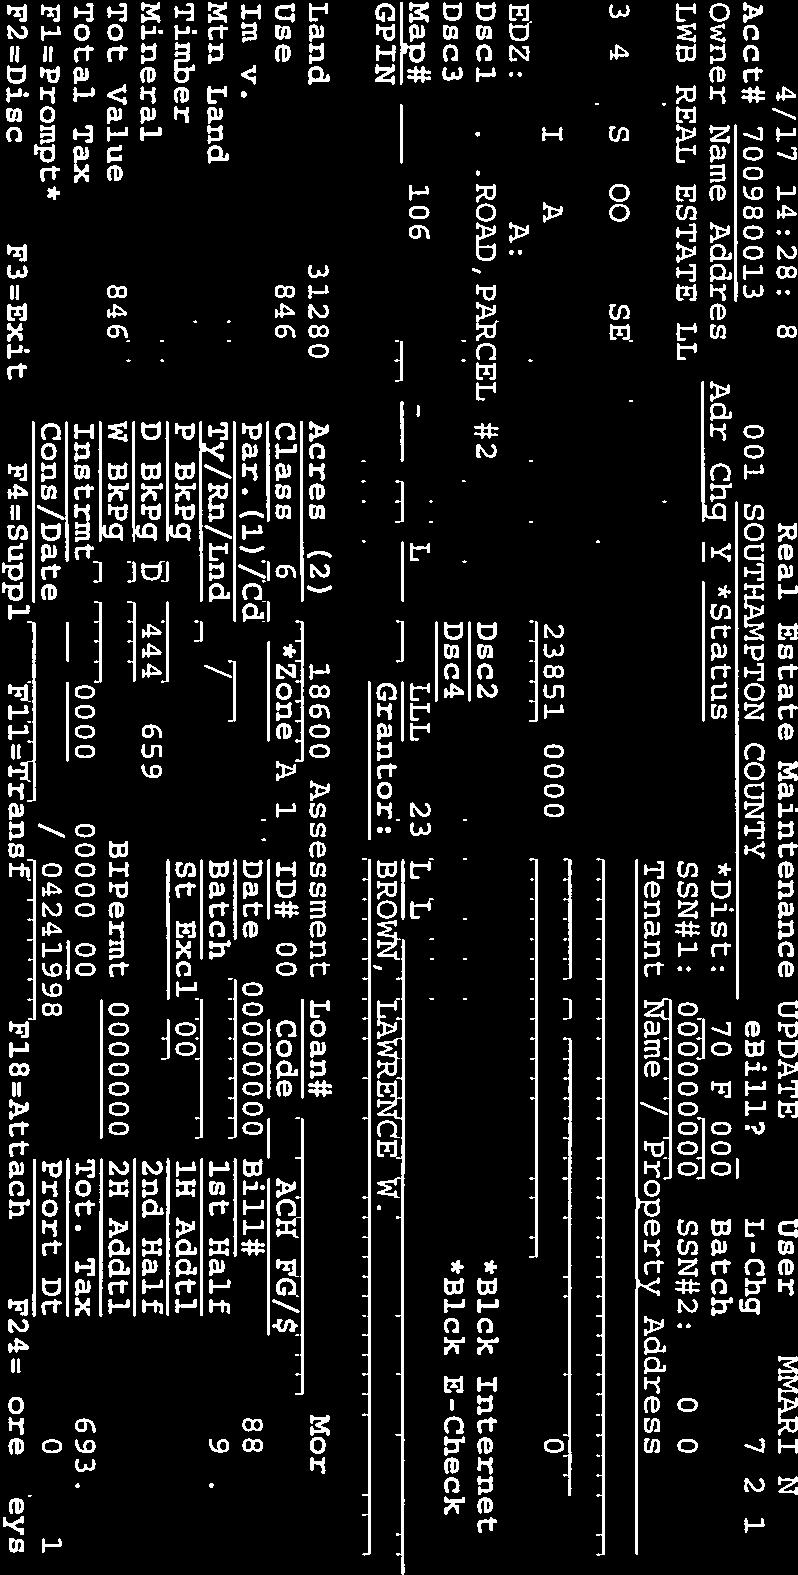
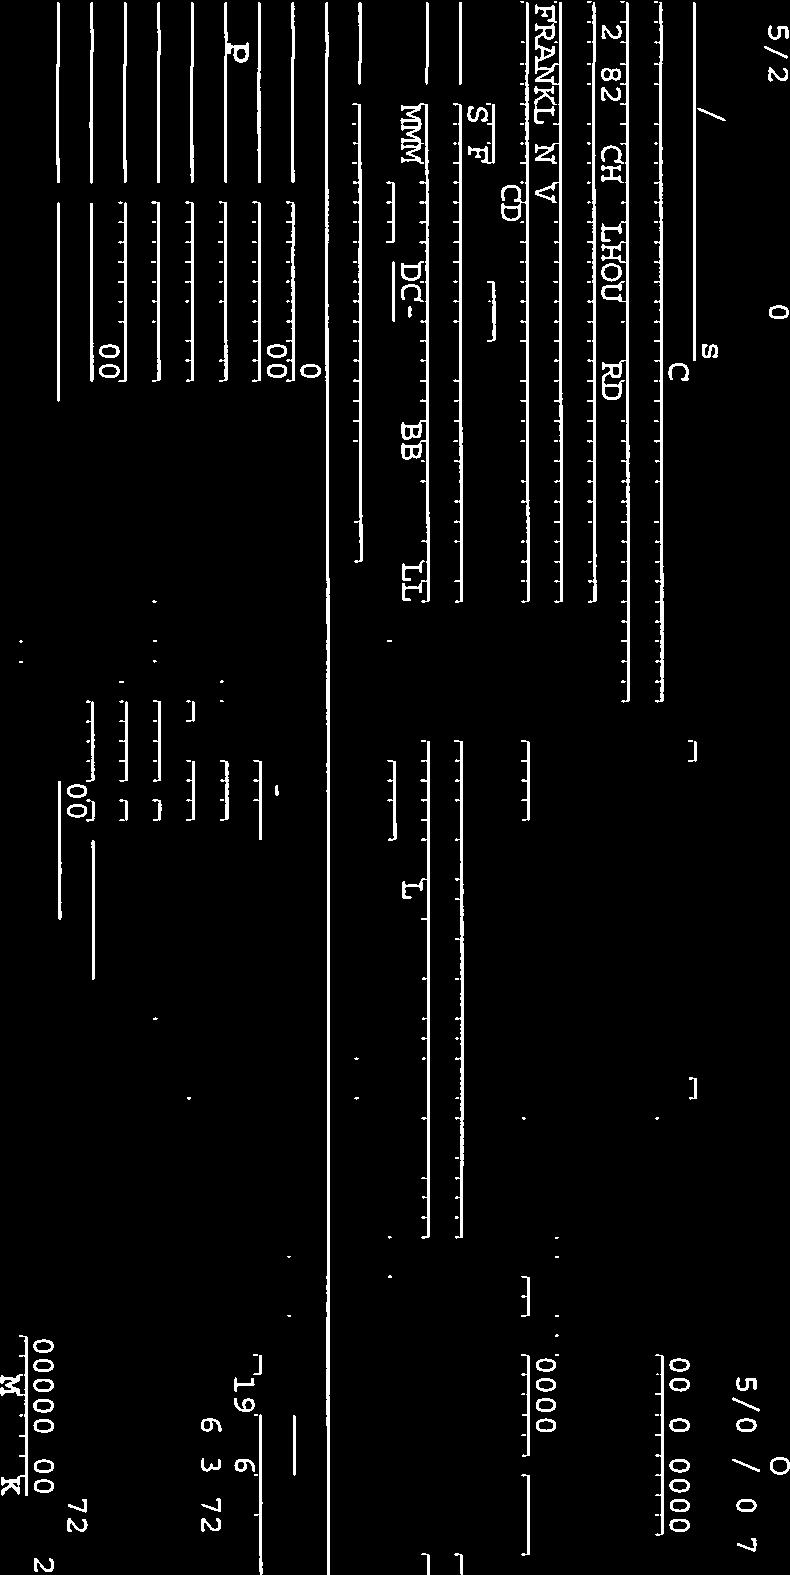
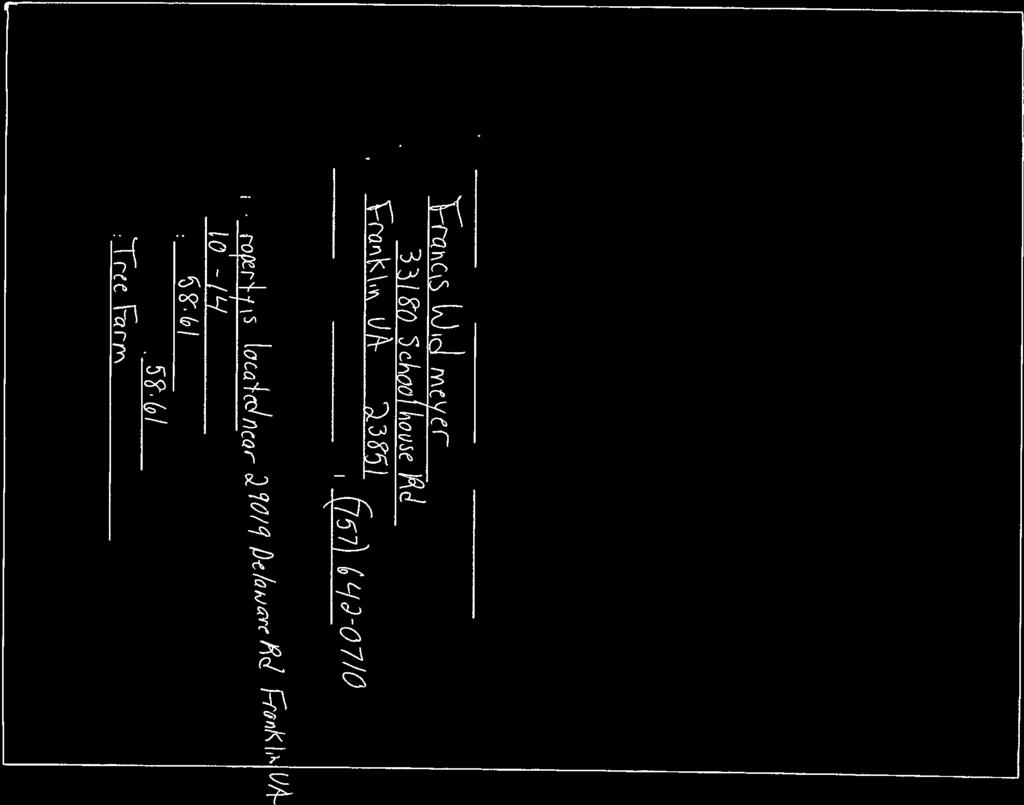
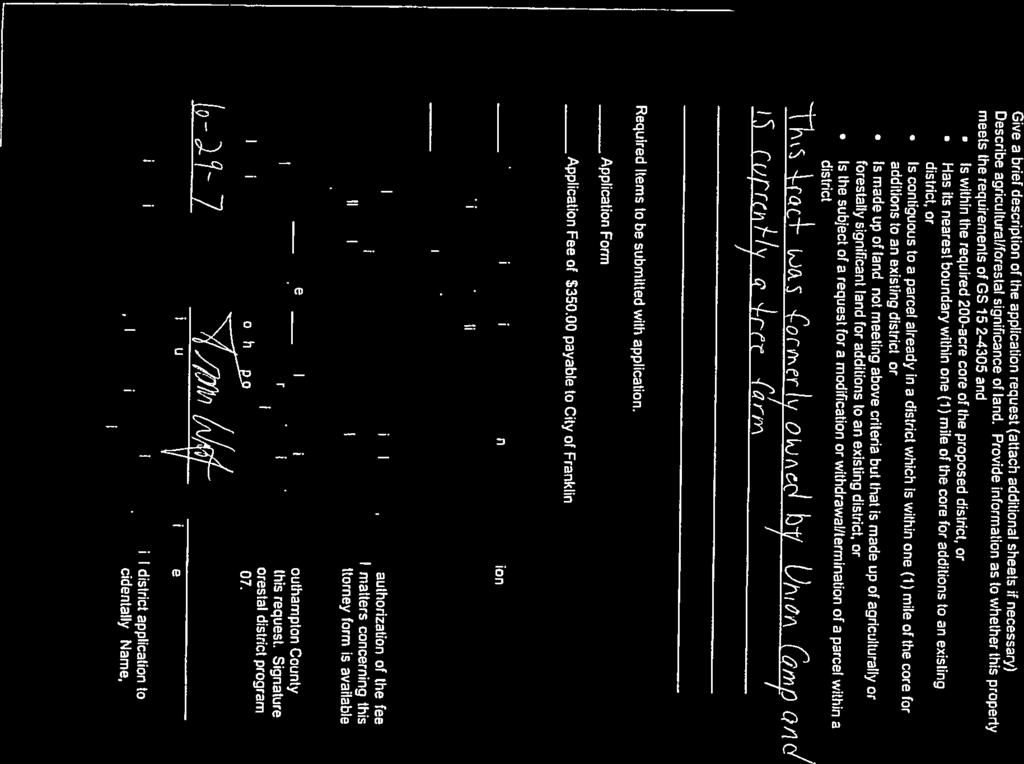
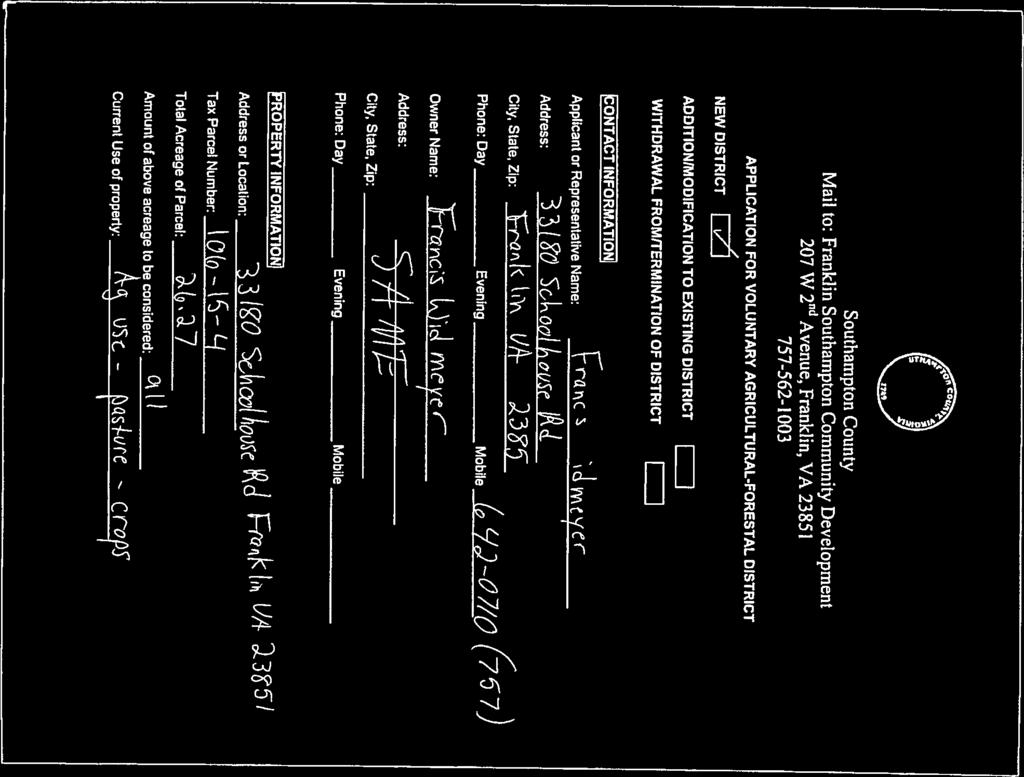
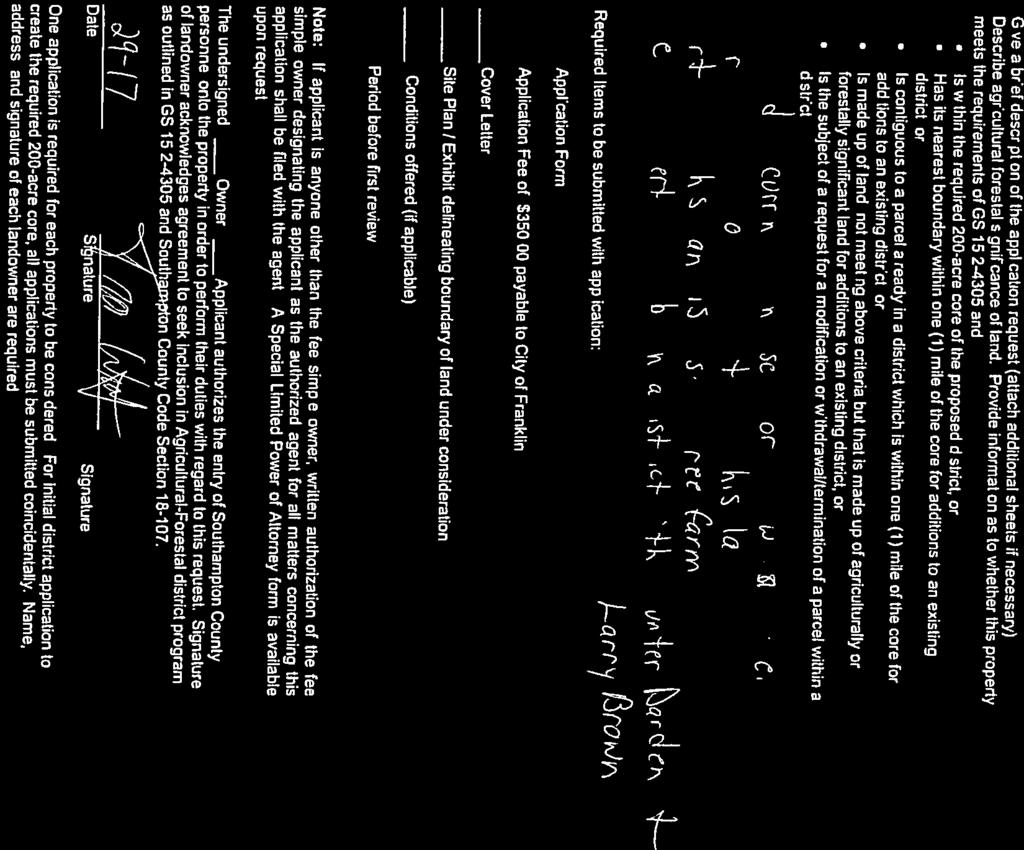
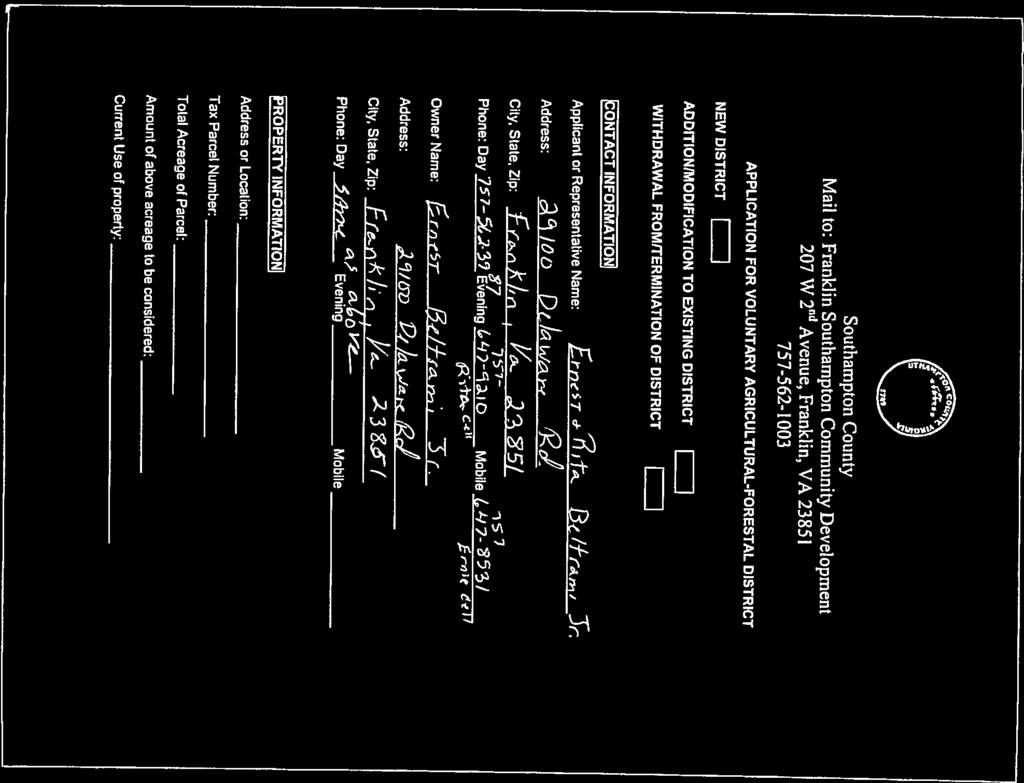
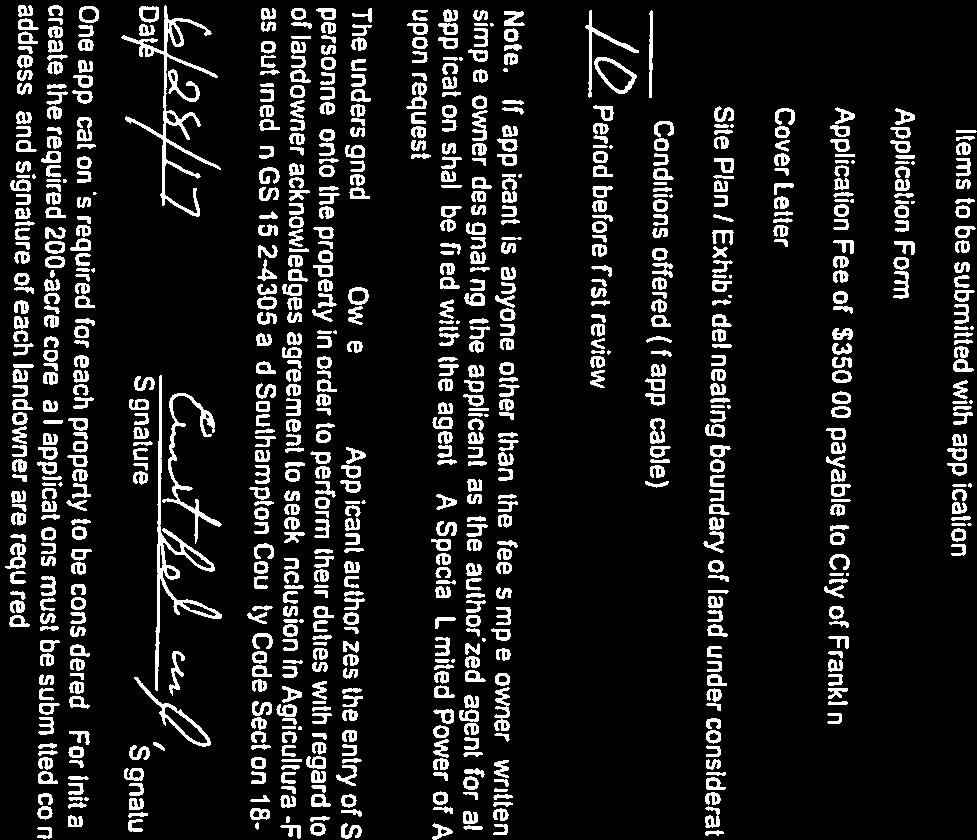
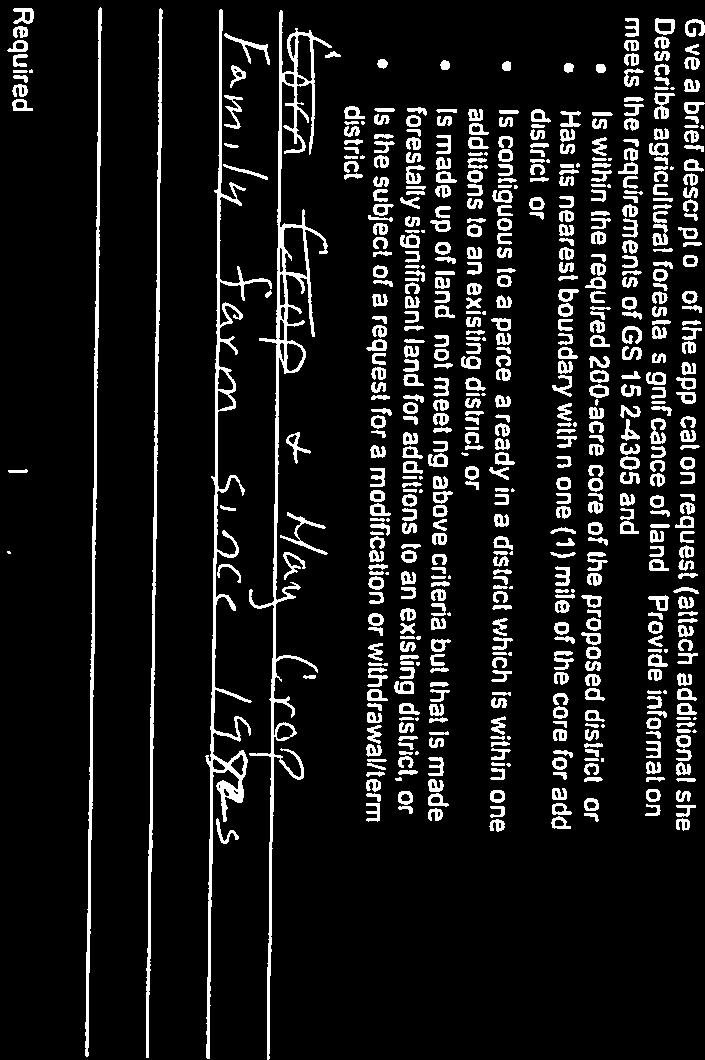
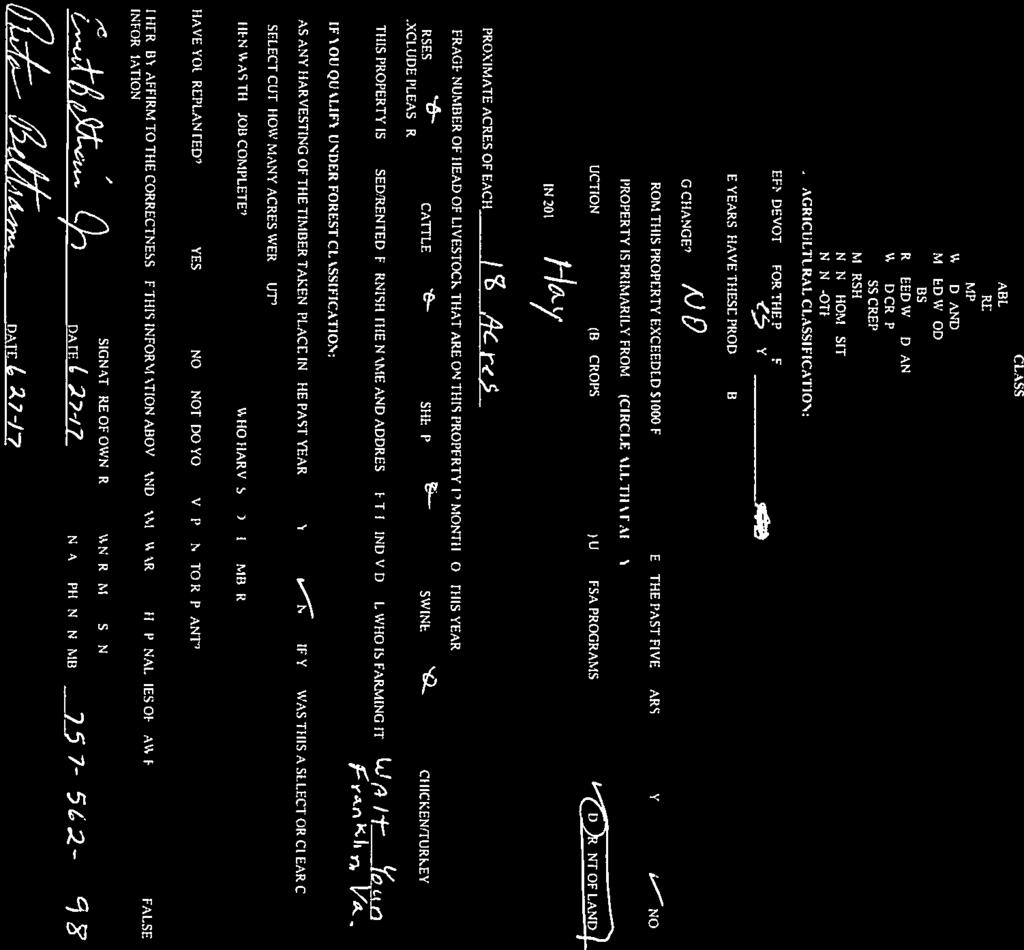
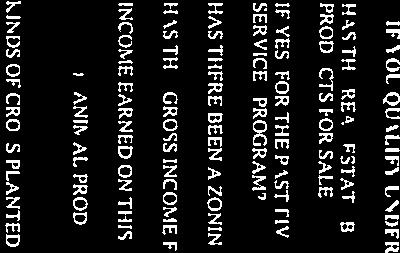
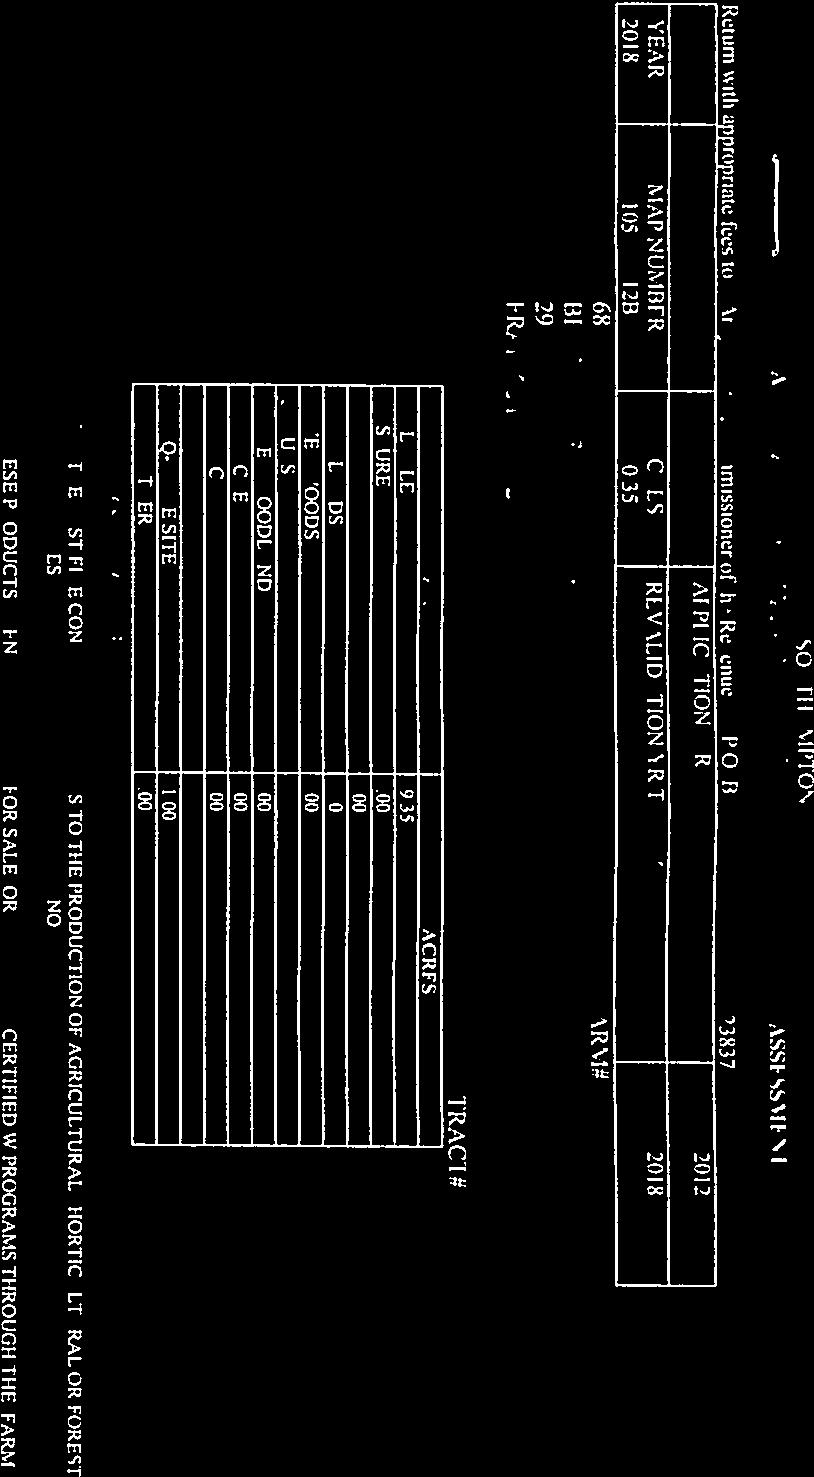
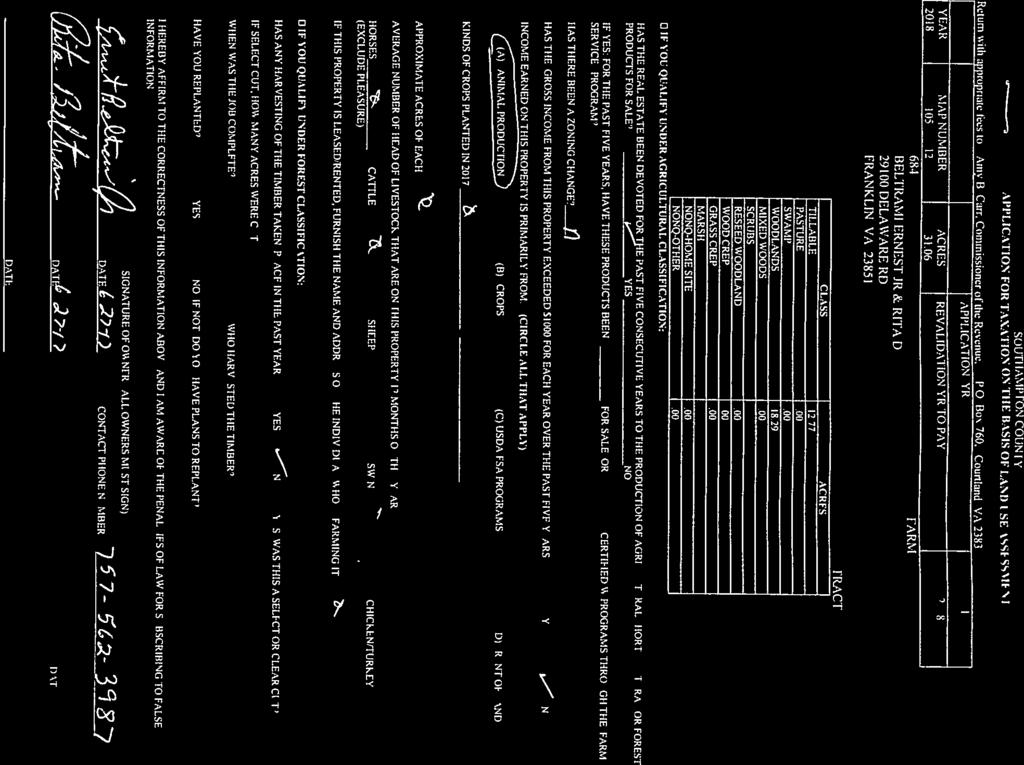
2 Voluntary Agriculture and Forestal District application Darden Core Application Request: Creation of Core of District Requested Term of District: Ten (10) years Owner(s) Hunter Darden, Jr. Hunter Darden, III Ernest and Rita Beltrami, Jr. Francis Widmeyer Lawrence Brown Patricia Falls Tax Parcels 106-1, 106-2A, 106-2, 106-3, , 106-6, , , D, Hunter Darden, III 106-4, , 106-5, Hunter Darden, Jr , B, , Ernest and Rita Beltrami, Jr , , Francis Widmeyer , D, 106-9A, A, 106-9C, 106-9&10, , Lawrence Brown A, C, A, Patricia Falls Total Acreage Comprehensive Plan Designation Zoning Approximately 2,040 acres Agriculture/Forest/Open Space/Rural Residential A-1, Agricultural Applicant Statement Land has been in family for decades for farming and growing trees. Overview The application includes 27 parcels arranged into five (5) areas. The parcels total approximately 2,040 acres. The core area is approximately 1,077 acres. It is located is on the west side of Smith s Ferry Road (SR 258) in the area of its intersection with South Quay Road (SR 189), both north and south of Gardner Drive, a private road. One satellite is along the south side of South Quay Road east of its intersection with Smiths Ferry Road. It is made up of four parcels and totals approximately 280 acres.
3 A second satellite is located on the east side of Smiths Ferry Road at its intersection with Schoolhouse Road. It totals approximately 192 acres in one parcel. A third satellite is located on the south side of Schoolhouse Road. It is made up of five parcels and total approximately 256 acres. The final satellite is both east and west of Delaware Road in the area of Yuma Street. It totals four parcels and includes approximately 234 acres. Criteria for review as specified in Sec (F) Sec (F) outlines the criteria to be used in the assessment of each application to create or add to an agricultural and forestal district. In preparing a recommendation to the Board of Supervisors, it is required that these issues be addressed: There are a number of soil types found in these districts. The soil reports are provided. Following is a brief summary: In the core district, 33% of the land is noted as prime farmland, while 42% is noted a prime farmland if drained, while the remaining 25% is noted as not prime farmland. In the South Quay satellite, 34% of the land is noted as prime farmland, while 2% is noted as prime farmland if drained and the remaining 64% is noted as not prime farmland. In the Smiths Ferry satellite, 85% of the land is noted as prime farmland, while the remaining 15% is noted as not prime farmland. In the Schoolhouse Road satellite, 4% of the land is noted a prime farmland, 31% is noted as prime farmland if drained, and the remaining 65% is noted as not prime farmland. In the Delaware Road satellite, 6% of the land is noted as prime farmland, 18% is noted as prime farmland if drained, and the remaining 76% is noted as not prime farmland. o Climate No climate information specific to these properties is provided. o Topography Three are a number of streams and watercourses that traverse most of these tracts. The Delaware Road, Schoolhouse Road and South Quay Road parcels contain substantial areas within both the 100 year and 500 year floodplains, while the Core and the Smiths Ferry Road tracts are only impacted by floodplain along the water courses o Markets for agricultural and forestal products of this land No market information regarding the products of this property were provided.
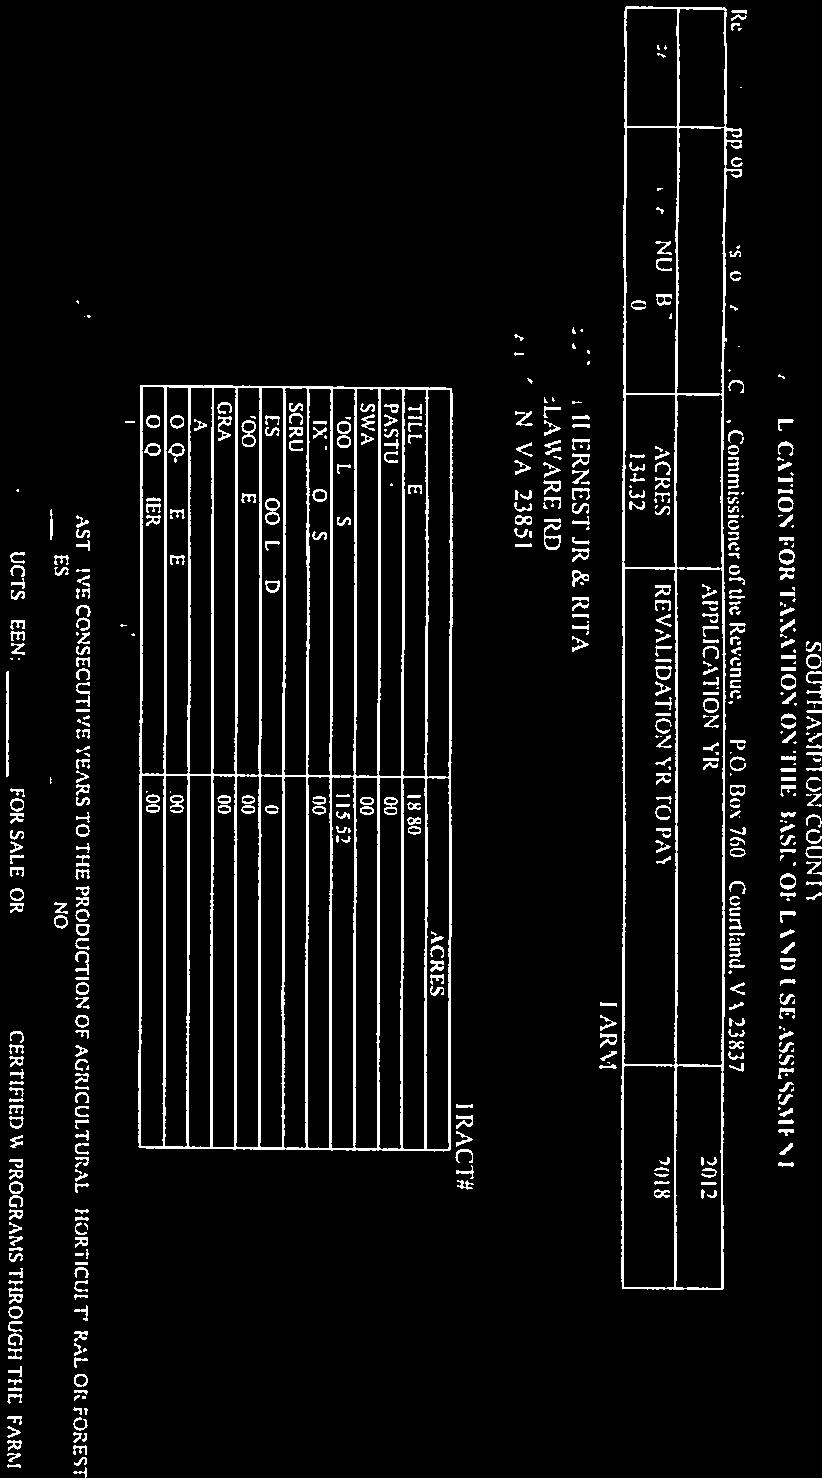
4 o Extent and nature of farm structures on this land The Beltrami properties on the west side of Delaware Road contain substantial agricultural buildings. The Darden properties contain scattered small agricultural buildings. None of the Widmeyer, Falls, or Brown properties contain any physical improvements. o Present status of agriculture and forestry as applies to this land The applications provide that the family and renters continue to use the land for farming and forestry. o Anticipated trends in agricultural economic conditions as applies to this land No anticipated trends in agricultural economic conditions as applies to this land was provided. The assessment also should consider: o Presence of significant agricultural or forestal lands within the district and in areas adjacent thereto that are not in active agricultural or forestal production All of the area within the proposed district itself is in agriculture and forestry use per the application. The surrounding area is for the most part used for agricultural and forestal uses on aerial photographs. Whether property is in active use, however, cannot be determined by aerial photographs. Smiths Ferry Road, Schoolhouse Road, and Delaware Road are all developed with scattered single family residences in the area of these tracts. o Nature and extent of land uses other than active farming or forestry within the district and in areas adjacent thereto There are single family residences along the main roads in the area of these tracts, but the area off the roadways is largely in agricultural and forestry use. o Local development patterns and needs This property is over two (2) miles from the southernmost point of the Courtland Planning Area. Planning Areas are expected to experience limited growth in the planning horizon (10-20) years, but this property is somewhat removed from the Planning Area and little non-agricultural growth, besides scattered single family residences, is expected. The property is bordered by Smiths Ferry Road, Delaware Road and Schoolhouse Road, which all continue to be developed with single family residences, but this interior property remains in agriculture and forestry use. o Comprehensive Plan and applicable zoning regulations The subject property has a Comprehensive Plan designation of Agriculture/Forest/Open Space/Rural Residential. The zoning designation is of the properties is A-1, Agricultural. Use of the property for agriculture and forestry is consistent with both the Comprehensive Plan and the zoning ordinance. o Environmental benefits of retaining specific lands in the district for agricultural and forestal uses. There are environmental benefits of
5 retaining land in general in agriculture and forestry, including providing essential open spaces for clean airsheds, watershed protection, wildlife habitat, and viewsheds. No environmental benefits of retaining this specific land are provided, however. Planning Commission action After a favorable review by the Advisory Committee, the Planning Commission held a public hearing on December 14, 2017 and made a favorable recommendation: Beth Lewis states okay, this is VAFD 2017:07. Application by Hunter Darden Jr., Hunter Darden III, Patricia Falls, Lawrence Brown, Francis Widmeyer, and Ernest and Rita Beltrami, Jr., owners, for the creation of a Voluntary Agriculture and Forestal District. The properties are in the Newsoms Voting and Magisterial Districts. This is made up of five different pieces. You all have a map. I will turn this projector on and show everyone. The core is generally on the west side of Smiths Ferry Road, north of School House Road. The second part of this is one district is on South Quay Road, on the south side, just east of its intersection with Smiths Ferry. The third satellite piece is on the east side of Smith s Ferry and near the intersection of School House Road. The fourth piece is on the south side of School House Road, east of the intersection of Smith s Ferry. The fifth piece is on Delaware Road just north of Yuma Street. Let me see if I can make this bigger. This is on the lower right hand corner of Southampton County. Chairman Drake states this area right here, correct. Beth Lewis states yes. This main piece is the larger piece. A total of 2,040 acres. There are some scattered agriculture buildings throughout most of the property. The soil reports say that it is mostly prime farmland or prime farmland if drained. It has been in ag and forestry use for decades. The notices all went out to the abutting property owners. I have not had any phone calls of objection. I always have phone call with questions, but none with objection to this. This is the Darden Core 1. Chairman Drake states I am going to interject. Does everyone know the location of this? This being 258. School House Road. Beth Lewis states and South Quay, that whole area. Chairman Drake states School House Road goes over to Delaware Road. Is that right Robert? Kind of here, going toward the Bronco Club. Commissioner White states yes. Chairman Drake states right. Just wanted to give you a point of reference, if you did not know. Of course, I think this road right here is 189. Is that correct? That would be another piece of it. And this is the Charles Darden farm, that is what I call it. Of course, then we are getting back down to the Riverdale area here. Beth Lewis states that would be a different core, yes. Chairman Drake states and this is Checkerboard here. Just to give you an idea of where we are talking about.
6 Commissioner White states Monroe Bridge and Checkerboard, yes. Chairman Drake states Monroe Bridge area, right. Okay. So are we going to do these individually? Beth Lewis states this is core one. This is a district, which is 2040 acres and that is the larger piece along both sides of Smiths Ferry Road. Chairman Drake states okay. Anyone have any questions? Is everyone familiar with the location? This is item one. I guess we need to open the public hearing. I am going to now open the public hearing. If anyone would like to come forward to speak, positive, negative, or any comment you would like to make on this. Come forward now. Yes. Please come forward. State your name and address for the record, please. Marshall Deberry states yes, I am Marshall Deberry. I am at Smiths Ferry Road, which is at the intersection of 189 and 258. I grew up here in Southampton County. Moved away and I have recently come back. I am here to speak in favor of all three of these applications. I think it will be very beneficial to the County. I know most of the landowners. I grew up with a couple of them. I think that anything that can continue to preserve the agriculture and the wetlands and the timber in that part of the County; will be quite beneficial. When you mentioned that it had been farmland and timber for a number a years, you can see on maps from the 1860 s, some of these landowners that were in agricultural state then. I did not move back here because I wanted to see a lot of urban development because I came from that. I really liked growing up here when it was agriculture and it has not changed very much. I really appreciate that. Commissioner Edwards states where did you come from, sir. Marshall Deberry states well I grew up here and then moved to Northern Virginia and Alexandria. I was there 40 years. So, as I said, I know some of these landowners and I believe they will be good stewards of the land. I am very much in favor of these, agricultural numbers 1, 2, and 3. I know you did not talk about 2 and 3, but I just wanted to say that. Chairman Drake states any questions for this gentleman. If not, welcome back to the area and thank you for your comments. Marshall Deberry states thank you. Chairman Drake states anyone else. If not, I am going to close the hearing on the first application. Any discussion from this panel? Commissioner Edwards states, Mr. Chairman, it looks like it is all in order. Unless there is further discussion, I would like to move ahead with this. And act on this favorably and get on with the second one. Chairman Drake states do we want to vote on each one, Mrs. Lewis? Beth Lewis states yes. Chairman Drake states would you like to make the
7 motion. Commissioner Edwards states I motion that we move favorably on the first application. Commissioner White states second. Commissioner Chesson states can I ask a general question. This is a question of all three. Did we see in the previous applications received and recommended, included or reserving family transfers? Beth Lewis states the state law does that. Most of the applications include that request as well, but the general statute includes that. Commissioner Chesson states I just did not recall. Exempting home sites, is that also apart of it? Beth Lewis states family transfers, yes. The state law does not specifically say anything about existing home site exemptions. That is a different type of plat than a family transfer. Commissioner Chesson states I guess, I am just trying to figure out, is that helping preserve the agricultural, including that in there, of the County. How does that benefit the County? Beth Lewis states permitting the family transfers? Commissioner Chesson states no. That is already dealt with. Home site exemptions. Does that help the County? Beth Lewis states home site exemptions; I would say almost 90% of this property does not have any home sites on it. If we should run up against that in the next 10 years, then Mr. Railey and I will have to look at that, but an existing home site exemption is only to carve out property around an old home site. And these properties that we have looked at so far, this is 7, 8, and 9, but the first six generally do not have any residential structures on them. Commissioner Chesson states okay. Commissioner Drake states and Mr. Chesson, were you in attendance at our last meeting? Commissioner Chesson states no, I missed it. I apologize for that. Commissioner Drake states it is okay. We understand. We did look at this as an Advisory Committee, all three of these applications. Everything was in order, that is why we are looking at it tonight as the Planning Commission. Alright. Good question and Mrs. Lewis, thank you for answering that. Any other questions? Chairman Drake called for the vote. Michael Drake AYE John T. (Jack) Randall AYE Robert White AYE William Bill Day AYE Dr. Alan W. Edwards AYE J. Michael Mann AYE Douglas A. Chesson AYE Keith Tennessee AYE The motion passed unanimously.

8 APPLICATION OVERVIEW Riverdale District DELAWARE ROAD TRACT 0.7 miles CORE TRACT SOUTH QUAY TRACT SCHOOLHOUSE ROAD TRACT SMITHS FERRY ROAD TRACT

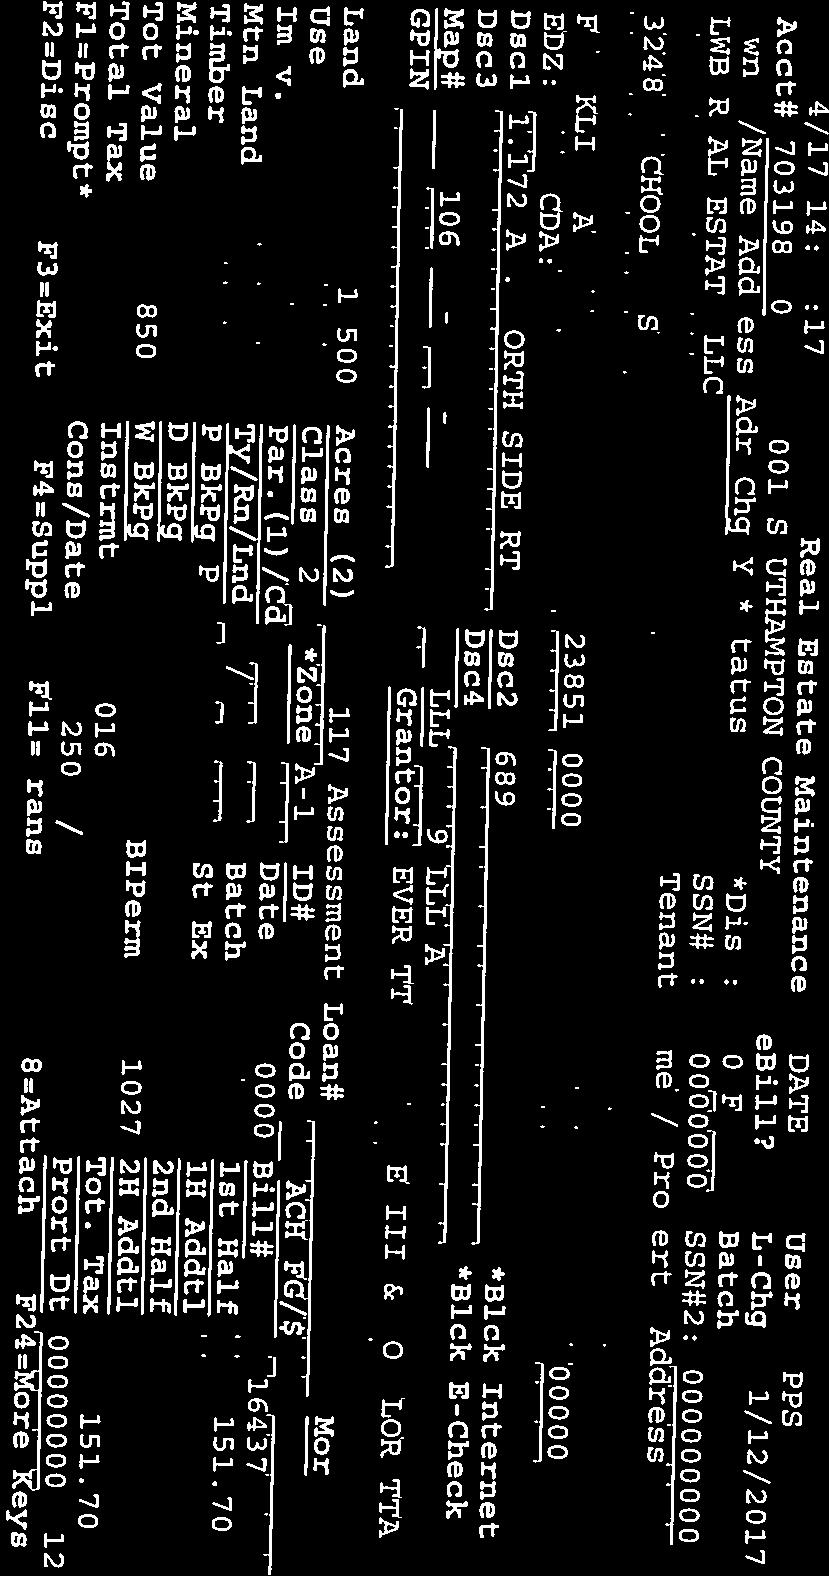
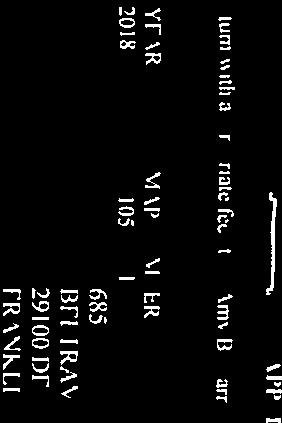
9 CORE TRACT Riverdale District TAX MAP NO. OWNER ACRES Hunter Darden, III A Hunter Darden, III Hunter Darden, III Hunter Darden, III { Hunter Darden, III Hunter Darden, Jr Hunter Darden, Jr Hunter Darden, Jr. { Hunter Darden, III Hunter Darden, III Hunter Darden, Jr D Hunter Darden, III A LWB Real Estate ,141.21

10 SOUTH QUAY ROAD TRACT Riverdale District CORE TRACT SOUTH QUAY TRACT TAX MAP NO. OWNER ACRES A Patricia C. Falls C Patricia C. Falls LWB Real Estate

11 SMITHS FERRY ROAD TRACT Riverdale District TAX MAP NO. OWNER ACRES LWB Real Estate CORE TRACT SMITHS FERRY ROAD TRACT 17

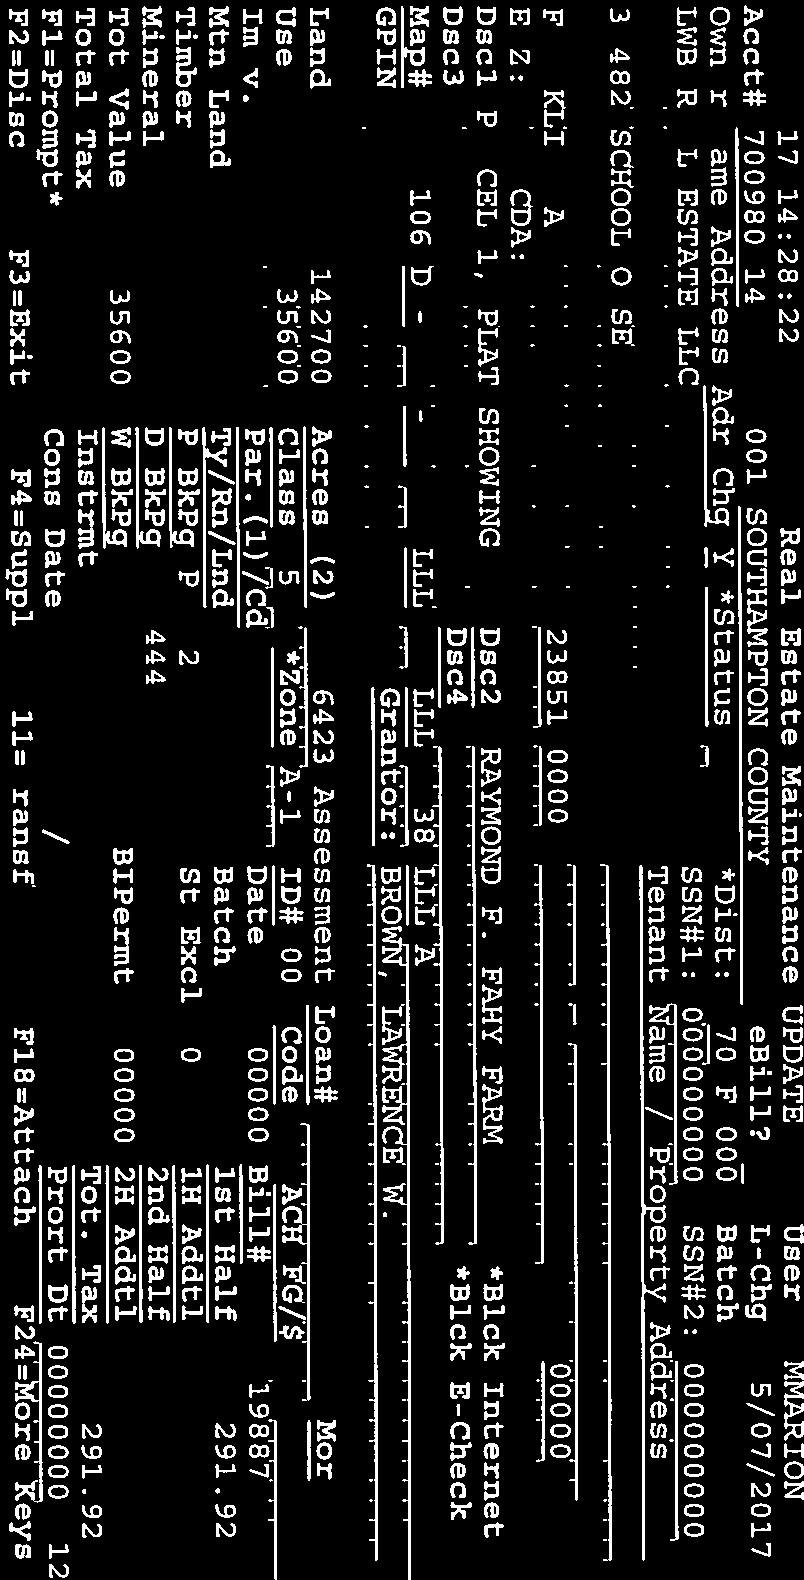
12 SCHOOLHOUSE ROAD TRACT Riverdale District CORE TRACT 18 SCHOOLHOUSE ROAD TRACT TAX MAP NO. OWNER ACRES LWB Real Estate LWB Real Estate { D LWB Real Estate Francis Widmeyer

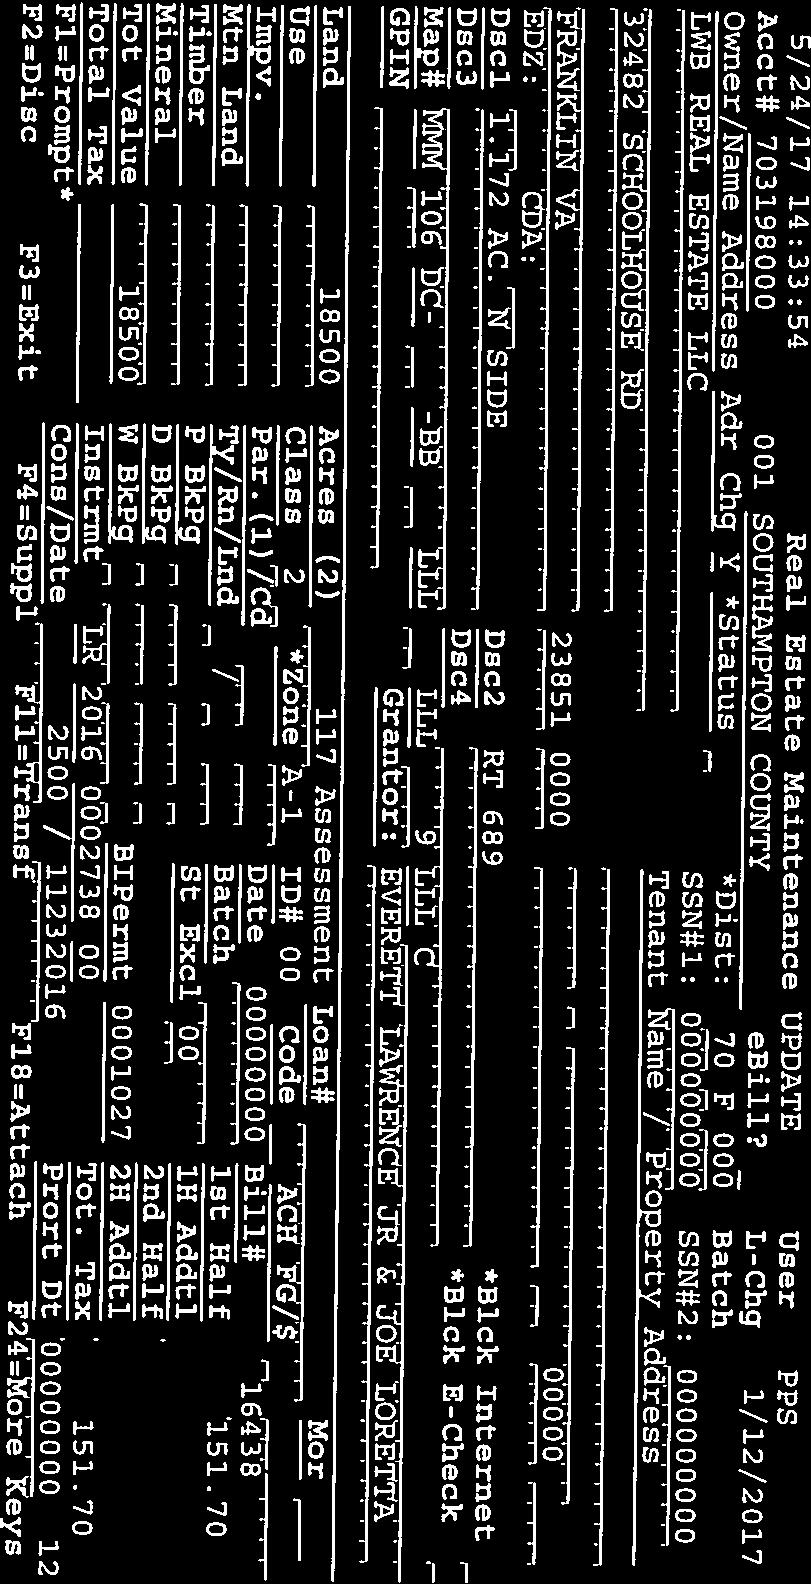
13 24 DELAWARE ROAD TRACT Riverdale District miles 22 CORE TRACT TAX MAP NO. OWNER ACRES Ernerst & Rita Beltrami Ernerst & Rita Beltrami Francis Widmeyer & Joseph Collis
14 AN ORDINANCE TO ESTABLISH THE RIVERDALE AGRICULTURAL AND FORESTAL DISTRICT BE IT ORDAINED by the Board of Supervisors of Southampton County, Virginia that the Southampton County Code be, and hereby is, amended by adding Section establishing the Riverdale Agricultural and Forestal District: Sec Riverdale Agricultural and Forestal District. The district known as the "Riverdale Agricultural and Forestal District" comprising 2, acres, consists of the following described properties: Core Tract - Tax Parcels 106-1, 106-2, 106-2A, 106-3, 106-4, 106-5, 106-6, , , A, , , D; South Quay Road Tract - Tax Parcels A, C, ; Smiths Ferry Road Tract - Tax Parcel ; Schoolhouse Road Tract - Tax Parcels 106-9, , D, ; and Delaware Road Tract - Tax Parcels , and This district, created on January 22, 2018 for not more than 10 years and last reviewed on November 9, 2017, shall next be reviewed prior to November 9, For state law authority, please see through of the 1950 Code of Virginia, as amended. A copy teste:, Clerk Southampton County Board of Supervisors Adopted: January 22, 2018
15
16
17
18
19
20
21
22
23
24
25


26
27

28

29
30
31
32

33


34

35

36 United States Department of Agriculture Natural Resources Conservation Service A product of the National Cooperative Soil Survey, a joint effort of the United States Department of Agriculture and other Federal agencies, State agencies including the Agricultural Experiment Stations, and local participants Custom Soil Resource Report for Southampton County, Virginia Darden Brown Core 1 Core October 23, 2017
37 Preface Soil surveys contain information that affects land use planning in survey areas. They highlight soil limitations that affect various land uses and provide information about the properties of the soils in the survey areas. Soil surveys are designed for many different users, including farmers, ranchers, foresters, agronomists, urban planners, community officials, engineers, developers, builders, and home buyers. Also, conservationists, teachers, students, and specialists in recreation, waste disposal, and pollution control can use the surveys to help them understand, protect, or enhance the environment. Various land use regulations of Federal, State, and local governments may impose special restrictions on land use or land treatment. Soil surveys identify soil properties that are used in making various land use or land treatment decisions. The information is intended to help the land users identify and reduce the effects of soil limitations on various land uses. The landowner or user is responsible for identifying and complying with existing laws and regulations. Although soil survey information can be used for general farm, local, and wider area planning, onsite investigation is needed to supplement this information in some cases. Examples include soil quality assessments ( portal/nrcs/main/soils/health/) and certain conservation and engineering applications. For more detailed information, contact your local USDA Service Center ( or your NRCS State Soil Scientist ( cid=nrcs142p2_053951). Great differences in soil properties can occur within short distances. Some soils are seasonally wet or subject to flooding. Some are too unstable to be used as a foundation for buildings or roads. Clayey or wet soils are poorly suited to use as septic tank absorption fields. A high water table makes a soil poorly suited to basements or underground installations. The National Cooperative Soil Survey is a joint effort of the United States Department of Agriculture and other Federal agencies, State agencies including the Agricultural Experiment Stations, and local agencies. The Natural Resources Conservation Service (NRCS) has leadership for the Federal part of the National Cooperative Soil Survey. Information about soils is updated periodically. Updated information is available through the NRCS Web Soil Survey, the site for official soil survey information. The U.S. Department of Agriculture (USDA) prohibits discrimination in all its programs and activities on the basis of race, color, national origin, age, disability, and where applicable, sex, marital status, familial status, parental status, religion, sexual orientation, genetic information, political beliefs, reprisal, or because all or a part of an individual's income is derived from any public assistance program. (Not all prohibited bases apply to all programs.) Persons with disabilities who require 2
38 alternative means for communication of program information (Braille, large print, audiotape, etc.) should contact USDA's TARGET Center at (202) (voice and TDD). To file a complaint of discrimination, write to USDA, Director, Office of Civil Rights, 1400 Independence Avenue, S.W., Washington, D.C or call (800) (voice) or (202) (TDD). USDA is an equal opportunity provider and employer. 3
39 Contents Preface... 2 How Soil Surveys Are Made...5 Soil Map... 8 Soil Map...9 Legend...10 Map Unit Legend Map Unit Descriptions...11 Southampton County, Virginia A Altavista fine sandy loam, 0 to 2 percent slopes, rarely flooded B Altavista fine sandy loam, 2 to 6 percent slopes, rarely flooded A Augusta sandy loam, 0 to 2 percent slopes, rarely flooded B Bojac loamy sand, 2 to 6 percent slopes, very rarely flooded A Munden loamy sand, 0 to 2 percent slopes, rarely flooded A Nimmo sandy loam, 0 to 2 percent slopes A Seabrook loamy sand, 0 to 2 percent slopes A State fine sandy loam, 0 to 2 percent slopes, very rarely flooded B State fine sandy loam, 2 to 6 percent slopes, very rarely flooded B Tarboro loamy sand, 0 to 6 percent slopes A Tomotley sandy loam, 0 to 2 percent slopes, rarely flooded Udorthents, smoothed W Water...27 References
40 How Soil Surveys Are Made Soil surveys are made to provide information about the soils and miscellaneous areas in a specific area. They include a description of the soils and miscellaneous areas and their location on the landscape and tables that show soil properties and limitations affecting various uses. Soil scientists observed the steepness, length, and shape of the slopes; the general pattern of drainage; the kinds of crops and native plants; and the kinds of bedrock. They observed and described many soil profiles. A soil profile is the sequence of natural layers, or horizons, in a soil. The profile extends from the surface down into the unconsolidated material in which the soil formed or from the surface down to bedrock. The unconsolidated material is devoid of roots and other living organisms and has not been changed by other biological activity. Currently, soils are mapped according to the boundaries of major land resource areas (MLRAs). MLRAs are geographically associated land resource units that share common characteristics related to physiography, geology, climate, water resources, soils, biological resources, and land uses (USDA, 2006). Soil survey areas typically consist of parts of one or more MLRA. The soils and miscellaneous areas in a survey area occur in an orderly pattern that is related to the geology, landforms, relief, climate, and natural vegetation of the area. Each kind of soil and miscellaneous area is associated with a particular kind of landform or with a segment of the landform. By observing the soils and miscellaneous areas in the survey area and relating their position to specific segments of the landform, a soil scientist develops a concept, or model, of how they were formed. Thus, during mapping, this model enables the soil scientist to predict with a considerable degree of accuracy the kind of soil or miscellaneous area at a specific location on the landscape. Commonly, individual soils on the landscape merge into one another as their characteristics gradually change. To construct an accurate soil map, however, soil scientists must determine the boundaries between the soils. They can observe only a limited number of soil profiles. Nevertheless, these observations, supplemented by an understanding of the soil-vegetation-landscape relationship, are sufficient to verify predictions of the kinds of soil in an area and to determine the boundaries. Soil scientists recorded the characteristics of the soil profiles that they studied. They noted soil color, texture, size and shape of soil aggregates, kind and amount of rock fragments, distribution of plant roots, reaction, and other features that enable them to identify soils. After describing the soils in the survey area and determining their properties, the soil scientists assigned the soils to taxonomic classes (units). Taxonomic classes are concepts. Each taxonomic class has a set of soil characteristics with precisely defined limits. The classes are used as a basis for comparison to classify soils systematically. Soil taxonomy, the system of taxonomic classification used in the United States, is based mainly on the kind and character of soil properties and the arrangement of horizons within the profile. After the soil 5
41 scientists classified and named the soils in the survey area, they compared the individual soils with similar soils in the same taxonomic class in other areas so that they could confirm data and assemble additional data based on experience and research. The objective of soil mapping is not to delineate pure map unit components; the objective is to separate the landscape into landforms or landform segments that have similar use and management requirements. Each map unit is defined by a unique combination of soil components and/or miscellaneous areas in predictable proportions. Some components may be highly contrasting to the other components of the map unit. The presence of minor components in a map unit in no way diminishes the usefulness or accuracy of the data. The delineation of such landforms and landform segments on the map provides sufficient information for the development of resource plans. If intensive use of small areas is planned, onsite investigation is needed to define and locate the soils and miscellaneous areas. Soil scientists make many field observations in the process of producing a soil map. The frequency of observation is dependent upon several factors, including scale of mapping, intensity of mapping, design of map units, complexity of the landscape, and experience of the soil scientist. Observations are made to test and refine the soil-landscape model and predictions and to verify the classification of the soils at specific locations. Once the soil-landscape model is refined, a significantly smaller number of measurements of individual soil properties are made and recorded. These measurements may include field measurements, such as those for color, depth to bedrock, and texture, and laboratory measurements, such as those for content of sand, silt, clay, salt, and other components. Properties of each soil typically vary from one point to another across the landscape. Observations for map unit components are aggregated to develop ranges of characteristics for the components. The aggregated values are presented. Direct measurements do not exist for every property presented for every map unit component. Values for some properties are estimated from combinations of other properties. While a soil survey is in progress, samples of some of the soils in the area generally are collected for laboratory analyses and for engineering tests. Soil scientists interpret the data from these analyses and tests as well as the field-observed characteristics and the soil properties to determine the expected behavior of the soils under different uses. Interpretations for all of the soils are field tested through observation of the soils in different uses and under different levels of management. Some interpretations are modified to fit local conditions, and some new interpretations are developed to meet local needs. Data are assembled from other sources, such as research information, production records, and field experience of specialists. For example, data on crop yields under defined levels of management are assembled from farm records and from field or plot experiments on the same kinds of soil. Predictions about soil behavior are based not only on soil properties but also on such variables as climate and biological activity. Soil conditions are predictable over long periods of time, but they are not predictable from year to year. For example, soil scientists can predict with a fairly high degree of accuracy that a given soil will have a high water table within certain depths in most years, but they cannot predict that a high water table will always be at a specific level in the soil on a specific date. After soil scientists located and identified the significant natural bodies of soil in the survey area, they drew the boundaries of these bodies on aerial photographs and 6
42 identified each as a specific map unit. Aerial photographs show trees, buildings, fields, roads, and rivers, all of which help in locating boundaries accurately. 7
43 Soil Map The soil map section includes the soil map for the defined area of interest, a list of soil map units on the map and extent of each map unit, and cartographic symbols displayed on the map. Also presented are various metadata about data used to produce the map, and a description of each soil map unit. 8

44 76 58' 20'' W Soil Map 76 55' 3'' W 36 37' 42'' N 36 35' 59'' N ' 42'' N 36 35' 59'' N 76 58' 20'' W N Map Scale: 1:22,400 if printed on A landscape (11" x 8.5") sheet. Meters Feet Map projection: Web Mercator Corner coordinates: WGS84 Edge tics: UTM Zone 18N WGS ' 3'' W
45 MAP LEGEND MAP INFORMATION Area of Interest (AOI) Area of Interest (AOI) Soils Soil Map Unit Polygons Soil Map Unit Lines Soil Map Unit Points Special Point Features Blowout Borrow Pit Clay Spot Closed Depression Gravel Pit Gravelly Spot Landfill Lava Flow Marsh or swamp Mine or Quarry Miscellaneous Water Perennial Water Rock Outcrop Saline Spot Sandy Spot Severely Eroded Spot Sinkhole Slide or Slip Sodic Spot Spoil Area Stony Spot Very Stony Spot Wet Spot Other Special Line Features Water Features Streams and Canals Transportation Rails Interstate Highways US Routes Major Roads Local Roads Background Aerial Photography The soil surveys that comprise your AOI were mapped at 1:24,000. Please rely on the bar scale on each map sheet for map measurements. Source of Map: Natural Resources Conservation Service Web Soil Survey URL: Coordinate System: Web Mercator (EPSG:3857) Maps from the Web Soil Survey are based on the Web Mercator projection, which preserves direction and shape but distorts distance and area. A projection that preserves area, such as the Albers equal-area conic projection, should be used if more accurate calculations of distance or area are required. This product is generated from the USDA-NRCS certified data as of the version date(s) listed below. Soil Survey Area: Southampton County, Virginia Survey Area Data: Version 15, Sep 24, 2014 Soil map units are labeled (as space allows) for map scales 1:50,000 or larger. Date(s) aerial images were photographed: Jul 7, 2016 Nov 22, 2016 The orthophoto or other base map on which the soil lines were compiled and digitized probably differs from the background imagery displayed on these maps. As a result, some minor shifting of map unit boundaries may be evident. 10
46 Map Unit Legend Map Unit Symbol Map Unit Name Acres in AOI Percent of AOI 2A Altavista fine sandy loam, 0 to 2 percent slopes, rarely flooded 2B Altavista fine sandy loam, 2 to 6 percent slopes, rarely flooded 3A Augusta sandy loam, 0 to 2 percent slopes, rarely flooded 5B Bojac loamy sand, 2 to 6 percent slopes, very rarely flooded 15A Munden loamy sand, 0 to 2 percent slopes, rarely flooded 19A Nimmo sandy loam, 0 to 2 percent slopes 25A Seabrook loamy sand, 0 to 2 percent slopes 27A State fine sandy loam, 0 to 2 percent slopes, very rarely flooded 27B State fine sandy loam, 2 to 6 percent slopes, very rarely flooded 28B Tarboro loamy sand, 0 to 6 percent slopes 29A Tomotley sandy loam, 0 to 2 percent slopes, rarely flooded % % % % % % % % % % % 31 Udorthents, smoothed % W Water % Totals for Area of Interest 1, % Map Unit Descriptions The map units delineated on the detailed soil maps in a soil survey represent the soils or miscellaneous areas in the survey area. The map unit descriptions, along with the maps, can be used to determine the composition and properties of a unit. A map unit delineation on a soil map represents an area dominated by one or more major kinds of soil or miscellaneous areas. A map unit is identified and named according to the taxonomic classification of the dominant soils. Within a taxonomic class there are precisely defined limits for the properties of the soils. On the landscape, however, the soils are natural phenomena, and they have the characteristic variability of all natural phenomena. Thus, the range of some observed properties may extend beyond the limits defined for a taxonomic class. Areas of soils of a single taxonomic class rarely, if ever, can be mapped without including areas of other taxonomic classes. Consequently, every map unit is made 11
47 up of the soils or miscellaneous areas for which it is named and some minor components that belong to taxonomic classes other than those of the major soils. Most minor soils have properties similar to those of the dominant soil or soils in the map unit, and thus they do not affect use and management. These are called noncontrasting, or similar, components. They may or may not be mentioned in a particular map unit description. Other minor components, however, have properties and behavioral characteristics divergent enough to affect use or to require different management. These are called contrasting, or dissimilar, components. They generally are in small areas and could not be mapped separately because of the scale used. Some small areas of strongly contrasting soils or miscellaneous areas are identified by a special symbol on the maps. If included in the database for a given area, the contrasting minor components are identified in the map unit descriptions along with some characteristics of each. A few areas of minor components may not have been observed, and consequently they are not mentioned in the descriptions, especially where the pattern was so complex that it was impractical to make enough observations to identify all the soils and miscellaneous areas on the landscape. The presence of minor components in a map unit in no way diminishes the usefulness or accuracy of the data. The objective of mapping is not to delineate pure taxonomic classes but rather to separate the landscape into landforms or landform segments that have similar use and management requirements. The delineation of such segments on the map provides sufficient information for the development of resource plans. If intensive use of small areas is planned, however, onsite investigation is needed to define and locate the soils and miscellaneous areas. An identifying symbol precedes the map unit name in the map unit descriptions. Each description includes general facts about the unit and gives important soil properties and qualities. Soils that have profiles that are almost alike make up a soil series. Except for differences in texture of the surface layer, all the soils of a series have major horizons that are similar in composition, thickness, and arrangement. Soils of one series can differ in texture of the surface layer, slope, stoniness, salinity, degree of erosion, and other characteristics that affect their use. On the basis of such differences, a soil series is divided into soil phases. Most of the areas shown on the detailed soil maps are phases of soil series. The name of a soil phase commonly indicates a feature that affects use or management. For example, Alpha silt loam, 0 to 2 percent slopes, is a phase of the Alpha series. Some map units are made up of two or more major soils or miscellaneous areas. These map units are complexes, associations, or undifferentiated groups. A complex consists of two or more soils or miscellaneous areas in such an intricate pattern or in such small areas that they cannot be shown separately on the maps. The pattern and proportion of the soils or miscellaneous areas are somewhat similar in all areas. Alpha-Beta complex, 0 to 6 percent slopes, is an example. An association is made up of two or more geographically associated soils or miscellaneous areas that are shown as one unit on the maps. Because of present or anticipated uses of the map units in the survey area, it was not considered practical or necessary to map the soils or miscellaneous areas separately. The pattern and relative proportion of the soils or miscellaneous areas are somewhat similar. Alpha-Beta association, 0 to 2 percent slopes, is an example. 12
48 An undifferentiated group is made up of two or more soils or miscellaneous areas that could be mapped individually but are mapped as one unit because similar interpretations can be made for use and management. The pattern and proportion of the soils or miscellaneous areas in a mapped area are not uniform. An area can be made up of only one of the major soils or miscellaneous areas, or it can be made up of all of them. Alpha and Beta soils, 0 to 2 percent slopes, is an example. Some surveys include miscellaneous areas. Such areas have little or no soil material and support little or no vegetation. Rock outcrop is an example. 13
49 Southampton County, Virginia 2A Altavista fine sandy loam, 0 to 2 percent slopes, rarely flooded Map Unit Setting National map unit symbol: rnw7 Mean annual precipitation: 42 to 54 inches Frost-free period: 180 to 208 days Farmland classification: All areas are prime farmland Map Unit Composition Altavista and similar soils: 85 percent Minor components: 1 percent Estimates are based on observations, descriptions, and transects of the mapunit. Description of Altavista Setting Landform: Stream terraces Landform position (three-dimensional): Tread Down-slope shape: Linear Across-slope shape: Linear Parent material: Loamy alluvium Typical profile H1-0 to 11 inches: fine sandy loam H2-11 to 38 inches: loam H3-38 to 72 inches: sandy clay loam Properties and qualities Slope: 0 to 2 percent Depth to restrictive feature: More than 80 inches Natural drainage class: Moderately well drained Runoff class: Low Capacity of the most limiting layer to transmit water (Ksat): Moderately high to high (0.57 to 1.98 in/hr) Depth to water table: About 18 to 30 inches Frequency of flooding: Rare Frequency of ponding: None Available water storage in profile: Moderate (about 8.0 inches) Interpretive groups Land capability classification (irrigated): None specified Land capability classification (nonirrigated): 2w Hydrologic Soil Group: C Hydric soil rating: No Minor Components Tomotley Percent of map unit: 1 percent Landform: Depressions on stream terraces, drainageways on stream terraces Landform position (three-dimensional): Base slope, tread Down-slope shape: Linear Across-slope shape: Linear Hydric soil rating: Yes 14
50 2B Altavista fine sandy loam, 2 to 6 percent slopes, rarely flooded Map Unit Setting National map unit symbol: rnw8 Mean annual precipitation: 42 to 54 inches Frost-free period: 180 to 208 days Farmland classification: All areas are prime farmland Map Unit Composition Altavista and similar soils: 85 percent Minor components: 1 percent Estimates are based on observations, descriptions, and transects of the mapunit. Description of Altavista Setting Landform: Stream terraces Landform position (three-dimensional): Tread Down-slope shape: Convex Across-slope shape: Linear Parent material: Loamy alluvium Typical profile H1-0 to 11 inches: fine sandy loam H2-11 to 38 inches: loam H3-38 to 72 inches: sandy clay loam Properties and qualities Slope: 2 to 6 percent Depth to restrictive feature: More than 80 inches Natural drainage class: Moderately well drained Runoff class: Low Capacity of the most limiting layer to transmit water (Ksat): Moderately high to high (0.57 to 1.98 in/hr) Depth to water table: About 18 to 30 inches Frequency of flooding: Rare Frequency of ponding: None Available water storage in profile: Moderate (about 8.0 inches) Interpretive groups Land capability classification (irrigated): None specified Land capability classification (nonirrigated): 2e Hydrologic Soil Group: C Hydric soil rating: No Minor Components Tomotley Percent of map unit: 1 percent Landform: Depressions on stream terraces, drainageways on stream terraces 15
51 Landform position (three-dimensional): Base slope, tread Down-slope shape: Linear Across-slope shape: Linear Hydric soil rating: Yes 3A Augusta sandy loam, 0 to 2 percent slopes, rarely flooded Map Unit Setting National map unit symbol: rnw9 Mean annual precipitation: 42 to 54 inches Frost-free period: 180 to 208 days Farmland classification: Prime farmland if drained Map Unit Composition Augusta and similar soils: 85 percent Minor components: 3 percent Estimates are based on observations, descriptions, and transects of the mapunit. Description of Augusta Setting Landform: Stream terraces, drainageways Landform position (three-dimensional): Base slope, tread Down-slope shape: Linear Across-slope shape: Linear Parent material: Loamy alluvium Typical profile H1-0 to 11 inches: sandy loam H2-11 to 46 inches: sandy clay loam H3-46 to 84 inches: sand Properties and qualities Slope: 0 to 2 percent Depth to restrictive feature: More than 80 inches Natural drainage class: Somewhat poorly drained Runoff class: Very high Capacity of the most limiting layer to transmit water (Ksat): Moderately high to high (0.57 to 1.98 in/hr) Depth to water table: About 12 to 24 inches Frequency of flooding: Rare Frequency of ponding: None Available water storage in profile: Moderate (about 7.9 inches) Interpretive groups Land capability classification (irrigated): None specified Land capability classification (nonirrigated): 4w Hydrologic Soil Group: B/D Hydric soil rating: No 16
52 Minor Components Roanoke Percent of map unit: 2 percent Landform: Stream terraces, flood plains Landform position (three-dimensional): Tread, riser Down-slope shape: Linear Across-slope shape: Linear Hydric soil rating: Yes Tomotley Percent of map unit: 1 percent Landform: Depressions on stream terraces, drainageways on stream terraces Landform position (three-dimensional): Base slope, tread Down-slope shape: Linear Across-slope shape: Linear Hydric soil rating: Yes 5B Bojac loamy sand, 2 to 6 percent slopes, very rarely flooded Map Unit Setting National map unit symbol: rnwc Mean annual precipitation: 42 to 54 inches Frost-free period: 180 to 208 days Farmland classification: All areas are prime farmland Map Unit Composition Bojac and similar soils: 75 percent Minor components: 1 percent Estimates are based on observations, descriptions, and transects of the mapunit. Description of Bojac Setting Landform: Stream terraces Landform position (three-dimensional): Tread, riser Down-slope shape: Linear Across-slope shape: Linear Parent material: Sandy and/or loamy alluvium Typical profile H1-0 to 13 inches: loamy sand H2-13 to 48 inches: sandy loam H3-48 to 66 inches: sand Properties and qualities Slope: 2 to 6 percent Depth to restrictive feature: More than 80 inches Natural drainage class: Well drained Runoff class: Very low 17
53 Capacity of the most limiting layer to transmit water (Ksat): High (1.98 to 5.95 in/hr) Depth to water table: About 48 to 79 inches Frequency of flooding: Very rare Frequency of ponding: None Available water storage in profile: Low (about 5.8 inches) Interpretive groups Land capability classification (irrigated): None specified Land capability classification (nonirrigated): 2e Hydrologic Soil Group: A Hydric soil rating: No Minor Components Tomotley Percent of map unit: 1 percent Landform: Depressions on stream terraces, drainageways on stream terraces Landform position (three-dimensional): Base slope, tread Down-slope shape: Linear Across-slope shape: Linear Hydric soil rating: Yes 15A Munden loamy sand, 0 to 2 percent slopes, rarely flooded Map Unit Setting National map unit symbol: rnwv Mean annual precipitation: 42 to 54 inches Frost-free period: 180 to 208 days Farmland classification: All areas are prime farmland Map Unit Composition Munden and similar soils: 85 percent Minor components: 3 percent Estimates are based on observations, descriptions, and transects of the mapunit. Description of Munden Setting Landform: Stream terraces Landform position (three-dimensional): Tread, riser Down-slope shape: Convex Across-slope shape: Convex Parent material: Loamy marine deposits and/or sandy marine deposits and/or alluvium Typical profile H1-0 to 17 inches: loamy sand H2-17 to 36 inches: sandy loam H3-36 to 65 inches: sandy loam 18
54 Properties and qualities Slope: 0 to 2 percent Depth to restrictive feature: More than 80 inches Natural drainage class: Moderately well drained Runoff class: Very low Capacity of the most limiting layer to transmit water (Ksat): Moderately high to high (0.57 to 5.95 in/hr) Depth to water table: About 18 to 30 inches Frequency of flooding: Rare Frequency of ponding: None Available water storage in profile: Low (about 5.3 inches) Interpretive groups Land capability classification (irrigated): None specified Land capability classification (nonirrigated): 2w Hydrologic Soil Group: B Hydric soil rating: No Minor Components Nimmo Percent of map unit: 2 percent Landform: Stream terraces Landform position (three-dimensional): Riser Down-slope shape: Linear Across-slope shape: Linear Hydric soil rating: Yes Tomotley Percent of map unit: 1 percent Landform: Depressions on stream terraces, drainageways on stream terraces Landform position (three-dimensional): Base slope, tread Down-slope shape: Linear Across-slope shape: Linear Hydric soil rating: Yes 19A Nimmo sandy loam, 0 to 2 percent slopes Map Unit Setting National map unit symbol: rnx1 Mean annual precipitation: 42 to 54 inches Frost-free period: 180 to 208 days Farmland classification: Prime farmland if drained Map Unit Composition Nimmo and similar soils: 80 percent Minor components: 3 percent Estimates are based on observations, descriptions, and transects of the mapunit. 19
55 Description of Nimmo Setting Landform: Stream terraces Landform position (three-dimensional): Riser Down-slope shape: Linear Across-slope shape: Linear Parent material: Sandy alluvium and/or loamy alluvium Typical profile H1-0 to 14 inches: sandy loam H2-14 to 32 inches: fine sandy loam H3-32 to 64 inches: coarse sand Properties and qualities Slope: 0 to 2 percent Depth to restrictive feature: More than 80 inches Natural drainage class: Poorly drained Runoff class: Very high Capacity of the most limiting layer to transmit water (Ksat): Moderately high to high (0.57 to 1.98 in/hr) Depth to water table: About 0 to 12 inches Frequency of flooding: None Frequency of ponding: None Available water storage in profile: Low (about 5.7 inches) Interpretive groups Land capability classification (irrigated): None specified Land capability classification (nonirrigated): 4w Hydrologic Soil Group: B/D Hydric soil rating: Yes Minor Components Roanoke Percent of map unit: 2 percent Landform: Stream terraces, flood plains Landform position (three-dimensional): Tread, riser Down-slope shape: Linear Across-slope shape: Linear Hydric soil rating: Yes Tomotley Percent of map unit: 1 percent Landform: Depressions on stream terraces, drainageways on stream terraces Landform position (three-dimensional): Base slope, tread Down-slope shape: Linear Across-slope shape: Linear Hydric soil rating: Yes 20
56 25A Seabrook loamy sand, 0 to 2 percent slopes Map Unit Setting National map unit symbol: rnx9 Mean annual precipitation: 42 to 54 inches Frost-free period: 180 to 208 days Farmland classification: Not prime farmland Map Unit Composition Seabrook and similar soils: 80 percent Estimates are based on observations, descriptions, and transects of the mapunit. Description of Seabrook Setting Landform: Stream terraces Landform position (three-dimensional): Tread, riser Down-slope shape: Convex Across-slope shape: Convex Parent material: Sandy alluvium Typical profile H1-0 to 8 inches: loamy sand H2-8 to 32 inches: loamy fine sand H3-32 to 60 inches: fine sand Properties and qualities Slope: 0 to 2 percent Depth to restrictive feature: More than 80 inches Natural drainage class: Moderately well drained Runoff class: Very low Capacity of the most limiting layer to transmit water (Ksat): High to very high (5.95 to in/hr) Depth to water table: About 24 to 42 inches Frequency of flooding: None Frequency of ponding: None Available water storage in profile: Low (about 3.2 inches) Interpretive groups Land capability classification (irrigated): None specified Land capability classification (nonirrigated): 3s Hydrologic Soil Group: A Hydric soil rating: No 21
57 27A State fine sandy loam, 0 to 2 percent slopes, very rarely flooded Map Unit Setting National map unit symbol: rnxf Mean annual precipitation: 42 to 54 inches Frost-free period: 180 to 208 days Farmland classification: All areas are prime farmland Map Unit Composition State and similar soils: 95 percent Estimates are based on observations, descriptions, and transects of the mapunit. Description of State Setting Landform: Stream terraces Landform position (three-dimensional): Tread, riser Down-slope shape: Convex Across-slope shape: Convex Parent material: Sandy and/or loamy alluvium Typical profile H1-0 to 10 inches: fine sandy loam H2-10 to 56 inches: sandy clay loam H3-56 to 84 inches: sandy loam Properties and qualities Slope: 0 to 2 percent Depth to restrictive feature: More than 80 inches Natural drainage class: Well drained Runoff class: Low Capacity of the most limiting layer to transmit water (Ksat): Moderately high to high (0.57 to 1.98 in/hr) Depth to water table: About 48 to 79 inches Frequency of flooding: Very rare Frequency of ponding: None Available water storage in profile: High (about 9.3 inches) Interpretive groups Land capability classification (irrigated): None specified Land capability classification (nonirrigated): 1 Hydrologic Soil Group: B Hydric soil rating: No 22
58 27B State fine sandy loam, 2 to 6 percent slopes, very rarely flooded Map Unit Setting National map unit symbol: rnxg Mean annual precipitation: 42 to 54 inches Frost-free period: 180 to 208 days Farmland classification: All areas are prime farmland Map Unit Composition State and similar soils: 85 percent Estimates are based on observations, descriptions, and transects of the mapunit. Description of State Setting Landform: Stream terraces Landform position (three-dimensional): Tread, riser Down-slope shape: Convex Across-slope shape: Convex Parent material: Sandy and/or loamy alluvium Typical profile H1-0 to 10 inches: fine sandy loam H2-10 to 56 inches: sandy clay loam H3-56 to 84 inches: sandy loam Properties and qualities Slope: 2 to 6 percent Depth to restrictive feature: More than 80 inches Natural drainage class: Well drained Runoff class: Low Capacity of the most limiting layer to transmit water (Ksat): Moderately high to high (0.57 to 1.98 in/hr) Depth to water table: About 48 to 79 inches Frequency of flooding: Very rare Frequency of ponding: None Available water storage in profile: High (about 9.3 inches) Interpretive groups Land capability classification (irrigated): None specified Land capability classification (nonirrigated): 2e Hydrologic Soil Group: B Hydric soil rating: No 23
59 28B Tarboro loamy sand, 0 to 6 percent slopes Map Unit Setting National map unit symbol: rnxh Mean annual precipitation: 42 to 54 inches Frost-free period: 180 to 208 days Farmland classification: Not prime farmland Map Unit Composition Tarboro and similar soils: 95 percent Minor components: 2 percent Estimates are based on observations, descriptions, and transects of the mapunit. Description of Tarboro Setting Landform: Stream terraces Landform position (three-dimensional): Tread, riser Down-slope shape: Convex Across-slope shape: Convex Parent material: Sandy alluvium Typical profile H1-0 to 8 inches: loamy sand H2-8 to 84 inches: sand Properties and qualities Slope: 0 to 6 percent Depth to restrictive feature: More than 80 inches Natural drainage class: Somewhat excessively drained Runoff class: Very low Capacity of the most limiting layer to transmit water (Ksat): High to very high (5.95 to in/hr) Depth to water table: More than 80 inches Frequency of flooding: None Frequency of ponding: None Available water storage in profile: Very low (about 2.6 inches) Interpretive groups Land capability classification (irrigated): None specified Land capability classification (nonirrigated): 4s Hydrologic Soil Group: A Hydric soil rating: No Minor Components Nimmo Percent of map unit: 2 percent Landform: Stream terraces Landform position (three-dimensional): Riser Down-slope shape: Linear Across-slope shape: Linear 24
60 Hydric soil rating: Yes 29A Tomotley sandy loam, 0 to 2 percent slopes, rarely flooded Map Unit Setting National map unit symbol: rnxj Mean annual precipitation: 42 to 54 inches Frost-free period: 180 to 208 days Farmland classification: Prime farmland if drained Map Unit Composition Tomotley and similar soils: 90 percent Minor components: 4 percent Estimates are based on observations, descriptions, and transects of the mapunit. Description of Tomotley Setting Landform: Depressions on stream terraces, drainageways on stream terraces Landform position (three-dimensional): Base slope, tread Down-slope shape: Linear Across-slope shape: Linear Parent material: Sandy and/or loamy alluvium Typical profile H1-0 to 12 inches: sandy loam H2-12 to 48 inches: sandy clay loam H3-48 to 60 inches: sandy loam H4-60 to 84 inches: loamy coarse sand Properties and qualities Slope: 0 to 2 percent Depth to restrictive feature: More than 80 inches Natural drainage class: Poorly drained Runoff class: Very high Capacity of the most limiting layer to transmit water (Ksat): Moderately high to high (0.20 to 1.98 in/hr) Depth to water table: About 0 to 12 inches Frequency of flooding: Rare Frequency of ponding: None Available water storage in profile: Moderate (about 8.7 inches) Interpretive groups Land capability classification (irrigated): None specified Land capability classification (nonirrigated): 4w Hydrologic Soil Group: B/D Hydric soil rating: Yes 25
61 Minor Components Chastain, frequently flooded Percent of map unit: 1 percent Landform: Flood plains Landform position (three-dimensional): Tread, riser Down-slope shape: Linear Across-slope shape: Linear Hydric soil rating: Yes Dorovan Percent of map unit: 1 percent Landform: Flood plains, swamps Down-slope shape: Concave Across-slope shape: Concave Hydric soil rating: Yes Nimmo Percent of map unit: 1 percent Landform: Stream terraces Landform position (three-dimensional): Riser Down-slope shape: Linear Across-slope shape: Linear Hydric soil rating: Yes Roanoke Percent of map unit: 1 percent Landform: Stream terraces, flood plains Landform position (three-dimensional): Tread, riser Down-slope shape: Linear Across-slope shape: Linear Hydric soil rating: Yes 31 Udorthents, smoothed Map Unit Setting National map unit symbol: rnxn Mean annual precipitation: 42 to 54 inches Frost-free period: 180 to 208 days Farmland classification: Not prime farmland Map Unit Composition Udorthents and similar soils: 80 percent Minor components: 2 percent Estimates are based on observations, descriptions, and transects of the mapunit. Description of Udorthents Setting Down-slope shape: Linear 26
62 Across-slope shape: Linear Parent material: Disturbed material, fill material Properties and qualities Depth to restrictive feature: More than 80 inches Depth to water table: More than 80 inches Frequency of flooding: None Frequency of ponding: None Minor Components Roanoke Percent of map unit: 2 percent Landform: Stream terraces, flood plains Landform position (three-dimensional): Tread, riser Down-slope shape: Linear Across-slope shape: Linear Hydric soil rating: Yes W Water Map Unit Setting National map unit symbol: rnxs Mean annual precipitation: 42 to 54 inches Frost-free period: 180 to 208 days Farmland classification: Not prime farmland Map Unit Composition Water: 100 percent Estimates are based on observations, descriptions, and transects of the mapunit. Description of Water Setting Landform: Perenial streams, lakes, swamps Properties and qualities Depth to restrictive feature: More than 80 inches Depth to water table: More than 80 inches Frequency of flooding: None Frequency of ponding: None 27
63 References American Association of State Highway and Transportation Officials (AASHTO) Standard specifications for transportation materials and methods of sampling and testing. 24th edition. American Society for Testing and Materials (ASTM) Standard classification of soils for engineering purposes. ASTM Standard D Cowardin, L.M., V. Carter, F.C. Golet, and E.T. LaRoe Classification of wetlands and deep-water habitats of the United States. U.S. Fish and Wildlife Service FWS/OBS-79/31. Federal Register. July 13, Changes in hydric soils of the United States. Federal Register. September 18, Hydric soils of the United States. Hurt, G.W., and L.M. Vasilas, editors. Version 6.0, Field indicators of hydric soils in the United States. National Research Council Wetlands: Characteristics and boundaries. Soil Survey Division Staff Soil survey manual. Soil Conservation Service. U.S. Department of Agriculture Handbook nrcs/detail/national/soils/?cid=nrcs142p2_ Soil Survey Staff Soil taxonomy: A basic system of soil classification for making and interpreting soil surveys. 2nd edition. Natural Resources Conservation Service, U.S. Department of Agriculture Handbook Soil Survey Staff Keys to soil taxonomy. 11th edition. U.S. Department of Agriculture, Natural Resources Conservation Service. Tiner, R.W., Jr Wetlands of Delaware. U.S. Fish and Wildlife Service and Delaware Department of Natural Resources and Environmental Control, Wetlands Section. United States Army Corps of Engineers, Environmental Laboratory Corps of Engineers wetlands delineation manual. Waterways Experiment Station Technical Report Y United States Department of Agriculture, Natural Resources Conservation Service. National forestry manual. home/?cid=nrcs142p2_ United States Department of Agriculture, Natural Resources Conservation Service. National range and pasture handbook. detail/national/landuse/rangepasture/?cid=stelprdb
64 United States Department of Agriculture, Natural Resources Conservation Service. National soil survey handbook, title 430-VI. nrcs/detail/soils/scientists/?cid=nrcs142p2_ United States Department of Agriculture, Natural Resources Conservation Service Land resource regions and major land resource areas of the United States, the Caribbean, and the Pacific Basin. U.S. Department of Agriculture Handbook cid=nrcs142p2_ United States Department of Agriculture, Soil Conservation Service Land capability classification. U.S. Department of Agriculture Handbook

65 United States Department of Agriculture Natural Resources Conservation Service A product of the National Cooperative Soil Survey, a joint effort of the United States Department of Agriculture and other Federal agencies, State agencies including the Agricultural Experiment Stations, and local participants Custom Soil Resource Report for Southampton County, Virginia Darden Brown Core 1 Delaware Road October 23, 2017
66 Preface Soil surveys contain information that affects land use planning in survey areas. They highlight soil limitations that affect various land uses and provide information about the properties of the soils in the survey areas. Soil surveys are designed for many different users, including farmers, ranchers, foresters, agronomists, urban planners, community officials, engineers, developers, builders, and home buyers. Also, conservationists, teachers, students, and specialists in recreation, waste disposal, and pollution control can use the surveys to help them understand, protect, or enhance the environment. Various land use regulations of Federal, State, and local governments may impose special restrictions on land use or land treatment. Soil surveys identify soil properties that are used in making various land use or land treatment decisions. The information is intended to help the land users identify and reduce the effects of soil limitations on various land uses. The landowner or user is responsible for identifying and complying with existing laws and regulations. Although soil survey information can be used for general farm, local, and wider area planning, onsite investigation is needed to supplement this information in some cases. Examples include soil quality assessments ( portal/nrcs/main/soils/health/) and certain conservation and engineering applications. For more detailed information, contact your local USDA Service Center ( or your NRCS State Soil Scientist ( cid=nrcs142p2_053951). Great differences in soil properties can occur within short distances. Some soils are seasonally wet or subject to flooding. Some are too unstable to be used as a foundation for buildings or roads. Clayey or wet soils are poorly suited to use as septic tank absorption fields. A high water table makes a soil poorly suited to basements or underground installations. The National Cooperative Soil Survey is a joint effort of the United States Department of Agriculture and other Federal agencies, State agencies including the Agricultural Experiment Stations, and local agencies. The Natural Resources Conservation Service (NRCS) has leadership for the Federal part of the National Cooperative Soil Survey. Information about soils is updated periodically. Updated information is available through the NRCS Web Soil Survey, the site for official soil survey information. The U.S. Department of Agriculture (USDA) prohibits discrimination in all its programs and activities on the basis of race, color, national origin, age, disability, and where applicable, sex, marital status, familial status, parental status, religion, sexual orientation, genetic information, political beliefs, reprisal, or because all or a part of an individual's income is derived from any public assistance program. (Not all prohibited bases apply to all programs.) Persons with disabilities who require 2
67 alternative means for communication of program information (Braille, large print, audiotape, etc.) should contact USDA's TARGET Center at (202) (voice and TDD). To file a complaint of discrimination, write to USDA, Director, Office of Civil Rights, 1400 Independence Avenue, S.W., Washington, D.C or call (800) (voice) or (202) (TDD). USDA is an equal opportunity provider and employer. 3
68 Contents Preface... 2 How Soil Surveys Are Made...5 Soil Map... 8 Soil Map...9 Legend...10 Map Unit Legend Map Unit Descriptions...11 Southampton County, Virginia B Bojac loamy sand, 2 to 6 percent slopes, very rarely flooded A Dorovan muck, 0 to 2 percent slopes, frequently flooded A Munden loamy sand, 0 to 2 percent slopes, rarely flooded A Nimmo sandy loam, 0 to 2 percent slopes A Seabrook loamy sand, 0 to 2 percent slopes B Tarboro loamy sand, 0 to 6 percent slopes A Tomotley sandy loam, 0 to 2 percent slopes, rarely flooded W Water...21 References
69 How Soil Surveys Are Made Soil surveys are made to provide information about the soils and miscellaneous areas in a specific area. They include a description of the soils and miscellaneous areas and their location on the landscape and tables that show soil properties and limitations affecting various uses. Soil scientists observed the steepness, length, and shape of the slopes; the general pattern of drainage; the kinds of crops and native plants; and the kinds of bedrock. They observed and described many soil profiles. A soil profile is the sequence of natural layers, or horizons, in a soil. The profile extends from the surface down into the unconsolidated material in which the soil formed or from the surface down to bedrock. The unconsolidated material is devoid of roots and other living organisms and has not been changed by other biological activity. Currently, soils are mapped according to the boundaries of major land resource areas (MLRAs). MLRAs are geographically associated land resource units that share common characteristics related to physiography, geology, climate, water resources, soils, biological resources, and land uses (USDA, 2006). Soil survey areas typically consist of parts of one or more MLRA. The soils and miscellaneous areas in a survey area occur in an orderly pattern that is related to the geology, landforms, relief, climate, and natural vegetation of the area. Each kind of soil and miscellaneous area is associated with a particular kind of landform or with a segment of the landform. By observing the soils and miscellaneous areas in the survey area and relating their position to specific segments of the landform, a soil scientist develops a concept, or model, of how they were formed. Thus, during mapping, this model enables the soil scientist to predict with a considerable degree of accuracy the kind of soil or miscellaneous area at a specific location on the landscape. Commonly, individual soils on the landscape merge into one another as their characteristics gradually change. To construct an accurate soil map, however, soil scientists must determine the boundaries between the soils. They can observe only a limited number of soil profiles. Nevertheless, these observations, supplemented by an understanding of the soil-vegetation-landscape relationship, are sufficient to verify predictions of the kinds of soil in an area and to determine the boundaries. Soil scientists recorded the characteristics of the soil profiles that they studied. They noted soil color, texture, size and shape of soil aggregates, kind and amount of rock fragments, distribution of plant roots, reaction, and other features that enable them to identify soils. After describing the soils in the survey area and determining their properties, the soil scientists assigned the soils to taxonomic classes (units). Taxonomic classes are concepts. Each taxonomic class has a set of soil characteristics with precisely defined limits. The classes are used as a basis for comparison to classify soils systematically. Soil taxonomy, the system of taxonomic classification used in the United States, is based mainly on the kind and character of soil properties and the arrangement of horizons within the profile. After the soil 5
70 scientists classified and named the soils in the survey area, they compared the individual soils with similar soils in the same taxonomic class in other areas so that they could confirm data and assemble additional data based on experience and research. The objective of soil mapping is not to delineate pure map unit components; the objective is to separate the landscape into landforms or landform segments that have similar use and management requirements. Each map unit is defined by a unique combination of soil components and/or miscellaneous areas in predictable proportions. Some components may be highly contrasting to the other components of the map unit. The presence of minor components in a map unit in no way diminishes the usefulness or accuracy of the data. The delineation of such landforms and landform segments on the map provides sufficient information for the development of resource plans. If intensive use of small areas is planned, onsite investigation is needed to define and locate the soils and miscellaneous areas. Soil scientists make many field observations in the process of producing a soil map. The frequency of observation is dependent upon several factors, including scale of mapping, intensity of mapping, design of map units, complexity of the landscape, and experience of the soil scientist. Observations are made to test and refine the soil-landscape model and predictions and to verify the classification of the soils at specific locations. Once the soil-landscape model is refined, a significantly smaller number of measurements of individual soil properties are made and recorded. These measurements may include field measurements, such as those for color, depth to bedrock, and texture, and laboratory measurements, such as those for content of sand, silt, clay, salt, and other components. Properties of each soil typically vary from one point to another across the landscape. Observations for map unit components are aggregated to develop ranges of characteristics for the components. The aggregated values are presented. Direct measurements do not exist for every property presented for every map unit component. Values for some properties are estimated from combinations of other properties. While a soil survey is in progress, samples of some of the soils in the area generally are collected for laboratory analyses and for engineering tests. Soil scientists interpret the data from these analyses and tests as well as the field-observed characteristics and the soil properties to determine the expected behavior of the soils under different uses. Interpretations for all of the soils are field tested through observation of the soils in different uses and under different levels of management. Some interpretations are modified to fit local conditions, and some new interpretations are developed to meet local needs. Data are assembled from other sources, such as research information, production records, and field experience of specialists. For example, data on crop yields under defined levels of management are assembled from farm records and from field or plot experiments on the same kinds of soil. Predictions about soil behavior are based not only on soil properties but also on such variables as climate and biological activity. Soil conditions are predictable over long periods of time, but they are not predictable from year to year. For example, soil scientists can predict with a fairly high degree of accuracy that a given soil will have a high water table within certain depths in most years, but they cannot predict that a high water table will always be at a specific level in the soil on a specific date. After soil scientists located and identified the significant natural bodies of soil in the survey area, they drew the boundaries of these bodies on aerial photographs and 6
71 identified each as a specific map unit. Aerial photographs show trees, buildings, fields, roads, and rivers, all of which help in locating boundaries accurately. 7
72 Soil Map The soil map section includes the soil map for the defined area of interest, a list of soil map units on the map and extent of each map unit, and cartographic symbols displayed on the map. Also presented are various metadata about data used to produce the map, and a description of each soil map unit. 8

73 76 59' 25'' W Soil Map 76 58' 10'' W 36 37' 52'' N 36 36' 33'' N Soil Map may not be valid at this scale ' 52'' N 36 36' 33'' N 76 59' 25'' W N Map Scale: 1:12,000 if printed on A portrait (8.5" x 11") sheet. Meters Feet Map projection: Web Mercator Corner coordinates: WGS84 Edge tics: UTM Zone 18N WGS ' 10'' W
74 MAP LEGEND MAP INFORMATION Area of Interest (AOI) Area of Interest (AOI) Soils Soil Map Unit Polygons Soil Map Unit Lines Soil Map Unit Points Special Point Features Blowout Borrow Pit Clay Spot Closed Depression Gravel Pit Gravelly Spot Landfill Lava Flow Marsh or swamp Mine or Quarry Miscellaneous Water Perennial Water Rock Outcrop Saline Spot Sandy Spot Severely Eroded Spot Sinkhole Slide or Slip Sodic Spot Spoil Area Stony Spot Very Stony Spot Wet Spot Other Special Line Features Water Features Streams and Canals Transportation Rails Interstate Highways US Routes Major Roads Local Roads Background Aerial Photography The soil surveys that comprise your AOI were mapped at 1:24,000. Warning: Soil Map may not be valid at this scale. Enlargement of maps beyond the scale of mapping can cause misunderstanding of the detail of mapping and accuracy of soil line placement. The maps do not show the small areas of contrasting soils that could have been shown at a more detailed scale. Please rely on the bar scale on each map sheet for map measurements. Source of Map: Natural Resources Conservation Service Web Soil Survey URL: Coordinate System: Web Mercator (EPSG:3857) Maps from the Web Soil Survey are based on the Web Mercator projection, which preserves direction and shape but distorts distance and area. A projection that preserves area, such as the Albers equal-area conic projection, should be used if more accurate calculations of distance or area are required. This product is generated from the USDA-NRCS certified data as of the version date(s) listed below. Soil Survey Area: Southampton County, Virginia Survey Area Data: Version 15, Sep 24, 2014 Soil map units are labeled (as space allows) for map scales 1:50,000 or larger. Date(s) aerial images were photographed: Jul 7, 2016 Nov 22, 2016 The orthophoto or other base map on which the soil lines were compiled and digitized probably differs from the background imagery displayed on these maps. As a result, some minor shifting of map unit boundaries may be evident. 10
75 Map Unit Legend Map Unit Symbol Map Unit Name Acres in AOI Percent of AOI 5B Bojac loamy sand, 2 to 6 percent slopes, very rarely flooded % 12A Dorovan muck, 0 to 2 percent slopes, frequently flooded 15A Munden loamy sand, 0 to 2 percent slopes, rarely flooded 19A Nimmo sandy loam, 0 to 2 percent slopes 25A Seabrook loamy sand, 0 to 2 percent slopes 28B Tarboro loamy sand, 0 to 6 percent slopes 29A Tomotley sandy loam, 0 to 2 percent slopes, rarely flooded % % % % % % W Water % Totals for Area of Interest % Map Unit Descriptions The map units delineated on the detailed soil maps in a soil survey represent the soils or miscellaneous areas in the survey area. The map unit descriptions, along with the maps, can be used to determine the composition and properties of a unit. A map unit delineation on a soil map represents an area dominated by one or more major kinds of soil or miscellaneous areas. A map unit is identified and named according to the taxonomic classification of the dominant soils. Within a taxonomic class there are precisely defined limits for the properties of the soils. On the landscape, however, the soils are natural phenomena, and they have the characteristic variability of all natural phenomena. Thus, the range of some observed properties may extend beyond the limits defined for a taxonomic class. Areas of soils of a single taxonomic class rarely, if ever, can be mapped without including areas of other taxonomic classes. Consequently, every map unit is made up of the soils or miscellaneous areas for which it is named and some minor components that belong to taxonomic classes other than those of the major soils. Most minor soils have properties similar to those of the dominant soil or soils in the map unit, and thus they do not affect use and management. These are called noncontrasting, or similar, components. They may or may not be mentioned in a particular map unit description. Other minor components, however, have properties and behavioral characteristics divergent enough to affect use or to require different management. These are called contrasting, or dissimilar, components. They generally are in small areas and could not be mapped separately because of the scale used. Some small areas of strongly contrasting soils or miscellaneous areas 11
76 are identified by a special symbol on the maps. If included in the database for a given area, the contrasting minor components are identified in the map unit descriptions along with some characteristics of each. A few areas of minor components may not have been observed, and consequently they are not mentioned in the descriptions, especially where the pattern was so complex that it was impractical to make enough observations to identify all the soils and miscellaneous areas on the landscape. The presence of minor components in a map unit in no way diminishes the usefulness or accuracy of the data. The objective of mapping is not to delineate pure taxonomic classes but rather to separate the landscape into landforms or landform segments that have similar use and management requirements. The delineation of such segments on the map provides sufficient information for the development of resource plans. If intensive use of small areas is planned, however, onsite investigation is needed to define and locate the soils and miscellaneous areas. An identifying symbol precedes the map unit name in the map unit descriptions. Each description includes general facts about the unit and gives important soil properties and qualities. Soils that have profiles that are almost alike make up a soil series. Except for differences in texture of the surface layer, all the soils of a series have major horizons that are similar in composition, thickness, and arrangement. Soils of one series can differ in texture of the surface layer, slope, stoniness, salinity, degree of erosion, and other characteristics that affect their use. On the basis of such differences, a soil series is divided into soil phases. Most of the areas shown on the detailed soil maps are phases of soil series. The name of a soil phase commonly indicates a feature that affects use or management. For example, Alpha silt loam, 0 to 2 percent slopes, is a phase of the Alpha series. Some map units are made up of two or more major soils or miscellaneous areas. These map units are complexes, associations, or undifferentiated groups. A complex consists of two or more soils or miscellaneous areas in such an intricate pattern or in such small areas that they cannot be shown separately on the maps. The pattern and proportion of the soils or miscellaneous areas are somewhat similar in all areas. Alpha-Beta complex, 0 to 6 percent slopes, is an example. An association is made up of two or more geographically associated soils or miscellaneous areas that are shown as one unit on the maps. Because of present or anticipated uses of the map units in the survey area, it was not considered practical or necessary to map the soils or miscellaneous areas separately. The pattern and relative proportion of the soils or miscellaneous areas are somewhat similar. Alpha-Beta association, 0 to 2 percent slopes, is an example. An undifferentiated group is made up of two or more soils or miscellaneous areas that could be mapped individually but are mapped as one unit because similar interpretations can be made for use and management. The pattern and proportion of the soils or miscellaneous areas in a mapped area are not uniform. An area can be made up of only one of the major soils or miscellaneous areas, or it can be made up of all of them. Alpha and Beta soils, 0 to 2 percent slopes, is an example. Some surveys include miscellaneous areas. Such areas have little or no soil material and support little or no vegetation. Rock outcrop is an example. 12
77 Southampton County, Virginia 5B Bojac loamy sand, 2 to 6 percent slopes, very rarely flooded Map Unit Setting National map unit symbol: rnwc Mean annual precipitation: 42 to 54 inches Frost-free period: 180 to 208 days Farmland classification: All areas are prime farmland Map Unit Composition Bojac and similar soils: 75 percent Minor components: 1 percent Estimates are based on observations, descriptions, and transects of the mapunit. Description of Bojac Setting Landform: Stream terraces Landform position (three-dimensional): Tread, riser Down-slope shape: Linear Across-slope shape: Linear Parent material: Sandy and/or loamy alluvium Typical profile H1-0 to 13 inches: loamy sand H2-13 to 48 inches: sandy loam H3-48 to 66 inches: sand Properties and qualities Slope: 2 to 6 percent Depth to restrictive feature: More than 80 inches Natural drainage class: Well drained Runoff class: Very low Capacity of the most limiting layer to transmit water (Ksat): High (1.98 to 5.95 in/hr) Depth to water table: About 48 to 79 inches Frequency of flooding: Very rare Frequency of ponding: None Available water storage in profile: Low (about 5.8 inches) Interpretive groups Land capability classification (irrigated): None specified Land capability classification (nonirrigated): 2e Hydrologic Soil Group: A Hydric soil rating: No Minor Components Tomotley Percent of map unit: 1 percent Landform: Depressions on stream terraces, drainageways on stream terraces Landform position (three-dimensional): Base slope, tread Down-slope shape: Linear Across-slope shape: Linear Hydric soil rating: Yes 13
78 12A Dorovan muck, 0 to 2 percent slopes, frequently flooded Map Unit Setting National map unit symbol: rnwp Mean annual precipitation: 42 to 54 inches Frost-free period: 180 to 208 days Farmland classification: Not prime farmland Map Unit Composition Dorovan and similar soils: 85 percent Minor components: 5 percent Estimates are based on observations, descriptions, and transects of the mapunit. Description of Dorovan Setting Landform: Flood plains, swamps Down-slope shape: Concave Across-slope shape: Concave Parent material: Organic material over loamy alluvium Typical profile H1-0 to 17 inches: muck H2-17 to 65 inches: muck H3-65 to 80 inches: sandy loam Properties and qualities Slope: 0 to 2 percent Depth to restrictive feature: More than 80 inches Natural drainage class: Very poorly drained Runoff class: Negligible Capacity of the most limiting layer to transmit water (Ksat): Moderately high to high (0.57 to 1.98 in/hr) Depth to water table: About 0 inches Frequency of flooding: Frequent Frequency of ponding: Frequent Available water storage in profile: Very high (about 13.8 inches) Interpretive groups Land capability classification (irrigated): None specified Land capability classification (nonirrigated): 7w Hydrologic Soil Group: B/D Hydric soil rating: Yes Minor Components Chastain, frequently flooded Percent of map unit: 2 percent Landform: Flood plains Landform position (three-dimensional): Tread, riser 14
79 Down-slope shape: Linear Across-slope shape: Linear Hydric soil rating: Yes Roanoke Percent of map unit: 2 percent Landform: Stream terraces, flood plains Landform position (three-dimensional): Tread, riser Down-slope shape: Linear Across-slope shape: Linear Hydric soil rating: Yes Tomotley Percent of map unit: 1 percent Landform: Depressions on stream terraces, drainageways on stream terraces Landform position (three-dimensional): Base slope, tread Down-slope shape: Linear Across-slope shape: Linear Hydric soil rating: Yes 15A Munden loamy sand, 0 to 2 percent slopes, rarely flooded Map Unit Setting National map unit symbol: rnwv Mean annual precipitation: 42 to 54 inches Frost-free period: 180 to 208 days Farmland classification: All areas are prime farmland Map Unit Composition Munden and similar soils: 85 percent Minor components: 3 percent Estimates are based on observations, descriptions, and transects of the mapunit. Description of Munden Setting Landform: Stream terraces Landform position (three-dimensional): Tread, riser Down-slope shape: Convex Across-slope shape: Convex Parent material: Loamy marine deposits and/or sandy marine deposits and/or alluvium Typical profile H1-0 to 17 inches: loamy sand H2-17 to 36 inches: sandy loam H3-36 to 65 inches: sandy loam Properties and qualities Slope: 0 to 2 percent Depth to restrictive feature: More than 80 inches 15
80 Natural drainage class: Moderately well drained Runoff class: Very low Capacity of the most limiting layer to transmit water (Ksat): Moderately high to high (0.57 to 5.95 in/hr) Depth to water table: About 18 to 30 inches Frequency of flooding: Rare Frequency of ponding: None Available water storage in profile: Low (about 5.3 inches) Interpretive groups Land capability classification (irrigated): None specified Land capability classification (nonirrigated): 2w Hydrologic Soil Group: B Hydric soil rating: No Minor Components Nimmo Percent of map unit: 2 percent Landform: Stream terraces Landform position (three-dimensional): Riser Down-slope shape: Linear Across-slope shape: Linear Hydric soil rating: Yes Tomotley Percent of map unit: 1 percent Landform: Depressions on stream terraces, drainageways on stream terraces Landform position (three-dimensional): Base slope, tread Down-slope shape: Linear Across-slope shape: Linear Hydric soil rating: Yes 19A Nimmo sandy loam, 0 to 2 percent slopes Map Unit Setting National map unit symbol: rnx1 Mean annual precipitation: 42 to 54 inches Frost-free period: 180 to 208 days Farmland classification: Prime farmland if drained Map Unit Composition Nimmo and similar soils: 80 percent Minor components: 3 percent Estimates are based on observations, descriptions, and transects of the mapunit. Description of Nimmo Setting Landform: Stream terraces Landform position (three-dimensional): Riser 16
81 Down-slope shape: Linear Across-slope shape: Linear Parent material: Sandy alluvium and/or loamy alluvium Typical profile H1-0 to 14 inches: sandy loam H2-14 to 32 inches: fine sandy loam H3-32 to 64 inches: coarse sand Properties and qualities Slope: 0 to 2 percent Depth to restrictive feature: More than 80 inches Natural drainage class: Poorly drained Runoff class: Very high Capacity of the most limiting layer to transmit water (Ksat): Moderately high to high (0.57 to 1.98 in/hr) Depth to water table: About 0 to 12 inches Frequency of flooding: None Frequency of ponding: None Available water storage in profile: Low (about 5.7 inches) Interpretive groups Land capability classification (irrigated): None specified Land capability classification (nonirrigated): 4w Hydrologic Soil Group: B/D Hydric soil rating: Yes Minor Components Roanoke Percent of map unit: 2 percent Landform: Stream terraces, flood plains Landform position (three-dimensional): Tread, riser Down-slope shape: Linear Across-slope shape: Linear Hydric soil rating: Yes Tomotley Percent of map unit: 1 percent Landform: Depressions on stream terraces, drainageways on stream terraces Landform position (three-dimensional): Base slope, tread Down-slope shape: Linear Across-slope shape: Linear Hydric soil rating: Yes 25A Seabrook loamy sand, 0 to 2 percent slopes Map Unit Setting National map unit symbol: rnx9 Mean annual precipitation: 42 to 54 inches Frost-free period: 180 to 208 days 17
82 Farmland classification: Not prime farmland Map Unit Composition Seabrook and similar soils: 80 percent Estimates are based on observations, descriptions, and transects of the mapunit. Description of Seabrook Setting Landform: Stream terraces Landform position (three-dimensional): Tread, riser Down-slope shape: Convex Across-slope shape: Convex Parent material: Sandy alluvium Typical profile H1-0 to 8 inches: loamy sand H2-8 to 32 inches: loamy fine sand H3-32 to 60 inches: fine sand Properties and qualities Slope: 0 to 2 percent Depth to restrictive feature: More than 80 inches Natural drainage class: Moderately well drained Runoff class: Very low Capacity of the most limiting layer to transmit water (Ksat): High to very high (5.95 to in/hr) Depth to water table: About 24 to 42 inches Frequency of flooding: None Frequency of ponding: None Available water storage in profile: Low (about 3.2 inches) Interpretive groups Land capability classification (irrigated): None specified Land capability classification (nonirrigated): 3s Hydrologic Soil Group: A Hydric soil rating: No 28B Tarboro loamy sand, 0 to 6 percent slopes Map Unit Setting National map unit symbol: rnxh Mean annual precipitation: 42 to 54 inches Frost-free period: 180 to 208 days Farmland classification: Not prime farmland Map Unit Composition Tarboro and similar soils: 95 percent Minor components: 2 percent Estimates are based on observations, descriptions, and transects of the mapunit. 18
83 Description of Tarboro Setting Landform: Stream terraces Landform position (three-dimensional): Tread, riser Down-slope shape: Convex Across-slope shape: Convex Parent material: Sandy alluvium Typical profile H1-0 to 8 inches: loamy sand H2-8 to 84 inches: sand Properties and qualities Slope: 0 to 6 percent Depth to restrictive feature: More than 80 inches Natural drainage class: Somewhat excessively drained Runoff class: Very low Capacity of the most limiting layer to transmit water (Ksat): High to very high (5.95 to in/hr) Depth to water table: More than 80 inches Frequency of flooding: None Frequency of ponding: None Available water storage in profile: Very low (about 2.6 inches) Interpretive groups Land capability classification (irrigated): None specified Land capability classification (nonirrigated): 4s Hydrologic Soil Group: A Hydric soil rating: No Minor Components Nimmo Percent of map unit: 2 percent Landform: Stream terraces Landform position (three-dimensional): Riser Down-slope shape: Linear Across-slope shape: Linear Hydric soil rating: Yes 29A Tomotley sandy loam, 0 to 2 percent slopes, rarely flooded Map Unit Setting National map unit symbol: rnxj Mean annual precipitation: 42 to 54 inches Frost-free period: 180 to 208 days Farmland classification: Prime farmland if drained 19
84 Map Unit Composition Tomotley and similar soils: 90 percent Minor components: 4 percent Estimates are based on observations, descriptions, and transects of the mapunit. Description of Tomotley Setting Landform: Depressions on stream terraces, drainageways on stream terraces Landform position (three-dimensional): Base slope, tread Down-slope shape: Linear Across-slope shape: Linear Parent material: Sandy and/or loamy alluvium Typical profile H1-0 to 12 inches: sandy loam H2-12 to 48 inches: sandy clay loam H3-48 to 60 inches: sandy loam H4-60 to 84 inches: loamy coarse sand Properties and qualities Slope: 0 to 2 percent Depth to restrictive feature: More than 80 inches Natural drainage class: Poorly drained Runoff class: Very high Capacity of the most limiting layer to transmit water (Ksat): Moderately high to high (0.20 to 1.98 in/hr) Depth to water table: About 0 to 12 inches Frequency of flooding: Rare Frequency of ponding: None Available water storage in profile: Moderate (about 8.7 inches) Interpretive groups Land capability classification (irrigated): None specified Land capability classification (nonirrigated): 4w Hydrologic Soil Group: B/D Hydric soil rating: Yes Minor Components Chastain, frequently flooded Percent of map unit: 1 percent Landform: Flood plains Landform position (three-dimensional): Tread, riser Down-slope shape: Linear Across-slope shape: Linear Hydric soil rating: Yes Dorovan Percent of map unit: 1 percent Landform: Flood plains, swamps Down-slope shape: Concave Across-slope shape: Concave Hydric soil rating: Yes Nimmo Percent of map unit: 1 percent 20
85 Landform: Stream terraces Landform position (three-dimensional): Riser Down-slope shape: Linear Across-slope shape: Linear Hydric soil rating: Yes Roanoke Percent of map unit: 1 percent Landform: Stream terraces, flood plains Landform position (three-dimensional): Tread, riser Down-slope shape: Linear Across-slope shape: Linear Hydric soil rating: Yes W Water Map Unit Setting National map unit symbol: rnxs Mean annual precipitation: 42 to 54 inches Frost-free period: 180 to 208 days Farmland classification: Not prime farmland Map Unit Composition Water: 100 percent Estimates are based on observations, descriptions, and transects of the mapunit. Description of Water Setting Landform: Perenial streams, lakes, swamps Properties and qualities Depth to restrictive feature: More than 80 inches Depth to water table: More than 80 inches Frequency of flooding: None Frequency of ponding: None 21
86 References American Association of State Highway and Transportation Officials (AASHTO) Standard specifications for transportation materials and methods of sampling and testing. 24th edition. American Society for Testing and Materials (ASTM) Standard classification of soils for engineering purposes. ASTM Standard D Cowardin, L.M., V. Carter, F.C. Golet, and E.T. LaRoe Classification of wetlands and deep-water habitats of the United States. U.S. Fish and Wildlife Service FWS/OBS-79/31. Federal Register. July 13, Changes in hydric soils of the United States. Federal Register. September 18, Hydric soils of the United States. Hurt, G.W., and L.M. Vasilas, editors. Version 6.0, Field indicators of hydric soils in the United States. National Research Council Wetlands: Characteristics and boundaries. Soil Survey Division Staff Soil survey manual. Soil Conservation Service. U.S. Department of Agriculture Handbook nrcs/detail/national/soils/?cid=nrcs142p2_ Soil Survey Staff Soil taxonomy: A basic system of soil classification for making and interpreting soil surveys. 2nd edition. Natural Resources Conservation Service, U.S. Department of Agriculture Handbook Soil Survey Staff Keys to soil taxonomy. 11th edition. U.S. Department of Agriculture, Natural Resources Conservation Service. Tiner, R.W., Jr Wetlands of Delaware. U.S. Fish and Wildlife Service and Delaware Department of Natural Resources and Environmental Control, Wetlands Section. United States Army Corps of Engineers, Environmental Laboratory Corps of Engineers wetlands delineation manual. Waterways Experiment Station Technical Report Y United States Department of Agriculture, Natural Resources Conservation Service. National forestry manual. home/?cid=nrcs142p2_ United States Department of Agriculture, Natural Resources Conservation Service. National range and pasture handbook. detail/national/landuse/rangepasture/?cid=stelprdb
87 United States Department of Agriculture, Natural Resources Conservation Service. National soil survey handbook, title 430-VI. nrcs/detail/soils/scientists/?cid=nrcs142p2_ United States Department of Agriculture, Natural Resources Conservation Service Land resource regions and major land resource areas of the United States, the Caribbean, and the Pacific Basin. U.S. Department of Agriculture Handbook cid=nrcs142p2_ United States Department of Agriculture, Soil Conservation Service Land capability classification. U.S. Department of Agriculture Handbook

88 United States Department of Agriculture Natural Resources Conservation Service A product of the National Cooperative Soil Survey, a joint effort of the United States Department of Agriculture and other Federal agencies, State agencies including the Agricultural Experiment Stations, and local participants Custom Soil Resource Report for Southampton County, Virginia Darden Brown Core 1 east Smiths Ferry Rd October 23, 2017
89 Preface Soil surveys contain information that affects land use planning in survey areas. They highlight soil limitations that affect various land uses and provide information about the properties of the soils in the survey areas. Soil surveys are designed for many different users, including farmers, ranchers, foresters, agronomists, urban planners, community officials, engineers, developers, builders, and home buyers. Also, conservationists, teachers, students, and specialists in recreation, waste disposal, and pollution control can use the surveys to help them understand, protect, or enhance the environment. Various land use regulations of Federal, State, and local governments may impose special restrictions on land use or land treatment. Soil surveys identify soil properties that are used in making various land use or land treatment decisions. The information is intended to help the land users identify and reduce the effects of soil limitations on various land uses. The landowner or user is responsible for identifying and complying with existing laws and regulations. Although soil survey information can be used for general farm, local, and wider area planning, onsite investigation is needed to supplement this information in some cases. Examples include soil quality assessments ( portal/nrcs/main/soils/health/) and certain conservation and engineering applications. For more detailed information, contact your local USDA Service Center ( or your NRCS State Soil Scientist ( cid=nrcs142p2_053951). Great differences in soil properties can occur within short distances. Some soils are seasonally wet or subject to flooding. Some are too unstable to be used as a foundation for buildings or roads. Clayey or wet soils are poorly suited to use as septic tank absorption fields. A high water table makes a soil poorly suited to basements or underground installations. The National Cooperative Soil Survey is a joint effort of the United States Department of Agriculture and other Federal agencies, State agencies including the Agricultural Experiment Stations, and local agencies. The Natural Resources Conservation Service (NRCS) has leadership for the Federal part of the National Cooperative Soil Survey. Information about soils is updated periodically. Updated information is available through the NRCS Web Soil Survey, the site for official soil survey information. The U.S. Department of Agriculture (USDA) prohibits discrimination in all its programs and activities on the basis of race, color, national origin, age, disability, and where applicable, sex, marital status, familial status, parental status, religion, sexual orientation, genetic information, political beliefs, reprisal, or because all or a part of an individual's income is derived from any public assistance program. (Not all prohibited bases apply to all programs.) Persons with disabilities who require 2
90 alternative means for communication of program information (Braille, large print, audiotape, etc.) should contact USDA's TARGET Center at (202) (voice and TDD). To file a complaint of discrimination, write to USDA, Director, Office of Civil Rights, 1400 Independence Avenue, S.W., Washington, D.C or call (800) (voice) or (202) (TDD). USDA is an equal opportunity provider and employer. 3
91 Contents Preface... 2 How Soil Surveys Are Made...5 Soil Map... 8 Soil Map...9 Legend...10 Map Unit Legend Map Unit Descriptions...11 Southampton County, Virginia B Alaga loamy sand, 0 to 6 percent slopes B Bojac loamy sand, 2 to 6 percent slopes, very rarely flooded A Dorovan muck, 0 to 2 percent slopes, frequently flooded A Munden loamy sand, 0 to 2 percent slopes, rarely flooded B Munden loamy sand, 2 to 6 percent slopes, rarely flooded A Nimmo sandy loam, 0 to 2 percent slopes A Seabrook loamy sand, 0 to 2 percent slopes A State fine sandy loam, 0 to 2 percent slopes, very rarely flooded B Tarboro loamy sand, 0 to 6 percent slopes A Tomotley sandy loam, 0 to 2 percent slopes, rarely flooded W Water...25 References
92 How Soil Surveys Are Made Soil surveys are made to provide information about the soils and miscellaneous areas in a specific area. They include a description of the soils and miscellaneous areas and their location on the landscape and tables that show soil properties and limitations affecting various uses. Soil scientists observed the steepness, length, and shape of the slopes; the general pattern of drainage; the kinds of crops and native plants; and the kinds of bedrock. They observed and described many soil profiles. A soil profile is the sequence of natural layers, or horizons, in a soil. The profile extends from the surface down into the unconsolidated material in which the soil formed or from the surface down to bedrock. The unconsolidated material is devoid of roots and other living organisms and has not been changed by other biological activity. Currently, soils are mapped according to the boundaries of major land resource areas (MLRAs). MLRAs are geographically associated land resource units that share common characteristics related to physiography, geology, climate, water resources, soils, biological resources, and land uses (USDA, 2006). Soil survey areas typically consist of parts of one or more MLRA. The soils and miscellaneous areas in a survey area occur in an orderly pattern that is related to the geology, landforms, relief, climate, and natural vegetation of the area. Each kind of soil and miscellaneous area is associated with a particular kind of landform or with a segment of the landform. By observing the soils and miscellaneous areas in the survey area and relating their position to specific segments of the landform, a soil scientist develops a concept, or model, of how they were formed. Thus, during mapping, this model enables the soil scientist to predict with a considerable degree of accuracy the kind of soil or miscellaneous area at a specific location on the landscape. Commonly, individual soils on the landscape merge into one another as their characteristics gradually change. To construct an accurate soil map, however, soil scientists must determine the boundaries between the soils. They can observe only a limited number of soil profiles. Nevertheless, these observations, supplemented by an understanding of the soil-vegetation-landscape relationship, are sufficient to verify predictions of the kinds of soil in an area and to determine the boundaries. Soil scientists recorded the characteristics of the soil profiles that they studied. They noted soil color, texture, size and shape of soil aggregates, kind and amount of rock fragments, distribution of plant roots, reaction, and other features that enable them to identify soils. After describing the soils in the survey area and determining their properties, the soil scientists assigned the soils to taxonomic classes (units). Taxonomic classes are concepts. Each taxonomic class has a set of soil characteristics with precisely defined limits. The classes are used as a basis for comparison to classify soils systematically. Soil taxonomy, the system of taxonomic classification used in the United States, is based mainly on the kind and character of soil properties and the arrangement of horizons within the profile. After the soil 5
93 scientists classified and named the soils in the survey area, they compared the individual soils with similar soils in the same taxonomic class in other areas so that they could confirm data and assemble additional data based on experience and research. The objective of soil mapping is not to delineate pure map unit components; the objective is to separate the landscape into landforms or landform segments that have similar use and management requirements. Each map unit is defined by a unique combination of soil components and/or miscellaneous areas in predictable proportions. Some components may be highly contrasting to the other components of the map unit. The presence of minor components in a map unit in no way diminishes the usefulness or accuracy of the data. The delineation of such landforms and landform segments on the map provides sufficient information for the development of resource plans. If intensive use of small areas is planned, onsite investigation is needed to define and locate the soils and miscellaneous areas. Soil scientists make many field observations in the process of producing a soil map. The frequency of observation is dependent upon several factors, including scale of mapping, intensity of mapping, design of map units, complexity of the landscape, and experience of the soil scientist. Observations are made to test and refine the soil-landscape model and predictions and to verify the classification of the soils at specific locations. Once the soil-landscape model is refined, a significantly smaller number of measurements of individual soil properties are made and recorded. These measurements may include field measurements, such as those for color, depth to bedrock, and texture, and laboratory measurements, such as those for content of sand, silt, clay, salt, and other components. Properties of each soil typically vary from one point to another across the landscape. Observations for map unit components are aggregated to develop ranges of characteristics for the components. The aggregated values are presented. Direct measurements do not exist for every property presented for every map unit component. Values for some properties are estimated from combinations of other properties. While a soil survey is in progress, samples of some of the soils in the area generally are collected for laboratory analyses and for engineering tests. Soil scientists interpret the data from these analyses and tests as well as the field-observed characteristics and the soil properties to determine the expected behavior of the soils under different uses. Interpretations for all of the soils are field tested through observation of the soils in different uses and under different levels of management. Some interpretations are modified to fit local conditions, and some new interpretations are developed to meet local needs. Data are assembled from other sources, such as research information, production records, and field experience of specialists. For example, data on crop yields under defined levels of management are assembled from farm records and from field or plot experiments on the same kinds of soil. Predictions about soil behavior are based not only on soil properties but also on such variables as climate and biological activity. Soil conditions are predictable over long periods of time, but they are not predictable from year to year. For example, soil scientists can predict with a fairly high degree of accuracy that a given soil will have a high water table within certain depths in most years, but they cannot predict that a high water table will always be at a specific level in the soil on a specific date. After soil scientists located and identified the significant natural bodies of soil in the survey area, they drew the boundaries of these bodies on aerial photographs and 6
94 identified each as a specific map unit. Aerial photographs show trees, buildings, fields, roads, and rivers, all of which help in locating boundaries accurately. 7
95 Soil Map The soil map section includes the soil map for the defined area of interest, a list of soil map units on the map and extent of each map unit, and cartographic symbols displayed on the map. Also presented are various metadata about data used to produce the map, and a description of each soil map unit. 8

96 76 56' 13'' W Soil Map 76 55' 10'' W ' 32'' N 36 35' 25'' N Soil Map may not be valid at this scale ' 32'' N 36 35' 25'' N ' 13'' W N Map Scale: 1:10,100 if printed on A portrait (8.5" x 11") sheet. Meters Feet Map projection: Web Mercator Corner coordinates: WGS84 Edge tics: UTM Zone 18N WGS ' 10'' W
97 MAP LEGEND MAP INFORMATION Area of Interest (AOI) Area of Interest (AOI) Soils Soil Map Unit Polygons Soil Map Unit Lines Soil Map Unit Points Special Point Features Blowout Borrow Pit Clay Spot Closed Depression Gravel Pit Gravelly Spot Landfill Lava Flow Marsh or swamp Mine or Quarry Miscellaneous Water Perennial Water Rock Outcrop Saline Spot Sandy Spot Severely Eroded Spot Sinkhole Slide or Slip Sodic Spot Spoil Area Stony Spot Very Stony Spot Wet Spot Other Special Line Features Water Features Streams and Canals Transportation Rails Interstate Highways US Routes Major Roads Local Roads Background Aerial Photography The soil surveys that comprise your AOI were mapped at 1:24,000. Warning: Soil Map may not be valid at this scale. Enlargement of maps beyond the scale of mapping can cause misunderstanding of the detail of mapping and accuracy of soil line placement. The maps do not show the small areas of contrasting soils that could have been shown at a more detailed scale. Please rely on the bar scale on each map sheet for map measurements. Source of Map: Natural Resources Conservation Service Web Soil Survey URL: Coordinate System: Web Mercator (EPSG:3857) Maps from the Web Soil Survey are based on the Web Mercator projection, which preserves direction and shape but distorts distance and area. A projection that preserves area, such as the Albers equal-area conic projection, should be used if more accurate calculations of distance or area are required. This product is generated from the USDA-NRCS certified data as of the version date(s) listed below. Soil Survey Area: Southampton County, Virginia Survey Area Data: Version 15, Sep 24, 2014 Soil map units are labeled (as space allows) for map scales 1:50,000 or larger. Date(s) aerial images were photographed: Jan 12, 2016 Feb 1, 2017 The orthophoto or other base map on which the soil lines were compiled and digitized probably differs from the background imagery displayed on these maps. As a result, some minor shifting of map unit boundaries may be evident. 10
98 Map Unit Legend Map Unit Symbol Map Unit Name Acres in AOI Percent of AOI 1B Alaga loamy sand, 0 to 6 percent slopes 5B Bojac loamy sand, 2 to 6 percent slopes, very rarely flooded % % 12A Dorovan muck, 0 to 2 percent slopes, frequently flooded 15A Munden loamy sand, 0 to 2 percent slopes, rarely flooded 15B Munden loamy sand, 2 to 6 percent slopes, rarely flooded 19A Nimmo sandy loam, 0 to 2 percent slopes 25A Seabrook loamy sand, 0 to 2 percent slopes 27A State fine sandy loam, 0 to 2 percent slopes, very rarely flooded 28B Tarboro loamy sand, 0 to 6 percent slopes 29A Tomotley sandy loam, 0 to 2 percent slopes, rarely flooded % % % % % % % % W Water % Totals for Area of Interest % Map Unit Descriptions The map units delineated on the detailed soil maps in a soil survey represent the soils or miscellaneous areas in the survey area. The map unit descriptions, along with the maps, can be used to determine the composition and properties of a unit. A map unit delineation on a soil map represents an area dominated by one or more major kinds of soil or miscellaneous areas. A map unit is identified and named according to the taxonomic classification of the dominant soils. Within a taxonomic class there are precisely defined limits for the properties of the soils. On the landscape, however, the soils are natural phenomena, and they have the characteristic variability of all natural phenomena. Thus, the range of some observed properties may extend beyond the limits defined for a taxonomic class. Areas of soils of a single taxonomic class rarely, if ever, can be mapped without including areas of other taxonomic classes. Consequently, every map unit is made up of the soils or miscellaneous areas for which it is named and some minor components that belong to taxonomic classes other than those of the major soils. 11
99 Most minor soils have properties similar to those of the dominant soil or soils in the map unit, and thus they do not affect use and management. These are called noncontrasting, or similar, components. They may or may not be mentioned in a particular map unit description. Other minor components, however, have properties and behavioral characteristics divergent enough to affect use or to require different management. These are called contrasting, or dissimilar, components. They generally are in small areas and could not be mapped separately because of the scale used. Some small areas of strongly contrasting soils or miscellaneous areas are identified by a special symbol on the maps. If included in the database for a given area, the contrasting minor components are identified in the map unit descriptions along with some characteristics of each. A few areas of minor components may not have been observed, and consequently they are not mentioned in the descriptions, especially where the pattern was so complex that it was impractical to make enough observations to identify all the soils and miscellaneous areas on the landscape. The presence of minor components in a map unit in no way diminishes the usefulness or accuracy of the data. The objective of mapping is not to delineate pure taxonomic classes but rather to separate the landscape into landforms or landform segments that have similar use and management requirements. The delineation of such segments on the map provides sufficient information for the development of resource plans. If intensive use of small areas is planned, however, onsite investigation is needed to define and locate the soils and miscellaneous areas. An identifying symbol precedes the map unit name in the map unit descriptions. Each description includes general facts about the unit and gives important soil properties and qualities. Soils that have profiles that are almost alike make up a soil series. Except for differences in texture of the surface layer, all the soils of a series have major horizons that are similar in composition, thickness, and arrangement. Soils of one series can differ in texture of the surface layer, slope, stoniness, salinity, degree of erosion, and other characteristics that affect their use. On the basis of such differences, a soil series is divided into soil phases. Most of the areas shown on the detailed soil maps are phases of soil series. The name of a soil phase commonly indicates a feature that affects use or management. For example, Alpha silt loam, 0 to 2 percent slopes, is a phase of the Alpha series. Some map units are made up of two or more major soils or miscellaneous areas. These map units are complexes, associations, or undifferentiated groups. A complex consists of two or more soils or miscellaneous areas in such an intricate pattern or in such small areas that they cannot be shown separately on the maps. The pattern and proportion of the soils or miscellaneous areas are somewhat similar in all areas. Alpha-Beta complex, 0 to 6 percent slopes, is an example. An association is made up of two or more geographically associated soils or miscellaneous areas that are shown as one unit on the maps. Because of present or anticipated uses of the map units in the survey area, it was not considered practical or necessary to map the soils or miscellaneous areas separately. The pattern and relative proportion of the soils or miscellaneous areas are somewhat similar. Alpha-Beta association, 0 to 2 percent slopes, is an example. An undifferentiated group is made up of two or more soils or miscellaneous areas that could be mapped individually but are mapped as one unit because similar interpretations can be made for use and management. The pattern and proportion 12
100 of the soils or miscellaneous areas in a mapped area are not uniform. An area can be made up of only one of the major soils or miscellaneous areas, or it can be made up of all of them. Alpha and Beta soils, 0 to 2 percent slopes, is an example. Some surveys include miscellaneous areas. Such areas have little or no soil material and support little or no vegetation. Rock outcrop is an example. 13
101 Southampton County, Virginia 1B Alaga loamy sand, 0 to 6 percent slopes Map Unit Setting National map unit symbol: rnw6 Mean annual precipitation: 42 to 54 inches Frost-free period: 180 to 208 days Farmland classification: Not prime farmland Map Unit Composition Alaga and similar soils: 85 percent Estimates are based on observations, descriptions, and transects of the mapunit. Description of Alaga Setting Landform: Stream terraces, marine terraces Landform position (three-dimensional): Tread, riser Down-slope shape: Convex Across-slope shape: Convex Parent material: Sandy marine deposits and/or sandy alluvium Typical profile H1-0 to 4 inches: loamy sand H2-4 to 35 inches: loamy fine sand H3-35 to 84 inches: sand Properties and qualities Slope: 0 to 6 percent Depth to restrictive feature: More than 80 inches Natural drainage class: Somewhat excessively drained Runoff class: Very low Capacity of the most limiting layer to transmit water (Ksat): High to very high (5.95 to in/hr) Depth to water table: More than 80 inches Frequency of flooding: None Frequency of ponding: None Available water storage in profile: Low (about 3.1 inches) Interpretive groups Land capability classification (irrigated): None specified Land capability classification (nonirrigated): 4s Hydrologic Soil Group: A Hydric soil rating: No 5B Bojac loamy sand, 2 to 6 percent slopes, very rarely flooded Map Unit Setting National map unit symbol: rnwc Mean annual precipitation: 42 to 54 inches 14
102 Frost-free period: 180 to 208 days Farmland classification: All areas are prime farmland Map Unit Composition Bojac and similar soils: 75 percent Minor components: 1 percent Estimates are based on observations, descriptions, and transects of the mapunit. Description of Bojac Setting Landform: Stream terraces Landform position (three-dimensional): Tread, riser Down-slope shape: Linear Across-slope shape: Linear Parent material: Sandy and/or loamy alluvium Typical profile H1-0 to 13 inches: loamy sand H2-13 to 48 inches: sandy loam H3-48 to 66 inches: sand Properties and qualities Slope: 2 to 6 percent Depth to restrictive feature: More than 80 inches Natural drainage class: Well drained Runoff class: Very low Capacity of the most limiting layer to transmit water (Ksat): High (1.98 to 5.95 in/hr) Depth to water table: About 48 to 79 inches Frequency of flooding: Very rare Frequency of ponding: None Available water storage in profile: Low (about 5.8 inches) Interpretive groups Land capability classification (irrigated): None specified Land capability classification (nonirrigated): 2e Hydrologic Soil Group: A Hydric soil rating: No Minor Components Tomotley Percent of map unit: 1 percent Landform: Depressions on stream terraces, drainageways on stream terraces Landform position (three-dimensional): Base slope, tread Down-slope shape: Linear Across-slope shape: Linear Hydric soil rating: Yes 15
103 12A Dorovan muck, 0 to 2 percent slopes, frequently flooded Map Unit Setting National map unit symbol: rnwp Mean annual precipitation: 42 to 54 inches Frost-free period: 180 to 208 days Farmland classification: Not prime farmland Map Unit Composition Dorovan and similar soils: 85 percent Minor components: 5 percent Estimates are based on observations, descriptions, and transects of the mapunit. Description of Dorovan Setting Landform: Flood plains, swamps Down-slope shape: Concave Across-slope shape: Concave Parent material: Organic material over loamy alluvium Typical profile H1-0 to 17 inches: muck H2-17 to 65 inches: muck H3-65 to 80 inches: sandy loam Properties and qualities Slope: 0 to 2 percent Depth to restrictive feature: More than 80 inches Natural drainage class: Very poorly drained Runoff class: Negligible Capacity of the most limiting layer to transmit water (Ksat): Moderately high to high (0.57 to 1.98 in/hr) Depth to water table: About 0 inches Frequency of flooding: Frequent Frequency of ponding: Frequent Available water storage in profile: Very high (about 13.8 inches) Interpretive groups Land capability classification (irrigated): None specified Land capability classification (nonirrigated): 7w Hydrologic Soil Group: B/D Hydric soil rating: Yes Minor Components Chastain, frequently flooded Percent of map unit: 2 percent Landform: Flood plains Landform position (three-dimensional): Tread, riser 16
104 Down-slope shape: Linear Across-slope shape: Linear Hydric soil rating: Yes Roanoke Percent of map unit: 2 percent Landform: Stream terraces, flood plains Landform position (three-dimensional): Tread, riser Down-slope shape: Linear Across-slope shape: Linear Hydric soil rating: Yes Tomotley Percent of map unit: 1 percent Landform: Depressions on stream terraces, drainageways on stream terraces Landform position (three-dimensional): Base slope, tread Down-slope shape: Linear Across-slope shape: Linear Hydric soil rating: Yes 15A Munden loamy sand, 0 to 2 percent slopes, rarely flooded Map Unit Setting National map unit symbol: rnwv Mean annual precipitation: 42 to 54 inches Frost-free period: 180 to 208 days Farmland classification: All areas are prime farmland Map Unit Composition Munden and similar soils: 85 percent Minor components: 3 percent Estimates are based on observations, descriptions, and transects of the mapunit. Description of Munden Setting Landform: Stream terraces Landform position (three-dimensional): Tread, riser Down-slope shape: Convex Across-slope shape: Convex Parent material: Loamy marine deposits and/or sandy marine deposits and/or alluvium Typical profile H1-0 to 17 inches: loamy sand H2-17 to 36 inches: sandy loam H3-36 to 65 inches: sandy loam Properties and qualities Slope: 0 to 2 percent Depth to restrictive feature: More than 80 inches 17
105 Natural drainage class: Moderately well drained Runoff class: Very low Capacity of the most limiting layer to transmit water (Ksat): Moderately high to high (0.57 to 5.95 in/hr) Depth to water table: About 18 to 30 inches Frequency of flooding: Rare Frequency of ponding: None Available water storage in profile: Low (about 5.3 inches) Interpretive groups Land capability classification (irrigated): None specified Land capability classification (nonirrigated): 2w Hydrologic Soil Group: B Hydric soil rating: No Minor Components Nimmo Percent of map unit: 2 percent Landform: Stream terraces Landform position (three-dimensional): Riser Down-slope shape: Linear Across-slope shape: Linear Hydric soil rating: Yes Tomotley Percent of map unit: 1 percent Landform: Depressions on stream terraces, drainageways on stream terraces Landform position (three-dimensional): Base slope, tread Down-slope shape: Linear Across-slope shape: Linear Hydric soil rating: Yes 15B Munden loamy sand, 2 to 6 percent slopes, rarely flooded Map Unit Setting National map unit symbol: rnww Mean annual precipitation: 42 to 54 inches Frost-free period: 180 to 208 days Farmland classification: All areas are prime farmland Map Unit Composition Munden and similar soils: 85 percent Estimates are based on observations, descriptions, and transects of the mapunit. Description of Munden Setting Landform: Stream terraces Landform position (three-dimensional): Tread, riser Down-slope shape: Convex 18
106 Across-slope shape: Convex Parent material: Loamy marine deposits and/or sandy marine deposits and/or alluvium Typical profile H1-0 to 17 inches: loamy sand H2-17 to 36 inches: sandy loam H3-36 to 65 inches: sandy loam Properties and qualities Slope: 2 to 6 percent Depth to restrictive feature: More than 80 inches Natural drainage class: Moderately well drained Runoff class: Very low Capacity of the most limiting layer to transmit water (Ksat): Moderately high to high (0.57 to 5.95 in/hr) Depth to water table: About 18 to 30 inches Frequency of flooding: Rare Frequency of ponding: None Available water storage in profile: Low (about 5.3 inches) Interpretive groups Land capability classification (irrigated): None specified Land capability classification (nonirrigated): 2e Hydrologic Soil Group: B Hydric soil rating: No 19A Nimmo sandy loam, 0 to 2 percent slopes Map Unit Setting National map unit symbol: rnx1 Mean annual precipitation: 42 to 54 inches Frost-free period: 180 to 208 days Farmland classification: Prime farmland if drained Map Unit Composition Nimmo and similar soils: 80 percent Minor components: 3 percent Estimates are based on observations, descriptions, and transects of the mapunit. Description of Nimmo Setting Landform: Stream terraces Landform position (three-dimensional): Riser Down-slope shape: Linear Across-slope shape: Linear Parent material: Sandy alluvium and/or loamy alluvium Typical profile H1-0 to 14 inches: sandy loam H2-14 to 32 inches: fine sandy loam H3-32 to 64 inches: coarse sand 19
107 Properties and qualities Slope: 0 to 2 percent Depth to restrictive feature: More than 80 inches Natural drainage class: Poorly drained Runoff class: Very high Capacity of the most limiting layer to transmit water (Ksat): Moderately high to high (0.57 to 1.98 in/hr) Depth to water table: About 0 to 12 inches Frequency of flooding: None Frequency of ponding: None Available water storage in profile: Low (about 5.7 inches) Interpretive groups Land capability classification (irrigated): None specified Land capability classification (nonirrigated): 4w Hydrologic Soil Group: B/D Hydric soil rating: Yes Minor Components Roanoke Percent of map unit: 2 percent Landform: Stream terraces, flood plains Landform position (three-dimensional): Tread, riser Down-slope shape: Linear Across-slope shape: Linear Hydric soil rating: Yes Tomotley Percent of map unit: 1 percent Landform: Depressions on stream terraces, drainageways on stream terraces Landform position (three-dimensional): Base slope, tread Down-slope shape: Linear Across-slope shape: Linear Hydric soil rating: Yes 25A Seabrook loamy sand, 0 to 2 percent slopes Map Unit Setting National map unit symbol: rnx9 Mean annual precipitation: 42 to 54 inches Frost-free period: 180 to 208 days Farmland classification: Not prime farmland Map Unit Composition Seabrook and similar soils: 80 percent Estimates are based on observations, descriptions, and transects of the mapunit. 20
108 Description of Seabrook Setting Landform: Stream terraces Landform position (three-dimensional): Tread, riser Down-slope shape: Convex Across-slope shape: Convex Parent material: Sandy alluvium Typical profile H1-0 to 8 inches: loamy sand H2-8 to 32 inches: loamy fine sand H3-32 to 60 inches: fine sand Properties and qualities Slope: 0 to 2 percent Depth to restrictive feature: More than 80 inches Natural drainage class: Moderately well drained Runoff class: Very low Capacity of the most limiting layer to transmit water (Ksat): High to very high (5.95 to in/hr) Depth to water table: About 24 to 42 inches Frequency of flooding: None Frequency of ponding: None Available water storage in profile: Low (about 3.2 inches) Interpretive groups Land capability classification (irrigated): None specified Land capability classification (nonirrigated): 3s Hydrologic Soil Group: A Hydric soil rating: No 27A State fine sandy loam, 0 to 2 percent slopes, very rarely flooded Map Unit Setting National map unit symbol: rnxf Mean annual precipitation: 42 to 54 inches Frost-free period: 180 to 208 days Farmland classification: All areas are prime farmland Map Unit Composition State and similar soils: 95 percent Estimates are based on observations, descriptions, and transects of the mapunit. Description of State Setting Landform: Stream terraces Landform position (three-dimensional): Tread, riser Down-slope shape: Convex Across-slope shape: Convex Parent material: Sandy and/or loamy alluvium 21
109 Typical profile H1-0 to 10 inches: fine sandy loam H2-10 to 56 inches: sandy clay loam H3-56 to 84 inches: sandy loam Properties and qualities Slope: 0 to 2 percent Depth to restrictive feature: More than 80 inches Natural drainage class: Well drained Runoff class: Low Capacity of the most limiting layer to transmit water (Ksat): Moderately high to high (0.57 to 1.98 in/hr) Depth to water table: About 48 to 79 inches Frequency of flooding: Very rare Frequency of ponding: None Available water storage in profile: High (about 9.3 inches) Interpretive groups Land capability classification (irrigated): None specified Land capability classification (nonirrigated): 1 Hydrologic Soil Group: B Hydric soil rating: No 28B Tarboro loamy sand, 0 to 6 percent slopes Map Unit Setting National map unit symbol: rnxh Mean annual precipitation: 42 to 54 inches Frost-free period: 180 to 208 days Farmland classification: Not prime farmland Map Unit Composition Tarboro and similar soils: 95 percent Minor components: 2 percent Estimates are based on observations, descriptions, and transects of the mapunit. Description of Tarboro Setting Landform: Stream terraces Landform position (three-dimensional): Tread, riser Down-slope shape: Convex Across-slope shape: Convex Parent material: Sandy alluvium Typical profile H1-0 to 8 inches: loamy sand H2-8 to 84 inches: sand Properties and qualities Slope: 0 to 6 percent Depth to restrictive feature: More than 80 inches 22
110 Natural drainage class: Somewhat excessively drained Runoff class: Very low Capacity of the most limiting layer to transmit water (Ksat): High to very high (5.95 to in/hr) Depth to water table: More than 80 inches Frequency of flooding: None Frequency of ponding: None Available water storage in profile: Very low (about 2.6 inches) Interpretive groups Land capability classification (irrigated): None specified Land capability classification (nonirrigated): 4s Hydrologic Soil Group: A Hydric soil rating: No Minor Components Nimmo Percent of map unit: 2 percent Landform: Stream terraces Landform position (three-dimensional): Riser Down-slope shape: Linear Across-slope shape: Linear Hydric soil rating: Yes 29A Tomotley sandy loam, 0 to 2 percent slopes, rarely flooded Map Unit Setting National map unit symbol: rnxj Mean annual precipitation: 42 to 54 inches Frost-free period: 180 to 208 days Farmland classification: Prime farmland if drained Map Unit Composition Tomotley and similar soils: 90 percent Minor components: 4 percent Estimates are based on observations, descriptions, and transects of the mapunit. Description of Tomotley Setting Landform: Depressions on stream terraces, drainageways on stream terraces Landform position (three-dimensional): Base slope, tread Down-slope shape: Linear Across-slope shape: Linear Parent material: Sandy and/or loamy alluvium Typical profile H1-0 to 12 inches: sandy loam H2-12 to 48 inches: sandy clay loam H3-48 to 60 inches: sandy loam 23
111 H4-60 to 84 inches: loamy coarse sand Properties and qualities Slope: 0 to 2 percent Depth to restrictive feature: More than 80 inches Natural drainage class: Poorly drained Runoff class: Very high Capacity of the most limiting layer to transmit water (Ksat): Moderately high to high (0.20 to 1.98 in/hr) Depth to water table: About 0 to 12 inches Frequency of flooding: Rare Frequency of ponding: None Available water storage in profile: Moderate (about 8.7 inches) Interpretive groups Land capability classification (irrigated): None specified Land capability classification (nonirrigated): 4w Hydrologic Soil Group: B/D Hydric soil rating: Yes Minor Components Chastain, frequently flooded Percent of map unit: 1 percent Landform: Flood plains Landform position (three-dimensional): Tread, riser Down-slope shape: Linear Across-slope shape: Linear Hydric soil rating: Yes Dorovan Percent of map unit: 1 percent Landform: Flood plains, swamps Down-slope shape: Concave Across-slope shape: Concave Hydric soil rating: Yes Nimmo Percent of map unit: 1 percent Landform: Stream terraces Landform position (three-dimensional): Riser Down-slope shape: Linear Across-slope shape: Linear Hydric soil rating: Yes Roanoke Percent of map unit: 1 percent Landform: Stream terraces, flood plains Landform position (three-dimensional): Tread, riser Down-slope shape: Linear Across-slope shape: Linear Hydric soil rating: Yes 24
112 W Water Map Unit Setting National map unit symbol: rnxs Mean annual precipitation: 42 to 54 inches Frost-free period: 180 to 208 days Farmland classification: Not prime farmland Map Unit Composition Water: 100 percent Estimates are based on observations, descriptions, and transects of the mapunit. Description of Water Setting Landform: Perenial streams, lakes, swamps Properties and qualities Depth to restrictive feature: More than 80 inches Depth to water table: More than 80 inches Frequency of flooding: None Frequency of ponding: None 25
113 References American Association of State Highway and Transportation Officials (AASHTO) Standard specifications for transportation materials and methods of sampling and testing. 24th edition. American Society for Testing and Materials (ASTM) Standard classification of soils for engineering purposes. ASTM Standard D Cowardin, L.M., V. Carter, F.C. Golet, and E.T. LaRoe Classification of wetlands and deep-water habitats of the United States. U.S. Fish and Wildlife Service FWS/OBS-79/31. Federal Register. July 13, Changes in hydric soils of the United States. Federal Register. September 18, Hydric soils of the United States. Hurt, G.W., and L.M. Vasilas, editors. Version 6.0, Field indicators of hydric soils in the United States. National Research Council Wetlands: Characteristics and boundaries. Soil Survey Division Staff Soil survey manual. Soil Conservation Service. U.S. Department of Agriculture Handbook nrcs/detail/national/soils/?cid=nrcs142p2_ Soil Survey Staff Soil taxonomy: A basic system of soil classification for making and interpreting soil surveys. 2nd edition. Natural Resources Conservation Service, U.S. Department of Agriculture Handbook Soil Survey Staff Keys to soil taxonomy. 11th edition. U.S. Department of Agriculture, Natural Resources Conservation Service. Tiner, R.W., Jr Wetlands of Delaware. U.S. Fish and Wildlife Service and Delaware Department of Natural Resources and Environmental Control, Wetlands Section. United States Army Corps of Engineers, Environmental Laboratory Corps of Engineers wetlands delineation manual. Waterways Experiment Station Technical Report Y United States Department of Agriculture, Natural Resources Conservation Service. National forestry manual. home/?cid=nrcs142p2_ United States Department of Agriculture, Natural Resources Conservation Service. National range and pasture handbook. detail/national/landuse/rangepasture/?cid=stelprdb
114 United States Department of Agriculture, Natural Resources Conservation Service. National soil survey handbook, title 430-VI. nrcs/detail/soils/scientists/?cid=nrcs142p2_ United States Department of Agriculture, Natural Resources Conservation Service Land resource regions and major land resource areas of the United States, the Caribbean, and the Pacific Basin. U.S. Department of Agriculture Handbook cid=nrcs142p2_ United States Department of Agriculture, Soil Conservation Service Land capability classification. U.S. Department of Agriculture Handbook

115 United States Department of Agriculture Natural Resources Conservation Service A product of the National Cooperative Soil Survey, a joint effort of the United States Department of Agriculture and other Federal agencies, State agencies including the Agricultural Experiment Stations, and local participants Custom Soil Resource Report for Southampton County, Virginia Darden Brown Core 1 Schoolhouse Road October 23, 2017
116 Preface Soil surveys contain information that affects land use planning in survey areas. They highlight soil limitations that affect various land uses and provide information about the properties of the soils in the survey areas. Soil surveys are designed for many different users, including farmers, ranchers, foresters, agronomists, urban planners, community officials, engineers, developers, builders, and home buyers. Also, conservationists, teachers, students, and specialists in recreation, waste disposal, and pollution control can use the surveys to help them understand, protect, or enhance the environment. Various land use regulations of Federal, State, and local governments may impose special restrictions on land use or land treatment. Soil surveys identify soil properties that are used in making various land use or land treatment decisions. The information is intended to help the land users identify and reduce the effects of soil limitations on various land uses. The landowner or user is responsible for identifying and complying with existing laws and regulations. Although soil survey information can be used for general farm, local, and wider area planning, onsite investigation is needed to supplement this information in some cases. Examples include soil quality assessments ( portal/nrcs/main/soils/health/) and certain conservation and engineering applications. For more detailed information, contact your local USDA Service Center ( or your NRCS State Soil Scientist ( cid=nrcs142p2_053951). Great differences in soil properties can occur within short distances. Some soils are seasonally wet or subject to flooding. Some are too unstable to be used as a foundation for buildings or roads. Clayey or wet soils are poorly suited to use as septic tank absorption fields. A high water table makes a soil poorly suited to basements or underground installations. The National Cooperative Soil Survey is a joint effort of the United States Department of Agriculture and other Federal agencies, State agencies including the Agricultural Experiment Stations, and local agencies. The Natural Resources Conservation Service (NRCS) has leadership for the Federal part of the National Cooperative Soil Survey. Information about soils is updated periodically. Updated information is available through the NRCS Web Soil Survey, the site for official soil survey information. The U.S. Department of Agriculture (USDA) prohibits discrimination in all its programs and activities on the basis of race, color, national origin, age, disability, and where applicable, sex, marital status, familial status, parental status, religion, sexual orientation, genetic information, political beliefs, reprisal, or because all or a part of an individual's income is derived from any public assistance program. (Not all prohibited bases apply to all programs.) Persons with disabilities who require 2
117 alternative means for communication of program information (Braille, large print, audiotape, etc.) should contact USDA's TARGET Center at (202) (voice and TDD). To file a complaint of discrimination, write to USDA, Director, Office of Civil Rights, 1400 Independence Avenue, S.W., Washington, D.C or call (800) (voice) or (202) (TDD). USDA is an equal opportunity provider and employer. 3
118 Contents Preface... 2 How Soil Surveys Are Made...5 Soil Map... 8 Soil Map...9 Legend...10 Map Unit Legend Map Unit Descriptions...11 Southampton County, Virginia B Bojac loamy sand, 2 to 6 percent slopes, very rarely flooded A Nimmo sandy loam, 0 to 2 percent slopes A Seabrook loamy sand, 0 to 2 percent slopes B Tarboro loamy sand, 0 to 6 percent slopes A Tomotley sandy loam, 0 to 2 percent slopes, rarely flooded Udorthents, smoothed W Water...19 References
119 How Soil Surveys Are Made Soil surveys are made to provide information about the soils and miscellaneous areas in a specific area. They include a description of the soils and miscellaneous areas and their location on the landscape and tables that show soil properties and limitations affecting various uses. Soil scientists observed the steepness, length, and shape of the slopes; the general pattern of drainage; the kinds of crops and native plants; and the kinds of bedrock. They observed and described many soil profiles. A soil profile is the sequence of natural layers, or horizons, in a soil. The profile extends from the surface down into the unconsolidated material in which the soil formed or from the surface down to bedrock. The unconsolidated material is devoid of roots and other living organisms and has not been changed by other biological activity. Currently, soils are mapped according to the boundaries of major land resource areas (MLRAs). MLRAs are geographically associated land resource units that share common characteristics related to physiography, geology, climate, water resources, soils, biological resources, and land uses (USDA, 2006). Soil survey areas typically consist of parts of one or more MLRA. The soils and miscellaneous areas in a survey area occur in an orderly pattern that is related to the geology, landforms, relief, climate, and natural vegetation of the area. Each kind of soil and miscellaneous area is associated with a particular kind of landform or with a segment of the landform. By observing the soils and miscellaneous areas in the survey area and relating their position to specific segments of the landform, a soil scientist develops a concept, or model, of how they were formed. Thus, during mapping, this model enables the soil scientist to predict with a considerable degree of accuracy the kind of soil or miscellaneous area at a specific location on the landscape. Commonly, individual soils on the landscape merge into one another as their characteristics gradually change. To construct an accurate soil map, however, soil scientists must determine the boundaries between the soils. They can observe only a limited number of soil profiles. Nevertheless, these observations, supplemented by an understanding of the soil-vegetation-landscape relationship, are sufficient to verify predictions of the kinds of soil in an area and to determine the boundaries. Soil scientists recorded the characteristics of the soil profiles that they studied. They noted soil color, texture, size and shape of soil aggregates, kind and amount of rock fragments, distribution of plant roots, reaction, and other features that enable them to identify soils. After describing the soils in the survey area and determining their properties, the soil scientists assigned the soils to taxonomic classes (units). Taxonomic classes are concepts. Each taxonomic class has a set of soil characteristics with precisely defined limits. The classes are used as a basis for comparison to classify soils systematically. Soil taxonomy, the system of taxonomic classification used in the United States, is based mainly on the kind and character of soil properties and the arrangement of horizons within the profile. After the soil 5
120 scientists classified and named the soils in the survey area, they compared the individual soils with similar soils in the same taxonomic class in other areas so that they could confirm data and assemble additional data based on experience and research. The objective of soil mapping is not to delineate pure map unit components; the objective is to separate the landscape into landforms or landform segments that have similar use and management requirements. Each map unit is defined by a unique combination of soil components and/or miscellaneous areas in predictable proportions. Some components may be highly contrasting to the other components of the map unit. The presence of minor components in a map unit in no way diminishes the usefulness or accuracy of the data. The delineation of such landforms and landform segments on the map provides sufficient information for the development of resource plans. If intensive use of small areas is planned, onsite investigation is needed to define and locate the soils and miscellaneous areas. Soil scientists make many field observations in the process of producing a soil map. The frequency of observation is dependent upon several factors, including scale of mapping, intensity of mapping, design of map units, complexity of the landscape, and experience of the soil scientist. Observations are made to test and refine the soil-landscape model and predictions and to verify the classification of the soils at specific locations. Once the soil-landscape model is refined, a significantly smaller number of measurements of individual soil properties are made and recorded. These measurements may include field measurements, such as those for color, depth to bedrock, and texture, and laboratory measurements, such as those for content of sand, silt, clay, salt, and other components. Properties of each soil typically vary from one point to another across the landscape. Observations for map unit components are aggregated to develop ranges of characteristics for the components. The aggregated values are presented. Direct measurements do not exist for every property presented for every map unit component. Values for some properties are estimated from combinations of other properties. While a soil survey is in progress, samples of some of the soils in the area generally are collected for laboratory analyses and for engineering tests. Soil scientists interpret the data from these analyses and tests as well as the field-observed characteristics and the soil properties to determine the expected behavior of the soils under different uses. Interpretations for all of the soils are field tested through observation of the soils in different uses and under different levels of management. Some interpretations are modified to fit local conditions, and some new interpretations are developed to meet local needs. Data are assembled from other sources, such as research information, production records, and field experience of specialists. For example, data on crop yields under defined levels of management are assembled from farm records and from field or plot experiments on the same kinds of soil. Predictions about soil behavior are based not only on soil properties but also on such variables as climate and biological activity. Soil conditions are predictable over long periods of time, but they are not predictable from year to year. For example, soil scientists can predict with a fairly high degree of accuracy that a given soil will have a high water table within certain depths in most years, but they cannot predict that a high water table will always be at a specific level in the soil on a specific date. After soil scientists located and identified the significant natural bodies of soil in the survey area, they drew the boundaries of these bodies on aerial photographs and 6
121 identified each as a specific map unit. Aerial photographs show trees, buildings, fields, roads, and rivers, all of which help in locating boundaries accurately. 7
122 Soil Map The soil map section includes the soil map for the defined area of interest, a list of soil map units on the map and extent of each map unit, and cartographic symbols displayed on the map. Also presented are various metadata about data used to produce the map, and a description of each soil map unit. 8

123 76 57' 43'' W Soil Map 76 56' 17'' W ' 21'' N 36 36' 21'' N 36 35' 36'' N Soil Map may not be valid at this scale ' 36'' N ' 43'' W N Map Scale: 1:9,790 if printed on A landscape (11" x 8.5") sheet. Meters Feet Map projection: Web Mercator Corner coordinates: WGS84 Edge tics: UTM Zone 18N WGS ' 17'' W
Custom Soil Resource Report for Isle of Wight County, Virginia, Southampton County, Virginia, and Surry County, Virginia
 United States Department of Agriculture Natural Resources Conservation Service A product of the National Cooperative Soil Survey, a joint effort of the United States Department of Agriculture and other
Custom Soil Resource Report for Colquitt and Cook Counties, Georgia
 United States Department of Agriculture Natural Resources Conservation Service A product of the National Cooperative Soil Survey, a joint effort of the United States Department of Agriculture and other
Custom Soil Resource Report for Polk County, Wisconsin
 United States Department of Agriculture Natural Resources Conservation Service A product of the National Cooperative Soil Survey, a joint effort of the United States Department of Agriculture and other
Custom Soil Resource Report for Columbus County, North Carolina
 United States Department of Agriculture Natural Resources Conservation Service A product of the National Cooperative Soil Survey, a joint effort of the United States Department of Agriculture and other
Custom Soil Resource Report for Wright County, Minnesota
 United States Department of Agriculture Natural Resources Conservation Service A product of the National Cooperative Soil Survey, a joint effort of the United States Department of Agriculture and other
Custom Soil Resource Report for St. Lucie County, Florida
 United States Department of Agriculture Natural Resources Conservation Service A product of the National Cooperative Soil Survey, a joint effort of the United States Department of Agriculture and other
Soil Map Lewis County, Kentucky (Denham Farm, Sand Hill/Trinity, Lewis Co., KY) Web Soil Survey National Cooperative Soil Survey
 Web Soil Survey National Cooperative Soil Survey") 83 37' 43'' W (Denham Farm, Sand Hill/Trinity, Lewis Co., KY) 83 36' 18'' W 38 40' 37'' N 271500 271700 271900 272100 272300 272500 272700 272900 273100 273300 38 40' 37'' N 38 39' 54'' N 4282900 4283100
83 37' 43'' W (Denham Farm, Sand Hill/Trinity, Lewis Co., KY) 83 36' 18'' W 38 40' 37'' N 271500 271700 271900 272100 272300 272500 272700 272900 273100 273300 38 40' 37'' N 38 39' 54'' N 4282900 4283100
Land Evaluation and Site Assessment Model
 Land Evaluation and Site Assessment Model Citizens Imperial Solar, LLC Project Imperial County, CA June 6, 2018 This page is intentionally blank. Land Evaluation and Site Assessment Model Citizens Imperial
Custom Soil Resource Report for Douglas County, Washington
 United States Department of Agriculture Natural Resources Conservation Service A product of the National Cooperative Soil Survey, a joint effort of the United States Department of Agriculture and other
Custom Soil Resource Report for St. Lucie County, Florida Gopherbroke Farms
 United States Department of Agriculture Natural Resources Conservation Service A product of the National Cooperative Soil Survey, a joint effort of the United States Department of Agriculture and other
Custom Soil Resource Report for Okeechobee County, Florida
 United States Department of Agriculture Natural Resources Conservation Service A product of the National Cooperative Soil Survey, a joint effort of the United States Department of Agriculture and other
Custom Soil Resource Report for Dallam County, Texas
 United States Department of Agriculture Natural Resources Conservation Service A product of the National Cooperative Soil Survey, a joint effort of the United States Department of Agriculture and other
At its November 8, 2018 meeting, the Planning Commission recommended approval of the voluntary agricultural and forestal district.
 SOUTHAMPTON COUNTY BOARD OF SUPERVISORS Regular Session December 17, 2018 11G. PUBLIC HEARING AG & FORESTAL DISTRICT CARTER A. SMITH. ET ALS OPENING STATEMENT This public hearing is held pursuant to Section
Custom Soil Resource Report for Okeechobee County, Florida
 United States Department of Agriculture Natural Resources Conservation Service A product of the National Cooperative Soil Survey, a joint effort of the United States Department of Agriculture and other
Custom Soil Resource Report for Pamlico County, North Carolina
 United States Department of Agriculture Natural Resources Conservation Service A product of the National Cooperative Soil Survey, a joint effort of the United States Department of Agriculture and other
Custom Soil Resource Report for Douglas County, Washington
 United States Department of Agriculture Natural Resources Conservation Service A product of the National Cooperative Soil Survey, a joint effort of the United States Department of Agriculture and other
Custom Soil Resource Report for Logan County, Oklahoma
 United States Department of Agriculture Natural Resources Conservation Service A product of the National Cooperative Soil Survey, a joint effort of the United States Department of Agriculture and other
NRCS Soils Information and Maps. Appendix F
 NRCS Soils Information and Maps Appendix F United States Department of Agriculture Natural Resources Conservation Service A product of the National Cooperative Soil Survey, a joint effort of the United
Soil Map Lowndes County, Alabama (McEvoy_Gordonsville)
") 524700 525000 525300 525600 525900 526200 3568000 3568000 3567700 3567700 3567400 3567400 3567100 3567100 3566800 3566800 3566500 3566500 3566200 3566200 3565900 3565900 524700 525000 525300 525600 Map
524700 525000 525300 525600 525900 526200 3568000 3568000 3567700 3567700 3567400 3567400 3567100 3567100 3566800 3566800 3566500 3566500 3566200 3566200 3565900 3565900 524700 525000 525300 525600 Map
Planting # Planting History Senger planting Prepared by Kim Elsenbroek Maps by: Jocelyn Frazelle
 Planting # 117 2015 Planting History Senger planting Prepared by Kim Elsenbroek 11.13.2015 Maps by: Jocelyn Frazelle 30 Acres Total all in burned cornfield Mesic: 40 lbs/acre over 30 acres, total 1200
Custom Soil Resource Report for Ocean County, New Jersey
 United States Department of Agriculture Natural Resources Conservation Service A product of the National Cooperative Soil Survey, a joint effort of the United States Department of Agriculture and other
Web Soil Survey National Cooperative Soil Survey
 99 52' 37'' W Yields of Irrigated Crops (Component): Cotton lint (Lbs) Haskell County, Texas 99 51' 40'' W 33 21' 4'' N 418500 418600 418700 418800 418900 419000 419100 419200 419300 419400 419500 419600
Custom Soil Resource Report for Polk County, Wisconsin
 United States Department of Agriculture Natural Resources Conservation Service A product of the National Cooperative Soil Survey, a joint effort of the United States Department of Agriculture and other
United States Department of Agriculture Natural Resources Conservation Service
 Jericho Winter, USDA NRCS Resource Soil Scientist Jeremy Baker, Rural Conservationist, East Multnomah SWCD Kim Galland, Multnomah Co. District Conservationist United States Department of Agriculture Natural
Pinheiro Ranch 55+/- Acres Orchard Development Ground Orland, CA. Presented By:
 Pinheiro Ranch 55+/- Acres Orchard Development Ground Orland, CA Presented By: Pinheiro Ranch 55+/- Acres Orchard Development Ground Orland, CA Location: This property is located on the SE corner of Road
STORMWATER POLLUTION PREVENTION PLAN
 STORMWATER POLLUTION PREVENTION PLAN FOR CONSTRUCTION PROJECT SITE: FAIRMONT CENTRAL WILL COUNTY, ILLINOIS PREPARED FOR: WILL COUNTY LAND USE DEPARTMENT COMMUNITY DEVELOPMENT DIVISION 58 E. CLINTON ST.,
PHYSICAL SOIL PROPERTIES
 PHYSICAL SOIL PROPERTIES Physical Soil Properties Santa Cruz County, California Scotts Valley Target Physical Soil Properties This table shows estimates of some physical characteristics and features that
DEPARTMENT OF GENERAL SERVICES NATURAL RESOURCES DIVISION INTEROFFICE MEMORANDUM
 DEPARTMENT OF GENERAL SERVICES NATURAL RESOURCES DIVISION INTEROFFICE MEMORANDUM TO: Board of County Commissioners VIA: Terry Shannon, County Administrator VIA: V. Wilson Freeland, Director, Department
 Attachment E Loam Approval Package and Soil Blending Letter (EI) EcoTec, Inc. ENVIRONMENTAL CONSULTING SERVICES 102 Grove Street Worcester, MA 01605-2629 508-752-9666 / Fax: 508-752-9494 May 15, 2013 Michele
Web Soil Survey National Cooperative Soil Survey
 289300 289700 290100 290500 83 12' 5'' W 83 13' 37'' W Farmland Classification Ben Hill and Irwin Counties, Georgia 290900 291300 31 46' 8'' N 3514000 3514000 3514400 3514400 3514800 3514800 3515200 3515200
APPENDIX I LESA MODELS
 APPENDIX I LESA MODELS LESA ASSESSMENT SEVILLE 4 SOLAR PROJECT HORIZONTAL SINGLE-AXIS TRACKING ARRAY (T16S, R12E, S25, SBB&M) IMPERIAL COUNTY, CALIFORNIA July 2017 EMA Report No. 2375-01 Prepared for:
LESA ASSESSMENT LAUREL SOLAR PROJECT (T16S, R12E, S26, SBB&M)
") LESA ASSESSMENT LAUREL SOLAR PROJECT (T16S, R12E, S26, SBB&M) IMPERIAL COUNTY, CALIFORNIA May 2017 EMA Report No. 2377-01 Prepared for: 90FI 8me LLC 111 Woodmere Road, Suite 250 Folsom, CA 95630 ENVIRONMENTAL
LESA ASSESSMENT LAUREL SOLAR PROJECT (T16S, R12E, S26, SBB&M) IMPERIAL COUNTY, CALIFORNIA May 2017 EMA Report No. 2377-01 Prepared for: 90FI 8me LLC 111 Woodmere Road, Suite 250 Folsom, CA 95630 ENVIRONMENTAL
AG-LAND Investment Brokers 275 Sale Lane Red Bluff, CA Fax Paradox Seed Mother Orchard Red Bluff, CA
 AG-LAND Investment Brokers 275 Sale Lane Red Bluff, CA 96080 530-529-4400 Fax 530-527-5042 Paradox Seed Mother Orchard Red Bluff, CA AG-LAND INVESTMENT BROKERS 275 Sale Lane / P. O. Box 896 Red Bluff,
Custom Soil Resource Report for Kent County, Michigan
 United States Department of Agriculture Natural Resources Conservation Service A product of the National Cooperative Soil Survey, a joint effort of the United States Department of Agriculture and other
Alapaha Tract. Alapaha Tract. Berrien County GA Acres Par LL 320 LD 5. Date: 6/6/2017. TractName
 The 996 Planted Slash was st thinned in 0 TractName Alapaha inch equals 74 miles in = 44,786 ft 0 0 60 Miles :,77,40 The 996 Planted Slash was st thinned in 0 TractName Alapaha inch equals miles in = 6,7
Mule Ranch - Dorris, CA 1,234 +/- acres, Siskiyou County
 AG-LAND Investment Brokers 275 Sale Lane Red Bluff, CA 96080 530-529-4400 Fax 530-527-5042 Mule Ranch - Dorris, CA 1,234 +/- acres, Siskiyou County AG-LAND INVESTMENT BROKERS 275 Sale Lane / P. O. Box
THE CITY OF THE VILLAGE PLANNED UNIT DEVELOPMENT DESIGN STATEMENT FOR MULFORD ESTATES
 THE CITY OF THE VILLAGE PLANNED UNIT DEVELOPMENT DESIGN STATEMENT FOR MULFORD ESTATES Revised August 18, 2016, August 10, 2016, September 19,2016 Prepared By: Isch and Associates, Inc. 14848 Bristol Park
AG-LAND Investment Brokers 275 Sale Lane Red Bluff, CA Fax Corning Eucalyptus Farm
 AG-LAND Investment Brokers 275 Sale Lane Red Bluff, CA 96080 530-529-4400 Fax 530-527-5042 Corning Eucalyptus Farm Tehama County,, California 1 of 6 deep irrigation wells Drip tubing rolled at the edge
McColl Fence Addition GEOTECHNICAL ASSESSMENT
 McColl Fence Addition GEOTECHNICAL ASSESSMENT Prepared For: Stuart McColl 1038 Hooker Road Sequim, WA 98382 SEPTEMBER 2012 Prepared By: Trent T. Adams, EIT Justin C. Wilson, PE NTI ENGINEERING & LAND SURVEYING
APPENDIX E. LESA Models
 APPENDIX E LESA Models LESA ASSESSMENT CALEXICO SOLAR FARM I PHASE A PROJECT AREA CALEXICO SOLAR FARM I PHASE A PROJECT (SW/4 Section 13, S/2 Section 14, S/2 NE/4 Section 15, NW/4 Section 15, T17S, R13E,
Forest Glen Recreation Residence Septic System Improvements Soils Report Shasta-Trinity National Forest January 2011
 Terrain Background: Soil map units: Forest Glen Recreation Residence Septic System Improvements Soils Report Shasta-Trinity National Forest January 2011 32 Deadwood very gravelly loam, 40 to 60% slopes
LESA ASSESSMENT MOUNT SIGNAL SOLAR FARM I PROJECT AREA
 LESA ASSESSMENT MOUNT SIGNAL SOLAR FARM I PROJECT AREA MOUNT SIGNAL SOLAR FARM I PROJECT (SW/4 Section 16, S/2 Section 15, NE/4 Section 14 (portion), N/2 Section 13 (portion) and SE/4 Section 13, T17S,
Appendix E Agency Coordination
 Sustainable Airport Master Plan Appendix E Agency Coordination. Appendix United States Department of Agriculture Natural Resources Conservation Service A product of the National Cooperative Soil Survey,
LOCATION RESTRICTIONS - WETLANDS BASIN 6
 LOCATION RESTRICTIONS - WETLANDS BASIN 6 U.S. EPA Coal Combustion Residuals Rule Brunner Island Steam Electric Station East Manchester Township, York County, Pennsylvania PREPARED FOR: BRUNNER ISLAND,
Preliminary Decision Memo Recreation Residence Septic Repairs
 Preliminary Decision Memo 2014 Recreation Residence Septic Repairs USDA Forest Service McKenzie River Ranger District Willamette National Forest Lane County, Oregon T. 16 S., R. 5 E, Section 16 Willamette
TIERRA SOUTH FLORIDA, INC. Geotechnical Engineering / Material Testing / Inspection Services
 TIERRA SOUTH FLORIDA, INC. Geotechnical Engineering / Material Testing / Inspection Services March 11, 2016 Kimley-Horn 1920 Wekiva Way Suite 200 West Palm Beach, Fl. 33411 Attn: Matthew B. Fursetzer,
APPENDIX J CRYSTAL GEYSER ONSITE IRRIGATION SYSTEM TECHNICAL MEMORANDUM
 APPENDIX J CRYSTAL GEYSER ONSITE IRRIGATION SYSTEM TECHNICAL MEMORANDUM DRAFT TECHNICAL MEMORANDUM Crystal Geyser Onsite Irrigation System PREPARED FOR: PREPARED BY: REVIEWED BY: Richard Weklych/CGWC Barbara
Locally Led Conservation & The Local Work Group. Mark Habiger NRCS
 Locally Led Conservation & The Local Work Group Mark Habiger NRCS 1 What Is Locally Led Conservation? Community Stakeholders 1. Assessing their natural resource conservation needs 2. Setting community
CCR Certification: Initial Inflow Design Flood Control System Plan for the
 Submitted to Southern Indiana Gas & Electric Company dba Vectren Power Supply, Inc. (SIGECO) One Vectren Square Evansville, IN 47708 Submitted by AECOM 9400 Amberglen Boulevard Austin, Texas 78729 December
Decision Memo. Cabin #5 Electric, Water, Septic Improvements
 Decision Memo Cabin #5 Electric, Water, Septic Improvements USDA Forest Service Ocoee/ Hiwassee Ranger District, Cherokee National Forest Polk County, Tennessee Section 18, Township 2, Range 3 East; Lot
Draft Decision Memo Santiam Junction Maintenance Station Truck Shop Extension
 Draft Decision Memo Santiam Junction Maintenance Station Truck Shop Extension USDA Forest Service McKenzie River Ranger District Willamette National Forest Linn County, OR T.13 S., R.7 E., Section 14,
Draft Decision Memo OHV Trails 22 and 42 Reroute Project
 Draft Decision Memo OHV Trails 22 and 42 Reroute Project USDA Forest Service McKenzie River Ranger District Willamette National Forest Linn County, OR T13S, R7E, Sections 25 and 34 Willamette Meridian
Appendix M Land Evaluation and Site Assessment (Calipatria I, Midway I and Midway II)
") Appendix M Land Evaluation and Site Assessment (Calipatria I, Midway I and Midway II) LESA ASSESSMENT CALIPATRIA SOLAR FARM I PROJECT AREA CALIPATRIA SOLAR FARM I PROJECT (Section 10 (portion), T12S, R14E,
Appendix M Land Evaluation and Site Assessment (Calipatria I, Midway I and Midway II) LESA ASSESSMENT CALIPATRIA SOLAR FARM I PROJECT AREA CALIPATRIA SOLAR FARM I PROJECT (Section 10 (portion), T12S, R14E,
Custom Soil Resource Report for Montgomery County, Texas, Polk and San Jacinto Counties, Texas, and Walker County, Texas
 United States Department of Agriculture Natural Resources Conservation Service A product of the National Cooperative Soil Survey, a joint effort of the United States Department of Agriculture and other
Natural Resources Conservation Service
 Natural Resources Conservation Service Helping people, help the land Presented To: THE PAST, PRESENT, FUTURE, NATURAL FOOD HEALTH, INC. INFORMATIONAL WORKSHOP December 14 th, 2012 - Greensboro, GA Presented
Loam Ridge Almond Orchard
 AG-LAND Investment Brokers 645 Antelope Blvd., Suite 17 PO Box 896 Red Bluff, CA 96080 530-529-4400 Fax 530-527-5042 Loam Ridge Almond Orchard Contact: AG-LAND Investment Brokers Prepared by FSA Date:
DECISION NOTICE FINDING OF NO SIGNIFICANT IMPACT (FONSI)
") DECISION NOTICE AND FINDING OF NO SIGNIFICANT IMPACT (FONSI) FOR CASA LOMA RECREATION RESIDENCE PERMIT RENEWAL U.S. FOREST SERVICE CIBOLA NATIONAL FOREST SANDIA RANGER DISTRICT BERNALILLO COUNTY, NEW MEXICO
DECISION NOTICE AND FINDING OF NO SIGNIFICANT IMPACT (FONSI) FOR CASA LOMA RECREATION RESIDENCE PERMIT RENEWAL U.S. FOREST SERVICE CIBOLA NATIONAL FOREST SANDIA RANGER DISTRICT BERNALILLO COUNTY, NEW MEXICO
FARM BILL 2002 Colorado Conservation Provisions
 United States Department of Agriculture Natural Resources Conservation Service FARM BILL 2002 Colorado Conservation Provisions Conserving Natural Resources on Colorado s Privately Owned Farmland Farm Bill
Drainage Letter for Falcon High School Building Expansion
 August 11, 2017 El Paso County Planning and Community Development Department 2880 International Circle, Suite 110 Colorado Springs, CO 80910 ATTN: RE: Mr. Jeff Rice Drainage Letter for Falcon High School
Decision Notice and Finding of No Significant Impact
 Decision Notice and Finding of No Significant Impact Gold Lake Bog Research Natural Area Boundary Adjustment and Nonsignificant Forest Plan Amendment #53 USDA Forest Service Middle Fork Ranger District,
Santa Clara Area, California, Western Part
 Santa Clara Area, California, Western Part 101 Urban land, 0 to 2 percent slopes, basins Map Unit Setting Landscape: Alluvial plains, basins Elevation: 0 to 80 feet Mean annual precipitation: 14 to 30
STORMWATER POLLUTION PREVENTION PLAN (SWPPP)
") SIEMENS INDUSTRY, INC. STORMWATER POLLUTION PREVENTION PLAN (SWPPP) COLUMBIA UNIVERSITY/SUN EDISON REMOTE METERING SOLAR ENERGY PROJECT JOHNSON FARM, 121 JOHNSON ROAD CHESTER, NEW YORK 10918 TAX LOT SECTION
SIEMENS INDUSTRY, INC. STORMWATER POLLUTION PREVENTION PLAN (SWPPP) COLUMBIA UNIVERSITY/SUN EDISON REMOTE METERING SOLAR ENERGY PROJECT JOHNSON FARM, 121 JOHNSON ROAD CHESTER, NEW YORK 10918 TAX LOT SECTION
The glenlivet farm and refuge An agricultural and recreational investment opportunity.
 offered for sale The glenlivet farm and refuge An agricultural and recreational investment opportunity. 3,106 (+/- sq. ft.) lodge situated on a 304 (+/-) acre farm/waterfowl refuge Arkansas County, Arkansas
Dairyville Irrigated Pasture & Home. Los Molinos, CA
 Dairyville Irrigated Pasture & Home Los Molinos, CA AG-LAND INVESTMENT BROKERS 275 Sale Lane, Suite 2 / P. O. Box 896 Red Bluff, CA 96080 530.529.4400 office / 530.527.5042 fax 68 th Avenue Irrigated Pasture
Soil Resource Report within Project Limits
 Preliminary Geotechnical Report El Camino Real Bus Rapid Transit Project Santa Clara County, California 04-SCL-82 Appendix A.3 Soil Resource Report within Project Limits November 2013 A-4 United States
Stormwater Analysis Report
 Stormwater Analysis Report Solar Panel Array Temple Street (Rt. 14) West Boylston, MA February 24, 216 SITE Prepared for: West Boylston Municipal Lighting Plant 4 Crescent Street West Boylston, MA 1583
The Big Picture SOILS, WETLANDS AND DEVELOPMENT SOILS OVERVIEW BRUCE BARBER. PWS, Soil Scientist Certified Ecologist CORNERSTONE ASSOCIATES
 SOILS, WETLANDS AND DEVELOPMENT BRUCE BARBER PWS, Soil Scientist Certified Ecologist CORNERSTONE ASSOCIATES 1770 CENTRAL STREET YORKTOWN HEIGHTS NY 10598 PHONE: (914) 962-7733 FAX: (914) 962-0330 EMAIL:
REFERENCE MAPS FEMA FIRM MAP NRCS SOILS MAP
 REFERENCE MAPS FEMA FIRM MAP NRCS SOILS MAP Hydrologic Soil Group-Hillsborough County, Florida (Independence Parkway) 27' 58' 56" 27" 58' 57" 2r 58' 32" 27" 58' 33" Map Scale: 1:5,290 if printed on A size
Deep River-Portage Burns Waterway Watershed 2015
 2.4 Soils Soil development is the product of the interaction of parent material, topography, climate, organisms and time. Understanding the types of soils that exist within a watershed and their characteristics
FINAL DRAINAGE REPORT FOR LOT 2 BECKETT AT WOODMEN HILLS FILING NO MCLAUGHLIN ROAD COLORADO SPRINGS, COLORADO
 FINAL DRAINAGE REPORT FOR LOT 2 BECKETT AT WOODMEN HILLS FILING NO. 3 7368 MCLAUGHLIN ROAD COLORADO SPRINGS, COLORADO October 4, 2017 Revised November 2018 Prepared For: TBONE CONSTRUCTION 1310 FORD STREET
NRCS Water Quality Practices
 NRCS Water Quality Practices Presented by: Ruth Book, P.E., Ph.D. State Conservation Engineer Champaign, Illinois www.il.nrcs.usda.gov 2016 Illinois Water Conference October 27, 2016 Agenda Working with
December 4, Hingham School Building Committee Hingham Town Hall 210 Central Street Hingham, MA 02043
 P a r e C O R P. C O M E n g i n e e r s S c i e n t i s t s P l a n n e r s December 4, 2017 Hingham School Building Committee Hingham Town Hall 210 Central Street Hingham, MA 02043 Re: Foster Elementary
DECISION MEMO MANHATTAN FUELS REDUCTION PROJECT U.S. FOREST SERVICE CANYON LAKES RANGER DISTRICT LARIMER COUNTY, CO
 DECISION MEMO MANHATTAN FUELS REDUCTION PROJECT U.S. FOREST SERVICE CANYON LAKES RANGER DISTRICT LARIMER COUNTY, CO Background and Project Description In order to improve forest health and reduce hazardous
Dye Creek Orchards Los Molinos, California
 AG-LAND INVESTMENT BROKERS 275Sale Lane / P. O. Box 896 Red Bluff, CA 96080 530.529.4400 office / 530.527.5042 fax Dye Creek Orchards Los Molinos, California Listing Price: $1,950,000. Seller financing
Woodland Planning for Success
 Woodland Planning for Success Why Do I Need a Forest Management Plan? 20 th Annual Tri-State Forest Stewardship Conference 2014 Wade Conn Natural Resources Conservation Service State Forester Champaign,
Central Glenn County, CA
 AG-LAND Investment Brokers 275 Sale Lane Red Bluff, CA 96080 530-529-4400 Fax 530-527-5042 AAA&D Almond Orchard 145 +/- Acres Producing Central Glenn County, CA AG-LAND INVESTMENT BROKERS 275 Sale
Efficiency and Conservation in Agricultural Water Use
 Efficiency and Conservation in Agricultural Water Use Scott D. Edwards Assistant State Conservationist for Programs, June 10, 2017 As the Nation s largest water user, agriculture accounts for about 80
Arvada Plaza Redevelopment. Walmart Store # (Lot 1) Industrial Realty Group, LLC (Lot 2)
 Industrial Realty Group, LLC (Lot 2)") Drainage Analysis Arvada, CO Arvada Plaza Redevelopment Including: Walmart Store #4734-00 (Lot 1) & Industrial Realty Group, LLC (Lot 2) (W 58 th Ave & Independence Street) Arvada, Colorado Preliminary
Drainage Analysis Arvada, CO Arvada Plaza Redevelopment Including: Walmart Store #4734-00 (Lot 1) & Industrial Realty Group, LLC (Lot 2) (W 58 th Ave & Independence Street) Arvada, Colorado Preliminary
Wetland Functional Assessment- Agricultural Lands. Kim Farrell Natural Resources Conservation Service U.S. Department of Agriculture October 13, 2015
 Wetland Functional Assessment- Agricultural Lands Kim Farrell Natural Resources Conservation Service U.S. Department of Agriculture October 13, 2015 Food Security Act of 1985 1985 Farm Bill Created Wetland
Porcupine Vegetation and Road Management Project - Shasta Salamander Report - June 23, 2011
 The following summary includes the best available science for Shasta salamander (Hydromantes shastae, HYSH) in regards to its range and habitat to determine whether a project would trigger the need for
( ) or 811 or mo1call.com
 or 811 or mo1call.com") Missouri One Call 1-800-DIG RITE (800-344-7483) or 811 or mo1call.com Missouri One Call 1-800-DIG RITE (800-344-7483) or 811 or mo1call.com Missouri One Call 1-800-DIG RITE (800-344-7483) or 811 or mo1call.com
Missouri One Call 1-800-DIG RITE (800-344-7483) or 811 or mo1call.com Missouri One Call 1-800-DIG RITE (800-344-7483) or 811 or mo1call.com Missouri One Call 1-800-DIG RITE (800-344-7483) or 811 or mo1call.com
Plan Review Background Paper Background Paper Number: 19 Planning & Development Department Date: September 2015
 Plan Review Background Paper Background Paper Number: 19 Planning & Development Department Date: September 2015 Environment Background East Hants is fortunate to enjoy the benefits of many natural resources
Civil Engineering Land Surveying Wetland Science
 Civil Engineering Land Surveying Wetland Science July 5, 2017 Town of Littleton Conservation Commission c/o Amy Green, Conservation Coordinator Shattuck Street Municipal Building 37 Shattuck Street Littleton,
Hungry Creek Watershed Road Maintenance and Stony Quarry Development
 Notice of Proposed Action Opportunity to Provide Scoping Comments Hungry Creek Watershed Road Maintenance and Stony Quarry Development Mt. Hough Ranger District Plumas National Forest Plumas County, California
Dust Bowl and USDA - NRCS. Kim Wright USDA-NRCS Program Liaison Bryan, Texas
 Dust Bowl and USDA - NRCS Kim Wright USDA-NRCS Program Liaison Bryan, Texas Who is the NRCS? The Natural Resources Conservation Service is a Federal agency that works in partnership with the American people
Herger Ranch /- Acres Madison, CA. Presented By:
 Herger Ranch 326.33+/- Acres Madison, CA Presented By: Herger Ranch 326.33+/- Acres Madison, CA Location: This ranch is located on the NW corner of Highway 16 and Road 89 in Madison, CA. The property stretches
Mississippi River Basin Healthy Watershed Initiative
 Mississippi River Basin Healthy Watershed Initiative A Progress Report for Arkansas Presented by: Mike Sullivan, State Conservationist FY 2010 12 States 41 Focus Areas FY 2011 Added two focus areas: SD/MS
DECISION MEMO. Griz Thin (Stand )
") Background DECISION MEMO Griz Thin (Stand 507089) USDA Forest Service Siuslaw National Forest Central Coast Ranger District Lane County, Oregon Township 16 South, Range 10 West, Sections 6 and 7 The Cummins-Tenmile
Background DECISION MEMO Griz Thin (Stand 507089) USDA Forest Service Siuslaw National Forest Central Coast Ranger District Lane County, Oregon Township 16 South, Range 10 West, Sections 6 and 7 The Cummins-Tenmile
Stream Reaches and Hydrologic Units
 Chapter United States 6 Department of Agriculture Natural Resources Conservation Service Chapter 6 Stream Reaches and Hydrologic Units Rain clouds Cloud formation Precipitation Surface runoff Evaporation
MOLOAʻA VALLEY FARMS SUBDIVISION
 MOLOAʻA VALLEY FARMS SUBDIVISION TAX MAP KEY (4) 4-9-011-013 Agricultural Master Plan - 1 - Introduction:...3 Parcel-wide Agricultural Considerations...3 Agricultural Use Details by Unit:...6 Unit 1:...6
PROJECT INFORMATION Manchester Ranger District Apple Tree Release and Maintenance Project
 PROJECT INFORMATION Manchester Ranger District Apple Tree Release and Maintenance Project The USDA Forest Service is proposing to release and prune living apple trees in the Manchester Ranger District,
National Soil Health Initiative
 National Soil Health Initiative Ensuring Sustainable Agriculture for the Future USDA is an equal opportunity provider and employer. Words from Former NRCS Chief Dave White soil is one of our most important
Focus on Financial Resources. Kristin Lambert, WI DNR Chris Miller, NRCS
 Focus on Financial Resources Kristin Lambert, WI DNR Chris Miller, NRCS USDA FOREST PROGRAMS CHRIS MILLER SAUK COUNTY DISTRICT CONSERVATIONIST Environmental Quality Incentive Program (EQIP) Initially created
Environmental Resource Inventories. What are ERIs? Significance of information How to use them
 Environmental Resource Inventories What are ERIs? Significance of information How to use them Environmental Resource Inventory - ERI Compiled by the environmental commission Information about the natural
1.2 REGULATORY REQUIREMENTS
 Table 1.1. Soil textural classes and general terminology used in soil descriptions (Source: US Environmental Protection Agency 1977). Name Texture Basic soil textural common class names Sandy soils Coarse
DECISION MEMO 4-H Tree Farm LLC Driveway Permit
 DECISION MEMO 4-H Tree Farm LLC Driveway Permit I. DECISION USDA Forest Service, Eastern Region, Hoosier National Forest Tell City Ranger District Perry County, Indiana T73S, R2W, SESE Section 36 A. Description
Chapter 10 Natural Environment
 Chapter 10 Natural Environment Existing Conditions The Natural Environment Element addresses the protection, conservation, preservation, and restoration of the natural resources the Bayview Ridge Subarea,
Appendix D. Land Evaluation Site Assessment System
 Appendix D Land Evaluation Site Assessment System Town of Dewey Comprehensive Plan 2009 PORTAGE COUNTY S LAND EVALUATION SITE ASSESSMENT SYSTEM A tool to help local communities understand the agricultural
On/Off periods Improvements Grazing System. 2 fence segments. 1 water development, 2 cattle guards
 DECISION NOTICE HENRY CREEK AND SWAMP CREEK RANGE ALLOTMENT MANAGEMENT PLANS REVISION U.S. FOREST SERVICE PLAINS/THOMPSON FALLS RANGER DISTRICT LOLO NATIONAL FOREST SANDERS COUNTY, MONTANA DECISION Based