EEOS Guidance To Authenticate Claim Energy Credits_V2
|
|
|
- Crystal Parsons
- 6 years ago
- Views:
Transcription


1


2
3
4
5 1.1 Overview 1.2 Principles for Quantifying Energy Savings
6 1.3 SEAI Quality Framework 1.4 Process 1 IPMVP Chapter 3 Principles of M&V.
7 1.5 Completing an NREC Application
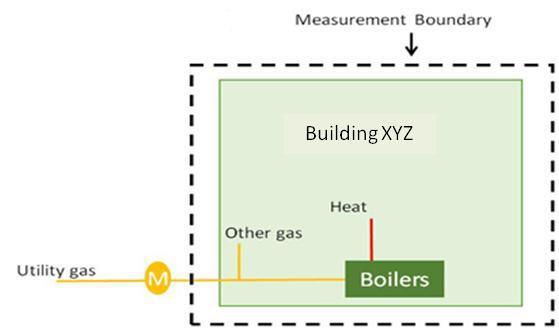
8 Fig. 1.1 Process for quantifying and claiming energy credits Identify Project Identify project and confirm it is a genuine energy efficiency improvement measure. Agree with the Host how the OP can provide a demonstrably material contribution to the EEIM identified. Refer to SEAI guidance document Energy Efficiency Obligation Scheme Ireland for definitions. Conduct preliminary calculations of the likely scale of energy savings to be done by a competent professional. M&V or Eng. Calcs? Evaluate how each project in an NREC application would be measured and verified and how difficult M&V would be. Consider the measurement boundary and what metering and baseline information is available. Use the derogation decision tree to evaluate options for M&V or engineering calculations. Refer to section 2 for derogation tree. Based on above, select NREC applications and sub-projects for M&V and/or engineering calculations. Engineering Calculations For NRECs/sub-projects requiring Eng. Calcs., prepare these using spreadsheet or calculation tool. Engineering calculations must be transparent and easy to follow. Ensure all assumptions are clearly identified. Refer to section 4 for guidance. M&V Plan(s) Final/Prelim. M&V Report For NRECs/sub-projects requiring M&V, prepare an M&V Plan(s). Gather the necessary information and specify any additional metering/measurement devices or recordings that are required. Refer to Section 3 for more guidance. After the project is complete & fully commissioned the reporting period can commence. A final M&V report must be completed at the end of the reporting period. This must calculate the savings according to the M&V plan. If claiming energy credits before the end of the reporting period, a preliminary M&V report must be completed. This will predict annual energy savings based on the EEIM performance over a limited time frame and must provide a conservative outcome. A final M&V report must be completed subsequently. NREC Application Prepare Synopsis M&V Plan and Report for inclusion in NREC form. Refer to section 6 for guidance. Complete using the annual energy savings outputs from the engineering calculations or the full/preliminary M&V report. Fill out the NREC application form online and submit to the Project Evaluation Platform (PEP) to claim energy credits. It is incumbent on the OP to ensure their own quality procedures are in place and that all savings stated are real and the NREC application form has been completed in full. Award of Credits Final M&V Report SEAI review the NREC applications and posts to the Energy Credit Management System (ECMS). The OP can check on the PEP if the energy credits have been awarded. If a preliminary M&V report was completed for the purposes of claiming credits before the end of the reporting period the OP is still obliged to complete a final M&V report and keep on file. If there is a significant discrepancy between the preliminary and final M&V report the OP must inform the SEAI. If the Preliminary Report understated savings, the additional verified savings may be claimed. Note: This step does not apply to engineering calculations. Audit The SEAI reserves the right to audit any NREC that has been submitted, including supporting documentation, and the OP must ensure that all M&V records and/or engineering calculations are retained.
9 2.1 Introduction 2.2 Derogation for Projects Employing Specific Well-Proven Technologies 2.3 Derogation for Smaller Scale NREC Applications and Sub-Projects 2 A PDF version of Figures 2.1 and 2.2 are available in A3 size for download from the SEAI website.
10 Figure Derogation Decision Tree EEOS Guidance To Authenticate Claim Energy Credits_V2

11 Figure Derogation Decision Tree Worked Example EEOS Guidance To Authenticate Claim Energy Credits_V2
12 2.4 Conservative Defaults Table 2.1 Conservative Defaults
13 3.1 Cover Page 3.2 M&V Plan Energy Efficiency Improvement Measure Intent
14 3.2.2 Selected M&V Approach 3 Referred to in IPMVP as Option A.
15 o o o o o o
16 M&V Approach by Organisations with ISO50001 EEOS Guidance To Authenticate Claim Energy Credits_V2
17 Start Whole Facility Approach Yes Clear and persistent downward trend in whole facility EnPI? No SEU Approach M&V Whole Facility improvement in EnPI against EnB No M&V Whole Facility change in EnPI against EnB Identify EEIMs projects, energy management, energy awareness M&V using other M&V methods Identify EEIMs for SEUs projects, energy management, energy awareness Conduct Engineering Calculations of project-based EEIMs M&V selected SEU improvements in EnPIs against EnBs Document gap between M&V of whole facility savings and Engineering calculations of project-based EEIMs Document gap between M&V of SEU energy savings and whole facility change Claim credits based on whole facility improvement in EnPI Claim credits based on aggregate SEU improvements in EnPIs Measurement boundary / M&V Boundaries


18 3.2.4 Baseline Period 4 IPMVP Vol states The baseline period should be established to represent all operating modes of the facility. This period should span a full operating cycle from maximum energy use to minimum. It also provides further guidance on this topic.
19 Dealing with insufficient baseline data
20
21 kwh of Gas kwh of Light Fuel Oil Baseline Analysis - Old Oil Boiler Delivery Invoices Conversion factors Value Source Date Litres* kwh DD** Litres to kwh (GCV) SEAI - Comparison of Energy Costs Jul 15 - Kerosene 17/09/ , ,690 02/12/ , , ,000 30/04/ , ,460 1, ,000 y = x R² = 1 400,000 * The client has stated the tank was filled every time oil was delivered **DD between delivery dates - source degreedays.net deg C base 300, ,000 Number of days between regression points , ,000 1,200 1,400 DD Experienced Between Deliveries Date Gas used (m 3 )* GCV of gas (kwh/m 3 )** kwh DD(degreeday s.net-15.5 o C base) Sep-14 1, , Oct-14 3, , Nov-14 5, , Dec-14 7, , Jan-15 8, , Feb-15 6, , Mar-15 7, , Apr-15 5, , May-15 4, , Jun-15 2, , Jul-15 1, , Reporting Period Analysis - New Gas Boiler Aug-15 1, , * New gas meter logged on BMS - diaphram meter, sized for expected gas flow range Total 55, ,736 2,313 ** Source utility bills 100,000 80,000 60,000 40,000 20,000 Calculation of Savings - y = x R² = DD The correlation between DD and gas use has proven to be strong according to regression analysis done on new gas boiler, with an R 2 value of By using the regression curve of the new gas boiler, it is possible to estimate how much gas the new gas boiler would have used in the baseline year The below table calculates how much gas the new gas boiler would have used if it was installed during the baseline year by using the formula xDD DD(degreeda ys.net Predicted gas boiler usage (kwh) Date o C base) Sep ,207 Annualised oil boiler consumption calculation Oct ,883 Regression formula over 149 days of operation is x DD Nov ,272 Formula to calculate oil use over a year* x annual DD + (18016/149)x365 Dec ,796 Annual DD during Baseline year 2061 Jan ,443 Annualised oil usage in baseline year (kwh) 787,268 Feb ,262 Mar ,529 Predicted gas usage during baseline year (kwh) 551,329 Apr ,482 May ,349 Savings from new gas boiler installation (kwh) 235,939 Jun ,017 Jul ,341 Aug ,750 *Non space heating portion of heat use deemed constant as per Reporting Period regression Total 2, ,329
22
23 Measured Parameters Recorded During Commissioning % fan speed 40% 50% 60% 70% 80% 90% *100% Comments Fan Power Consumption (kw) Measured using RMS power analyser Measured air volume rate (m3/s) Calculated using a matrix of duct velocity readings taken by a hot wire anemometer Logged and Calculated Parameters During Reporting Period % fan speed 40% 50% 60% 70% 80% 90% *100% Comments Amount of hrs spend at fan speed 3, ,080 1, Logged on the BMS via a modbus VSD interface Heat used at different fan speeds (kwh) 50,000 10,000 22,000 18,000 89, , ,000 BMS logs delta T of the air across the coil on a 15 min basis. This is multiplied by air volume recorded at each fan speed x hrs at that speed x density of air x specific heat capacity of air Calculation of Energy Savings % fan speed 40% 50% 60% 70% 80% 90% Total Savings Comments Electrical fan power savings (kwh) 57,380 7,374 13,608 14,331 4,740 3, ,624 Example of savings calculation at 40% speed = [(16.1-1) x 3,800] Thermal savings (kwh) 72,581 9,740 14,348 7,570 21,885 14, ,412 Example of savings calculation at 40% speed = [((50,000/6.2) x 15.2) - 50,000] Gas savings (kwh GCV) 90,726 12,175 17,935 9,463 27,357 17, ,515 Gas savings = Thermal Savings / Boiler Efficiency (80%) Assumptions and Notes * At 100% fan speed the energy use by the AHU is the same as if there was no VSD installed. Savings are measured against this. Density of air kg/m3 Specific heat capacity kj/kg o C Boiler measured seasonal efficiency 80% Heat out and gas in are measured in the boilerhouse during reporting period (based on GCV)
24 3.2.5 Reporting Period Normalised Savings or Avoided Energy Use
25 3.2.7 Analysis Procedure
26 3.2.8 Meter Specification
27 3.2.9 Persistence of Savings Expected Accuracy 3.3 Preliminary and Final M&V Report Preliminary M&V Report
28 3.3.2 M&V Report Format o o o o o o o o o o
29 4.1 General 4.2 Standard Calculation Tools SEAI Calculation Tools SBEM Other Calculation Tools 4.3 Bespoke Calculations
30 o o o o o o o o
31 4.4 Examples Lighting with controls Sample Engineering Calculation - Light fitting replacement and occupancy controls Status Fitting Type Area of Use Load Hours Electricity Notes Lamp load Ballast No. Total Annual Control Total (Total hrs x per fitting losses (ref Fittings Load kw Switched Factor Hours Total load) Watts App C) hrs kwh p.a. Pre EEIM Twin 58W T8 fitting with electro-magnetic control gear Cellular offices and meeting rooms Post EEIM Twin 70W T5 fittings Cellular offices with electronic control and meeting gear (philips model xyz) rooms Example - Boiler Upgrade, No Measured Data Boiler characteristics Source / Assumption Existing Old Brittania abc Capacity kw 500 Nameplate Rated efficiency gcv 80% Nameplate Proposed Rendamax xyz Capacity kw 450 Datasheet Rated efficiency 80/60 90% Datasheet % , % ,862 Fitting load based on lamp wattage + assumed 15% control gear loss. Fittings on 12 hours/day, 5 days/week, 52 weeks/year 70 0% ,120 75% ,321 Light fitting data sheet attached. 5 fittings in unoccupied spaces manually switched off and 'switch off' notices put at the switches. Occupancy control factor assumed based on observed activity over a normal working day. As this is an Eng. Calc. measurement of occupancy patterens is not required. Saving 76,541 Building Energy Use Option i: Measured use over 12 months, e.g. oil deliveries (Best) Option ii: Peak load x Equivalent full load hours calculation (OK) No data available Selected Option ii: Peak load x Equivalent full load hours calculation Method adapted from Oughton,D.R., and Hodkinson,S. (2002) Faber and Kell's Building peak heating load 405 kw Calcs used to size new boiler. Heating degree days 2063 kwh/m2 p.a. Dublin Airport, 15.5degC, Sep-May Temperature rise due to internal heat gains 3 degc Faber&Kell's Table 23.5 Factors relating building characteristics to inside and outside design temp 1.22 Faber&Kell's Table 23.6 Factor for intermittent use over 5 days of slow response system in heavy buil 0.81 Faber&Kell's Table 23.7 Factor for occupation over 12 hours in heavy building 1.03 Faber&Kell's Table 23.8 Equivalent full load hours 2,100 hrs Calculated Annual heat load 850,426 kwh Calculated Savings Existing fuel use 1,063,032 kwh Annual Heat Load/Exisitng Boiler Eff Proposed fuel use 944,917 kwh Annual Heat Load/Proposed Boiler Eff Calculated savings 118,115 kwh By subtraction
32
33 6.1 General 6.2 Contents of Synopsis M&V Plan and Report
34 6.3 ISO50001 Synopsis M&V Plan & Report Template
35
36 Measurement Boundary no.1 Utility Elec Utility Gas M M Distribution Board Boilers M M M Gas in Elec out Heat out CHP Measurement Boundary no.2
37
38
39 A.1 Lighting Upgrade with Occupancy Controls and Daylight Dimming EEOS Guidance To Authenticate Claim Energy Credits_V2
40 6 Note: this additional thermal energy must be subtracted from the avoided energy once the final to primary energy conversion has taken place. This is then the total Primary Energy Savings figure.
41 No. of lamp lamp wattage ballast annual Avg. Monthly failures (W) losses burn hours kwh kwh Adjustment % 3,500 26,847 2,237
42 A.2 Numerous EEIMs conducted within a facility including CHP 3.
43
44 Electricity kwh a Baseline Period Electricity Use (based on matching dates) 866,250 b Predicted Facility Electricity Use (a adjusted to reporting period conditions) 909,563 c Reporting Period Utility Electricity Use 464,563 d Reporting Period CHP Electrical Output 337,500 e Reporting Period Facility Electricity Use (c + d, compare with a and b) 802,063 f Reporting Period Avoided Electricity Use (b e) 107,500 g Annualised Avoided Electricity Use (more conservative outcome of 2 methods) 213,537 h Annualised Avoided Electricity Use in Primary Energy (g x 2.5) 533,844 Gas kwh a Baseline Period Gas Use(based on matching dates) 902,450 b Predicted Hotel Gas Use (a adjusted to reporting period conditions) 812,205 c Reporting Period Gas Use 1,078,125 d Reporting Period CHP Gas Use 843,750 e Reporting Period CHP Heat Used/Consumed 306,000 f Baseline Period Boiler Seasonal Efficiency 70% g Reporting Period Avoided Boiler Gas (e / f) 437,143 h Reporting Period Facility Gas Use (c d + g) 671,518 i Reporting Period Avoided Gas Use During (b h) 140,687 j Annualised Avoided Gas Use (more conservative outcome of 2 methods) 292,629 Annualised Avoided Gas Use in Primary Energy (g x 1.0) 292,629 CHP kwh a Reporting Period Gas Use (based on NCV of fuel) 843,750 b Reporting Period Electricity Generated 337,500 c Reporting Period Heat Used/Consumed 306,000 d Electrical Efficiency (b / a) 40.0% e Thermal Efficiency (c / a) 36.3% f Primary Energy Saved % (From CER calculator) 21.81% g Reporting Period Primary Energy Saved 183,997 h Annualised Primary Energy Saved 382,714 i Annualised Secondary Electricity Savings [(d/(d+e)*h)/2.5] 80,290 j Annualised Secondary Gas Savings [(e/(d+e)*h)/1] 181,990 Secondary Energy (kwh) Primary Energy EEIM Electricity Gas kwh Boiler and Lighting Upgrade 213, , ,473 CHP 80, , ,714 Total 293, ,619 1,209,187
45
46 Table B.1 Fuel Coal L.P.G. Unit of Supply Gross Cv (kwh/unit) Form Industrial Fines Tonne 7,759.2 Standard coal Tonne 7,900 Commercial Cylinders kg Bulk L.P.G. Litre 7.09 Networked Natural Gas 1 Grid Supply m Gas Oil Litre Kerosene Litre Oil Light Fuel Oil Litre Medium Fuel Oil Litre Heavy Fuel Oil Litre Peat Briquettes, baled Bale 67 Wood Fuel Chips (35% moisture) kg wet 3.2 Pellets kg 4.8
47 Percentage Increase Multiplier Applicable lamp types 0% 1.00 Electronic control gear T8,T5, PL, 2D =, SOX; Induction; LED 5% 1.05 Electro-magnetic Mercury Vapour; SON and Methal Halide > or = 400W 10% 1.10 Electro-magnetic SON and Metal Halide < 400W 15% 1.15 Electro-magnetic T8 and T12 20% 1.20 Electro-magnetic SOX 25% 1.25 Electro-magnetic PL, 2D
48 D.1 ISO50001 Synopsis M&V Plan and Report Example Campus ABC Measurement Period Energy Relevant Variable Energy Performance Indicator [kwh/sq.m.] Year Electricity [kwh] Gas [kwh] DD Corrected Gas Primary Energy (DD corrected) TUFA [sq.m.] Elec Gas (DD corrected) 2012 Baseline 24,261,904 54,854,528 54,871, ,526, , ,786,180 55,357,781 53,273, ,739, , ,405,754 50,325,255 52,486, ,000, ,


 Electricity Gas Unit Avoided Energy")


49 2. Calculation of Energy Performance Related Savings Adjusted Baseline Energy Electricity Gas Unit Baseline En.PI kwh/m2 Reporting Period TUFA 140, ,100 m2 Adj. Baseline Energy 24,298,325 54,954,131 kwh Avoided Energy Use Electricity Gas Unit Adj. Baseline Energy 24,298,325 54,954,131 kwh Reporting Period Energy 23,405,754 52,486,258 kwh Avoided Energy Use 892,571 2,467,873 kwh 3. Calculation of 2014 Savings (Credits) Electricity Gas Unit Avoided Energy Use 892,571 2,467,873 kwh Less 2013 Savings Claimed 475,724 1,598,207 kwh 2014 Energy Savings 416, ,666 kwh Primary Energy Savings 1,911,785 kwh 4. Distribution of Savings 2014 Energy Savings 1,911,785 kwh 2014 Project Savings (Calc.) 758,500 kwh (see note) 40% Savings from other EEIMs 1,153,285 kwh 60% Note: project savings may only have applied for part of year, but calc is for annual savings
50 D.2 ISO50001 NREC Application Example
51
52
53
54 EEOS Guidance To Authenticate Claim Energy Credits_V2


55
56
57
58
59
M&V Practitioner check list for M&V Report on Intelligent Boiler Load Optimisation (e.g. M2G or similar technology)
") M&V Practitioner check list for M&V Report on Intelligent Boiler Load Optimisation (e.g. M2G or similar technology) Participating Energy Supplier Project Number Project Start Date Project Completion Date
M&V Practitioner check list for M&V Report on Intelligent Boiler Load Optimisation (e.g. M2G or similar technology) Participating Energy Supplier Project Number Project Start Date Project Completion Date
M&V Fundamentals & the International Performance Measurement and Verification Protocol
 M&V Fundamentals & the International Performance Measurement and Verification Protocol What is M&V? Measurement & Verification (M&V) is the process of using measurements to reliably determine actual saving
Carbon Reduction and Energy Optimization Strategy for one NHS Trust
 Carbon Reduction and Energy Optimization Strategy for one NHS Trust Dr Issa Chaer, BEng, CEng, PhD, F.Inst. R., M.CIBSE, London South Bank University Mr Ehsan Sattar, BEng, MSc, IEng ACIBSE Royal Marsden
Project Measurement and Verification Procedures
 Project and Verification Procedures 1) Introduction The objective of measurement and verification (M&V) activities at the Project level is to confirm that the Measures that are supported by the Retrofit
Giuseppe Giordano Founder & CEO
 Giuseppe Giordano Founder & CEO www.enerbrain.com 1 Your innovation partner for a sustainable future 40% of the world s energy is consumed by buildings US Green Building Council and yet, how often have
ENERGY. Fuel Used Amount Unit Emissions Factor. Energy Home Energy Reduction
 Energy Home Energy Reduction A CCF project is offering energy efficiency advice to householders. Each householder is asked what their yearly gas and electricity consumption is during the energy advisor
Reducing Peak Energy Demand: The Hidden Benefit of Cool Roofs
 Reducing Peak Energy Demand: The Hidden Benefit of Cool Roofs Dr. James L. Hoff, DBA, TEGNOS Research, Inc., Keith Gere and Robert Carnick, Duro-Last Inc. November 11, 2014 MW Peak Energy Demand 30,000
ENERGY AUDIT. 123 Main Street Mississauga, Ontario. January 1, Report To: Mr. John Smith Smith Printing Company.
 Report To: Mr. John Smith Smith Printing Company ENERGY AUDIT 123 Main Street Mississauga, Ontario January 1, 2009 120 Carlton Street, Suite 212 Toronto, Ontario M5A 4K2 Tel 416-964-3246 Toll Free 1-866-964-3246
CHP Case Studies. Midwest CHP Application Center (MAC) .org (312) University of Illinois at Chicago Energy Resources Center UIC
 .org (312) University of Illinois at Chicago Energy Resources Center UIC") CHP Case Studies Midwest CHP Application Center (MAC) www.chpcentermw.org.org (312)413-5448 University of Illinois at Chicago Energy Resources Center CHP Case Studies Elgin Community College Presbyterian
CHP Case Studies Midwest CHP Application Center (MAC) www.chpcentermw.org.org (312)413-5448 University of Illinois at Chicago Energy Resources Center CHP Case Studies Elgin Community College Presbyterian
BEYOND O&M. Shawn Maurer SEDAC Building Energy Specialist. Smart Energy Design Assistance Center (SEDAC), University of Illinois at Urbana Champaign
, University of Illinois at Urbana Champaign") BEYOND O&M Shawn Maurer SEDAC Building Specialist Smart Design Assistance Center (SEDAC), University of Illinois at Urbana Champaign PRESENTATION OVERVIEW and Take away: Regular costs less over the long
BEYOND O&M Shawn Maurer SEDAC Building Specialist Smart Design Assistance Center (SEDAC), University of Illinois at Urbana Champaign PRESENTATION OVERVIEW and Take away: Regular costs less over the long
Optimizing Energy Use in a HealthCare Setting. Michael P. Della Barba Environmental Health & Engineering, Director of Commissioning
 Optimizing Energy Use in a HealthCare Setting Michael P. Della Barba Environmental Health & Engineering, Director of Commissioning AIA Quality Assurance The Building Commissioning Association is a Registered
Results and Recommendations from Energy Audit of Shageluk. For VEEP Grants Village of Shageluk, Alaska
 ENERGY AUDIT POST INSTALLATION REPORT Results and Recommendations from Energy Audit of Shageluk For VEEP Grants Village of Shageluk, Alaska June 21, 2012 Prepared By:, Inc. 6643 Brayton Drive Anchorage,
Airport Carbon Accreditation An Airport Experience. Martin Doherty, Environmental Manager, daa ACI NA Conference, Baltimore 16 th April 2014
 Airport Carbon Accreditation An Airport Experience Martin Doherty, Environmental Manager, daa ACI NA Conference, Baltimore 16 th April 2014 A bit about daa CONTENT Why did daa join Airport Carbon Accreditation
Electric Forward Market Report
 Mar-01 Mar-02 Jun-02 Sep-02 Dec-02 Mar-03 Jun-03 Sep-03 Dec-03 Mar-04 Jun-04 Sep-04 Dec-04 Mar-05 May-05 Aug-05 Nov-05 Feb-06 Jun-06 Sep-06 Dec-06 Mar-07 Jun-07 Sep-07 Dec-07 Apr-08 Jun-08 Sep-08 Dec-08
135** Our incredible electricity welcome offer PLUS. Great discounts on your home electricity. Switch and we ll give you. sseairtricity.
 Our incredible electricity welcome offer Switch and we ll give you 135** PLUS Great discounts on your home electricity 100% GREEN ENERGY 1850 40 40 88 sseairtricity.com Choose your offer, your way... Option
Urban Greening and the UHI: Seasonal Trade-offs in Heating and Cooling Energy Consumption in Manchester, UK
 Urban Greening and the UHI: Seasonal Trade-offs in Heating and Cooling Energy Consumption in Manchester, UK T H E R E S E A R C H E R S C y n t h i a S k e l h o r n PhD Physical Geography Post-Doctoral
Pharmaceutical Sustainability Initiatives
 Pharmaceutical Sustainability Initiatives Duane Hagen, CEA Energy and Systems Optimization Steam and Condensate System Specialist Technical Training Instructor Primary Energy Sources Conversion of Energy
Introduction and purpose of this meeting. A New Day in Energy Management
 Introduction and purpose of this meeting A New Day in Energy Management Facilitator Names UNIDO International Energy Efficiency Experts Location Date Would you allow this man to make a $500 purchase on
PU-BENEFS PU-BENEFS. Feasibility study report. Bridge Park Community Leisure Centre At Brentfield, Harrow Road London NW10 0RG Country: United Kingdom
 Feasibility study report Bridge Park Community Leisure Centre At Brentfield, Harrow Road London NW10 0RG Country: United Kingdom Contact : Dr Crispin D Webber Name of project partner : North East London
Energy Modeling Applications for Existing Buildings
 Energy Modeling Applications for Existing Buildings Presented by: Clark Denson PE, CEM, BEMP, LEED AP BD+C 4/27/12 Learning Objectives 1. List available methods and tools for energy modeling 2. Explain
YWCA 1503 S. Denver Tulsa, Oklahoma 5/18/2010 Performed By
 Energy Audit for YWCA 1503 S. Denver Tulsa, Oklahoma 5/18/2010 Performed By 220 E. 8th Street Tulsa, Oklahoma 74119 918-582.0229 Fax: 918.599.0665 www.craftontullsparks.com Table of Contents Cover Page...
Carbon Footprint Analysis of Hotels in Hong Kong
 Seminar: Carbon Footprint Analysis of Hotels in Hong Kong Funded by: Environment and Conservation Fund, HKSAR Study team: Joseph Lai, Francis Yik, Michael Liu Department of Building Services Engineering,
Administration Division Public Works Department Anchorage: Performance. Value. Results.
 Administration Division Anchorage: Performance. Value. Results. Mission Provide administrative, budgetary, fiscal, and personnel support to ensure departmental compliance with Municipal policies and procedures,
Sustaining Our Buildings & Grounds
 Sustaining Our Buildings & Grounds The Next 100 Years University of Alberta June 1 3 2008 Located Edmonton Alberta 3rd largest University in Canada 32,000 undergrads 6,000 grad students 13.9 million sq.
9/13/2011. Mark Hanicits, Director of Facilities and Safety, MetroSouth Medical Center. Terry Malloy P.E., Cxa, Project Manager, Teng & Associates
 Mark Hanicits, Director of Facilities and Safety, MetroSouth Medical Center September 21 st, 2011 4:15pm 5:15pm Terry Malloy P.E., Cxa, Project Manager, Teng & Associates Energy consumption (BTU/SF) in
LIBRARY ENERGY WALK- THROUGH. Andy Robinson, Training and Education, SEDAC
 LIBRARY ENERGY WALK- THROUGH Andy Robinson, Training and Education, SEDAC ILLINOIS ENERGY NOW University of Illinois 360 Energy Group 2 WHAT WE DO SEDAC Free Services Outreach and Training Energy Assistance
Roof mounted solar panels on Bldg L, Verde Valley Campus. 1. One developed Acre can produce approx 100 KW of peak solar power.
 SOLAR OPPORTUNITIES Roof mounted solar panels on Bldg L, Verde Valley Campus There is a growing national commitment to the utilization of sustainable energy sources. Solar, wind, and bio- mass systems
Union College Combined Cooling, Heat and Power Project
 Union College Combined Cooling, Heat and Power Project Presented by: Mark Donovan, PE Union College, Assistant Director of Utilities Aaron Bolhous, PEng CHA, Project Engineer Agenda Introduction to Union
Feasibility Study. Solar plant with district heating net (Austria)
") Feasibility Study Solar plant with district heating net (Austria) Elaborated by DI Horst Strießnig DI Philip Ohnewein Graz, October 2006 nahwaerme.at Energiecontracting GmbH & Co KG Herrgottwiesgasse 188
Feasibility Study Solar plant with district heating net (Austria) Elaborated by DI Horst Strießnig DI Philip Ohnewein Graz, October 2006 nahwaerme.at Energiecontracting GmbH & Co KG Herrgottwiesgasse 188
Premium Sample Reports
 Premium Sample Reports Under the WegoWise Premium subscription, we deliver the following reports in pdf format to present actionable information and answers to common questions property managers and owners
One year in the Colourworks
 One year in the Colourworks Arcola Theatre-Energy Report April 2011-March 2012 April 2012 0 Contents Executive Summary...2 Timeline...3 Electricity...5 Heating...8 Water...10 Waste...10 Conclusion...11
Establishing a Baseline, Energy Audits and Energy Star s Portfolio Manager
 Establishing a Baseline, Energy Audits and Energy Star s Portfolio Manager Glenn Barnes Environmental Finance Center University of North Carolina at Chapel Hill 919-962-2789 glennbarnes@sog.unc.edu Energy
Disaggregating Electric Loads Without Metering Them
 D2: Metering and Data Information Systems Disaggregating Electric Loads Without Metering Them Sept. 26, 2013 Lindsay Audin, Energywiz Inc. www.energywiz.com To your energy analysis toolbox, add automated
PI as a Utility- Scale PV Monitoring Platform
 PI as a Utility- Scale PV Monitoring Platform Presented by Steve Hanawalt, President Outline State of the Market Issues and Challenges Potential Solutions Benefits Summary and Q&A 2 Outline State of the
Energy Management System ISO By: Eng. Fadi Al Shihabi Senior Manager Ernst & Young BEP, CEM,CRM
 Energy Management System ISO 50001-2011 By: Eng. Fadi Al Shihabi Senior Manager Ernst & Young BEP, CEM,CRM Page 2 Energy Futures Market Energy Efficiency Certificate Energy Subsidy Renewable Energy Certificate
Procurement Summary Company Y.
 Procurement Summary Company Y. Date: 1 st April 2014 - Draft SmartPower was asked by Company Y to assist the facilities team in procuring energy for the upcoming year. This report summarises the offers
Farm Energy Efficiency June Collin Macpherson - JCM Solutions
 Farm Energy Efficiency June 2016 Collin Macpherson - JCM Solutions Presentation Overview About JCM Solutions NSW Government Energy Efficiency Support Why bother with Energy Efficiency? Where to start?
Success with MEASUREMENT & VERIFICATION
 2016 Success with MEASUREMENT & VERIFICATION Prepared for the North Carolina Department of Environmental Quality. Project funded by the U.S. Department of Energy, Office of Energy Efficiency and Renewable
METHODOLOGY The process starts with a collection of available information, continued by an audit in loco, it is
 Seventh International IBPSA Conference Rio de Janeiro, Brazil August 13-15, 2001 METHODOLOGY FOR BUILDING MODELLING AND CALIBRATION FOR WARM CLIMATES A. Pedrini* and R. Lamberts** *Dept. of Architecture,
BB&E GREENHOUSE GAS EMISSIONS INVENTORY. Prepared For: General Services Administration (GSA) Joint Base Andrews, Maryland.
 Joint Base Andrews, Maryland.") BB&E GREENHOUSE GAS EMISSIONS INVENTORY Prepared For: General Services Administration (GSA) Joint Base Andrews, Maryland Prepared By: BB&E, Inc. July 2014 This Greenhouse Gas (GHG) Emissions Inventory
BB&E GREENHOUSE GAS EMISSIONS INVENTORY Prepared For: General Services Administration (GSA) Joint Base Andrews, Maryland Prepared By: BB&E, Inc. July 2014 This Greenhouse Gas (GHG) Emissions Inventory
Performance Evaluation of Solar Parabolic Trough for Cloths Laundry application
 Performance Evaluation of Solar Parabolic Trough for Cloths Laundry application Shubham Gupta*, Prof. R. S. Mishra Department of Mechanical Engineering Delhi Technological University, Delhi-110042. guptashubham@outlook.in,
Energy Management with HOCHTIEF simply efficient.
 Energy Management with simply efficient. Part 1: Services and Benefits Part 2: Company Part 3: References Part 4: Partnership with Ants have found the way: Efficient energy perfect workflow. Business Company
Advantages of Financing Continuous Commissioning As An Energy Conservation Retrofit Measure
 Advantages of Financing Continuous Commissioning As An Energy Conservation Retrofit Measure Guanghua Wei, P.E. Malcolm Verdict, C.E.M Joseph T. Martinez Energy Systems Laboratory, 3581 TAMU Texas A&M University
Achieving a cost optimal balance between heat supply efficiency and moderation of demand
 Achieving a cost optimal balance between heat supply efficiency and moderation of demand Dr. Christian Friebe Thüga Aktiengesellschaft COGEN Europe, 25th of February 560 cities and towns, 100 companies
ENERGY EFFICIENT RETROFIT OF A HIGH-RISE MULTIFAMILY BUILDING
 ENERGY EFFICIENT RETROFIT OF A HIGH-RISE MULTIFAMILY BUILDING Brittany Hanam 1, Lorne Ricketts 2, Andrew Pape-Salmon 3 ABSTRACT The National Institute of Building Sciences estimates that over 70% of the
Effect of electricity tariffs and cooling technologies on dairy farm electricity consumption, related costs and greenhouse gas emissions
 Ref: C0138 Effect of electricity tariffs and cooling technologies on dairy farm electricity consumption, related costs and greenhouse gas emissions John Upton and Laurence Shalloo, Animal and Grassland
Final 2014 Flexible Capacity Needs Assessment
 Final 2014 Flexible Capacity Needs Assessment May 1, 2014 Table of Contents 1. Introduction... 2 2. Summary... 2 3. Defining the ISO System-Wide Flexible Capacity Need... 3 4. Forecasting Minute-by-Minute
Up to. off. our standard unit rate. electricity. Sales sseairtricity.com
 Up to 7 %* off our standard unit rate electricity Sales 0345 601 4321 sseairtricity.com Switch today! 24 Hr Home (Pence /kwh) 1 Year Home / 1 year fixed term contract 24hr meter Credit SSE Airtricity Standard
EDEM detail description part 1: inputs and outputs
 EDEM detailed description: Part 1 - inputs and outputs. Summary EDEM is a flexible approach to mapping the possible building carbon and energy performance universe in terms of a matrix of simulation models.
CHP Economic Factors: Electric and Natural Gas Market Trends PREPARED BY: PREPARED FOR: DATE:
 CHP Economic Factors: Electric and Natural Gas Market Trends PREPARED BY: PREPARED FOR: DATE: Daniel Peaco, Principal Consultant Efficiency Maine Combined Heat & Power Conference SEPTEMBER 29, 2016 Discussion
Energy Efficiency Obligations Scheme Inogate Study Tour. 18 th June 2015
 Energy Efficiency Obligations Scheme Inogate Study Tour 18 th June 2015 Energy Efficiency Directive - (very) brief synopsis Art. 1 - promotion of energy efficiency to ensure the achievement of the 20%
Implications of Measured Commercial Building Loads on Geothermal System Sizing
 Implications of Measured Commercial Building Loads on Geothermal System Sizing ASHRAE Annual Meeting June 23, 1999 Hugh I Henderson, Jr.. P.E. CDH Energy Corp. Cazenovia,, NY www.cdhenergy.com Overview
Final Flexible Capacity Needs Assessment for 2016
 Final Flexible Capacity Needs Assessment for 2016 May 1, 2015 1 Table of Contents 1. Introduction... 3 2. Summary... 3 3. Defining the ISO System-Wide Flexible Capacity Need... 5 4. Forecasting Minute-by-Minute
Results and Recommendations from Energy Audit of Koyukuk. For VEEP Grants. City of Koyukuk, Alaska
 ENERGY AUDIT POST INSTALLATION REPORT Results and Recommendations from Energy Audit of Koyukuk For VEEP Grants City of Koyukuk, Alaska June 20, 2012 Prepared By:, Inc. 6643 Brayton Drive Anchorage, AK
Heating the University of Glasgow with river sourced heat pumps. Adam McConkey Andrew Poon-King Zhibin Yu
 Heating the University of Glasgow with river sourced heat pumps Adam McConkey Andrew Poon-King Zhibin Yu Opportunity - Reduce Glasgow University s 1.9 m gas bill - The University is set to upgrade its
Leveraging Smart Meter Data & Expanding Services BY ELLEN FRANCONI, PH.D., BEMP, MEMBER ASHRAE; DAVID JUMP, PH.D., P.E.
 ASHRAE www.ashrae.org. Used with permission from ASHRAE Journal. This article may not be copied nor distributed in either paper or digital form without ASHRAE s permission. For more information about ASHRAE,
Strategic Cost Management in Black Tea Processing
 Strategic Cost Management in Black Tea Processing Dr W S Botheju, Head Process Technology Division Te a Re se arch Institute of S ri Lank a Background Quality consumer demand driven Good Quality Tea better
Energy Efficiency Obligation Scheme. Joe Durkan SEAI 22/08/2017.
 Energy Efficiency Obligation Scheme Joe Durkan SEAI 22/08/2017 www.seai.ie Overview of Ireland s EEOS Transposition of EED Article 7 of EED transposed into Irish legislation (SI 131 2014) (http://www.seai.ie/eeos/si-131-of-2014.pdf)
ENERGY STORAGE HANNOVER MESSE TECHNICAL FORUM ITM POWER DESIGNS AND MANUFACTURES HYDROGEN ENERGY SYSTEMS FOR ENERGY STORAGE AND CLEAN FUEL PRODUCTION
 ENERGY STORAGE HANNOVER MESSE TECHNICAL FORUM ITM POWER DESIGNS AND MANUFACTURES HYDROGEN ENERGY SYSTEMS FOR ENERGY STORAGE AND CLEAN FUEL PRODUCTION ENERGY STORAGE HANNOVER MESSE TECHNICAL FORUM Contents
Solar Power Realities
 Solar Power Realities Supply-Demand Characteristics, Storage and Capital Costs by Peter Lang Abstract This paper provides a simple analysis of the capital cost of solar power and energy storage sufficient
Indiana University Glick Eye Institute. LEED Measurement & Verification Plan
 Indiana University Glick Eye Institute LEED Measurement & Verification Plan April 10, 2012 1 Table of Contents General Introduction... 3 Facility Description... 4 M&V Objectives... 4 M&V Approach/Option...
ENERGY AND WATER CONSERVATION AND DEMAND MANAGEMENT PLAN
 ENERGY AND WATER CONSERVATION AND DEMAND MANAGEMENT PLAN 2014 2019 CONTENTS EXECUTIVE SUMMARY... 3 1. CENTENNIAL COLLEGE - DISTRIBUTION OF ENERGY CONSUMPTION IN 2012... 4 1.1. Overview of Centennial College
Market Opening Programme DUoS, Transaction and PSO Payment Process
 DUoS, Transaction and PSO Payment Process Date of Issue: 29 September 2004 Version: 1.1 Document Updates Date Description Version 23.04.2004 Issued to Market Participants for consultation 1.0 29.09.2004
The Call Center Balanced Scorecard
 The Call Center Balanced Scorecard Your Overall Measure of Call Center Performance! MetricNet Best Practices Series Some Common Call Center KPIs Cost Cost per Contact Cost per Minute of Handle Time Quality
Business Practice Manual for The Transmission Planning Process
 Business Practice Manual for The Transmission Planning Process Posted: June 2, 2015 Intentionally left blank TABLE OF CONTENTS 1. Introduction... 9 1.1. Purpose of California ISO Business Practice Manuals...
Going Deep on Plug Loads: Strategies from the Bullitt Center 12 th Annual Energy/Facilities Connections (EFC) Conference 4 May 2016 Leavenworth, WA
 Conference 4 May 2016 Leavenworth, WA") Going Deep on Plug Loads: Strategies from the Bullitt Center 12 th Annual Energy/Facilities Connections (EFC) Conference 4 May 2016 Leavenworth, WA Christopher Meek, AIA, IESNA Associate Professor + Director
Going Deep on Plug Loads: Strategies from the Bullitt Center 12 th Annual Energy/Facilities Connections (EFC) Conference 4 May 2016 Leavenworth, WA Christopher Meek, AIA, IESNA Associate Professor + Director
Microturbine CHP for Microgrids Microgrid2017
 Microturbine CHP for Microgrids Microgrid2017 Why Microturbines for Microgrids? Proven: Over 3,000 sites operating in Stand Alone and Dual Mode One Moving Part; Air Bearings Invertor Based Power Electronics
Sentido Palm Royale Resort Soma Bay Annual sustainability report 2016/17 New Concepts.New Trends
 Sentido Palm Royale Resort Soma Bay Annual sustainability report 2016/17 New Concepts.New Trends Introduction Environmental projects Monitoring resources Future Plans Introduction: Sentido Palm Royale
Shaking up the HVAC industry. IGSHPA Annual Meeting Mark Faulkenberry Western Farmers Electric Cooperative October 16, 2014
 Shaking up the HVAC industry IGSHPA Annual Meeting Mark Faulkenberry Western Farmers Electric Cooperative October 16, 2014 WFEC Family Geo Validation Project Overview Co-Sponsors Bosch ClimateMaster Cooperative
Custom Application 2018 Retrofit Program
 The Retrofit Program is designed for Commercial and Industrial (C&I) customers to help replace aging and inefficient equipment and systems with more energy efficient technologies. Tailored to a customer's
Residential Technical Reference Manual
 Residential Technical Reference Manual Version 2013.1 Effective Date: January 1, 2013 Efficiency Maine Trust 151 Capitol Street Augusta, ME 04333 866-376-2463 efficiencymaine.com INTRODUCTION... 3 RESIDENTIAL
Texas Hospital. Central Plant Redesign. Central Utility Plant SECOND PLACE HEALTH CARE FACILITIES, EXISTING 2013 ASHRAE TECHNOLOGY AWARD CASE STUDIES
 This article was published in ASHRAE Journal, January 2014. Copyright 2014 ASHRAE. Posted at www. ashrae.org. This article may not be copied and/or distributed electronically or in paper form without permission
CLARKSON UNIVERSITY, DG/CHP SYSTEM NOTES
 CLARKSON UNIVERSITY, DG/CHP SYSTEM NOTES The CHP system at Clarkson University consists of three (3) 65-kW Carrier microturbines and a Carrier absorption chiller packaged onto a Carrier Pure Comfort system.
LOW-ENERGY HOUSING ESTATE SUNDAYS
 LOW-ENERGY HOUSING ESTATE SUNDAYS Werner Weiß Christian Fink Alexander Thür AEE - Arbeitsgemeinschaft ERNEUERBARE ENERGIE Feldgasse 19 A-8 Gleisdorf AUSTRIA Tel.: +43-311 - 5886 Fax.: +43-311 5886-18
NATIONAL GRID. NTS Shrinkage Incentive Methodology Statement Submitted for Approval
 NATIONAL GRID NTS Shrinkage Incentive Methodology Statement Submitted for Approval April 2016 ABOUT THIS DOCUMENT This document describes the methodology that National Grid Gas plc ( National Grid ) in
Meter Data Management System (MDMS) Sharing. Ricky Ip CLP Project Manager
 Sharing. Ricky Ip CLP Project Manager") Meter Data Management System (MDMS) Sharing Ricky Ip CLP Manager Agenda Introduction Objectives Critical Success Factors Change Management Lessons Learned 2 CLP Power Hong Kong Limited (CLP Power) is the
Meter Data Management System (MDMS) Sharing Ricky Ip CLP Manager Agenda Introduction Objectives Critical Success Factors Change Management Lessons Learned 2 CLP Power Hong Kong Limited (CLP Power) is the
Ground-Coupled Heat Pump And Energy Storage
 Ground-Coupled Heat Pump And Energy Storage By Ed Lohrenz, Member ASHRAE; and Sergio Almeida, P.Eng., Member ASHRAE Ground-coupled heat pump (GCHP) systems consume less purchased energy than an HVAC system
Overview of Work Point Energy Efficiency Retrofit Project (Using an ESCO Facilitator) 17 November Christopher Seeley
 17 November Christopher Seeley") Overview of Work Point Energy Efficiency Retrofit Project (Using an ESCO Facilitator) 17 November 2015 Christopher Seeley Facilitator Background Energy Efficiency Building Retrofit Program - Clinton Foundation
Overview of Work Point Energy Efficiency Retrofit Project (Using an ESCO Facilitator) 17 November 2015 Christopher Seeley Facilitator Background Energy Efficiency Building Retrofit Program - Clinton Foundation
Final Flexible Capacity Needs Assessment for 2018
 Final Flexible Capacity Needs Assessment for 2018 April 28, 2017 1 Table of Contents 1. Introduction... 3 2. Summary... 3 3. Defining the ISO System-Wide Flexible Capacity Need... 5 4. Forecasting Minute-by-Minute
Natural Gas and Gas Turbines: Clean, Efficient and Flexible Energy. Mike Welch, Industry Marketing Manager O&G Siemens Industrial Turbomachinery Ltd.
 Natural Gas and Gas Turbines: Clean, Efficient and Flexible Energy Mike Welch, Industry Marketing Manager O&G Siemens Industrial Turbomachinery Ltd. Siemens Protection AG 2008. notice All / Copyright rights
Energy Audit Tool Manual. Client Name
 Energy Audit Tool Manual 1 Client Name CONTENTS I. About the ISO 50002 standard II. Introduction to the tool functionality III. Basic Interface and Menus IV. EA Tool Screens Detail 2 ABOUT THE ISO 50002
 Baffled Openings at Chain Link Fencing: Design shall consist of two end-posts set 4 feet apart, and a 10 foot wide chain-link fence panel equal in height as the adjacent fence. Chain link fence panel shall
Modeling Your Water Balance
 Modeling Your Water Balance Purpose To model a soil s water storage over a year Overview Students create a physical model illustrating the soil water balance using glasses to represent the soil column.
EVALUATION OF THE IMPACT OF SUB METERING ON MULTI RESIDENTIAL ELECTRICITY CONSUMPTION AND THE POTENTIAL ECONOMIC AND ENVIRONMENTAL IMPACT ON ONTARIO
 EVALUATION OF THE IMPACT OF SUB METERING ON MULTI RESIDENTIAL ELECTRICITY CONSUMPTION AND THE POTENTIAL ECONOMIC AND ENVIRONMENTAL IMPACT ON ONTARIO Prepared for: EnerCare Connections Inc. Navigant Consulting
Hotels: Water and Energy
 Hotels: Water and Energy Agenda 01 Introduction 05 Hotel System Options 02 Company Overview 06 Hotel Energy Conservation 03 Hotel Energy & Water Use 07 Hotel Project Examples 04 Design Philosophy Introduction
Charles D. Corbin & Gregor P. Henze
 Assessing Impact of Large-Scale Distributed Residential HVAC Control Optimization on Electricity Grid Operation and Renewable Energy Integration May 11, 2015 Charles D. Corbin & Gregor P. Henze Department
Service Level Agreement Policy. Table of Contents
 Table of Contents Service Level Agreement... 3 Definition of What a Service Level Agreement is... 3 Sample Service Level Agreement... 4 Assumptions... 4 Service Stakeholders... 5 Service Scope... 5 IT
Raynet Software Lifecycle
 Raynet Software End of End of RMSi 10.6 2016-Dec 2018-Dec* 2020-Dec* RMSi 10.5 2016-Jan 2018-Jan 2020-Jan RMSi 10.4 2014-May 2016-May 2018-May RMS/RMSi 10.3 2014-Feb 2016-Feb 2018-Feb RMS/RMSi 10.2 2013-Nov
Status of Canadian Energy Storage. Edward Morofsky Richard Stockton College May 2006
 Status of Canadian Energy Storage Edward Morofsky Richard Stockton College May 2006 Ottawa Average Temps and RH Monthly Ottawa Temperatures Ottawa Humidity 30 90 25 80 Degrees C 20 15 10 5 0-5 -10-15 Jan
Solar heating system sizing Solar storage tank size (volume) Solar collector array size (area)
 Solar collector array size (area)") Information Jo Sheet 4 System Sizing Solar heating system sizing To determine the size requirements for each system component in a solar heating system, it is necessary to estimate the system load. The
Information Jo Sheet 4 System Sizing Solar heating system sizing To determine the size requirements for each system component in a solar heating system, it is necessary to estimate the system load. The
2 kw. ak.com. www. Energy report
 2 kw Thermal System Example of SolarPeak residential installation Energy report Find your closest agent www w.solarpea ak.com SolarPeak Head Office ops@ @SolarPeak.com (3) 547 58 19 Nelson 1 What is this
Renewable Energy in The Netherlands
 Renewable Energy in The Netherlands Dr. Martien Visser Professor Energy Transition & Network Integration Hanze University of Applied Sciences Groningen Partner of the Energy Academy Europe E-mail: b.m.visser@pl.hanze.nl
Solar Energy Technologies
 1 Solar Energy Technologies ME 430 Queen s University The Solar Energy Resource Varies over day and year, (i.e., intermittent) Generally non-dispatchable Ottawa average for year ~4 kwh/m 2 per day e.g.,
Condenser Water Heat Recovery"
 PLEASE MUTE CELL PHONES Condenser Water Heat Recovery" Julian de Bullet ASHRAE Distinguished Lecturer Director of Industry Relations McQuay International 703-395-5054 1 What Is Sustainability? sustainable
Soil Temperature Damping Depth in Boreal Plain Forest Stands and Clear Cuts: Comparison of Measured Depths versus Predicted based upon SWAT Algorithms
 Soil Temperature Damping Depth in Boreal Plain Forest Stands and Clear Cuts: Comparison of Measured Depths versus Predicted based upon SWAT Algorithms G. Putz and B.M. Watson Civil & Geological Engineering,
DISTRICT HEATING & HEAT NETWORKS PRESENTATION
 DISTRICT HEATING & HEAT NETWORKS PRESENTATION www.rehau.com Building Solutions Automotive Industry LEARNING OBJECTIVES AGENDA - What is district heating? - Understand basic principles and advantages of
The Service Desk Balanced Scorecard
 The Service Desk Balanced Scorecard Your Overall Measure of Service Desk Performance MetricNet Best Practices Series Your Speaker: Jeff Rumburg Co Founder and Managing Partner, MetricNet, LLC Winner of
Water Conservation Planning and Tools and Models. Brian Skeens, P.E. CH2M HILL
 Water Conservation Planning and Tools and Models Brian Skeens, P.E. CH2M HILL Definition of Water Conservation Reduction of water use, waste, or loss Extend the life of current water supplies Program Goals
Existing Building Cx: Processes & Results A Cultural Journey. Barry Abramson Senior Vice President Servidyne
 Existing Building Cx: Processes & Results A Cultural Journey Barry Abramson Senior Vice President Servidyne AIA Quality Assurance Learning Objectives 1. Define the key steps in the process of retrocommissioning
A guide for businesses. Greenhouse Gas (GHG) Reporting
 Reporting") A guide for businesses Greenhouse Gas (GHG) Reporting Summary Greenhouse Gas (GHG) regulation Global warming became everyone s business when the Climate Change Act (2008) set a goal of reducing the UK
A guide for businesses Greenhouse Gas (GHG) Reporting Summary Greenhouse Gas (GHG) regulation Global warming became everyone s business when the Climate Change Act (2008) set a goal of reducing the UK