USE OF DREDGED MATERIALS FOR THE CONSTRUCTION OF ROADWAY EMBANKMENTS
|
|
|
- Owen Bryant
- 6 years ago
- Views:
Transcription
1 USE OF DREDGED MATERIALS FOR THE CONSTRUCTION OF ROADWAY EMBANKMENTS VOLUME III OF V APPENDICES C-G PREPARED BY: SADAT ASSOCIATES, INC. PRINCETON, NEW JERSEY ON BEHALF OF: OENJ CORPORATION, INC. BAYONNE, NEW JERSEY SUBMITTED TO: NEW JERSEY MARITIME RESOURCES NEW JERSEY DEPARTMENT OF TRANSPORTATION NEW JERSEY DEPARTMENT OF ENVIRONMENTAL PROTECTION NEW JERSEY PORT AUTHORITY OF NEW YORK AND NEW JERSEY NEW JERSEY TRANSIT DECEMBER 2001
2 APPENDIX C Impact of Embankment Percolate into Underlying Aquifer System Groundwater
3
4
5
6
7
8
9
10
11
12
13
14
15
16
17
18
19
20
21
22
23
24
25
26
27
28
29
30
31
32
33
34
35
36
37
38
39 APPENDIX D Final Geotechnical Report
40 FINAL GEOTECHNICAL REPORT OENJ / NJDOT ROADWAY EMBANKMENT PILOT PROJECT AT PARCEL G OF THE OENJ REDEVELOPMENT SITE ELIZABETH, UNION COUNTY, NEW JERSEY Prepared by: Ali Maher, Ph.D. Soiltek, Inc. Submitted To: New Jersey Maritime Resources New Jersey Department of Transportation Sadat Associates, Inc. OENJ Corp. December 14, 2001 i
41 TABLE OF CONTENTS 1. INTRODUCTION.1 2. FOUNDATION INVESTIGATION SCOPE OF THE FOUNDATION INVESTIGATION SUBSURFACE INVESTIGATION AND SOIL PROFILES...5 Stratum 1: Mixed refuse fill....6 Stratum 2: Soft organic peat(pt)/elastic silt (MH)..6 Stratum 3: Silty sand (SM), Sand with silt (SP-SM) GROUNDWATER ENGINEERING PROPERTIES OF SOIL STRATA Strength Characteristics.. Stratum 1: Refuse Fill.. Stratum 2: Peat (Pt) and Elastic Silt (MH).. Stratum 3: Silt Sand(SM), Sand with Silt (SP-SM) Compressibility Characteristics..9 Stratum 1: Refuse Fill..9 Stratum 2: Peat (Pt) and Elastic Silt (MH) ANALYSIS OF SETTLEMENT. 11 Profile A at Embankment Profile B at Embankment FOUNDATION RECOMMENDATIONS AND ACTUAL SETTLEMENTS LABORATORY TESTING PROGRAMS RATIONALE AND OBJECTIVE.15 ii
42 3.2 MATERIAL TESTED AND METHODOLOGY..16 TEST RESULTS Soil Classification Moisture-Density Relationship Strength Tests 23 Sample Preparation..23 Triaxial Shear Tests.23 Test Results.24 Effects of Temperature on SDM Shear Strength Permeability..30 Sample Preparation 30 Test Procedure 30 Results Resilient Modulus Consolidation Swell Potential Durability..45 Freeze-Thaw Tests 45 Wet-dry Tests FIELD TESTING PROGRAM OBJECTIVE FIELD CEMENT CONTENT EVALUATION FIELD COMPACTION TESTS FIELD SETTLEMENTMONITORING Settlement Plates Horizontal Inclinometers Magnetic Extensometer SLOPE DEFORMATION MONITORING MONITORING OF STRENGTH GAIN/LOSS CONCLUSIONS iii
43 6. RECOMMENDATIONS 4 7. REFERENCES 5 iv
44 1. INTRODUCTION In 1, the New Jersey Maritime Resources and the New Jersey Department of Transportation jointly sponsored a pilot project to study the feasibility of beneficially reusing Stabilized Dredged Material (SDM) in the construction of road embankments. The pilot project included the construction of two embankments on the water front parcel (parcel G) of the OENJ Elizabeth Site (the Site). Between fifty to sixty thousand cubic yards of dredged material from Union Dry Dock were amended with Portland cement and placed at the Site for use in the construction of the two embankments. The two embankments were extensively instrumented to monitor the behavior of the SDM during and after construction. Laboratory testing was conducted in conjunction with field-testing and monitoring to better determine the engineering properties of SDM. In 16, the United States Environmental Protection Agency (USEPA) banned ocean disposal of Contaminated Dredged Materials (CDM). Prior to that, CDM was disposed of in a mud dump approximately 6 miles from Sandy Hook, New Jersey. Since the 16 USEPA ruling, the disposal of CDM has become a concern for federal and state agencies. Several studies have been conducted to further investigate alternatives to ocean dumping. One of the proposed alternatives is the beneficial reuse of CDM in upland disposal sites. This entails the stabilization of CDM with pozzolanic admixtures to create structural fill, or the decontamination of CDM in order to use it as fill material, topsoil or in other applications. The process of decontamination and solidification of CDM is more expensive than ocean dumping. Moreover, decontamination methods have not yet proven sufficiently effective to economically process the volume of dredge that must be taken from the New York and New Jersey harbors each year, a volume estimated at 4 million cubic yards. This estimate does not include deepening projects. The beneficial reuse of stabilized dredge as structural fill, however, has been demonstrated to be cost effective for high volume usage. 1
45 For example, approximately, 600,000 cubic yards of SDM were successfully used as structural fill for the construction of parking areas for the Jersey Garden s Mall (former OENJ site, parcels A, B, and C). In this project, dredged material was amended with pozzolanic admixtures (Portland cement, cement kiln dust, lime kiln dust) to reduce moisture and increase workability. Once the moisture content approached the optimum level, SDM was compacted using conventional construction equipment. In-situ testing was implemented for the SDM to ensure quality control. The process of stabilizing problematic soils (such as high plastic clays and silts) by adding lime or cement goes back many decades. However, the natural moisture content of these soils is not nearly as high as that of dredged material. The use of dredged material as structural fill requires a significant reduction in moisture content and an increase in workability. Because of its high moisture content, the strength, compressibility, and durability of SDM present a major concern. Comprehensive laboratory analyses have been conducted to determine the engineering properties of SDM. These studies, in conjunction with full-scale field testing/monitoring of the two embankments in this study, have produced valuable data regarding the behavior of dredged material, particularly with respect to its use in roadway embankment applications. For this pilot project, two embankments, and a road connecting the two embankments, were constructed using SDM. Approximately eight percent (%) Portland cement (on wet weight basis) was added to the raw dredged material to increase its workability. Prior to construction of the embankments, a subsurface investigation was conducted to assess the competency of the foundation soil at the footprint of the embankments. Laboratory and field testing/monitoring were conducted within an 1- month period beginning in the spring of 19. Once the subsurface investigation was completed, it was determined that the foundation soil needed to be improved in order to eliminate any potential failure, or excessive differential settlement. 2
46 This report outlines the various tests performed as part of the pilot study, including the soil study for the embankment foundation, the laboratory testing of SDM, and field testing and monitoring. Detailed test results are included in the appendices to this report in the form of Portable Digital Format (PDF) files. On the basis of these tests and subsequent analyses, this report presents conclusions and recommendations regarding the overall feasibility of using SDM in roadway embankment projects. 3
47 2. FOUNDATION INVESTIGATION Prior to constructing the embankments, it was necessary to investigate the subsurface conditions and engineering properties of the foundation soils at the two sites that had been proposed for the construction of the two roadway embankments. The location of the study area for the foundation of the embankments is described below. Embankment Location 1 North of parcel G near wetlands transition area Elizabeth OENJ Development Site 1 2 Bordering the ditch pipe within Parcel G Elizabeth OENJ Development Site Scope of the Foundation Investigation The foundation investigation consisted mainly of the following tasks: 1. Data Review: All available data were reviewed, including data collected from previous investigations conducted by other consultants. This review included data previously collected by Sadat Associates from settlement plates installed within the mall project site. 2. Field Investigation: A field exploration program, including Standard Penetration Test (SPT) borings, and Cone Penetration Test (CPT) soundings, was performed in order to evaluate the physical properties of the waste, and organic peat/silt layers (Appendix A.1). 1 2 The embankment location was proposed by SADAT on /9 The embankment location was proposed by SADAT on 10/9 4
48 3. Laboratory Work: Laboratory tests were conducted to determine the physical properties of the selected soil samples (Appendix A.2). 4. Analysis: The collected data were evaluated and an analysis was performed to assess the anticipated settlement that would occur within the waste, and the organic peat/silt layers as a result of the embankment construction. 5. Foundation Recommendations: Recommendations for improving soil within the proposed embankment footprints were provided. It should be noted that the settlement estimate provided in this study referred specifically to the two compressible layers located immediately beneath the foundation layers: i.e., the waste and organic peat/silt layers. 2.2 Subsurface Investigation and Soil Profiles The subsurface investigation to determine the required foundation of the embankments was based on the proposed design and location of the two embankments. The subsurface investigation was conducted from September 14 through October 20, 1. A Soiltek representative observed the explorations and logged the borings. Specifically, the field investigation included six exploratory borings using Standard Penetration Testing (SPT), and 14 CPT soundings. Undisturbed soil samples of 2.-inch diameter were obtained from these borings using SPT. Soil samples were laboratory tested for physical properties. The borings and soundings penetrated 25 feet below the original grades of the landfill. The samples taken from the borings were classified in accordance with the Unified Soil Classification System. The logs of the SPT borings and CPT soundings are presented in Appendix A.1. 5
49 Based on the field investigations, the subsurface conditions at the embankment foundations and the access road are as follows: Stratum 1: Mixed refuse fill Refuse fill, covered by approximately one foot of cover soil, was encountered in all of the borings and soundings, except in Boring B3. Based on the field data, the refuse layer extends to depths in the range of 19 to 23 feet within the footprint of embankment 1. At the location of Boring B3, in the vicinity of the 10-foot concrete pipe, the refuse fill had been removed and replaced by imported sandy fill. In general, the refuse fill consists of varying quantities of wood, metal, tires, paper, construction debris, and soil. During previous construction activities, including the piping of the great ditch, a mixture of refuse fill and soft organic peat was placed on top of an older refuse layer. The newer refuse layer is approximately eight to nine feet in thickness. According to the CPT soundings, this refuse fill was placed with minimal compaction.. CPT soundings also identified layers of compacted sandy fill (about one foot in thickness) that had been placed as cover material on different occasions. A layer of sandy silt (dredged material) was encountered below the refuse fill at the soundings #9, #10, #11, and #12. The thickness of this layer varies from three to five feet. Stratum 2: Soft organic peat(pt) / elastic silt (MH) Below the refuse fill a layer of Peat (Pt) and soft elastic silt (MH) marsh sediments were found. The thickness of this layer is in the range of five to ten feet. Based on the soundings, the elastic silt layer underlies the peat layer within the investigated areas. However, the organic peat layer was not encountered in all of the soundings. SPT numbers were in the range of 1 to 6. Stratum 3: Silty sand (SM), Sand with silt (SP-SM) 6
50 Under the elastic layer, medium -dense to very-dense sandy soils of glacial origin were encountered. The soils in this stratum vary, but are predominantly made up of silty sand (SM). Other soil types, such as poorly, or well-graded, sand with silt (SP-SM) and (SW-SM), clayey sand (SC), and sandy silt (ML) were also found in this stratum. All of the borings and soundings were terminated after 10 feet of penetration into the sand stratum. SPT numbers ranged from 15 to refusal for this stratum. In general, the SPT numbers (N-values) were higher in the red-brown silty sand layer (SM) than in the gray sand with silt layer (SP-SM). A summary of the compressible soil profile, which was used for the settlement analysis, is given in the list below: Embankment Mixed Refuse Fill Pt / MH SM - SP / SM feet 5-10 feet Min. 10 feet 2-9 feet 5-10 feet Min. 10 feet 2.3 Groundwater Based on the soil boring and CPT data, groundwater depth at the study area ranged from two to five feet above mean sea level. 7
51 2.4 Engineering Properties of Soil Strata Strength Characteristics Based on the field data obtained during the subsurface investigation, the strength characteristics of the refuse, peat, and sand layers were evaluated and estimated as follows: Stratum 1: Refuse Fill Based on the analysis of SPT and CPT data soil borings and soundings, the friction angle within the refuse fill can be estimated as approximately 30 degrees to slightly higher. A nominal value of 30 degrees can be assigned to this layer along with a unit weight of 95 pcf. Stratum 2: Peat (Pt) and Elastic Silt (MH) The organic peat and the elastic silt layer have un-drained shear strength ( S u ) in the range of 325 psf to 604 psf, according to the laboratory triaxial shear tests. The undrained shear strength from laboratory tests was utilized to obtain the cone factor ( piezocone point resistance. N kt ) for Based on piezocone data, the in-situ un-drained shear strength of the stratum is in the range of 250 psf to 1,200 psf, although some lower values were recorded in CPT #13 and CPT # 14. Conservatively, an undrained shear strength ( S u ) of 350 psf could be assigned to the organic peat and elastic silt layer. Based on laboratory tests, the unit weight of the stratum is approximately 5 pcf.
52 Stratum 3: Silty Sand(SM), Sand with Silt (SP-SM) Based on SPT results and piezocone data, a friction angle of 33 degrees can be assigned to this layer. Based on the CPT soundings, the relative density for the stratum is between 35 to 60 percent, with a dominant range of 40 to 50 percent. CPT results are in agreement with SPT results, which estimate that the relative density is in the range of 35 to 65 percent. The red-brown silty sand (SM) layer generally has a higher relative density than does the gray sand with silt (SP-SM) layer. A unit weight of 120 pcf can be assigned to this stratum. As mentioned in previous sections of this report, the soundings and borings in the sand layer were terminated at a depth of ten feet. Therefore, the engineering characteristics of the sand layer at depths below ten feet cannot be evaluated without any further investigation Compressibility Characteristics The compressibility of the refuse and peat layers was characterized as follows: Stratum 1: Refuse Fill Due to the heterogeneity of refuse fills, it is difficult to predict the short-term and long-term landfill settlement that would result from the construction of the proposed embankments. To date, most of the studies conducted on landfill settlements have been site-specific, and are not easily applied to other sites. Moreover, theories developed for determining soil settlements (specifically, granular or fine-grained soils) are not directly applicable to refuse fill. A model presented by Holtz and Kovacs in 191 assumes that the settlement behavior of refuse material is similar to the settlement behavior of a normally consolidated soil stratum. The model is presented by the following equation: 9
53 H w = H w CR log[( σ ο + σ ) / σ s ο ] Where: H w = Waste settlement (ft) H w = Waste thickness (ft) CR = Compression Ratio, CR = C c /( 1 + eο ) C c = Compressibility Index, e ο = In-situ void ratio of the waste before loading σ ο = In-situ effective vertical overburden pressure at the mid-height of waste stratum (psf) σ s =Applied surcharge loading at the mid-height of surcharge loading (psf) Several investigators, such as Morris and Woods (10), Landva and Clark (10), Oweis and Khera (1), have applied this model to waste and verified its validity with field data. The key to predicting settlement for refuse material is in selecting appropriate values for the compression ratio, the empirical constant (CR ). To estimate the compression ratio (CR ) for the OENJ-Elizabeth site, all of the readings from the settlement plates that had been installed at the site prior to this investigation were reviewed. Based on this information, an average calculated CR value of 0.15 can be assigned to the refuse fill at the site. The available data from the settlement plates at the OENJ site were not sufficient to determine the coefficient of secondary compression ( C ' α ). However, according to the published literature for similar types of landfills, a coefficient of secondary compression of 0.02 can be assigned to the refuse fill layer. Secondary compression will not occur during the lifetime of the proposed embankment. 10
54 Stratum 2: Peat and Elastic Silt Layer Four one-dimensional consolidation (oedometer) tests were performed on selected samples of the organic peat and silt to evaluate their compressibility characteristics. The test results are presented in Appendix B. Based on the test results, the stratum is normally consolidated and the coefficient of primary compression for the samples tested is in the range of 0.62 to 0.3, with an average of The compression ratio (CR ) varies from 0.1 to The plots of coefficient of consolidation ( t 90 ), with respect to the application of different stress levels are v shown in Appendix B. According to the C v values, the estimated time within which 90% of the primary consolidation will be completed is 424 days (1.16 year). 2.5 Analysis of Settlement Based on the investigations conducted at the proposed embankment locations, two separate soil profiles (profile A for embankment 1, and profile B for embankment 2) were developed for use in evaluating settlement. Profile A at Embankment 1 The thickness of the refuse fill is approximately 20 feet. A 10-foot-thick layer of organic peat and elastic silt underlies the refuse fill layer. According to the Sadat Associates drawing, the maximum height of the embankment is 10 feet at the crown, and the embankment slopes down to the existing ground elevation at the perimeter. Using both the model and the estimated CR value discussed in the previous section, the anticipated settlement within the refuse fill for embankment 1, due to placement of 10 feet of compacted, stabilized dredged material ( γ = 105 pcf), will be approximately 12 w 11
55 inches. The deformation is likely to be non-uniform due to the heterogeneous nature of the refuse fill layer. For the organic peat and elastic silt layer, an average CR value of 0.2 was selected. Therefore, if the proposed embankment is constructed, the maximum settlement during the primary consolidation of the stratum will be approximately nine inches. Settlement within this stratum is likely to be more uniform in nature than is the settlement in the refuse fill layer. Profile B at Embankment 2 The refuse fill layer at embankment 2 (south embankment) is approximately eight feet, and this layer is covered by two feet of compacted, imported fill. The organic peat and silt layer has the same thickness as profile A (10 feet), according to our most recent subsurface investigation. Using the same compression indices for both the refuse fill layer and underlying layer, the anticipated settlement for the refuse fill will be nine inches, and for the peat/silt layer it will be approximately inches. A summary of the anticipated settlements within the proposed sites is given in the table below. Table 2.1 Predicted settlements within compressible layers Embankment Refuse Layer Settlement Peat Layer Settlement Total Estimated Settlement 1 12 inches 9 inches 21 inches 2 9 inches inches 17 inches In both cases, the anticipated settlement is excessive for the proposed embankments. Moreover, the settlement is not likely to be uniform due to the heterogeneous nature of the refuse fill and the difference in height within various sections 12
56 of the embankment. Techniques for improving the soil, such as pre-loading or deep dynamic compaction could significantly reduce final settlements. However, due to limited construction time and site-specific logistic issues, it was decided that high strength geosynthetic (SI 4x4 HT) fabric be used to induce uniform settlement and, to some extent, minimize deformation. 2.6 Foundation Recommendations and Actual Settlements 1) The refuse fill (including old waste and recently placed waste) within the proposed footprint of the two embankments has been placed with nominal compaction applied. Therefore that layer shall experience large deformation during and after the construction of the embankments. 2) The estimated settlement within the refuse fill at Embankment 1 will be approximately 12 inches, assuming that 10 feet of compacted dredge material are placed during embankment construction. The estimated settlement within the refuse fill at Embankment 2 will be approximately 9 inches, assuming that 15 feet of compacted dredge material are placed during embankment construction. Most of the settlement will occur during construction and in the first four weeks following construction. Settlement is likely to be non-uniform due to heterogeneity of the refuse fill. 3) Consolidation settlement within the organic peat and silt layer at Embankment 1 is estimated to be approximately 9 inches. Consolidation settlement within the organic peat and silt layer at Embankment 2 is estimated to be approximately inches. The primary consolidation of this layer is estimated to take 424 days. 4) The overall estimated settlement is excessive for the proposed embankment sites. Therefore, in the absence of more rigorous improvement methods, such as preloading or dynamic compaction, it was recommended that a layer of high tensile strength 13
57 geosynthetic material be placed to impose a more uniform settlement and to minimize deformation. After construction of the embankments using the recommended foundations, settlements were measured in the field. The settlement modeling was relatively accurate in estimating embankment settlement and deformation. Moreover, the results of the field settlement data also reveal a relatively uniform settlement throughout the embankments, which indicates the effectiveness of geosynthetic liner in making the settlement more uniform. A comparison of anticipated and final settlement data is presented in Table 2.2. Table 2.2 Comparison of Maximum Settlement Data Embankment 1 2 Anticipated Settlement 21 inches 17 inches Measured (settlement plates) 15.6 inches 15. inches Measured (horizontal. Inclinometer) 12.7 inches 13.4 inches It should be noted that the footprint of Embankment 1 underwent partial and irregular preloading for a period of approximately four months prior to embankment construction due to heavy vehicular traffic on the site. This reduced the amount of post construction settlement and accounts for the fact that the discrepancy between the anticipated settlement and the actual settlement at Embankment 1 is considerably larger than the discrepancy between these values for Embankment 2. 14
58 3. LABORATORY TESTING PROGRAM 3.1 Rationale and Objective Since 14 ocean dumping of contaminated dredge material (CDM) has been banned. As a result, CDM has since been placed in confined disposal facilities in either ocean or upland sites. This is more costly than ocean dumping, but CDM in upland sites may have the potential for beneficial re-use in structural and non-structural fills, once the material has been stabilized by the inclusion of pozzolanic admixtures and made workable for site use. In this project, due to excessively high moisture contents, CDM had to be stabilized and dewatered for considerable periods of time prior to consideration for beneficial re-use. The objectives of the laboratory investigation were two-fold: 1) to determine the material strength properties of the CDM and its potential for use in the construction of the proposed embankments, and 2) to determine the geotechnical properties of the CDM to assess its potential for use in high volume applications, such as fills, embankments, and roadway base materials. In order to realistically determine the behavior of CDM under field conditions, the selection of admixtures, the curing time and the placement process used in laboratory testing approximated field operations. The controlling parameters for the laboratory investigation were the type, and the content, of admixtures (cement and fly ash) used in the field, as well as the sequence of mixing, curing and placement activities specific to the project. The mixing of CDM with the admixtures was conducted on the OENJ/Cherokee site. After mixing, the stabilized dredge material (SDM) was placed on various locations at the site for dewatering, stabilization and curing. Unlike typical soil-cement mixtures in which the soil and cement are mixed and then immediately compacted, the SDM was placed on holding sites until its water levels had been reduced to the range of compaction specifications. Following the dewatering and consequent curing of the cement in the mixture, the SDM was then 15
59 disturbed and moved to the embankment sites for final placement and compaction. In other words, the SDM was first cured, and then remolded and compacted to field specifications. As a result, a direct comparison between the SDM used in this project and typical soil-cement materials could not be made. However, soil-cement properties are used in order to provide a point of reference for the evaluation of laboratory results. 3.2 Material Tested and Methodology The laboratory testing included the preparation of three different mixtures; each using raw dredged material (RDM), Portland cement and fly ash. The recipes were all mixed on a wet-weight basis. The three recipes were as follows: 1)RDM with 4% Portland cement, 2) RDM with % Portland cement, and 3) RDM with % Portland cement and 10% fly ash. The following tests were conducted on the mixtures:!" Unified Soil Classification ASTM D-1140, and D-422!" Shear Strength (tri-axial), ASTM D-4767, 250-7!" Swell Pressure ASTM D-4546!" Consolidation Test ASTM D-2435!" Resilient Modulus AASHTO T274!" Hydraulic Conductivity (Permeability) ASTM D-504!" Compaction Test ASTM D-1557!" Durability ASTM D-559!" Cement Content Determination ASTM D Sample collection and preparation for testing was as follows: 1) RDM was collected from dredged material scows under OENJ supervision and stored in 5-gallon plastic containers; 2) The containers were transported to the laboratory for mixing with the admixtures; 3) RDM was mixed with cement and fly-ash, according to the testing plan, in laboratory concrete mixers; 4) The mixtures were aerated in 3 x2 holding pans for 16
60 moisture reduction and curing; and 5) additional amended RDM was stored under field conditions outside of the laboratory as part of the six-month testing program. The testing plan as proposed in the geotechnical proposal is summarized in Table 3.1, which is repeated for each recipe. Table 3.1. The Laboratory Geotechnical Testing Plan (Repeated for 4% and % PC, and %PC+10% fly ash) Number of Samples Laboratory Test Description 5% Proctor - 1 Month Curing Time 90% Proctor 1 Month Curing Time 5% Proctor 6 Months Curing Time 90% Proctor - 6 Months Curing Time Unified Classification (ASTM D-1140, 422, 431) Strength Points) (ASTM D-4767) Swell Pressure (ASTM D-4546) Consolidation (ASTM D-2435) Resilient Modulus (MR AASHTO T74) Permeability (ASTM D-504) Compaction (ASTM D-1557) Durability (ASTM D-559) The initial, proposed, testing program did not include testing a mixture of RDM amended with 4% Portland cement. However, this mixture was tested in order to determine how the SDM would behave if the target percentage of % Portland cement was not achieved. Field determination of cement contents (Figure 4.1.) had indicated values as low as 2 to 4%. Therefore, by testing SDM with only 4% Portland cement, there would be an indication of the differences in strength and compressibility between the target % mixture and the 4% mixture. 17
61 In order to determine the effects of density on the engineering properties of SDM, samples were compacted to two different densities: 5% and 90% of the material s maximum dry density as determined by ASTM D-1557 (Modified Proctor). The rationale for choosing the Modified Proctor Method for compaction was based on FHWA A-RD Design Pamphlet for the Determination of Design Subgrade in Support of the 13 AASHTO Guide for the Design of Pavement Structures. The pamphlet states that AASHTO T (Standard) should be used for coarse-grained soils and aggregate materials, and low plasticity fine-grained soils; whereas, AASHTO T10 (Modified) should be used for medium to high plasticity fine-grained soils. 3.3 Test Results Soil Classification Particle size distribution tests, including sieve analysis and hydrometer tests, were conducted on the three mixtures: SDM with 4% Portland cement, SDM with % Portland cement, and SDM with % Portland cement plus 10% fly ash. In addition, Atterberg limits, including plastic limit and liquid limit, were conducted on the same samples. Tests were conducted in conformance with ASTM D1140 and D422. The detailed laboratory test results are presented in Appendix B-1. A summary of gradation test results for three different types of SDM at two different curing times (1 month and 6 months) are presented in Table 3.2. According to the results, dredged material is mostly silt with low percentages of fine sand and clay. Sediments dredged from navigational channels naturally do not contain coarse or medium sand (although incidental pieces of gravel were found in some samples) because sand will settle before it reaches still waters. Nor can these sediments contain high percentages of clay, because clay particles will stay in suspension. However, in dredged material excavated from deepening projects the material could contain significant amounts of gravel and rock mixed with fine material. 1
62 The average SDM samples consisted of 66% silt, 14% clay and 16% fine and medium sand (12.1% fine, 3.9% medium). Gravel content was negligible except for one sample, which contained 6.5% gravel. The percentage of clay size particles was higher for those SDM samples that had been mixed with fly ash. This is due to the fine nature of fly ash particles. The organic content of the raw dredge material was determined to be around % according to ASTM D2974 from previous OENJ data. Table 3.2 Gradtaion Results Grain Size Summary (Sieve + Hydrometer Data) % Gravel % Sand % Fines D 50 Sample Type Stockpiling Time Sample # Coarse Fine Coarse Medium Fine Silt Clay (mm) 4% PC 1 Month Average % PC 6 Months Average % PC 1 Month Average % PC 6 Months Average % PC + 10% FA 1 Month Average % PC + 10% FA 6 Months Average Raw Dredge N/A Average
63 In general, the effect of increased curing time on particle size distribution was minimal. Any variation in particle size is attributable to size variation in the source material. In addition to the gradation test, SDM samples were also tested for plasticity index. The average liquid limit, plastic limit and plasticity index for SDM is also summarized in Table 3.3. Table 3.3 Average Atterberg Limits for SDM Sample Type Curing Time Liquid Limit Plastic Limit Plasticity Index Raw Dredge Material NA % Portland Cement 1 Month % Portland Cement 6 Months % Portland Cement 1 Month % Portland Cement 6 Months % Portland Cement + 10% fly ash 1 Month % Portland Cement + 10% fly ash 6 Months The addition of cement and pozzolanic mixtures to the dredged material clearly reduced the plasticity index of the material. The Plasticity index decreased from 40 to 5 after the addition of Portland cement and fly ash to SDM, thus increasing the workability of the material and reducing the potential for volume change due to variations in moisture content. In addition, liquid limit and plastic limit values decreased with increasing curing time. A comparison of Atterberg Limits for samples cured for one month and samples cured for six months shows a reduction in those limits over time. This reduction was smaller, however, for SDM stabilized with fly ash, but the overall plasticity index decreased for the six-month-old samples. This is primarily due to the ongoing hydration of cement, which results in a reduction of the mixture s water-holding capacity. 20
64 Based on the Atterberg Limits, all the samples tested are below the A-line and to the right of the LL=50 line on the Plasticity Chart, as shown in Figure 3.1. Therefore, the SDM could be classified as Elastic Silt (MH) U-LINE CH or OH PLASTICITY INDEX, % CL- ML CL or OL ML or CL A-LINE MH or OH LIQUID LIMIT, % Atterburg Limit Data Sample No. Liquid Limit Plastic Limit Plasticity Index Symbol 4% PC ( 1 Month) % PC (6 Months) % PC (1 Month) % PC (6 Months) % PC + 10% FA (1 Month) % PC + 10% FA (6 Months) Virgin Dredge Material Figure 3.1. Atterberg limits for RDM and SDM 21
65 3.3.2 Moisture-Density Relationship The three different mixtures of SDM were tested for moisture-density relationship. For each recipe, some samples were cured in the laboratory for one month and some for six months. The tests were conducted in accordance with ASTM D-1557 (Modified Proctor). For each recipe, several samples were tested with moisture contents on the wet and dry side of the optimum. Test results are presented in Appendix B-2. A summary of the test results is presented in Table 3.4. Table 3.4 Compaction Data Summary Sample Type Stockpiling Time Optimum Values 90% of Optimum 5% of Optimum γ d max (pcf) w % OPT (%) γ d (pcf) w % (%) γ d (pcf) w % (%) 4% PC 1 Month % PC 6 Months % PC 1 Month % PC 6 Months % PC + 10% FA 1 Month % PC + 10% FA 6 Months Sandy Silt+%PC* 1 Month Fine Sand+% PC* 1 Month * PCA, 11 As described in section 3.2, the preparation of samples varied slightly from the conventional methods. Specifically, after mixing, the SDM samples generally contained high moisture contents and needed to be air-dried prior to compaction. Once the moisture content approximated the optimum moisture content, one sample was compacted while the remaining samples were further air-dried. This process continued until several samples were compacted at moisture contents below the optimum. To establish the moisture- 22
66 density curve for each recipe, eight points, or more, were used. The maximum point on a parabola, which connects the test points, determines the maximum dry density and the optimum moisture content. Dry-density values at 5% and 90% of the maximum were used in the preparation of samples for other laboratory tests. According to the test results, maximum dry densities ranged from 76.6 pcf to 7. pcf, and optimum moisture contents ranged from 26% to 31.5%. A slight reduction in maximum dry density was observed when the percentage of cement and the curing time were increased prior to compaction of the material. This is similar to findings made by Kezdi (1979) where the maximum dry densities of cement-treated silts were found to decrease slightly with increasing cement content Strength Tests Sample Preparation One-month-old samples and six-month-old samples of the three different recipes for SDM were also tested for shear strength characteristics. The samples were compacted to 5% and 90% of their modified maximum dry density and then tested for strength parameters under triaxial shear conditions. The summary of test results is presented in Appendix B.3. Chapter 2 Triaxial Shear Tests The shear strength parameters, C and φ, were determined under both drained and undrained conditions to: 1) calculate the stability of the two embankments; and 2) to evaluate the effect of admixtures on shear strength parameters, thereby determining the suitability of SDM for re-use applications. A series of UU and CU tests were performed in accordance with ASTM D4767 and D The results of UU tests were used to determine the material s effective strength parameters, including the effective angle of internal friction (φ ) and the effective cohesion intercept (C ). 23
67 The long-term behavior of SDM under load conditions is better modeled with effective stress parameters. In order to determine the effective stress parameters, CU tests were conducted on saturated SDM samples. Stress was applied to the material and the resulting pore pressures were measured. The difference between the total applied stress and the resulting pore pressure determines the level of effective stress. Soil samples were sheared approximately 24 hours after the samples were consolidated inside the triaxial chamber. In general, soils tend to show frictional behavior over the long term, as the pore pressure tends to dissipate. Test Results A summary of the UU test results is presented in Table 3.3, and a summary of the CU test results in Table 3.4. A close examination of the data reveals no significant change or trend in the magnitude of the frictional angle, ϕ, as a result of the addition of admixtures. For both cases, an average value of approximately 32 o may be considered a good estimate for the stability analysis of slopes and embankment. This finding corroborates previous findings by Balmer (195), Clough, et al. (191) and Van Riessen and Hansen (12); where different soil types, amended with varying cement contents, were extensively tested and showed no significant change in frictional angle as a function of the varying amount of cement. A general comparison of SDM with typical soil-cement and cement-modified soils shows that with the same percentage of added cement, and similar compaction efforts (90% of optimum for SDM, and optimum for soil-cement) cement-modified soils are denser than SDM, have slightly higher friction angles, and have a much higher cohesion intercept under triaxial shear conditions. Table 3.5 summarizes these differences between SDM and typical soil-cement and cement-modified soils. One reason the SDM in less cohesive than soil-cement is that during the process of remolding the SDM for compaction, parts of cementitious bonds between hydrated cement particles and the soil matrix become 24
68 broken. With typical soil-cement or cement-modified soils hydration and curing take place immediately after compaction, in part because compaction prior to curing causes soil grains to be forced into direct contact with cement grains resulting in an "agglomeration of soil-cement grains interspersed in the soil mass" (Cotton, 1962). In comparison, with SDM, the sequence of sample preparation is reversed and some of the previously gained strength is lost during the break-up upon compaction (see figure 3.2). * error Sample Type 4% PC 1 Month 4% PC 6 Months % PC 1 Month % PC 6 Months % PC + 10% FA 1 Month Table 3.5 UU Triaxial Test Summary Stockpiling Compaction Friction Angle Cohesion (psf) Time 5% 2 1,95 90% 31 3,312 5% 26 1,915 90% 33 2,664 5% 12* 4,464 90% 32 4,939 5% 30 3,643 90% 35 4,744 5% 30 2,030 90% 33 2,721 % PC + 10% FA 6 Months 5% 23 1,195 90% 34 2,203 Soil Cement Before compaction Cement Modified Soil After Compaction Compacted Soil-Cement Figure 3.2. Effect of compaction on soil-cement mixtures 25
69 In addition to UU tests, CU tests were also conducted on SDM. The effective C and φ or (C and φ ) were calculated after the Mohr circles for effective stresses were plotted. C is the cohesion intercept and φ is the angle of the tangent line with respect to the circles. As expected, the effective friction angle values were generally larger than the total values for SDM. This is a result of pore pressure dissipation and an increase in friction between soil particles. Similar to the UU tests, no significant change or trend in the magnitude of the frictional angle, ϕ, with the addition of cement and fly-ash could be observed. An average angle of 34 o can be estimated for long-term stability analysis of the embankments. On average, there is an increase in the effective friction angle compared with the total friction angle. Cohesion, however, decreases as the friction angle increases. These test results are summarized in Table 3.6 below: Sample Type Table 3.6 CU Triaxial Test Summary Stockpiling Time Compaction Total Stress Effective Stress φ C (psf) φ C (psf) 4% PC 1 Month 5% % % PC 6 Months 5% % % PC 1 Month 5% % % PC 6 Months 5% % % PC + 10% FA 1 Month 5% % % PC + 10% FA 6 Months 5% % Silt Loam+% cement* 2 days γ d = 113,w=15% 37 21, Silt Clay Loam+6% cement* 2 days γ d = 112,w=15.7% 36 14,352 * PCA, Bulletin D32 (samples not saturated, no pore pressure measured) 26
70 The SDM samples were compacted to 5% and 90% of their maximum dry density, as determined by Modified Proctor (ASTM D1557). For all of the samples tested, a 5% increase in dry density resulted in increased strength. On average, the un-drained φ and C values increased by 32% and 35%, respectively. Moreover, the average increases in φ and C were 1 % and 50%, respectively. On this basis, it can be concluded that compaction is the most effective method of increasing the strength of SDM. Effects of Temperature on SDM Shear Strength The hydration of pozzolanic materials, including Portland cement, is a temperature dependent reaction. At temperatures below 40 F, the pozzolanic reactions between the cement and soil particles slow down. As a result, the improvements associated with the addition of cement, i.e., moisture content reduction and improved strength, are minimized. Therefore, it may be prudent to limit the placement of SDM to warm seasons (April through October). The processing and curing of the material, however, can take place throughout the year. To quantify the effects of low temperatures on the curing Portland cement and on the strength gain/moisture reduction of SDM, samples of RDM were amended with different percentages of Portland cement and fly ash and then tested for shear strength and moisture content. For sample preparation, RDM was mixed with 4%, 6%, and % Portland cement and with 4% Portland cement and 5% fly ash. Immediately after mixing, the samples were placed in molds and minimum compaction was applied. Half of the samples cured at (70 F) and the other half were kept at 40 F. The samples were tested for their Unconfined Compressive strength at different intervals: after 24 hours, 7 days, 14 days and 2 days. In addition to strength tests, the moisture content of the samples was calculated to determine the effects of pozzolanic additives in reducing moisture The temperature effect data are presented in Table 3.7 and in Figures 3.3 And
71 Table 3.7 Effect of Temperature on Shear Strength of SDM Sample Type Curing Temperature in F Strength (psi) 1 day Curing Strength (psi) 7 Day Curing Strength (psi) 14 Day Curing Strength (psi) 2 Day Curing RDM+4%PC RDM+4%PC RDM+6%PC RDM+6%PC RDM+%PC RDM+%PC RDM+4%PC/ 5% FA Chapter Maximum Deviatoric Stress (psi) Series1 4% PC Series2 6% PC Series3 % PC 4% PC + Series4 5% FA 4% PC + Series 5% FA (Cold) 6% PC Series9 (Cold) Time (days) % PC Series10 (Cold) Figure 3.3. Effect of temperature on strength gain during curing period 2
72 1 Series1 4% PC Normalized Water Content /W initial ) Time (Days) Series2 6% PC Series3 % PC 4% PC + Series4 5% FA 4% PC + Series 5% FA (cold) 6% PC Series9 (Cold) % PC Series10 (Cold) Figure 3.4. Effect of temperature on moisture reduction According to the test results, temperature plays a significant role in the amount and rate of strength gain in dredged material that has been amended with cement and fly ash. Therefore, if economically feasible, dredged material should be amended during the warm seasons of the year. Moreover, temperature affects the rate and degree of moisture reduction in SDM. According to figure 3.4, this reduction can vary from 45% to 0% of initial the water content as temperature increases from to 40 to 70. At low temperatures, moisture reduction occurs immediately after the mixing, whereas at 70, cement hydration takes place over a longer period of time, resulting in further moisture reduction. All three of the SDM recipes, once they had been compacted to 5% of their maximum dry density, were able to meet the slope stability requirements (F.S.>1.5) for the two embankments. 29
73 During construction of the two embankments, the SDM had to be aerated using a set of disks, pulled by a bulldozer, which scraped and overturned the SDM. This helped expose the SDM to sun and air and reduce the moisture content. Sometimes, this process had to be repeated several times before the moisture content had reached the minimum required dry density. When the SDM was compacted and disked several times, some or most of the bonds between the cement crystals and the soil particles tended to break. As a result, the cementation failed to yield any additional strength gain. It should be noted again, however, that temperature plays a major role in the hydration of Portland cement and in the strength gain of SDM Permeability Sample Preparation Twenty-four samples were prepared and tested for permeability (hydraulic conductivity). Three different recipes for amending RDM were used in the sample preparation: 4% Portland cement, % Portland cement, and % Portland cement with 10% fly ash. The three different recipes were sampled at one month and at six months. Half of the samples were compacted to 5% and the other half were compacted to 90% of their maximum dry density, as determined by Modified Proctor (ASTM D-1557). Test Procedure For permeability testing, the ASTM D-504, or flexible wall, method was used. In this method, a prepared sample, surrounded by a flexible membrane, is placed in a watertight chamber in which water pressure or air pressure is applied as confining pressure. Water is pushed through the sample from the top. Once the inflow and outflow rates are equal, the sample is considered saturated and readings are taken. During the test, the cell pressure and the hydraulic gradient remain constant. The hydraulic gradient is the ratio of difference between the applied hydraulic head at the top and the bottom of sample over the total length of the sample. According to the ASTM, the gradient should not exceed
74 Results The results of permeability tests are presented in Table 3.. A summary of all test results is provided in Appendix B.4. The permeability results ranged from 1.25*10-6 cm/sec to 4.3*10 7 cm/sec. The lowest values were recorded for samples of RDM amended with % Portland cement and 10% fly ash. Also, samples amended with 4% Portland cement generally had lower permeability than did samples amended with % Portland cement. This may be due to the apparent effect of cementation on imposing a flocculated fabric arrangement in SDM. 31
75 Table 3.. Permeability Results Final Permeability (k) Results from Constant Head Tests k = [(V(t 1, t 2 )) x L)/(P B x A x t)] V (t 1, t 2 ) = Volume of Flow from t 1 to t 2 (cm 3 ) A = Area of Sample (cm 2 ) L = Length of Sample (cm) t = time from t 1 to t 2 (seconds) P B = Bias Pressure (cm - H 2 O) Sample Type Stockpiling Time Compaction Sample # L A V (t 1, t 2 ) P B t (seconds) k (cm/sec) 4% PC 1 Month 5% E E-07 Average = 6.92E-07 4% PC 1 Month 90% E E-07 Average = 5.52E-07 4% PC 6 Months 5% E E-07 Average =.02E-07 4% PC 6 Months 90% E E-07 Average = 6.03E-07 % PC 1 Month 5% E E-06 Average = 1.25E-06 % PC 1 Month 90% E E-07 Average = 9.27E-07 % PC 6 Months 5% E E-07 Average =.07E-07 % PC 6 Months 90% E E-07 Average = 6.15E-07 Sample Type Stockpiling Time Compaction Sample # L A V (t 1, t 2 ) P B t (seconds) k (cm/sec) % PC + 10% FA 1 Month 5% E E-07 Average = 7.40E-07 % PC + 10% FA 1 Month 90% E E-07 Average = 4.60E-07 % PC + 10% FA 6 Months 5% E E-07 Average = 6.3E-07 % PC + 10% FA 6 Months 90% E E-07 Average = 4.3E-07 32
76 A comparison between those samples compacted to 5% of the maximum dry density and those samples compacted to 90% of the maximum dry density indicates that with an increase in compaction there is a reduction in permeability ranging from 25% to 60%. For SDM amended with 4% Portland cement, the reduction in permeability ranged from 25% to 36%. For SDM amended with % Portland cement and for SDM amended with % Portland cement plus 10% fly ash, the reduction in permeability averaged from 33% to 53% respectively. Samples tested at one month when compared with samples tested at six months, indicate that there is no significant difference in permeability as a result of curing time. In general, tests results indicate that SDM could be considered for use as a low permeability layer in landfill cap applications. For roadway applications, however, building roadways on SDM would be similar to building on compacted fine-grained subgrades, such as those used in arid regions like Arizona, Texas, etc. Proper coverage must be provided through base or sub-base materials. The coverage provided over the SDM sub-grade that lies under the Jersey Garden s Mall in Elizabeth, NJ, is a good example of such measures Resilient Modulus In order to determine the feasibility of using SDM as a base in roadway applications, it was necessary to evaluate resilient modulus values for all the SDM mixtures considered in this study. Resilient modulus is a dynamic soil property, which is used in the mechanistic design of pavement systems. The resilient modulus is the ratio of axial cyclic stress to the recoverable strain. For base, sub-base and sub-grade materials, it is determined by repeated load triaxial tests on unbound material specimens. In order to determine the resilient modulus of unbound materials, a cyclic stress of fixed magnitude must be applied to the material for a duration of 0.1 second, followed by a rest period of 0.9 seconds. During the test, the material is subjected to a confining stress provided by means of a triaxial pressure chamber (AASHTO T307). 33
77 The resilient modulus test provides a means of characterizing base, sub-base and sub-grade materials for the design of pavement systems. These materials can be tested under a variety of conditions, some of which include stress state, moisture content, temperature, gradation and density. Specimen preparation is accomplished in accordance with AASHTO TP46-94 Standard Test Method for Determining the Resilient Modulus of Soils and Aggregate Materials. This test method classifies sub-grade soils in two categories. Type 1 soil is classified by the following criteria: less than 70% of the material passes the number 2.00 mm sieve and less than 20% passes the 75-µm, and the material has a plasticity index of 10 or less. These soils are compacted in a 152-mm-diameter mold. Type 2 soils include all materials that do not meet the criteria for type 1. These soils, such as SDM, are compacted in 71-mm-diameter mold. The sample preparation procedure for SDM is as follows: 1. Approximately 1,500 g. of SDM were compacted in five equal layers, each measuring 2.5 mm with a diameter of 71 mm and a height of 142 mm. The weight of each layer was determined in order to produce the required density. 2. A plunger was placed into the specimen mold prior to the addition of the SDM. 3. After the SDM was added, a second plunger was inserted into the compaction mold. The compaction mold and plungers were then placed into the loading frame. A load was placed on one of the plungers to compact the layer until the plungers rested firmly on the compaction mold. The load was then decreased and the compaction mold was removed from the loading frame. 4. One of the plungers was removed and the top of the compacted layer was scarified to ensure integration of the next layer. 34

78 5. The next layer of SDM was added to the compaction mold. A spacer equal to the height of the previous layer was placed on top of the compaction mold before the insertion of the plunger, as shown in Figure Steps 4 and 5 were repeated until all five layers were compacted. 7. Using the extrusion ram, the compacted specimen was pressed out of the compaction mold.. The specimen was then placed on the bottom platen of the triaxial chamber. Using a vacuum membrane expander, a membrane was placed over the specimen and rolled over the top and bottom platens. O-rings were used to secure the membrane to the platens to ensure an air-tight seal. 9. A vacuum was applied to the sample. A bubble chamber was used to check for leaks in the membrane. 10. The triaxial chamber was assembled and a confining pressure of 41.4 kpa was applied. 11. The triaxial chamber was then placed into the loading frame for the resilient modulus test. Extrusion Ram Compaction Mold Plunger Spacer Figure Compaction Mold, Plungers, Spacers, and Extrusion Ram 35
79 The testing sequence for evaluating the resilient modulus of sub-grade soils is presented in Table 3.9. First, the cyclic load is applied a haversine shape form of (1-cos Θ)/2. The maximum axial stress is defined as the cyclic stress plus the contact stress, where the contact stress is 10% of the maximum axial stress. A contact stress on the specimen is necessary to insure thorough contact between the specimen and platens throughout the cyclic process. If thorough contact between the loading platens and the specimen is not achieved, an inaccurate measurement of resilient modulus may result. The cyclic stress is 90% of the maximum applied axial stress. The cyclic stress pulse has a duration of 0.1 second with a rest period of 0.9 seconds. During the rest period a contact stress is maintained to ensure contact between the loading platens and the specimen. Table Testing Sequence for Sub-grade Materials Sequence Number Confining Pressure, σ 3 (kpa) Maximum Axial Stress, σ d (kpa) Cyclic Stress, σ cd (kpa) Contact Stress, σ d (kpa) Number of Load Applications Conditioning
80 Sequence Number Confining Pressure, σ 3 (kpa) Maximum Axial Stress, σ d (kpa) Cyclic Stress, σ cd (kpa) Contact Stress, σ d (kpa) Number of Load Applications Results The resilient modulus of a soil cannot be represented as a single value. As shown in Figure 3.6, the resilient modulus of a soil depends on the state of applied stress that the soil is undergoing, and for sub-grade soils, the state of stress is defined using the bulk stress (θ) and the applied deviatoric stress (σ d ); where; M r = k 1 P a (θ/p a ) k 2 * (σ d /P a ) k 3 θ = Bulk Stress = (3σ 3 + σ d ) σ d = Applied Deviatoric Stress σ 3 = Confining Pressure. Also shown in the figure is the regression equation as well as the material constants typically used to define the resilient modulus of the tested soil. The regression equation that was used for all of the testing is referred to as the Universal model. Uzan (195) demonstrated that the bulk stress model could not precisely describe nonlinear soil characteristics; therefore it was modified to more precisely model the nonlinear characteristics of granular soils. The Universal model may also be used to predict the nonlinear characteristics of fine-grained and cohesive soils. Fine grained and cohesive soils are influenced only slightly by confining stresses, but are greatly influenced by 37
81 deviatoric stresses. Therefore since the Universal model integrates both of these factors, it is well suited for these soils as shown in the equation, where k 1,k 2,k 3 are material and physical parameters, P a is the atmospheric pressure, θ is the bulk stress (σ d + 3σ 3 ), and σ d is the deviatoric stress. Resilient Modulus (psi) 17,500 15,000 12,500 10,000 7,500 5,000 2,500 0 M R = (433.4 x Pa) x (θ/pa) x (σ d /Pa) Applied Deviator Stress (psi) Confining Pressure Figure 3.6 Typical Resilient Modulus Results for a New Jersey Sub-grade Soil Series1 6 psi Series2 Series3 4 psi Series4 Series5 2 psi Series6 The plotted results for the regression equation are shown as the dotted line with hollow symbols, while the actual values are shown as the solid line with solid symbols. For comparison purposes, a typical pavement section (Figure 3.7) was developed and analyzed using the elastic-layered theory to determine the bulk stress and the deviatoric stress that would result from an 1 kip applied axle load. The results were as follows: Bulk Stress (θ) = 9.1 psi Applied Deviatoric Stress (σ d ) = 5.0 psi 3
82 Table 3.10 illustrates the resultant resilient modulus values for three New Jersey sub-grade soils that currently underlie roadways in New Jersey. According to the table, SDM compares favorably to the soil taken from Route 23 and the magnitude of the SDM is higher than that of the sub-grade soils taken from Route 206 and Route 295. Wheel Load = 9000 lbf Tire Pressure = 100 psi Asphalt Layer M R = 250,000 psi υ = 0.35, γ ac = 14 pcf Base/Subbase M R = 35,000 psi υ = 0.4, γ base = 132 pcf H = 6.0 in. H = 10.0 in. Subgrade υ = 0.45, γ sub = 105 pcf M R =? Figure 3.7 Pavement Section Used for Resilient Modulus Comparison 39
83 Table Comparison of resilient modulus values between SDM and typical NJ base materials Sample Type Stockpiling Time Compaction Resilient Modulus (psi) 4% PC 1 Month 5% % % PC 6 Months 5% % 752 % PC 1 Month 5% 11,911 90% % PC 6 Months 5% % % PC + 10% FA 1 Month 5% % % PC + 10% FA 6 Months 5% % Rt. 23 (Medium to Fine Max. Dry Sand) Density Rt. 295 (Medium to Fine Max. Dry Silty Sand) Density Rt. 206 (Silt with Fine Max. Dry Sand) Density Consolidation Laboratory consolidation tests were conducted according to the ASTM D-2435 method. The samples were prepared using RDM amended with 4% Portland cement, % Portland cement, and % Portland cement with 10% fly ash. The SDM mix was remolded into a consolidometer with different compaction efforts applied. To determine the level of compaction achieved with each sample, a compaction test conforming to ASTM D-1557 was conducted for each recipe. According to the test results, samples were compacted to varying degrees ranging from 59% to 90% of their maximum dry density. 40
84 The moisture contents used when the test samples were remolded were chosen to represent the site s average and approved layers that did not meet the 5% Modified Proctor criteria. Except for two, the samples were all remolded at moisture contents well above their optimum moisture content. According the Geotechnical Testing Report on Compacted SDM, prepared by Converse Consultants for the Jersey Garden s Mall project in Elizabeth, NJ, SDM samples compacted at, or slightly above, their optimum moisture content would experience almost no deformation, even when subjected to severe loading. Therefore it was decided that the water content during remolding be increased to account for cases where the compaction criteria were not met. 41
85 Table Consolidation Test Results Sample Type Curing Time Moisture Content% Dry Density*(psf)/ Pc (tsf) Cc Cr e 0 Cc/(1+eo) Saturated Remolded Max. Dry Density SDM (4% PC) 1 month (46./ 7.7)=59% SDM (4% PC) 1 month (47.7/ 7.7)=61% SDM (4% PC) 6 month (64.3/ 77.4)=3% SDM (4% PC) 6 month (67.6/ 77.4)=7% SDM (4% PC) 6 month (69.6/ 77.4)=90% SDM (% PC) 1 month (53.7/ 7.5)=6% SDM (% PC) 1 month (5./ 7.5)=75% SDM (% PC) 1 month (63.6/ 7.5)=1% SDM (% PC) 6 month (46/ 76.6)= 60% SDM (% PC) 6 month (4./ 76.6)=64% SDM (% PC) 6 month ( )=62% SDM (% PC,10% FA) 1 month (50.7/ 7.)=64% SDM (% PC,10% FA) 1 month (53./ 7.)=6% SDM (% PC,10% FA) 1 month (52.9/ 7.)=67% SDM (% PC,10% FA) 6 month (64.2/7.4)=2% SDM (% PC,10% FA) 6 month (67.9/7.4)=7% SDM (% PC,10% FA) 6 month (67.4/ 7.4)=6% Organic Silt, Bayonne, NJ* pcf Organic peat, Elizabeth, NJ* pcf Elastic Silt, Elizabeth, NJ* pcf Organic Silt, Woodbridge, NJ pcf *Remolded Dry Density (before consolidation) * Obtained from OENJ Cherokee, Inc. 42
86 Samples were tested after one month of curing and after six months of curing.. All consolidation test results are presented in Appendix B.5. As previously mentioned, the energy applied for remolding the sample prior to the test plays a major role in the consolidation behavior of the material. Test results indicate pre-consolidation stresses (P c ) as high as.7 tsf, once the sample is compacted to 7% of its modified maximum dry density. This means that the compacted material will compress before experiencing.7 tsf of overburden (equivalent to approximately 170 feet of SDM, unit weight of 100 pcf, or 133 feet of compacted granular fill unit weight of 130 pcf). However, P c as low as 1.32 tsf was recorded for a sample compacted to 6% of its modified maximum dry density. The average value of P c, for samples compacted from 1% to 90% of their modified maximum dry density, is higher than 5 tsf. The compression index (C c ) values range from 0.22 to 0.9. Both of these values were recorded for SDM with % Portland cement. In general, for all recipes tested, once compaction reaches 1%, the compression index will not exceed 0.5. In that case, a P c of 2 tsf or more should be expected. The compression ratio (C R = C c /1+e 0 ) varied from 0.05 to This value did not exceed 0.19 for samples compacted to 3% or above. Based on the results presented in Table 3.11, it can be concluded that SDM embankments could be constructed to a height of 50 feet with a minimum of settlement taking place within the SDM fill. This conclusion is supported by the results of the field settlement program (section 4.3). In the case of the two embankments in this study, and in similar cases where construction is proposed on marginal foundation soils, settlement is primarily a function of the foundation soil and its consolidation characteristics Swell Potential Samples of SDM were also tested for swell pressure in order to determine if SDM could be used in applications where the material would be in contact with structures 42
87 sensitive to swell pressures and excessive deformations. For example, if SDM were used as a base material in roadways, excessive swell pressures and deformations will be detrimental to the integrity of the pavement. For this study, samples of RDM were mixed with 4% Portland cement, % Portland cement, and % Portland cement plus 10% fly ash. Samples were cured in the laboratory for one month and for six months. These samples were then compacted to different densities in order to determine at what point the density level and moisture content would become critical in generating excessive swell pressure and deformation. Swell tests were performed in accordance with ASTM D Table 3.12, below, summarizes the findings for the swell pressure tests: Table Swell Pressure Test Results Sample Type Age (Month) Compacted Moisture % % Max. Dry Density (on wet side) Saturated Moisture % Swell Pressure (tsf) Percent Swell (%) 4% PC % PC % PC % PC % PC % PC % PC % PC % PC + 10% FA % PC + 10% FA % PC + 10% FA % PC + 10% FA
88 A detailed summary of test results is given in Appendix B.6. As noted in the table above, samples were compacted with moisture contents on the wet side and the dry side of optimum. Higher compaction was achieved for the samples compacted with moisture contents on the dry side of optimum. The laboratory data indicate several trends. The strain or percent swell was not significant for any of the samples tested. The strain values ranged from 0.1 to 1.2 percent, with an average of 0.6. The maximum strain belonged to the sample amended with % Portland cement plus10% fly ash (1.2%). This magnitude of volume change is considered low and, therefore, not detrimental to adjacent structures. These laboratory results counter the probable expansion information provided by Holtz and Novak (191), and referenced in Table The swell pressure, however, was high for samples compacted to 94% or higher of their maximum dry density with moisture contents on the dry side of optimum. For these samples, the overall average swell pressure was tsf. The average for onemonth old samples was slightly higher at 1.34 tsf, with an average strain of 1.1%. Table Probable expansion estimated from Classification Data (Adopted after Holtz and Kovacs, 191) Degree of Expansion Probable Expansion as a % of the total volume change (dry to saturated condition) Very High > 30 High Medium Low <10 * After Holtz (1959) and USBR 1974 ** Under a surcharge of 6.9 kpa (1psf) Although strains were not high for any of the samples tested, the swell pressure generated was moderate. For SDM that was mixed with % Portland cement and compacted to 95% of its maximum dry density, the swell pressure was measured as high as 44
89 1.96 tsf. However, considering low associated strains, SDM would not have any detrimental effect on adjacent structures. For samples compacted on the wet side of their optimum moisture content, much lower swell pressures and strains were measured. The average swell pressure for those samples was 0.14 tsf, and the average strain was 0.3%. This results from the fact that fine-grained soils have a flocculated structure at low moisture contents (below optimum moisture content). At moisture contents above optimum, the structure of the soil particles becomes more dispersed and layered. For these structures, additional moisture does not result in significant volume changes Durability Freeze-Thaw Tests The major durability concerns regarding SDM include potential strength loss due to freeze-thaw cycles and moisture variation. The freeze-thaw test simulates the internal expansive forces that result from the moisture in fine-grained soils. The freeze-thaw test avoids the accelerated cement hydration that is necessary to perform the wet-dry test. During freeze-thaw cycles, SDM experiences an increase in volume and a loss in strength. Some soil-cement mixtures have the ability to regain strength under certain conditions; specifically, the availability of reactive Calcium Oxide, adequate temperature and a high ph environment. For SDM, these conditions do not exist; therefore, any strength loss will be permanent. To study the effects of freeze-thaw cycles on SDM, samples were prepared from the three different recipes. The testing was performed in accordance with ASTM D560. Samples were compacted to 5 and 90% of their maximum dry density, as determined by Modified Proctor. To provide a point of reference, a natural clay sample was also tested 45
90 for its behavior during freeze-thaw cycles. The results of the freeze-thaw test are summarized in Appendix B.. According to the test results, none of the samples could withstand more than three freeze-thaw cycles before failing. Significant volume change (ranging from 1.% to 5%) was experienced during testing. Considering that the average volume change for the natural clay sample was 2%, it may be concluded that the freeze-thaw effect is several times more severe for SDM than it is for natural clay. As a result, all SDM should be protected against frost in order to maintain the cement contents within the percentages used for this project. Frost depth in New Jersey is approximately 2.5 to 3 feet. Under these conditions, SDM should be kept at least three feet below the surface. This should apply to both pavements and embankment slopes. Wet-dry Tests Wet-dry tests are conducted to simulate shrinkage forces in cement-modified or soil-cement specimens. Wet-dry cycle tests were conducted on the three different recipes of SDM. Tests were conducted according to ASTM D-559. All of the samples with the exception of one (% 90% Modified Proctor) collapsed before experiencing 12 wetdry cycles. Volume changes were in the range of 10% to 4% of the original volume. Therefore, SDM should be protected against frequent wet-dry cycles. However, if SDM is compacted at moisture contents below the shrinkage limit, the potential for the development of tensile cracks and a consequent loss in strength could be minimized. 46
91 4. FIELD TESTING PROGRAM 4.1 Objective The primary objectives of the field-testing program were as follows: 1) To check the uniformity of the mix by evaluating field cement contents during the mixing process. 2) To perform rapid in-situ compaction tests, such as Humboldt and Clegg hammer, for comparison with nuclear density gauge. 3) To instrument and monitor the embankments with settlement plates, horizontal and vertical inclinometers and extensometers in order to evaluate settlement and horizontal slope deformation. 4) To evaluate the long-term effects of cement/lime curing on the strength gain of the SDM. This was done using CPT sounding within the crown of the embankment on a monthly basis for an initial period of six months, which was later extended to nine months 4.2 Field Cement Content Evaluation In order to evaluate the quality of the mixing procedure at the OENJ Elizabeth facility, the cement content of samples collected from the site was measured for approximately six weeks: from September 29 to November 10, 1. Grab samples of the SDM were collected on a daily basis and transferred to the laboratory for cement content determination using the Standard Test Method for Cement Content of Soil-Cement Mixtures (ASTM D 06 96). The target cement content of % was used the basis for evaluating the test results. 47
92 As a quality assurance measure, laboratory samples were also tested for cement content. These samples were prepared from a representative sample of RDM amended with Portland cement. The pug mill operator, E. E. Cruz, had provided the sample. The test procedure requires that the level of CaO be determined in the raw soil, the cement, the soil-cement mixture and a blank sample. The blank sample required 0 ml of KMnO4. Titration of the Portland cement sample required 45 ml of KmnO4, yielding a CaO content of 63%. Raw soil was determined to contain 0.6% CaO. For the soilcement sample, 33.5 ml of KMnO4 was required for titration, yielding a cement content of 9.3%. All the reported values are for percentage by weight of soil with hydrated cement. If values for dry cement are desired, ASTM D-06, note 12, suggests multiplying these values by The cement content test results are presented in Figure 4.1. As the figure indicates, there is considerable variation with respect to the target cement content of %. Most of the variation can be attributed to problems associated with the original design of the processing plant. Specifically, the system was deficient in regulating the flow of cement into the pug mill. The system was later modified and properly instrumented with flowmeters and aerators placed near the input orifice of the pug-mill. This modification, which was implemented primarily as a result of this study, will help to better achieve the target cement contents. 4
93 OENJ/Elizabeth Cement Content Cement Content (%) % cement content SmplesTested from 9/29/9 to 11/10/9 ASTMD Days Figure 4.1- Field cement content data 4.3 Field Compaction Tests The purpose of the testing program was to attempt to determine the dry density of portland cement stabilized dredge material in-situ by utilizing the Humboldt Stiffness Gauge (HSG) and the Clegg Impact Hammer (CIH) test. Traditional methods of dry density determination via the Nuclear Density Gauge (Troxler test) may not accurately determine the dry density of cement stabilized soils in-situ due to a problem with the device determining the moisture content of the material (Figure 4.2). Therefore, tests utilizing the Troxler test must first determine the wet density of the material and then require a minimum of 12 to 16 hours to oven dry the cement stabilized soil samples for moisture content determination (ASTM D2216 Laboratory Determination of Water (Moisture) Content of Soil and Rock). However, if a methodology could be developed to utilize either the HSG or the CIH for dry density determination, results could be achieved instantaneously, instead of the next day minimum of the Troxler test. 49
94 100 Laboratory Determined Moisture Content (%) y = e x R 2 = Nuclear Gauge Determined Moisture Content (%) Figure 4.2 Nuclear Gauge Determined Moisture Content versus Oven Dried The testing methodology used in this study was to use the manufacturer s procedures for the HSG and current standards for the CIH to predict the dry density of the portland cement stabilized dredge material after field placement. Then, compare the predicted results to the dry density results determined by the Troxler tests, essentially making the Troxler tests the benchmark for comparison. Humboldt Stiffness Gauge (HSG) The Humboldt Stiffness Gauge (HSG) acts as a miniature plate load test. The stiffness is determined by the ratio of the force to displacement (K=P/δ). The HSG does not measure the deflection that results from the weight of the HSG instrument itself. Instead, the HSG vibrates and produces small changes in the applied force that, in turn, produces small deflections that are measured. 50
95 The initial methodology of the determination of dry density via HSG is illustrated in the following equation: ρ O ρ D = (1) 0.5 C K where, C = P ( σ ) C 1 4a 1 ( 1 υ) C 1 = a function of moisture and soil type σ 1 = the overburden stress P = typically between 0.5 and 0.25 υ = poisson s ratio ρ D = the dry density of the soil ρ O = the ideal, void free density K = stiffness As described and recommended in the Soil Stiffness Gauge User Guide provided by the manufacturer, to utilize the equation (1), C must first be defined for the soil type, independent of everything except moisture content and density. Therefore, C was solved for and calibrated on the cement stabilized dredge material compacted in the field. This provided a realistic location for the density measurements; however, this created a narrow band of wet densities to calibrate the device. The narrow calibration band led to sensitivity problems with the device as shown in Figure 4.3. As can be seen from the figure, a majority of the predicted values fall within 60 to 65 pcf, illustrating the lack of sensitivity. 51
96 Dry Density from Humboldt (pcf) Number of Data Points = Dry Density from Troxler (pcf) Figure 4.3 HSG Predicted Dry Density versus Nuclear Gauge Clegg Impact Hammer (CIH) The Clegg Impact Hammer (CIH) is a cylindrical hammer of similar shape to a proctor compaction hammer. Inside the hammer is an accelerometer that measures the deceleration of the hammer falling from a designated drop height of 1 inches. The deceleration is then interpreted as a Clegg Impact Value (CIV). It is this CIV parameter that can be correlated to dry density of soil using the following assumptions: 1) The stiffer (more dense) the soil is, the faster the cylindrical hammer will stop; and 2) The softer (less dense) the soil is, the slower the cylindrical hammer will stop. 52
97 The correlation of the CIV to dry density for portland cement stabilized dredge material was conducted in the laboratory. Dredge material was first compacted in compaction molds and once the wet density of the soil was determined, a CIH test was conducted. Soil was then taken from the compaction mold and placed into an oven for 4 hours. After the 4-hour drying period had expired, the moisture content was determined, and, in turn, the dry density. The regression equation from the laboratory correlation is shown as equation (2). ρ = 5.222(ln( CIV )) (2) D where, ρ D = dry density in pounds per cubic feet CIV = Clegg Impact Value Figure 3 shows the results of 33 field tests where the Clegg Impact Hammer test was used in conjunction with the Troxler test. As shown in the figure, the Clegg Impact Hammer also has sensitivity problems, even more so than the Humboldt Stiffness Gauge. A majority of the points occurred between 63 to 66 pcf. 53
98 Dry Density from Clegg (pcf) Number of Data Points = Dry Density from Troxler (pcf) Figure CIH Predicted Dry Density versus Nuclear Gauge Field Compaction Results As shown from both Figures 4.3 and 4.4, the HSG and the CIH did not have the necessary sensitivity needed to accurately predict the dry density measured from the nuclear density gauge and oven drying. Therefore, the final recommendation for both devices is inconclusive at best. The results indicate that the HSG measured compaction characteristics accurately, provided the samples were within a specific range of moisture content for which the HSG had been calibrated. If the moisture content fell outside of this range, significant deviation was observed. Since a non-nuclear method of density determination is needed, it is recommended that the devices be studied further with a far more extensive calibration program for cement stabilized dredge material than the typical calibration procedure recommended by the manufacturers. 54
99 4.4 Field Settlement Monitoring Settlement Plates A total of 15 settlement plates were installed to monitor the settlement of the foundation soil at the footprint of each embankment as well as the settlement within the SDM that had been used in the construction of the embankments. Settlement plates are 3 by 3 steel plates with 10-foot steel riser rods welded to the center of the plate. Of the 15 settlement plates, nine were installed within Embankment 2 (plates 1 to 9), and six were installed within Embankment 1 (plates 10 to 15). Within Embankment 2, Plates 1 to 6 were installed at the base, plates 7 and were installed five feet above the base and plate 9 was installed ten feet above the base. The height of the embankment was 13 feet at the summit. Within Embankment 1, settlement plates 10 to 15 were installed at the base to monitor the embankment s differential settlement. Approximately 10 feet of SDM was placed at the summit of embankment # 2. Settlement plates 1-6 and monitored settlement within the foundation soil at the footprint of the two embankments. Non-uniform settlement within the foundation soil, resulting from the heterogeneous nature of waste material and the nominal compaction of the fill, could produce soil failure. To mitigate this problem, a high strength geosynthetic fabric was installed at the base of each embankment. The use of the geosynthetic fabric has resulted in a more uniform settlement throughout the entire foot print area of the embankments, thereby preventing foundation soil failure. At Embankment 2, settlement plates 7 and were installed five feet above the base and 20 feet to the west of plates 3 and 4, respectively. As a result, any differential 55
100 settlement measured between plates 7 and 3 or between plates and 4 could only be attributed to the settlement within the SDM, irrespective of base settlement. Additionally, plate 9 was installed ten feet above the base and 20 feet to the east of plate 3 to monitor the settlement within the bottom ten feet of the SDM. The settlement of the embankments was monitored during a 500-day period: May, 19 to October, During that time, 1 sets of readings, at various intervals, were taken by McCutcheon Associates, P.A., Secaucus, New Jersey. The elevations of the inner rods were recorded in reference to a benchmark within the Jersey Garden s Mall site. Readings were taken to within 0.01-foot accuracy. A summary analysis of the monitoring program is presented in Figure 4. through According to Figure 4., the base settlement for Embankment 2 ranged from 1 to 1.32 feet, not including plate 4. Foundation soil at the location of plate 4 included controlled fill that had been placed over the Great Ditch pipe. This resulted in lower settlement measurements (0.7 feet) relative to the rest of the embankment. The maximum settlement was measured at plates 2 and 3, where the largest amount of SDM had been placed. An increase in the rate of settlement was due to the placement of additional soil layers during construction. The implementation of a high strength geosynthetic fabric limited the amount of differential settlement to 0.32 feet, or 3. inches, along the longitudinal axes of the embankment. The transverse differential settlement was 6.5 inches, as measured between plates 3 and 4. None of these settlements is considered excessive and they did not result in soil failure as the majority of the settlement happened during construction. The report entitled, Site Investigation & Foundation Analysis for NJDOT Embankment Demonstration Project, November 1, predicted that the maximum settlement that would result from the placement of 20 feet of SDM at the location of Embankment 2 was 1. ft, or 22 inches. Using the primary consolidation model, assigning a compression ratio of 0.15 for refuse and 0.2 for the organic layer, and adjusting the 56
101 loading to account for field conditions (placing 13 feet of SDM instead of 20 feet) the predicted settlement would be 1.4 feet. The actual measured settlement in the field averaged 1.2 feet. Therefore, the primary consolidation model gives a reasonably accurate value for settlement, considering the heterogeneous nature of waste material. For similar projects, it is recommended that the primary consolidation model be used along with a site-specific coefficient of compressibility CR= (C c /1+e o ) for waste material. Settlement due to secondary consolidation, assuming a for the Coefficient of Secondary Consolidation (Cα), is negligible. Time (days) Settlement (ft) Settlement Readings (Embankment 2) Plate 1** Plate 2 Plate 3 Plate 4 Plate 5 Plate 6 Figure 4.. Measured settlement at the base of embankment 2 Figure 4.9 shows the foundation soil settlement at the footprint of Embankment 1. At Embankment 1, as at Embankment 2, a high-strength geoosynthetic fabric was placed at the base to minimize the differential settlement throughout the length of the embankment The maximum settlement recorded was 1.26 feet, at the location of plate 12. The maximum differential settlement was 0.9 feet, between plates 10 and 12. As mentioned earlier, the reason for this degree of settlement was that the foundation soil had not been 57
102 improved. For road embankments, such high differential settlement would be detrimental to the pavement structures. Therefore, to stabilize the foundation soil where layers of compressible soil exist, dynamic compaction or preloading is required. 0 Time (days) Settlement (ft) Plate 10 Plate 11 Plate 12 Plate 13 Plate 14 Plate 15 Figure 4.9. Measured settlement at the base of Embankment 1 For Embankment 2, the settlement for plates 3 and 7 is shown in Figure 4.10, the settlement for plates 3 and 9 are shown in Figure 4.11, plates 7 and 9 in Figure 4.12, and plates 4 and in Figure Considering the sixty-day reading as the baseline (taken one week after plate 9 was placed and when each of the other plates had already been read once), the relative displacement between the two plates is 0.03 feet. Moreover, a comparison between the readings for plates 3 and 9 (which indicates the settlement within the ten feet of SDM) shows a 0.03-foot increase in the thickness of SDM over that area. This increase could be due to a surveying error or to a swell caused by an increase in the moisture content within the SDM. In general, for both locations, no significant settlements were measured. 5
103 0 0.2 Time (days) Plate 3 Plate 7 P7-P3 Settlement (ft) Settlement Readings (plates #3 & #7) Figure Settlement comparison for plates #3 and #7 Embankment 2 Settlement (ft) Time (days) Settlement Readings (plates #3 & #9) Plate 3 Plate 9 P9-P3 Figure Settlement comparison for plates #3 and #9 Embankment 2 59
104 Settlement (ft) Time (days) Settlement Readings (plates #7 & #9) Plate 7 Plate 9 P9-P7 Figure Settlement comparison for plates #7 and #9 Embankment 2 Serttlement (ft) Time (days) Settlement Readings (plates #4 & #) Plate 4 Plate P-P4 Figure Settlement comparison for plates #4 and # Embankment 2 60
105 According to the laboratory consolidation tests, SDM amended with % Portland cement and compacted to 60% - 1% of its modified maximum dry density has a Compression Ratio (C c ) in the range of 0.22 to 0.9. Void ratios range from 1.22 to It should be notes that these values are highly dependent on the compaction applied during the remolding of laboratory samples. If the samples are compacted to 75% or more of their modified maximum dry density (as they were in the field), the pre-consolidation ratio will be higher than 6.4. This is equal to a surcharge twelve times greater than what the placed SDM experienced in the field. The C c for the initial portion of the consolidation curve is approximately 0.0. Using this value and the applied load equivalent of 10/2=5 feet of SDM, or 0.25 tsf (5x10 2 pcf), the anticipated settlement is 0.01 feet, (0.12 inch). The field settlement measurement is in keeping with laboratory test results. In addition to its own weight, the SDM used in embankments will experience the weight of overlying pavement and vehicular loads. These loads will add approximately 0.4 tsf to the applied loads, and will add ft (0.0 inches) to the settlement. Therefore, the anticipated total settlement would be 0.2 inches, assuming that ten feet of SDM were used. If, however, 20 or 30 feet of SDM were used, the total anticipated settlements could increase to 0.4 inches and 0.6 inches, respectively Horizontal Inclinometers In addition to settlement plates, horizontal inclinometers were used to obtain highresolution profiles of the settlement under Embankments 1 and 2. The position of the inclinometers is shown in Figure A detailed explanation of the measurements and inclinometer testing is provided in Appendix C.3. A summary of the relative deflection readings for both embankments is given in table
106 Table 4.1- Measured vertical settlement Embankment 1 Max. Cumulative Displacement.[in] Embankment 2 Max. Cumulative Displacement.[in] 1 10/01/ Zero level 10/0/ Zero level 2 11/23/ /25/00 Not successful 3 01/04/ /06/ /16/ /1/00 Not successful 5 05/16/ /19/ /02/ /26/ There was also settlement for both reference points of approximately 7.2 for embankment 1 and 7.5 for embankment 2. So the maximum total settlement values were 12.7 and 13.4 inches for embankments 1 and 2, respectively Magnetic Extensometer In order to determine the degree to which fill and foundation soils affected the total settlement values, a magnetic extensometer was installed on the crown of Embankment 1, as shown in Figure


107 Figure Installation of magnetic extensometer on Embankment 1 A detailed explanation of the extensometer and of the installation procedure is provided in Appendix C.3. The extensometer was installed on March 16, 2000 and readings were taken until September 2, Based on the readings, taken from the location of three spider magnets within the borehole, no noticeable settlement was observed within the fill of Embankment 1. This suggests that the foundation soils are primarily responsible for the overall settlements. 63
108 Newark Bay North 0' 50' A Horizontal QC casing Vertical QC casings Horizontal QC casning A Embankment 1 Embankment 2 Elevation contour interval at approximately 2.5 feet 26.0' Section A-A 25.0' 7.5' Fig. 11 The schematic of embankments and installed casings Figure The schematic of the embankments and installed casings 64
109 In summary, SDM that was compacted to 5% of its modified maximum dry density (according to field compaction specification) experienced little or no settlement under the given embankment loads. According to the settlement plate data and the magnetic extensometer, only 0.03 feet of settlement was measured within ten feet of SDM under its own weight. This degree of settlement would have little, or no, adverse effect on the integrity of pavement structures. Furthermore, the settlement would continue to remain negligible even if the height of embankment reached 20 or 30 feet. 4.5 Slope Deformation Monitoring In order to monitor the horizontal movement of the embankment fill, four vertical inclinometer ducts were installed, as shown in figure Specifically, one was installed at the top and at the toe of each embankment. Both toe ducts reached a depth of 2 feet, while both top ducts reached a depth of 3 feet. The position of the inclinometer casings is shown in Figure Five sets of readings were taken from November 23, 19 through September 2, Specifically, readings were taken on 11/23/, 12/26/, 3/16/00, 5/15/00 and 9/2/00. Summaries of inclinometer data and of the magnitudes of lateral deformations are presented in Figures 4.16, 4.17, 4.1, and 4.19 for Embankments 1 and 2, as noted. As shown in the figures, lateral deformations were negligible for both embankments and were not a matter of concern. The maximum amount of lateral deformation, as measured from the inclinometer installed at the top of Embankment 1, was 0.3 inches, which occurred at the border of the embankment base and the top of the foundation soil (waste material). The maximum amount of lateral deformation in Embankment 2 (0.2 ) also occurred at the interface of the embankment base and the top of the foundation soil. 65
110 Refuse Fill Pit/Silt Sand Slope 2:1 Figure Schematic diagram of vertical inclinometer casings 66
111 A - Axis Deformation (inches) B - Axis Deformation (inches) Depth (ft) 20 Depth (ft) /26/ Series /16/ Series2 5/15/00 Series3 9/2/00 Series Figure Inclinometer data for Embankment 1, Top of Embankment 67
112 A - Axis Deformation (inches) Series1 12/26/ B - Axis Deformation (inches) Series2 3/16/ 5 Series3 5/15/00 Series4 9/2/ Depth (ft) 15 Depth (ft) Figure Inclinometer data for Embankment 1, Bottom of Embankment 6
113 A - Axis Deformation (inches) B - Axis Deformation (inches) Depth (ft) 20 Depth (ft) Series1 12/26/ 35 Series2 3/16/ Series3 5/15/ Series4 9/2/00 40 Figure 4.1. Inclinometer data for Embankment 2, Bottom of Embankment 69
114 A - Axis Deformation (inches) Series1 12/26/ 0 B - Axis Deformation (inches) Series2 3/16/ 5 Series3 5/15/00 Series4 9/2/ Depth (ft) 15 Depth (ft) Figure Inclinometer data for embankment 2, toe of Embankment 70
115 4.6 Monitoring of Strength Gain/Loss In order to monitor the integrity of the embankments over time, CPT soundings were taken at various intervals throughout the course of the project. The details of the equipment used and the data obtained from the different readings are given in Appendix C.4. After embankment construction was completed, CPT soundings were taken at various times to determine whether or not the material experienced a gain or loss in strength over time. Soundings were conducted one month, three months, six months, and 12 months after the embankment construction was completed. The CPT soundings were conducted on top of each of the embankments in order to achieve the maximum possible penetration depth. For comparison purposes, soundings were taken from numerous locations within each embankment. These locations were within a 15-foot diameter region, shown in figure The rationale for the 15-foot diameter region is the disturbed soil zone left by each penetration. To avoid the possibility of a CPT sounding being influenced by a previous test, the 15-foot diameter region was implemented. The CPT was set-up specifically to measure tip resistance and side friction, since the location of the water table was well below the base of the embankments. Appendix C contains all of the CPT results, and individual CPT plots for the respective embankments at various times. Analysis of CPT Results For the purpose of monitoring the integrity of the SDM over time, the information concerning both the soil classification and soil profiling was not required. However, the CPT tip resistance and friction ratio data indicate that the material may be consistently classified as a silt mixture (clayey silt to sandy silt). This was consistent with the results of laboratory tests. 71
116 Newark Bay North 0' 50' A Horizontal Q13C casing5 Vertical Q C casings 10 9 Horizontal QC 7 casning A Embankment Embankment ' Section A-A 25.0' Embankment #1 Embankment #2 7.5' Figure 4.15 Location of the CPT Tests for the Embankment Monitoring Fig. 11 The schematic of embankments and installed casings 72
117 The CPT tip resistance provides an excellent parameter for measuring strength gain or loss. To monitor strength gain/ loss, CPT soundings were conducted for a period of one year. Figure 4.16 presents a comparison between the CPT soundings at one month and the soundings at twelve months. For all of the comparative plots, the one-month CPT is represented by a black line, and the comparative time data are represented by the gray line. As indicated in Figure 4.16 and in the data in Appendix C.4, there is no evidence of a significant strength gain or loss in the embankment. This was true for all of the locations at each embankment. Sounding Name: Location #1 Depth to Water: Client: OENJ/NJDOT Date: Oct. - Oct. Comparison (1 Year) Project: Dredge Embankment #2 Project Location: Elizabeth, NJ Local Side Friction (tsf) Friction Ratio (%) Tip Resistance (tsf) Su (psf) - Nk = Soil Profile Depth (ft) 7 Depth (ft) 7 Depth (ft) 7 Depth (ft) Figure
118 In addition, for comparison purposes, the results of the SPT soundings were measured against the un-drained shear strength (S U ) of the material. The N kt method, as described in Appendix C.4, was used to determine the un-drained shear strength of the material. An N kt value of 15 was used for the analysis and the results were in good agreement with the Unconsolidated, Undrained, Triaxial shear strength results determined in the laboratory (see Appendix C). Therefore, it can be concluded, based on the tip resistance and the un-drained shear strength analyses, that the SDM, once placed, experiences no significant loss or gain in strength over the course of one year. 74
119 5. CONCLUSIONS As part of a project to evaluate the potential for beneficially re-using SDM in transportation applications, two embankments were successfully constructed at the OENJ Elizabeth site using SDM as construction material. The project had two main objectives: 1) to assess the feasibility of using SDM as structural fill material for the construction of roadway embankments, and 2) to evaluate the geotechnical characteristics of SDM, i.e., workability, strength and durability, under service loads. The project began in the spring of 19 and was completed by October The project consisted of field evaluations and laboratory testing. The field component consisted of: 1) work related to the design of the embankment foundations, and 2) field monitoring of the construction and performance of the embankments for approximately one year after construction had been completed. The laboratory testing, which began before field construction and was not completed until January of 2001, assessed the strength, compressibility, workability and durability of SDM according to ASTM and AASHTO standards. Overall, the geotechnical properties of SDM were satisfactory for the construction of the two embankments. Similarly, both the analysis and subsequent field monitoring indicated that the stability of the embankment slopes was satisfactory. There were, however, concerns about the durability of the material under service conditions. The laboratory freeze-thaw and wet-dry cycles indicated that SDM is susceptible to a loss of material integrity under these conditions. Following is a summary of conclusions and recommendations for the different phases of the project. 75
120 5.1 Embankment Foundation Investigation Both embankments were placed on consecutive layers of refuse fill, 19 to 23 of peat and elastic silt, and 5 to 10 of sand. The initial settlement estimates indicated excessive settlements; up to 21 for Embankment 1, and up to 17 for Embankment 2, each with the potential for differential settlements. The results of the field settlement monitoring program, which included settlement plates, horizontal inclinometers and a magnetic extensometer, showed settlement values of approximately 15.6 for Embankment 1, and 15. Embankment 2. The extensometer data showed no noticeable settlement within the SDM fill and thus attributed most of the settlement to foundation soil. Settlement plate data indicated minimal differential settlement for both embankments, and thereby demonstrated the geotechnical benefits of using a geosynthetic fabric at the interface of the SDM and foundation soil. In conclusion, SDM fills, with the size and specifications of this project, can be successfully constructed on marginal foundation soils if proper soil improvement is performed prior to the placement of such fills. Placement of a geosynthetic fabric is one option that worked successfully for this project, but other improvement techniques, such as preloading or deep dynamic compaction, could also have been considered. 76
121 5.2 Laboratory Investigation The objectives of the laboratory investigation were two-fold: 1) to determine the material strength properties of the CDM and its potential for use in the construction of the proposed embankments, and 2) to determine the geotechnical properties of the CDM to assess its potential for use in high volume applications, such as fills, embankments, and roadway base materials. In order to realistically determine the behavior of CDM under field conditions, the selection of admixtures, the curing time and the placement process used in laboratory testing approximated, to the extent possible, field operations The laboratory investigations mainly consisted of standard ASTM and AASHTO tests for classification, strength (including resilient modulus evaluation under dynamic loads), compressibility and durability. The rationale and the methodologies used for selection of admixtures, curing time and placement process followed the sequence of field operations in order to determine the behavior of CDM in a more realistic manner. A detailed account of the preparation of test samples and on the laboratory testing is presented in Section 3 of this report. Following is a summary of the results. Classification The SDM used in this project is characterized as elastic silt (MH) with a moderate organic content (% average). It also contains low percentages of fine sand and clay. With respect to the Plasticity Chart, SDM lies below the A-line and to the right of the LL=50 line. Compaction The moisture content of dredged material is highly variable, however RDM is, on average, one third solids and two-thirds liquid. In order to solidify the dredged material for 77
122 structural fills, it is recommended that pozzolanic admixtures be added to increase workability and improve engineering properties. Compaction greatly improved the engineering properties of SDM. A comparison between samples compacted to 5% and 90% of their maximum dry density showed a considerable increase in shear strength. Moreover, samples amended with 4% Portland cement and compacted to 5% of their maximum dry density had shear strength sufficient for embankment slope stability. A slope stability analysis indicated safety factors were all above 2, even for 1V: 1.5H slopes. Inclinometers reading also indicated only minimal movement or instability within the slopes. Shear Strength The addition of admixtures produced no significant change or trend in the magnitude of frictional angle, ϕ. A general comparison of SDM with typical soil-cement and cement-modified soils indicated that for the same amount of cement, and approximate compaction effort (90% of optimum for SDM, and at optimum for soil-cement) soilcement or cement-modified soils are denser than SDM, have a slightly a higher friction angle, and have a much higher cohesion intercept under triaxial shear conditions. One reason for the reduced cohesion of SDM is that, during the process of remolding for compaction, parts of cementitious bonds between hydrated cement particles and the soil matrix become broken. Unlike typical soil-cement or cement-modified soils where hydration and curing take place immediately after compaction, and where compaction prior to curing causes soil grains to be forced into direct contact with the cement grains, the sequence of sample preparation in the case of SDM is reversed and some of the previously gained strength is lost during the break-up upon compaction. Temperature had a major effect on the curing process of SDM. At temperatures below 40 F, pozzolanic reactions slow down and, as a result, the rate and amount of moisture reduction and strength gain became insignificant. Therefore, it is recommended 7
123 that SDM be placed during warm seasons (e.g., April through October in New Jersey). Adding high percentages of Portland cement to reduce the effects of low temperatures is not economically feasible, as the additional cement would not result in significant improvements in engineering properties. Resilient Modulus Resilient modulus measures the strength of sub-grade soils under dynamic vehicular loads. The resilient modulus values for all of the samples tested compared well with three sub-grade soils that are currently under New Jersey roadways. The test results indicated that SDM compares well with the sub-grade soil used on Route 23 and that SDM has a slightly higher modulus than the sub-grade soils in Route 206 and Route 295. Consolidation The compression index (C c ) values for SDM ranged from 0.22 to 0.9. In general, the compression index did not exceed 0.5 for any of the samples, once the samples had been compacted to 1%. Therefore, a P c of 2 tsf or more should be expected. The compression ratio (C R = C c /1+e 0 ) varied from 0.05 to This value did not exceed 0.19 for samples compacted to 3% or above. Based on the compaction testing, and on subsequent field-testing, it can be concluded that SDM embankments up to 30 feet in height could be constructed with only minimal settlement within the SDM fill. As demonstrated, settlement is primarily a function of the foundation soil and its consolidation characteristics. Permeability The permeability of the compacted SDM was typically less than 10-7 cm/sec. On the wet side of the optimum, additional compaction further reduced the permeability of 79
124 SDM. Additional fly ash also helped in reducing permeability. Based on this study, SDM could be used for impermeable caps in landfills or other contaminated sites. Swell Potential The strain or swell percentage was not significant for any of the samples tested. The strain values ranged from 0.1% to 1.2%, with an average of 0.6%. This magnitude of volume change is considered to be low and, therefore, not detrimental to adjacent structures. The maximum strain (1.2%) was recorded for the samples amended with % Portland cement and 10% fly ash. The swell pressure, however, was high for samples compacted to 94% or higher of their maximum dry density with moisture contents on the dry side of optimum. For these samples, the average swell pressure was tsf. The average for one-month old samples was slightly higher, at 1.34 tsf, with average strain of 1.1%. Although strains were not high for any of the samples tested, the swell pressure generated was moderate. For SDM that was mixed with % Portland cement and compacted to 95% of its maximum dry density, the swell pressure was measured as high as 1.96 tsf. However, considering low associated strains, SDM would not have any detrimental effect on adjacent structures. However, for samples compacted on the wet side of optimum moisture content, much lower swell pressures and strains were measured. The average swell pressure for these samples was 0.14 tsf, and the average strain 0.3%. Durability The three different recipes of SDM were subjected to durability (freeze-thaw) tests. The results from these tests indicate that SDM is extremely susceptible to frost (several times more susceptible than natural clay) and should be placed below frost line. The three SDM recipes were also subjected to wet-dry tests to evaluate the material s potential for shrinkage. Based on the wet-dry tests, proper soil cover needs to be provided at all times 0
125 to minimize strength loss and erosion. Compacting SDM at moisture contents below the shrinkage limit would minimize the potential for tensile cracks and thereby minimize any further strength loss in the material. 5.3 Field Investigation The main objective of the field investigation was to monitor the integrity of the embankments over a period of one year and to record changes in settlement, horizontal deformation, and strength gain/loss over time. The filed investigation also included testing and evaluation of Humboldt Stiffness Gauge and Clegg Hammer device as compaction control tools for large-scale placement of SDM. Field Determination of Cement Content SDM samples were collected during processing and tested for cement content, which ranged from 4% to 20%. Although the target cement content was %, samples with 4% were laboratory tested to determine how the SDM would behave if the target cement content was not achieved. The overall engineering characteristics of the mix were satisfactory for road embankment applications. However, it is recommended that the stabilization plant be better instrumented to more precisely control percentages of additives mixed with the RDM. Field Compaction Control Field compaction tests were performed in order to determine the dry density of insitu SDM amended with Portland cement. The nuclear density gauge is commonly used for density control. For cement-stabilized soils, however, the nuclear gauge underestimates moisture contents resulting in overestimating dry density and strength parameters. For this 1
126 study in addition to nuclear gauge, Humboldt Stiffness Gauge (HSG) or the Clegg Impact Hammer to determine dry density was evaluated. The objective was to determine whether these tests could provide rapid and accurate estimates of SDM s moisture content and dry density. The results indicate that the HSG measured compaction characteristics accurately, provided the samples were within a specific range of moisture content for which the HSG had been calibrated. If the moisture content fell outside of this range, significant deviation was observed. Therefore it is recommended that, prior to using the HSG in the field, samples of SDM with a wide range of densities and moisture contents should be prepared. The HSG should be calibrated for all of these pre-determined densities and moisture contents. It is also recommended that the manufacturer s formula for calculating density be overlooked, as the empirical factors in the formula were calculated for conventional structural fill (sandy fill). These factors should be recalculated for SDM. The data analysis from CIH test was inconclusive and no specific recommendations can be made regarding the use of this device in SDM applications. Settlement and Lateral deformation Monitoring The field settlement-monitoring program consisted of installing settlement plates, horizontal inclinometers and extensometers for measuring vertical deformations in Embankments 1 and 2. The results of the monitoring program and an analysis of the data are presented in Chapter 4. For both embankments, the measured vertical settlement was in the range of 15 to 16 inches from settlement plates, and 12 to 14 inches from horizontal inclinometers (transverse centerline). These were lower than the predicted values estimated from initial foundation investigation study, which ranged from 17 to 21 inches for embankments, 1 and 2, respectively. The differential settlement was minimal, for both cases. It ranged from 1 to 2 inches, thus showing the effectiveness of placing geosynthetic fabric at the interface of the SDM fill and the foundation soil. The extensometer reading 2
127 and settlement plate data indicated negligible vertical deformation within the SDM itself, which demonstrates that the foundation soil is the primary cause of vertical settlement.. Vertical inclinometer ducts were installed to monitor the lateral movement of the embankments. The inclinometer readings indicate that lateral deformations were negligible for both embankments and were of no concern. The maximum lateral deformation (approximately 0.3") was at the top of Embankment 1 and had no impact on the stability of the slope. Strength Gain/Loss Monitoring In order to monitor the integrity of the embankments over time, a series of CPT soundings were taken at various intervals during the course of the project. The monitoring data were used to provide evidence of either a gain or loss of strength over time. The CPT soundings were conducted on top of each of the embankments in order to achieve the maximum possible penetration depth. Based on the CPT soundings, there was no significant strength loss or gain within the embankments over the course of one year. This was observed for all locations on both embankments. In addition, for comparison purposes, the results of the SPT soundings were measured against the un-drained shear strength (S U ) of the material. Based on these comparisons, it can be concluded that the SDM, once placed, experiences no significant loss or gain in strength over the course of one year. This was expected due to the fact that the SDM had been disturbed during the process of excavation and transfer to the embankment sites from the holding sites where the material had achieved most of its strength gain as a result of cement addition. Cement treated soils and naturally cemented soils are sensitive to disturbance, as shown by Mitchell (193), and the SDM that was compacted on these locations had already gained its strength prior to partial break-up and movement to the site. 3
128 It is therefore, recommended that in future applications, SDM processing and placement follow these steps: 1) Add enough cement, lime, cement kiln dust, fly-ash and/or other admixtures that are needed for workability and stabilization, and place the SDM on designated holding or storage sites for potential beneficial re-use. 2) Following the reduction of water content to appropriate levels, move the material to the designated project site, and then add the appropriate cement (or other admixtures) needed for strength prior to compaction. In other words, the placement and compaction procedure should be similar to the process used in soil-cement or cement-modified soils applications. 6.0 RECOMMENDATIONS The work performed in this demonstration project needs to be continued to include the evaluation of the test structure under field dynamic loads, and especially evaluate the effect of moisture on durability under field conditions. It is, therefore, recommended that an additional demonstration project incorporating SDM with different admixtures and coverage designs be initiated, similar to those performed for soils mixed with shredded tires (Humphrey, 13). This project should include at least 1000 linear feet of low traffic roadway with a minimum depth of six feet of SDM to be tested and monitored under vehicular load. The results of the study presented here and those to be determined under vehicular loads could provide the basis for practical usage of SDM in roadway applications. 4
129 7. REFERENCES Balmar, G. G., Shear Strength and Elastic Properties of Soil-Cement Mixtures Under Triaxial Loading, PCA, Bulletin# D32, 195. Clough, G. W., Sitar, N., Bachus, R. C., and Rad, N., Cemented sand under Static Loading, JGED, ASCE, Vol. 107, No. GT6, 191, pp Cotton, M. D., Soil-Cement Technology A Resume, Journal of the PCA research and Development laboratories, Vol.4, No.1, 1962, pp Holtz, R. D., and Kovacs, W. D., An Introduction to Geotechnical Engineering, Prentice-Hall, 191. Humphrey, D. N. and Eaton, R.A., Tire Chips as Insulation Beneath Gravel Surface Roads. Cold regions Research and Engineering Laboratory, Hanover, New Hampshire, 13. Kezdi, A., Handbook of Soil Mechanic, VEB Verlag fur Bawsen, Berlin, Landva, A., and Clark, J. I., Geotechnics of Waste Fills, ASTM STP 1070, 10, pp Morris, D. V., and Woods, C. E., Settlement and Engineering Consideration in Landfill and Final Cover Design, ASTM STP 1070, 10. Oweis, I.A., and Khera, R. P., Geotechnology of Waste Management, PWS Publishers, 1. Uzan, J., Characteristics of Granular Material, TRB record 1022, TRB, National Research Council, Washington, D. C., 195, pp Van Riessen, G. J., and Hansen, K., Cement-Stabilized Soil for Coal retaining Berms, ASCE, Geotechnical STP # 30, 12, pp
130 6
131 APPENDIX E Air Study
132 APPENDIX E-1 Report by Dr. Clifford P. Weisel and Dr. Paul J. Lioy, University of Medicine and Dentistry of New Jersey. for Sub-Contract Agreement for OENJ / NJDOT Roadway Embankment Pilot Project dated January 5, 2000
133
134 Report to Sadat Associates, Inc. for Sub-Contract Agreement for OENJ/NJDOT Roadway Embankment Pilot Project Prepared by Clifford P. Weisel, Ph.D. Paul J. Lioy, Ph.D. University of Medicine and Dentistry of New Jersey Environmental & Occupational Health Sciences Institute 170 Frelinghuysen Road Piscataway, NJ 054 May 16, 2000
135 PURPOSE Area and personal samples were collected during the placement of dredge material at ONEJ Metromall roadway embankment test construction site in Port Elizabeth, NJ during late April/May 19 (spring sampling) and June/July 19 (summer sampling) to ascertain if the use of contaminated dredge material would potentially lead to exposing the surrounding community and workers to elevated airborne levels of dust, heavy metals, polynuclear aromatic hydrocarbons (PAH), pesticides or polychorobiphenyls (PCB). METHODOLOGY Personal samples were collected from workers operating heavy equipment (bulldozers, dump trucks and rollers), supervisors and workers on the ground manipulating the soil/sludge manually. Specific individuals wore samplers that were analyzed for priority trace metals (NIOSH Method 7300), priority pesticides and polychorobiphenyls (NIOSH Method 5503) and polynuclear aromatic hydrocarbons (NIOSH Method 5506/5515), during an entire working day, exclusive of lunch. Respirable dust (NIOSH Method 0600) was sampled for two hours based on sampling volume limitation of NIOSH Method The personal air samples were analyzed by Princeton Analytical Laboratories, Princeton, NJ. Area samples were collected during active construction between 7am and 4pm using high volume area samples (EPA 193, NJ DEP personal communication). During the spring sampling period, upwind and downwind area filter samples were collected for five or six days using a single quartz fiber filter (Schleicher and Schuell No. 25, 20x25cm). During the summer sampling period, upwind and downwind quartz fiber filter, with a polyurethane foam (PUF) plug (0.049 g/cm 3 density), and crosswind filter samples were collected for two or three days. The filter or filter with the PUF backup samples 1
136 were stored covered with plexiglass sheet while mounted in their holders in a refrigerator or ice chest containing blue ice between sample collection. This was done to minimize any contamination or losses of volatile species between sampling. After weighing, the filter was split into two portions. One portion of the filter and the PUF sample was analyzed for polynuclear aromatic hydrocarbons using gas chromatography-mass spectrometry and for polychlorinatedbyphenyls and selected pesticides by gas chromatography with 63 Ni electron capture detector (Franz and Eisenreich 1; Simcik et al 1) at the Department of Environmental Sciences at Rutgers University, New Brunswick, NJ, under the direction of Dr. S. Eisenreich and the second for metals using a modification of EPA Method 200. for Inductively Coupled Plasma-Mass Spectrometry analysis of metals at the Environmental and Occupational Health Sciences Institute, Piscataway, NJ, under the direction of Dr. B. Buckley. The area samplers (Graseby General Metals Works High Volume Samplers, two of which were borrowed from NJ DEP and all of which are the type used within the NJ DEP ambient air particulate monitoring network) were placed between 20 and 50 meters from the edge of the active work area in the designated wind direction relative to the construction site. The wind direction was ascertained each morning from the meteorological station located on site. If the wind direction shifted during the sampling day the sample collection was either discontinued for that day or the samplers were moved to the proper orientation to the wind relative to the construction site. Most days had a constant wind direction, so no adjustment to the sampling location was necessary after the initial placement of the sampler. (Appendix A). The flow rates (nominally between 10 and 30 cubic feet per minute) were checked each day before and after 2
137 sampling and at other times of the day, using a Magnehelic, which had been calibrated using a Rootsmeter (EPA 193). The personal samplers, except the respiratory-size particle sampler, were placed on the workers at approximately 7:00 am and returned to the field personal prior to the lunch time break. The same samplers were replaced on the same workers after lunch and were retrieved at the end of the work day. The respirable particle sampler was placed on a worker for a two hour time period when the worker was going to be actively working at the site. All personal air sample pumps were constant flow pumps (SKC Aircheck or Ametek Model MG-4) were calibrated before and after sampling to be within the NIOSH specified range using a bubble flow meter. Nominal flow rates were respirable - 2.2l/m; PAH l/m; elemental 1.9l/m; and PCB 0cc/min. The activity of each person wearing a pump was recorded. RESULTS Almost all metals, PCB, pesticides and PAHs were below detection in the personal air samples (Tables 1-3). Measurable levels of chromium, lead, thallium, zinc, anthracene, benzo(e)pyrene, and naphthalene, were obtained but these air concentrations are well below any occupational standards indicating that no adverse health impact to the workers would be expected due to the activities performed by the workers. The personal respirable particle levels were below detection during the spring sampling, but measurable levels were found in the summer samples (Table 4). Complaints were registered by one of the workers about the high levels of the dust in the work area. During the summer the soil was dryer resulting in the generation of greater airborne dust. The respirable air concentrations, however, were below the 3
138 NIOSH standard and action level. It is recommended that during future activities of the type encountered by the workers at this site, actions be taken to decrease the airborne dust levels. One possible and routinely used method is periodically wetting the surface during the day. The area samples had measurable concentrations of metals, PCBs and PAHs in all of the samples (Tables 5-7). The area samples had measurable concentrations while the personal samples did not because of the greater volume of air collected by the high volume area sampler over several days of sampling at a higher flow rate than the personal samples and the lower detection limits that could be achieved by analytical procedures used for the high volume area samples. The same method was used for the respirable dust samples for both the personal and area samples. The additional metals reported in Table 6a resulted from an unusually stable response obtained from the hot plasma ICP/MS the day that series of samples were run. On that day, a series of metals which usually do not meet the quality control criteria for quantification had quality control criteria within the acceptable range. Thus, they are reported in Table 6a. More typical responses were obtained when the second set of samples were run, so a smaller target list of metals are reported. Pesticides were only analyzed in the second set of samples collected and concentrations are provided for all of the compounds measured by the GC/ECD method used. Overall the concentrations measured at the site downwind from the construction was similar to the concentrations measured at the upwind or crosswind to the sites indicating that the construction activities were not a major sources of airborne heavy metals, PAHs, and pesticides. However, while no differences among the sites are evident for the particulate PCBs, the 4
139 downwind site vapor phase concentrations of PCBs were approximately twice that of the upwind site. The overall concentrations of the particulate and vapor phase PCBs were of the same order of magnitude as reported recently in Chicago, also during the summer (Simcik et al 1) (Table 10). During the spring, the respirable and total dust samples were actually higher at the upwind site than at the downwind site, which appears to be counterintuitive. However, a number of different construction activities were occurring at the OENJ Metromall during this time period and not just the building of a test roadway embankment. It is likely that the higher dust loadings at the upwind site were due to these other construction activities near the upwind site and not associated with the placement of the sludge material occurring site during the spring. During sampling, the dust from these other construction activities was seen to be blown towards the sampler that was upwind of the roadway embankment site. The total dust samples were collected using the high volume sampler for 5 to 6 days while the respirable dust samples were 2 hour low flow samples collected on several of the days next to the total dust sampler. Even with these two different time frames for collection, the respirable dust samples values were within a factor of 2 to 4 of the total dust concentrations. The results indicate that a significant portion of the particulate matter in the air at the construction site was in the respirable size range. During the sample collection period July 14 to 15, 19, construction and traffic not associated with the use of the dredge matter, generating visible air borne dust near the cross wind site A. These activities resulted in high particulate loadings on the sample collected at cross wind site A, but high levels were not seen at the other cross wind, downwind or upwind samplers during those days. Exclusive of the cross wind site A for the July 14 to 15, 19 sample, little difference was 5
140 observed among the levels measured at all sites during the summer sampling for all of the particulate organic compounds and metals. The target particulate pollutants and vapor phase concentrations measured at the OENJ Metromall roadway embankment site are similar to concentrations of each pollutant measured previously or currently in NJ and other locations in the United States (Figure 1, Table 9-11). (Sweet et al, 13, Gigliotti, 19). The results indicate that using the dredge material in the manner done at the OENJ site has a deminitus effect on the air concentrations of the compounds measured in this study on the surrounded work place and community environment. REFERENCES Cari Lavorgna Gigliotti, Environmental Sciences, APolycyclic Aromatic Hydrocarbons In The New Jersey Coastal Atmosphere,@ Thesis submitted January, 19. EPA, July 193, APTI Course Atmospheric Sampling, US Environmental Protection Agency, Air Pollution Training Institute, MD 20, Environmental Research Center, Research Triangle park, NC 27711, 193, EPA 450/ Franz, T.P., and Eisenreich, S., ASnow Scavenging of Polychlorinated Byphenyls and Polycyclic Aromatic Hydrocarbons in Minnesota@, Environ. Sci. Technol., 1, 32 (12), Simcik, M..F., Franz, T.P., Zhang, H., Eisenreich, S., AGas-Particle Partitioning of PCBs and PAHs in the Chicago Urban and Adjacent Coastal Atmosphere: States of Equilibrium@, Environ. Sci. Technol., 1, 32 (2),
141 Sweet, C.W., Vermette, S.J, ASources of Toxic Trace Elements in Urban Air in Environ. Sci. Technol., 13, 27 (12),
142 Appendix A Wind Data for Sample Collection Days
143 The following four tables provide the dates and time periods that the area samples were collected during the spring and the summer. The upwind sampler was placed more than 50 meters upwind and the downwind sampler more than 50 meters downwind of the active work area associated with the use of the dredge material. However, other truck activity and construction work being done on site could be closer to the samplers than 50 meters at various time periods. The column marked >Wind Direction in degrees= is the range of the recorded wind directions by the on site meteorological station, as provided in the charts in this Appendix. Wind directions of "60E from the center of the site to the sampler was used to determine that sampler was appropriately place upwind or downwind of the construction activities being sampled. Short duration wind shifts, particularly at low wind speeds (<4mph) did not result in changing the sampler location. A consistent shift in wind direction did. Days that resulted in changing the location of the sampler are indicated in >Action taken= column. Changes included: stopping the sampling, moving of the entire sampler and generator, when the wind shift was 90E, or switching the filter heads between the upwind and downwind sampling pumps, when the wind shift was approximately 10E. First Pair of Spring Samples Date Approx. Time of Operation Wind Direction in degrees Actions taken if any :55-13: :07-15: :50-15: :40-15:20 not available On site visual observation of wind indicated that no action was needed 4-2- :10-15: Sampler shut off for 1.5 hrs when wind shifted :45-15:
144 Second Pair of Spring Samples Date Approx. Time of Operation Wind Direction in degrees Actions taken if any :55-15: Moved samplers for wind shift :50-10: Wind very light in am so stopped sampling :00-15: :30-15:00 not available On site visual observation of wind indicated that no action was needed :50-14: Sampler shut off when wind shifted :55-15: First Set of Summer Samples Date Approx. Time of Operation Wind Direction in degrees Actions taken if any :00-17: & :00-16: & Upwind & downwind samplers changed when wind shifted Upwind & downwind samplers changed when wind shifted. Second Set of Summer Samples Date Approx. Time of Operation Wind Direction in degrees Actions taken if any :45-15: with brief excursions above :00-16: Upwind & downwind samplers changed with wind shift :30-14:30 not available On site visual observation of wind indicated that no action was needed
145 Appendix B Blank Values
146 The blank values are provided on the following Tables. One set of blanks were determined during the spring samples and one for the summer samples. The values are given either amount per extract or amount per filter, rather than as an air concentration since the volume of air collected varies across the different samples. To facilitate comparison of the blank to the samples, the average mass of each compound or element in the samples in either the extract or on the filter is also provided. Code for column titles: Average sample value: the average mass of compound or element in the samples in either the extract or on the filter Backup filter: during the summer sampling ONLY, a second filter was placed behind the top filter on one sampler to assess breakthrough and vapor phase absorption. (Its values are higher than the blanks but considerable less than the samples indicating not problems were occurring.) Lab blank: a filter, PUF or extract prepared and analyzed in the laboratory to assess any contamination that may be occurring in the laboratory. Field blank: a filter or PUF that was transported to the field and handled and stored in the same manner as the samples, but through which no air was pulled to assess any contamination that may be occurring during any of the procedures.
147
148
149
150
151
152
153
154
155
156
157
158
159
160
161
162
163
164

165
166
167
168
169
170
171
172
173
174
175
176
177
178
179
180
181
182
183
184
185
186
187
188
189
190
191
192
193
194
195 APPENDIX E-2 Tables on Air Quality Data
196
197
198

199

200
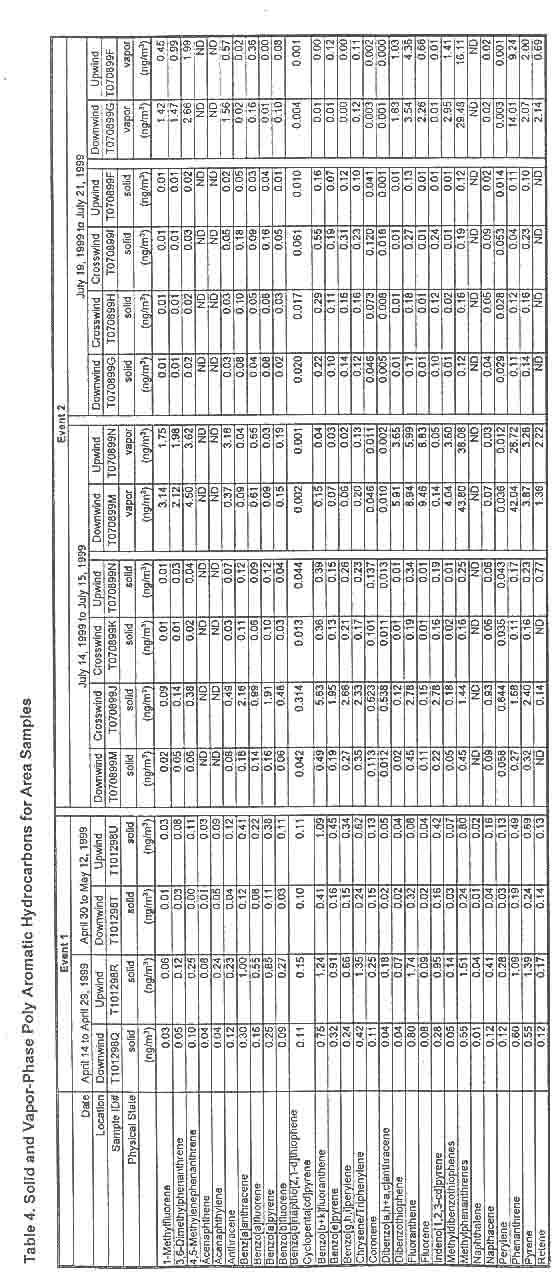
201
202
203
204
205

206
207
208

209

210

211
212 APPENDIX E-3 Wind Data for Sample Collection Days
213
214
215
216
217
218
219
220
221
222
223
224
225
226
227
228
229 APPENDIX F March 2000 Progress Report Use of Dredged Materials in the Construction of Roadway Embankments
230 PROGRESS REPORT DEMONSTRATION PROJECT ON THE USE OF DREDGED MATERIALS FOR CONSTRUCTION OF ROADWAY EMBANKMENTS PREPARED BY: SADAT ASSOCIATES, INC. PRINCETON, NEW JERSEY & SOILTEK, INC. PRINCETON, NEW JERSEY ON BEHALF OF: OENJ CORPORATION, INC. BAYONNE, NEW JERSEY SUBMITTED TO: NEW JERSEY MARITIME RESOURCES NEW JERSEY DEPARTMENT OF TRANSPORTATION NEW JERSEY DEPARTMENT OF ENVIRONMENTAL PROTECTION NEW JERSEY PORT AUTHORITY OF NEW YORK AND NEW JERSEY NEW JERSEY TRANSIT MARCH 2000
231 SECTION TABLE OF CONTENTS PAGE INTRODUCTION Project Objective and Project Team Site Location Project History General Project Description PROJECT TEAM AND SUBCONTRACTORS Demonstration Project Personnel Laboratories Utilized for the Project Documentation Health and Safety Requirements PRE-CONSTRUCTION ACTIVITIES Workplans and Preliminary Design Initial Sampling of the Raw and Amended Dredged Material Foundation Analysis and Final Design CONSTRUCTION ACTIVITIES Stabilization of the Raw Dredged Material 4.2 Construction of Embankments No. 1, No. 2 and Access Roadway Installation of Geotechnical Monitoring Devices Installation of Air Monitoring Devices Installation of Collection Systems for Percolating Water Installation of Stormwater Conveyance System Environmental Sampling and Geotechnical Monitoring During Construction Construction Cost Estimation GEOTECHNICAL MONITORING ACTIVITIES Cement Content Monitoring Geotechnical Laboratory Investigation Geotechnical Field Monitoring Field Compaction Monitoring Settlement Monitoring Embankment Field Monitoring Field Curing Evaluation - Cone Penetration Testing Preliminary Data Analysis AIR MONITORING ACTIVITIES Introduction Overview of SDM Processing and Construction Activities Parameters Selected for Analyses Methods and Materials Meteorological Monitoring Area Samples Personal Samples Area and Personal Sample Collection...52
232 6.3.1 Area Samples Personal Samples Results and Data Evaluation Meteorological Data Background Conditions and Potential Interferences Area Samples TSP and PM Metals PCBs/Pesticides PAHs Overview of Area Sampling Results Personal Samples Respirable Particulate Matter Metals PCBs and Pesticides PAHs Overview of the Personal Sampling Results Conclusions and Recommendations ENVIRONMENTAL FIELD MONITORING ACTIVITIES Introduction Environmental Sampling Environmental Sampling of the RDM Environmental Sampling of SDM Environmental Sampling of Percolated Groundwater Environmental Sampling of Stormwater Post-Construction Environmental Sampling Data Processing and Basis for Data Screening Data Base System Environmental Standards used for Data Screening Soil Samples MMEP Leachates and Percolated Groundwater Samples Stormwater Samples Dioxins Analysis Screening Evaluation of Analytical Data Raw Dredged Material - RDM Residential Soil Cleanup Criteria for RDM Nonresidential Soil Cleanup Criteria for RDM Impact to Groundwater Soil Cleanup Criteria for RDM Dioxins for RDM Stabilized Dredged Material - SDM TCLP Characterization of SDM Residential Soil Cleanup Criteria for SDM Nonresidential Soil Cleanup Criteria for SDM Impact to Groundwater Soil Cleanup Criteria for SDM Dioxins for SDM SDM Leachates Groundwater Quality Standards for SDM Leachates Dioxins for SDM Leachate...9
233 7.5.4 Percolated Groundwater Samples Groundwater Quality Standards for Percolated Groundwater Dioxins for Percolated Groundwater Stormwater Samples Surface Water Criteria for Stormwater Samples Dioxin Analysis of Stormwater Samples Preliminary Findings of the Screening Evaluation RDM and SDM SDM Leachate and Percolated Groundwater Stormwater Summary and Preliminary Findings Overview of the Contents of the Progress Report Objectives Project Team Main Construction and Monitoring Activities Performed to Date Preliminary Evaluations and Findings Construction Cost Estimation Geotechnical Preliminary Data Analysis Air Monitoring Data Evaluation Screening Evaluation for Environmental Sampling Remaining Activities for Project Completion...124
234
235
236 LIST OF APPENDICES Appendix A Appendix B Appendix B-1 Appendix B-2 Appendix B-3 Appendix B-4 Appendix C Appendix D Appendix E Appendix E-1 Appendix E-2 Appendix E-3 Appendix F Appendix G Drawings Field Data During Construction Daily Construction Reports Construction Photographs Troxler Results and Locations Construction Cost Estimates OENJ / NJDOT Embankment Demonstration Project, Site Investigation and Foundation Study, dated November 6, 1, by Dr. Ali Maher, Ph.D., Geotechnical Consultant Cement Content Determination of OENJ Amended Dredge in Elizabeth, New Jersey, dated January 25, 19, by Soiltek Air Study Report by Drs. Clifford P. Weisel and Paul J. Lioy, University of Medicine and Dentistry of New Jersey for Sub-Contract Agreement for OENJ / NJDOT Roadway Embankment Pilot Project, dated January 5, Tables on Air Quality Data Wind Data for Sample Collection Days Status of Geotechnical Investigation NJDOT / OENJ Embankment Project, dated January 31, 2000, by Soiltek Screening Evaluation and Environmental Data Appendix H Appendix I Tabulated Analytical Data Screening Evaluation of Non-Detects
237 LIST OF DRAWINGS Drawing No. 1 Drawing No. 2 Drawing No.3 Drawing No.4 Drawing No.5 Final System Configuration - Grading Plan Final System Configuration - Percolated Water and Stormwater Drainage Plan Final System Configuration - Construction Details Final System Configuration - Cross Sections Final System Configuration - Geotechnical Monitoring Plan
238 1.0 INTRODUCTION This progress report on the Demonstration Project on the Use of Dredged Materials in the Construction of Roadway Embankments (ADemonstration has been prepared by Sadat Associates, Inc. (ASadat and Dr. Ali Maher, Geotechnical Consultant, at Rutgers, the State University of New Jersey [1] on behalf of OENJ Corporation Inc. for the New Jersey Maritime Resources This project was established to assess the suitability of using dredged materials in roadway construction. The project mainly involves the construction of two roadway embankments and an access road using stabilized dredged materials at a site located near the Newark Bay in New Jersey. Geotechnical and environmental conditions have been evaluated during the preparation of the construction materials (i.e., dredging and material stabilization), and during construction of roadway embankments (i.e. material transport, drying, spreading, and compaction). Geotechnical and environmental monitoring are being conducted after construction. This report presents a description of the main construction and monitoring field activities performed as of December 1, 19 for the Demonstration Project. The main activities performed during this time period included: $ the dredging and transportation of sediments from the Newark Bay to the processing/stabilization facility; $ the stabilization of the raw dredged material using Portland cement and its transport to the construction Site; $ the construction of two roadway embankments and an access roadway using the SDM which were designed to simulate typical highway configurations; $ the installation of geotechnical monitoring devices, air monitoring equipment, collection systems for percolating water and stormwater conveyance systems; and, [1] The geotechnical consulting services provided by Dr. Ali Maher are rendered through Soiltek, Inc. (ASoiltek@), a geotechnical consulting firm. 1 MARCH 2000 PROGRESS REPORT.DOC
239 $ the implementation of the geotechnical and environmental monitoring and sampling plan to collect information required to determine whether dredged material could be used as an alternate construction material in New Jersey Department of Transportation highway projects. This report also presents the environmental and geotechnical data obtained during the monitoring activities conducted prior to and during construction. The analytical data collected during the preconstruction and construction periods have been analyzed with proper QA/QC by certified analytical laboratories. After these evaluations, all data were entered into a Data Base System which was designed to facilitate the management of information during the preliminary data screening and evaluation. A preliminary evaluation of these data is also presented in this progress report. The analytical data related to dredged material, leachate, percolated groundwater, and surface water sampling have been compared with applicable standards. Specifically, the analytical results for various environmental samples were compared to the chemical-specific Federal and State criteria/standards that have been established for different media. This comparison is performed as a screening tool for the identification of those parameters which could be considered of concern and may require additional analysis. This evaluation does not include data gathered after the completion of the construction of the embankments. 1.1 Project Objective and Project Team The Demonstration Project involves the construction of two embankments and an access roadway using SDM at Parcel G of the OENJ Redevelopment Site, Elizabeth, New Jersey. These structures are being tested and monitored to evaluate the suitability of SDM in NJDOT roadway construction projects. If SDM is found to be suitable for this purpose from both a geotechnical and environmental perspective, guidelines and general specifications for its use in roadway construction projects, as well as a protocol for obtaining New Jersey Department of Environmental Protection (ANJDEP@) approval for this purpose, will be developed. The overall objectives of the OENJ / NJDOT Demonstration Project are: $ the collection of data on the geotechnical / engineering characteristics and behavior of the SDM in order to evaluate the manageability, strength and workability of the material for the construction of embankments or related structures; 2 MARCH 2000 PROGRESS REPORT.DOC
240 $ the collection and analysis of chemical data for the evaluation of the potential contaminant migration pathways and potential environmental impacts; and, $ the development of guidelines for the use of SDM in NJDOT roadway construction projects. The field testing and monitoring activities for this Demonstration Project consist of the performance of: $ an environmental testing and monitoring program for air, soils, percolated groundwater and stormwater; and, $ a geotechnical testing and monitoring program. The procedures for the performance of the environmental testing and monitoring programs followed the guidelines set forth in the following: $ NJDEP Manual entitled, ANew Jersey Department of Environmental Protection and Energy - Field Sampling Procedures Manual,@ dated May 12. $ NJDEP Manual entitled, AThe Management and Regulation of Dredging Activities and Dredged Material in New Jersey Tidal Waters,@ dated October 17. $ US Army Corps of Engineers= Technical Note DOER-C2 entitled, ADredged Material Screening Tests for Beneficial Use Suitability,@ dated February 1. Finally, the procedures for performing the geotechnical monitoring program followed the NJDOT guidelines and the American Society of Testing Materials (AASTM@) standards and requirements. The construction activities were implemented by the Project Team consists of OENJ, Sadat Associates and Soiltek. OENJ is the owner of the Demonstration Project site and General Contractor. Sadat Associates is the Project Manager and is responsible for the overall supervision of the construction activities and the performance of the environmental monitoring and evaluation of the environmental data. Soiltek is responsible for the installation of geotechnical instrumentation, as well as the performance of the geotechnical monitoring and evaluation of the geotechnical data. All phases of the project have been submitted for review and comments to members of the following agencies and their consultants: 3 MARCH 2000 PROGRESS REPORT.DOC
241 $ New Jersey Maritime Resources $ New Jersey Department of Transportation - Stevens Institute of Technology, consultant to NJDOT $ New Jersey Department of Environmental Protection (ANJDEP@) $ Port Authority of New York and New Jersey (APANY/NJ@) $ New Jersey Transit (ANJ Transit@) - Dames & Moore, consultant to NJ Transit These agencies and consultants are referred to as Ainterested agencies@ in this report. 1.2 Site Location Thre different sites were used for the development of the Demonstration Project: Dredging Site The Union Dry Dock site in Hoboken, New Jersey, was the source of the dredged sediments transported to the Sealand Facility for stabilization. Stabilization Site The mixing of the sediments with cement (stabilization) was conducted at the Sealand Facility in Elizabeth, New Jersey. After stabilization of the dredged material, the material was transported to Parcel G of the OENJ Redevelopment site in Elizabeth, New Jersey, where air drying and compaction took place during the construction of the embankments and the access roadway. Construction Site Activities for the construction of the embankments were conducted in Parcel G of the OENJ Redevelopment Site. This parcel comprises the eastern portion of the OENJ Site and is situated adjacent to Newark Bay in Elizabeth, New Jersey. Parcel G encompasses approximately 15 acres. Figure 1 shows the locations of the Union Dry Dock area, the Sealand Facility and Parcel G. 4 MARCH 2000 PROGRESS REPORT.DOC

242 Figure 1 Site Location Plan 5 MARCH 2000 PROGRESS REPORT.DOC
243 1.3 Project History Between 16 and 1, stabilized dredged material was used at the OENJ Redevelopment Site as fill and/or capping material for the closure of a former landfill. In addition, SDM was used as structural fill to provide sub-grade support for vehicle access roadways and parking lots for the Jersey Gardens Mall. The SDM was used at the Site with NJDEP=s approval following the site specific Protocol for Use of Recyclable Materials. On September 19, 17, OENJ submitted a request for funding and a preliminary scope of work for the Demonstration Project to the NJMR. After several technical discussions with the NJMR and the NJDOT, the Demonstration Project was approved and funding was granted. In August of 1, a ADraft Geotechnical and Environmental Testing Workplan for the OENJ/NJDOT Roadway Embankment Pilot Project at Parcel G of the OENJ Redevelopment Site, Elizabeth, Union County, New Jersey@ (ADraft Workplan@) was prepared. This document included the proposed scope of the field monitoring activities. The Draft Workplan was presented to and discussed with representatives from the NJDOT, PANY/NJ, NJMR, Dames and Moore (consultant to NJ Transit), and Stevens Institute of Technology (consultant to NJDOT) during a meeting which was held on September, 1. Comments, questions and concerns related to the issues presented in this workplan were discussed and resolved during that meeting. Several other meetings were held with the interested agencies and parties to discuss technical and regulatory issues related to this project. Based on the decisions made during these meetings and further evaluation of the various technical issues, a second version of the workplan (the AFinal Workplan@) was prepared and submitted to the interested agencies and parties on February 22, 19. On April 9, 19, the NJDEP provided comments to the February 19 Final Workplan. These comments were addressed and incorporated in the revised version of the Final Workplan (referred to herein as the ARevised Final Workplan@), which was submitted to the interested agencies and parties on June 11, General Project Description The project involved the construction of two embankments (Embankment No. 1 and Embankment No. 2) and an access roadway using SDM at Parcel G of the OENJ Redevelopment Site. Environmental and geotechnical field monitoring and testing have been conducted prior to, during and after construction of the two embankments and the access roadway. The location and configuration of these two embankments and the access roadway are shown in the Grading Plan 6 MARCH 2000 PROGRESS REPORT.DOC
244 (Drawing No. 1 of Appendix A). Additional field monitoring and testing are currently being conducted for the post-construction phase of the project. Figure 2 presents a flow chart indicating the main aspects of the construction phase of the project and summarizes the environmental and geotechnical testing performed prior to, during, and after construction. The construction and monitoring/sampling activities can be summarized as follows: Construction The preparation of the dredged material, conducted before the actual construction of the embankments, consisted mainly of the following activities: $ dredging at the Union Dry Dock site; $ material stabilization at the Sea-Land facility; and, $ transport and stockpiling of the SDM at the construction site. The actual embankment construction activities mainly included: $ preparation of a platform and a foundation for construction of the embankments; $ construction of the embankments and access roadway; $ installation of geotechnical monitoring devices such as inclinometers and settlement plates; and, $ installation of the collection system for percolating water and the stormwater conveyance system. Monitoring Geotechnical monitoring conducted prior to, during, and after construction, mainly included: $ cement content testing; $ subsurface investigation for design of the foundation; $ laboratory testing of SDM strength parameters; $ field compaction monitoring; $ settlement monitoring; $ inclinometer monitoring; and, 7 MARCH 2000 PROGRESS REPORT.DOC
245 $ cone penetrometer testing for long-term strength evaluation. Environmental monitoring activities mainly included the sampling and characterization of: $ Solids: Raw Dredged Material (RDM) Stabilized Dredged Material (SDM) $ Liquids Leachate generated from SDM samples Stormwater Runoff Percolated Groundwater $ Air Airborne / dust samples collected during construction Sampling has been performed at different phases of the project for various parameters in order to characterize the materials involved in the construction and to assess potential adverse environmental conditions. Figure 3 defines the main engineering activities related to the performance of the project. At the present time, all design and construction activities have been completed. Remaining activities are related to collection of additional data, data analysis, final assessment and preparation of a final report. MARCH 2000 PROGRESS REPORT.DOC
246
247
248 2.0 PROJECT TEAM AND SUBCONTRACTORS 2.1 Demonstration Project Personnel The Project Team involved in the construction and monitoring activities of the Demonstration Project included the following: $ Project Manager: Sadat Associates - responsible for the overall preparation and development of the Workplan(s), the management of the team, the overall coordination of the construction and monitoring activities, the proper documentation and maintenance of all records pertaining to geotechnical and environmental monitoring programs and the preparation of the final report(s). $ Geotechnical Consultant : Soiltek - Dr. Ali Maher - responsible for the oversight, installation, management and execution of all the geotechnical testing, monitoring, and evaluation activities. $ Air Monitoring and Evaluation Consultant : Dr. Paul Lioy and Dr. Clifford Weisel (Environmental and Occupational Health Sciences Institute (AEOHSI@) [1] ) - responsible for the execution of the air monitoring activities and evaluation of the air quality data in conjunction with Sadat Associates. $ Field Coordinator and Health and Safety Officer: Sadat Associates - responsible for the management and oversight of the construction and field monitoring activities and for the implementation of the Health and Safety Plan (AHASP@) dated February 23, 19. $ Construction Contractors : E.E. Cruz Company, Inc. - responsible for the stabilization of the raw dredged material delivered to the OENJ Site, as well as for the construction of a portion of Embankment No. 1, the entire Embankment No. 2, the access roadway, and all associated appurtenances. E.E. Cruz performed the work from September 29, 1 until July 31, 19. [2] Environmental and Occupational Health Sciences Institute (AEOHSI@) is a joint venture of Rutgers-The State University of New Jersey and The University of Medicine and Dentistry of New Jersey. 11 MARCH 2000 PROGRESS REPORT.DOC
249 KMC - responsible for the completion of the construction activities (and associated appurtenances) for the remaining construction activities initiated by E.E. Cruz. KMC started working at the Site on August 1, 19 and completed the construction phase of the Demonstration Project on October 19, 19. $ Surveying Subcontractor : McCutcheon Associates, P.A. - responsible for all surveying activities and collection of elevation readings from the settlement plates installed in the embankments. $ Subcontractors for the Installation of Geotechnical Monitoring Devices : Warren George, Inc. - responsible for the performance drilling activities, under the supervision of Soiltek, E.E. Cruz responsible for the installation of settlement plates and horizontal inclinometer, and Converse East Consultants responsible for the installation of the vertical inclinometers. $ Laboratory Subcontractors: Aqua Survey, Inc. - responsible for the collection and testing of the environmental samples until June 26, 19. During this time, Aqua Survey was responsible for the collection of the environmental samples. Testing of the samples was conducted by laboratories subcontracted by Aqua Survey, Inc. (i.e., Intertek Testing Services [1], Environmental Testing Laboratories and Triangle Laboratories). Environmental Testing Laboratories (AETL@) - has been responsible for the collection and testing of the stabilized dredge, percolated groundwater and stormwater samples since June 26, Laboratories Utilized for the Project [3] Intertek Testing Services performed some of the analyses on the raw and laboratory SDM collected/created in April 1 for the evaluation of the RDM and SDM for uplands beneficial use. These analyses were conducted for the Port Authority of New York and New Jersey to determine if the material was suitable for use at the OENJ Redevelopment Site, prior to the conception of the NJDOT Embankment Project. 12 MARCH 2000 PROGRESS REPORT.DOC
250 The following laboratories have been utilized during the various phases of the project: (1) Analysis of raw and SDM, percolated groundwater and stormwater samples for environmental parameters: Aqua Survey, Inc. (until June 26, 19) 4 Point Breeze Road Flemington, New Jersey 022 NJDEP Certification #10309 Intertek Testing Services (April 1 Samples only) 55 South Park Drive Colchester, Vermont NJDEP Certification # 5972 Environmental Testing Laboratories, Inc. 20 Route 109 Farmingdale, New York NJDEP Certification #7312 Triangle Laboratories (for Dioxin / Furans Analysis only) 01 Capitol Drive Durham, North Carolina NJDEP Certification #6751 (2) Analysis of airborne particulate samples from personal monitoring program: Princeton Analytical 47 Maple Avenue Flemington, New Jersey 022 AIHA Certification #509 NJDEP Certification #10003 NYDOH ELAO Certification #1156 NIOSH PAT Certification #7021 (3) Analysis of airborne particulate samples from area monitoring program: 13 MARCH 2000 PROGRESS REPORT.DOC
251 Environmental and Occupational Health Sciences Institute, Rutgers University Laboratories 170 Frelinghuysen Road Piscataway, New Jersey Research Institute [1] (4) Analysis of the engineering geotechnical properties of soil samples: Geotechnical Laboratory Civil and Environmental Engineering Rutgers, The State University of New Jersey 2.3 Documentation The team member(s) performing a particular field monitoring program kept detailed field records in the daily field logs (see Appendix B-1). The daily field logs included records of: $ sampling / monitoring particulars; $ daily weather conditions; $ field measurements; $ name of individual responsible for the monitoring / sampling, as well as activities being performed at the Site; $ on-site personnel; $ site specific observation; $ type of equipment used; $ condition of the dredged material; and, $ required efforts to achieve the required density and moisture content. It also contained any deviations from the protocol, and visitors= names or community contacts during the construction activities. Furthermore, representative photographs of the different activities during the construction phase of the Demonstration Project are presented herein as Appendix B-2. [4] EOHSI Laboratories were selected for the performance of the analyses, since very low detection limits were required for certain parameters. 14 MARCH 2000 PROGRESS REPORT.DOC
252 2.4 Health and Safety Requirements The project team and subcontractors have performed all field activities in conformance to sitespecific health and safety plans. Sadat Associates= Health and Safety Plan was developed in accordance with the most recently adopted and applicable general industry (29 CFR 1910) and construction (29 CFR 1926) standards of the Federal Occupational Safety and Health Administration US Department of Labor, as well as other applicable Federal, State and Local statutes and regulations. The Final HASP was submitted to the NJDEP on February 23, 19. The HASP was developed for use by Sadat Associates personnel during the performance of the construction, as well as the monitoring / sampling activities. All other members of the project team and its subcontractors were required to develop and follow their own HASPs, which followed the general guidelines of the Sadat Associates= February 23, 19 HASP. 15 MARCH 2000 PROGRESS REPORT.DOC
253 3.0 PRE-CONSTRUCTION ACTIVITIES Prior to the initiation of the construction activities, some preliminary investigations and activities were deemed necessary. These investigations consisted of: $ preparation of workplan(s) and a preliminary design; $ characterization of the raw and SDM to be used for the project; $ a foundation study for the evaluation of the physical and engineering characteristics of the subbase to be used for the two embankments; and, $ final design and workplan. 3.1 Workplans and Preliminary Design Initial planning of the project involved the preparation of a preliminary design and development of the workplans for construction and monitoring. The preliminary design was prepared to estimate work quantities, evaluate the configuration of the embankments and determine the type and quantity of monitoring activities. The preliminary design was submitted to the Interested Parties for review. In August of 1, based on the preliminary design, a ADraft Geotechnical and Environmental Testing Workplan for the OENJ/NJDOT Roadway Embankment Pilot Project at Parcel G of the OENJ Redevelopment Site, Elizabeth, Union County, New Jersey@ (ADraft Workplan@) was prepared. This document was presented to and discussed with representatives from the NJDOT, PANY/NJ, NJMR, Dames and Moore (consultant to NJ Transit), and Stevens Institute of Technology (consultant to NJDOT) during a meeting which was held on September, 1. Comments, questions and concerns related to the issues presented in this workplan were discussed and resolved during that meeting. The Revised Final Workplan included the final design for construction which incorporated the results of the foundation analysis. Activities related to the foundation analysis and the final design are included in subsequent sections of this report. Several other meetings were held with the interested agencies and parties to discuss technical and regulatory issues related to the Demonstration Project. Based on the decisions made during these 16 MARCH 2000 PROGRESS REPORT.DOC
254 meetings and further evaluation of the various technical issues, a second version of the workplan (the AFinal Workplan@) was prepared and submitted to the interested agencies and parties on February 22, 19. On April 9, 19, the NJDEP provided comments to the February 19 Final Workplan. These comments were addressed and incorporated in the revised version of the Final Workplan (referred to herein as the ARevised Final Workplan@), which was submitted to the interested agencies and parties on June 11, 19. Originally, the design for the Demonstration Project consisted of the construction of two embankments (Embankment No. 1 and Embankment No. 2) at Parcel G of the OENJ Site. Embankment No. 1 was to be constructed at the northernmost portion of the parcel, while Embankment No. 2 was to be situated at the southern portion of the site. The area between the two embankments was to be used for the temporary stockpilling of the SDM. During a meeting with all the interested parties and agencies on September, 1, the NJDOT requested that some of the dredged material be used for the construction of an access roadway. This item was added to the original design of the Demonstration Project. In addition, material excavated during the installation of utilities at the OENJ Site and during the wetlands mitigation activities was placed at the southern portion of Parcel G. Hence, the southern embankment (AEmbankment No. 2) was relocated towards the middle part of Parcel G. This new location for Embankment No. 2 had less compressible material thickness than the original location, thereby reducing expected settlements. A portion of Embankment No. 2 was constructed on top of competent sand which was placed for the installation of a 10-foot reinforced concrete pipe that discharges stormwater to the Newark Bay. This issue was presented to NJMR and the NJDOT during the meeting of November 13, 1. Minor refinements and changes were made to the final design since then in order to accommodate various comments and concerns of the Interested Agencies. The final design of the Demonstration Project was presented in the Revised Final Workplan of June 11, Initial Sampling of the Raw and Amended Dredged Material Sampling of the raw dredged material (ARDM@) and of the SDM is fully discussed in Section 7.0 of this report. The environmental sampling prior to construction consisted of the following: 17 MARCH 2000 PROGRESS REPORT.DOC
255 $ Analytical sampling of RDM, SDM prepared in the laboratory, and leachate from SDM generated in the laboratory. The sampling was conducted prior to dredging as required for material acceptance at the site. $ Analytical sampling of SDM and leachate generated from SDM from samples collected at stockpiles in Parcel G. This sampling was conducted after the actual stabilization of the material. $ TCLP Hazardous Waste Characterization of SDM stockpiled at Parcel G. $ Organic Content tests of SDM. The geotechnical testing and monitoring prior to actual construction mainly included the following: $ Collection of RDM to evaluate geotechnical characteristics of different admixtures in the laboratory. $ Testing of cement content in RDM. $ Extensive subsurface investigation to specify the foundation of the embankment structures (as presented in Section 3.3 of this report). 3.3 Foundation Analysis and Final Design Pursuant to previous field investigations at Parcel G, conducted as part of the closure activities of the OENJ Redevelopment Site, the surface of Parcel G mainly consists of one foot of soil cover over to 23 feet of refuse material, which overlay a 5 to 10 foot thick peat layer. The peat layer rests on sands which overlay 30 to 40 feet of clay. Due to the thickness of the compressible refuse layer, a suitable foundation was considered necessary to minimize settlements in the substrata. Furthermore, measures had to be implemented to differentiate between settlements in the substrata (foundation settlements) and settlements within the embankments. The testing requirements for this investigation are summarized in Table 7 of Appendix A of the Revised Final Workplan. Field activities needed for the foundation analysis were conducted during the months of September 1 MARCH 2000 PROGRESS REPORT.DOC
256 and October 1 by Warren George, Inc. under the supervision of Soiltek. The results of the foundation study are detailed in the report entitled, AOENJ / NJDOT Embankment Demonstration Project - Site Investigation and Foundation Analysis,@ dated November 6, 1 (referred to herein as AFoundation Geotechnical Report@), which has already been submitted to all interested parties and agencies. For ease of reference, a copy of this report can be found in Appendix C of this report. The foundation investigations mainly involved the performance of the Cone Penetration Test (ACPT@) at 15 locations. The information from the CPT was used in the determination of the site suitability for embankment load. In addition, correlation of Standard Penetration Test (ASPT@) with for soil strength correlation was conducted using data from four soil borings which were drilled to hardpan. All holes were throughly grouted and sealed after the completion of the work. Continuous soil samples were collected from each of the four borings for unified classification tests (as per ASTM D-1140, 422 and 431) and for determining the engineering properties (strength and consolidation) of the strata. In addition, samples were subjected to triaxial tests (as per ASTM D-4767 / ASTM D-250-7) and for consolidation tests (as per ASTM D-2435). During the performance of the CPTs, mixed refuse material covered by approximately one foot of soil cover was encountered almost throughout Parcel G. The thickness of the refuse layer varied from to 23 feet. At the particular locations of the originally proposed Embankments No. 1 and No. 2, the thickness of the refuse layer was found to be approximately 19 to 20 feet and to 9 feet, respectively. The refuse material consisted primarily of wood, metal, tires, paper, construction debris and soil. Some waste material excavated during various closure activities at other areas of the OENJ Redevelopment Site was also found at the southern portion of Parcel G. Common sandy fill, rather than waste material, was encountered in the vicinity of the 10-foot reinforced concrete pipe (ARCP@) that runs through Parcel G. This RCP replaced the Great Ditch as part of the OENJ Redevelopment Site=s closure activities. Peat and soft elastic clay silt were found below the refuse layer. The thickness of this soil stratum was found to range from 5 to 10 feet. Based on the CPT soundings performed, the silt layer underlay the peat layer, and consisted of silty sands to sandy silts with occasional clay. Previous investigations conducted at the OENJ Redevelopment Site encountered very stiff to hard red lean clay (approximately 30 to 40 feet thick) and hard red decomposed shale beneath the sandy formation. Finally, red brown (bedrock) of the Brunswick Formation was encountered at depths of 65 to 3 feet below ground surface [1]. [5] AReport of Preliminary Geotechnical and Foundation Study, Kapkowski Road Site@, prepared by Converse 19 MARCH 2000 PROGRESS REPORT.DOC
257 More information on the types of materials encountered and their engineering and physical characteristics can be found in the Soiltek Foundation Geotechnical Report in Appendix C of this report. This information will be included in the final report. According to the Foundation Geotechnical Report: $ settlement of approximately ten inches was estimated within the refuse layer after construction of Embankment No. 2, and, $ settlement of approximately 1 inches within the refuse fill layer was estimated after construction of Embankment No. 1. Based on the geotechnical analysis, it was recommended that a reinforced synthetic fabric should be placed at the base (one foot above the actual toe elevation) of Embankment No. 2 to potentially minimize the anticipated settlement of this embankment and allow for a more uniform settlement. Pre-loading was originally selected as an alternative to improve the foundation for Embankment No. 1. As a result of time limitations and field conditions, it was concluded that a reinforced synthetic fabric should also be placed at the foundation of Embankment No. 1 to potentially minimize some of the anticipated settlement and to allow even settlement. Based on the results of the foundation analysis and on the comments made by the Interested Parties during the development of the workplans, the final design was prepared and submitted. Appendix A presents the final construction drawings. Consultants East, dated January 29, 13; and, AReport of Geotechnical Investigation Pipe Support - Great Ditch, Metromall Site, Elizabeth, New Jersey@, prepared by Converse Consultants East, dated May 31, MARCH 2000 PROGRESS REPORT.DOC
258 4.0 CONSTRUCTION ACTIVITIES The construction activities performed for the Demonstration Project were initiated on September 14, 1 and completed on October 16, 19. As previouly mentioned, the activities mainly included: $ the stabilization of the raw dredged material originated from the Union Dry Dock site; $ the construction of the two roadway embankments (Embankment No. 1 and Embankment No. 2) and an access roadway which were designed to simulate typical highway configurations; $ the installation of geotechnical and environmental monitoring devices; $ the installation of a collection system for percolating water; and, $ the construction of a stormwater conveyance system. Environmental monitoring, sampling and testing were conducted during the stabilization of the dredged materials and also during the construction of the embankments. During construction, the monitoring activities included the collection and analysis of air, dredged material, percolated groundwater and stormwater samples. The environmental monitoring / sampling activities conducted during construction are presented briefly in this section and more extensively in Sections 6.0 and 7.0 of this report. The evaluation of the air monitoring data obtained during the construction phase is also included in Section 6.0 of this document. In addition, geotechnical testing and monitoring was performed to obtain information on the physical and engineering behavior of the material and the structures. Descriptions of the geotechnical activities are summarized in Section 5.0 of this report as presented by Soiltek Status Reports included in Appendix F. Daily reports were prepared during the construction activities. Each of these reports included the following information: $ sampling / monitoring particulars; $ daily weather conditions; $ field measurements; $ name of individual responsible for the monitoring / sampling, as well as activities being 21 MARCH 2000 PROGRESS REPORT.DOC
259 performed at the Site; $ on-site personnel; $ site specific observations; $ type of equipment used; $ condition of the dredged material; and, $ required efforts to achieve the required density and moisture content. A copy of the daily field reports during the actual construction of the two embankments and the access roadway from February 16 to October 19, 19 are included in Appendix B-1. In addition, representative photographs of the construction activities are presented in Appendix B-2 of this report. 4.1 Stabilization of the Raw Dredged Material (ARDM@) The material used for the construction of the Demonstration Project structures was dredged from the Union Dry Dock Site by the Great Lakes Dredging Company. The activities which involved the dredging of a total of approximately 1,000 cubic yards of sediments, were initiated on September 14, 1 and were completed on November 13, 1. Upon dredging, the RDM was loaded on a barge and transported to the pugmill at the Sealand processing facility, where it was stabilized by mixing it with % by wet weight Type II cement in a pugmill. The addition of cement to the RDM enhanced the workability of the material by decreasing its water content and creating a material which is easier to transport, spread, grade, compact, and disk. The SDM was then loaded onto trucks and transported to the designated areas at Parcel G. At Parcel G, the dredged material was stockpiled from October 1 to February 19, when the actual construction of the embankments began. 4.2 Construction of Embankments No. 1, No. 2 and Access Roadway The construction of Embankment No. 1 was initiated on June 23, 19 with the preparation of the structure=s platform and was completed on September 30, 19. The construction of Embankment No. 2 was initiated on February 19, 19 and was completed on June 2, 19. The construction of the access roadway started on June 1, 19 and finished on July 16, 19. The location and final configuration of the embankments and the access roadway are presented in Drawing No. 1 of Appendix A of this report. 22 MARCH 2000 PROGRESS REPORT.DOC
260 All construction activities were conducted outside the 150-foot wide buffer zone (or wetlands transition area) of the existing wetlands located north of Parcel G, as well as at least 100 feet from the mean high water line of the Newark Bay. Prior to the initiation of the construction activities, all appropriate soil erosion and sediment control measures were implemented according to the existing approved SESC plan for the OENJ Site. Embankment No. 1 is constructed along the northern portion of Parcel G (see Drawing No. 1 of Appendix A of this report). This structure is 620 feet long, 130 feet wide at the top and 10 feet wide at the base. The maximum height of the embankment is 10 feet above grade. The structure encompasses approximately 1.5 acres of land. The slopes of the embankment are 2:1 (horizontal : vertical) along its northeastern face and 1.5:1 along its southwestern face. The slopes at the access ramps are 15:1. Embankment No. 2 was constructed south of Embankment No. 1, as shown in Drawing No. 1 of Appendix A of this report. The structure is 50 feet long, 90 feet wide at the top and 150 feet wide at the base. The maximum height of the embankment is 13 feet above grade. Embankment No. 2 encompasses approximately one acre of Parcel G. This structure has slopes of 2:1 along its northeastern and southwestern sides, and slopes 15:1 along the slopes at the access ramps. The access roadway was constructed west of the two embankments. It encompasses a total of approximately 1.4 acres, and has a top width of about 5 feet, a bottom width of approximately 90 feet and a final height of 3.5 feet above the ground surface. The first structure to be constructed was Embankment No. 2. The footprint of this embankment was surveyed and staked out by McCutcheon Engineers and Surveyors (AMcCutcheon@) on February 17, 1 and 19, 19. The footprints of Embankment No. 1 was surveyed and staked out by the same surveyors on May 26, 19. Prior to the actual construction of Embankment No. 2, a base platform was prepared to ensure a flat surface meeting the design elevations. Specifically, approximately one foot of crushed demolition debris was placed and spread throughout the staked area.. The construction of the platform involved some cutting and filling in order to meet the proposed contours. The material excavated from the platform area was stockpiled on the side and later transported and disposed of at a designated area on Parcel G away from the embankments= area. Finally, amended dredged material was compacted on the platform to provide a smooth and level base for the embankment. The final elevation of the platform was approximately 12 feet above Mean Sea Level (AMSL@). 23 MARCH 2000 PROGRESS REPORT.DOC
261 Similar activities were conducted for the preparation of the base of Embankment No. 1. Based on four test pits excavated by E.E. Cruz on May 1 and May 14, 19, the interface between the waste and the soil cover was found at a higher elevation than expected (16' above MSL). Hence, it was decided that the originally recommended base elevation of 14' MSL be changed to 16' MSL in order to avoid major cuts within the base of the embankment. Waste excavated from the outlined base of the structure were transported to the restaging area in Parcel G, south of the Great Ditch pipeline. The base of the embankment was leveled to the appropriate elevation before construction of the embankments began. The footprints for the access roadway were cleared by E.E. Cruz on May 26, 19. Construction on the southern portion of the access road started on June 1, 19. The platform grades were cleared by OENJ, while E.E. Cruz rolled and leveled the platform top prior to hauling the dredged material for the construction. The cuts at the southern portion averaged 6 to feet. Two big concrete slabs, located at the northern side of the access roadway, were left in place. These structures were sitting on piles previously used by Walsh during other dredge process activities in this area. According to the results of the Foundation Study conducted by Soiltek, it was estimated that the total long term settlement for Embankment No. 1 and Embankment No. 2 would be 27 inches and 22 inches, respectively. Taking into consideration the site and schedule constraints, it was recommended that a reinforced geosynthetic fabric be installed at the base of each of the embankments to arrest some of the anticipated settlements and allow for a more uniform settlement. The selected reinforced geosynthetic fabric was PET GEOTEX 6x6 GEOTEXTILE, which was provided by Synthetic Industries, Inc. The fabric was installed according to the manufacturer=s specifications, under the supervision of Soiltek, in Embankment No. 1 on July 9, 19 at elevation 1' MSL and in Embankment No. 2 on April 27, 19 at elevation 14' MSL. The placement of the first 12-inch lift for Embankment No. 2 started on March 29, 19. The initiation of the construction activities experienced some delays due to extensive rain, snow and cold conditions. All the lifts of Embankment No. 2 were 12-inch thick, with the exception of the third lift (14' ') which was 1 inches to further protect the installed reinforcing fabric during the disking and compacting procedures. The placement of the first 12-inch lift for the access roadway started on June 1 at elevation 15' MSL. All lifts were 12-inch thick. The placement of the first 12-inch lift for Embankment No. 1 started on June 23, 19 at elevation 16' MSL. All the lifts of Embankment No. 1 were 12-inch thick with the exception of the third lift 24 MARCH 2000 PROGRESS REPORT.DOC
262 (1' ') which was 1 inches to further protect the installed reinforcing fabric. The placement of each lift for both embankments and the access roadway involved the use of excavator, loaders, dozer, disking blade, and roller. Initially, about 12 to 13 inches of SDM were transported from the stockpile area to the designated footprints. Using the dozer, the material was spread evenly throughout the appropriate area and was left to dry for approximately one to two days (as needed based on weather and material conditions). During this period, the material was frequently disked with a disking blade to accelerate and enhance the drying process. If rainy conditions were anticipated, the layer was sealed by rolling multiple times in order to prevent infiltration of water into the amended dredged material. The disking - aeration - drying process was continued until acceptable moisture contents were achieved. After aeration and drying, each lift was compacted with the use of a roller to a minimum of 6 percent of the maximum dry density (70.5 pcf). The optimum moisture content (50%) was confirmed by sampling at specific locations specified by a grid established over the embankment area. The wet density was determined at the center of each grid using the Troxler instrument. Then a soil sample was taken at the same location to determine the moisture content and dry density. This was achieved by oven drying the sample at 60 degrees Celsius for 24 hours, as specified in ASTM D If the moisture content exceeded 50% or the dry density was below 6% of the maximum dry density, the lift was determined as AFailed@ and it was disked, aerated and compacted again until it met the specified criteria. The figures illustrating the approximate locations of the field compaction monitoring conducted by Sadat Associates and the associated geotechnical results are included in Appendix B-3 of this report. The Humbolft Stiffness gauge and the hand held Clegg=s Hammer were used by Soiltek to field test the moisture content and density of each lift. This was done in coordination with SAI=s troxler test. A description of the field compaction monitoring using these methods is provided in Appendix F of this report. Furthermore, amended dredged material samples were collected prior to the compaction of each lift, in order to determine the moisture content of the material prior to its placement and aeration / drying phases. This monitoring activity was requested by the NJDOT during the May 26, 19 Task Force meeting. The first time this test was performed was on May 2, 19 during the construction of the seventh lift of Embankment No. 2. The moisture content results are included in the respective daily construction reports presented in Appendix B-1 of this report. Embankment No. 1 reached its final elevation of 24.5' above MSL by the compaction of seven lifts. 25 MARCH 2000 PROGRESS REPORT.DOC
263 Eleven lifts were needed for the completion of Embankment No. 2, which was raised to the elevation of 24.5' above MSL. Six inches of asphalt millings on top was used as final cover on both embankments to reach the final elevation of 25' MSL, 25' MSL and 1.5' MSL for Embankment No. 1, Embankment No. 2 and the access roadway, respectively. Six inches of soil on the slopes of the embankments were used for hydroseeding purposes. A total of four lifts were necessary for the construction of the access roadway, which reached the final elevation of 1.5' MSL. The originally recommended final elevation of 20' MSL was lowered since the elevation of the parking lot bordering the roadway in the western direction was also lowered from its original elevation of 20' MSL to 1.5' MSL. The access roadway elevation needed to be lower than the parking lot elevation to prevent any surface runoff flowing towards the parking area. The originally proposed manhole was not installed in the access roadway. Instead, the manhole used for the collection system for percolating water will be used for evaluating the effect of the dredged material on concrete. Table 1 details construction sequence and the compaction results for each of the lifts. Table 1: Construction Sequence and the Compaction Results Lift Elevation Start of Construction Date Results (MSL ft ) Troxler Test 1st- Embankment # /23/ 06/29/ Pass 2nd- Embankment #1 1 06/30/ 07/0/ Pass 3rd- Embankment # /12/ 07/16/ Pass 4th- Embankment # /19/ 07/26/ Pass 5th - Embankment # /15/ 6th - Embankment # /23/ 0/1/ Fail 0/19/ Pass 0/26/ Fail 0/31/ Pass 7th - Embankment # /01/ 09/14/ Pass th - Embankment # /14/ 09/23/ Pass 1st- Embankment # /09/ 03/29/ Pass 2nd- Embankment # /31/ 04/15/ Fail 04/21/ Pass 26 MARCH 2000 PROGRESS REPORT.DOC
264 Table 1: Construction Sequence and the Compaction Results Lift Elevation Start of Construction Date Results (MSL ft ) Troxler Test 3rd- Embankment # /2/ 05/05/ Pass 4th- Embankment # /06/ 05/11/ Fail 05/12/ Pass 5th- Embankment # /13/ 05/17/ Pass 6th- Embankment # /1/ 7th- Embankment # /2/ th- Embankment # /07/ 05/21/ Fail 05/27/ Pass 06/02/ Fail 06/07/ Pass 06/09/ Fail 06/11/ Pass 9th- Embankment # /14/ 06/16/ Pass 10th- Embankment # /17/ 06/23/ Pass 11th- Embankment # /25/ 06/30/ Pass 12th- Embankment # /06/ 07/19/ Pass 1st- Access Roadway 15 06/0/ 06/2/ Pass 2nd- Access Roadway 16 06/2/ 07/06/ Pass 3rd- Access Roadway 17 07/07/ 07/13/ Pass 4th- Access Roadway 1 07/14/ 07/26/ Pass Upon completion of the construction of the two embankments and the access roadway, the contractor concentrated on regrading and finishing the slopes of the structures. As previously mentioned, approximately six to eight inches of topsoil were placed on the slopes of the embankments. This material had already been chemically analyzed and met the protocol requirements established for acceptance as recyclable material at the OENJ Redevelopment Site. In addition, recycled asphalt milling was spread on top of the access roadway and the embankments to simulate the actual roadway conditions. Topsoil was also placed in the wetlands transition area, as well as in the stormwater ditches. The construction of the Demonstration Project was completed on October 19, MARCH 2000 PROGRESS REPORT.DOC
265 In summary, the embankments and access roadway were constructed as indicated in Drawing No. 1 of Appendix A. Tables 2 and 3 present the final geometry of the structures and the construction start and completion dates, respectively. TABLE 2: GEOMETRY OF THE STRUCTURES Structure Initial Elevation (ft MSL)(*) Final Elevation (ft MSL) Toe Width (ft) Top Width (ft) Slopes Number of Compacted Lifts Total Height (ft) Embankment No :1 NE Face 1.5:1 SE Face 15:1 ramps 10 Embankment No :1 both faces 15:1 ramps Access Roadway :1 both faces 15:1 ramps (*) : Elevation of top of platform TABLE 3: CHRONOLOGICAL SEQUENCE OF CONSTRUCTION Structure Starting Date Completion Date Embankment No. 1 June 23, 19 September 30, 19 Embankment No. 2 February 19, 19 June 2, 19 Access Roadway June 1, 19 July 16, Installation of Geotechnical Monitoring Devices The following geotechnical monitoring devices were installed: $ two horizontal inclinometers (one in each embankment); 2 MARCH 2000 PROGRESS REPORT.DOC
266 $ four vertical inclinometers (two in each embankment); and, $ fifteen (15) settlement plates (six in Embankment No. 1 and nine in Embankment No. 2) The monitoring equipment was installed under the supervision of Soiltek and Sadat Associates. The installation of the horizontal inclinometers, which was conducted under the supervision of Soiltek, involved the opening of a trench in the middle of each embankment=s footprint and the placement of a 3-inch sand layer at the bottom of the trench. The horizontal inclinometer was placed in the middle of the trench. The trench was backfilled with 4" of sand overlain by dredged material. The horizontal inclinometers for Embankment No. 2 and Embankment No. 1 were installed on April 26, 19 at elevation 13' MSL, and on July, 19 at elevation 17' MSL, respectively. On September 23, 19, 6-foot diameter pipe sections were installed as protective casings for the exposed sections of the horizontal inclinometers in order to prevent any mud from flowing into the trenches. The approximate locations of the horizontal inclinometers are presented in Drawing No.5 of Appendix A of this report. The vertical inclinometers were installed under the supervision of Soiltek on November 1 and 2, 19. The approximate locations of these inclinometers are illustrated in Drawing No.5 of Appendix A of this report. The locations of the settlement plates were flagged by McCutcheon on various dates. The installation was performed under the supervision of Sadat Associates. A total of fifteen settlement plates (#1 through #15) were installed at both the embankments (see Drawing No. 5 of Appendix A). The purpose of the settlement plates was to differentiate settlements which may occur in the foundation of the embankments from those occurring within the embankments. In order to evaluate the latter, three additional settlement plates were installed within Embankment No. 2. The settlement base and support plates were manufactured of carbon steel meeting ASTM A36 standards. The telltale pipe was one of standard weight, Schedule 40, and carbon steel meeting ASTM A53, Grade B standards. The protective floating casing had a Schedule 0 and was made of Polyvinyl Chloride (PVC) meeting ASTM D174, Type 1, Grade 1 standards. The telltale pipe was welded to the base of the settlement plates by E.E. Cruz. The protective casings were installed around the telltale pipe to provide frictionless and free vertical movement of the settlement plates. Every precaution was taken during the construction of subsequent lifts to protect the settlement plates. The material surrounding the settlement plate riser was placed to prevent any damage and to avoid 29 MARCH 2000 PROGRESS REPORT.DOC
267 moving the riser pipe. On April 27, 19, the six settlement plates (#1 through #6) in Embankment No. 2 were installed at elevation 14' MSL above the reinforcing fabric. On May 2, 19, settlement plates #7 and # were installed in the same embankment at elevation 1.5' MSL. On July 6, 19, settlement plate #9 was installed in Embankment No. 2 at elevation 23.5' MSL. On July 13, 19, all six settlement plates (#10 through #15) were installed in Embankment No. 1 at elevation 1' MSL. The first readings on the settlement plates of Embankment No. 2 were taken by McCutcheon on May 17, 19. The first readings on the settlement plates of Embankment No. 1 were taken by the same surveyors on July 13, 19. So far, monitoring data of the settlement plates have been collected on the following dates: May, 17, 19, June 1, 19, July 9, 19, July 14, 19, July 21, 19, July 30, 19, August 16, 19, August 30, 19, September 13, 19, October 4, 19, October 1, 19, November 15, 19, December 15, 19 and January 21, The readings have been submitted to Soiltek for review and evaluation. Further information on the installation of the geotechnical monitoring devices and the associated monitoring data is provided in Appendix F of this report. The location of the geotechnical monitoring devices are shown in Drawing No.5 of Appendix A. A summary on the information associated with the geotechnical monitoring equipment installed for the Demonstration Project is presented in Table MARCH 2000 PROGRESS REPORT.DOC
268 TABLE 4: SUMMARY DATA OF GEOTECHNICAL MONITORING DEVICES Geotechnical Device Date of Installation Location Bottom Elevation (ft MSL) Horizontal Inclinometer No. 1 April 26, 19 Embankment No Horizontal Inclinometer No. 2 July, 19 Embankment No Vertical Inclinometer VI-1 November 1, 19 Embankment No. 2 Vertical Inclinometer VI-2 November 1, 19 Embankment No. 2 Vertical Inclinometer VI-3 November 2, 19 Embankment No. 1 Vertical Inclinometer VI-1 November 2, 19 Embankment No. 1 Settlement Plate #1 April 27, 19 Embankment No Settlement Plate #2 April 27, 19 Embankment No Settlement Plate #3 April 27, 19 Embankment No Settlement Plate #4 April 27, 19 Embankment No Settlement Plate #5 April 27, 19 Embankment No Settlement Plate #6 April 27, 19 Embankment No Settlement Plate #7 May 2, 19 Embankment No Settlement Plate # May 2, 19 Embankment No Settlement Plate #9 July 6, 19 Embankment No Settlement Plate #10 July Embankment No. 1 1 Settlement Plate #11 July Embankment No. 1 1 Settlement Plate #12 July Embankment No. 1 1 Settlement Plate #13 July Embankment No. 1 1 Settlement Plate #14 July Embankment No MARCH 2000 PROGRESS REPORT.DOC
269 Geotechnical Device Date of Installation Location Bottom Elevation (ft MSL) Settlement Plate #15 July Embankment No Installation of Air Monitoring Devices As part of the air monitoring program, a meteorological (weather) station was installed by E.E. Cruz in April of 19 in Parcel G of the OENJ Redevelopment Site. Daily meteorological data were recorded for temperature, wind speed and wind direction using a Weather Monitor II meteorological station. The Weather Monitor was initially installed 30 feet above the ground surface near the footprint of Embankment No. 2. However, the final height of the Weather Monitor was approximately 22 feet above ground due to successive regrading of Parcel G. The weather station was used primarily to determine site-specific upwind and downwind directions for the positioning of area samplers, as well as to correlate the sampling data with site-specific meteorological events. After the air sampling program was completed, the Weather Monitor was disassembled and removed from the Site. 4.5 Installation of Collection Systems for Percolating Water Water collection systems were installed at the base of Embankment No. 1 and Embankment No. 2 to collect any liquid that could percolate through the embankments. Each of these systems consists of lateral 3/-inch crushed stone trenches that direct the percolated groundwater into the main 4-inch PVC perforated pipe. The collection systems for percolating water were designed and constructed to run along the length of each of the embankments to a manhole and then to an existing 6-inch HDPE leachate cleanout pipe. On April 6, 19, McCutcheon laid out the locations of the collection system for percolating water for Embankment No. 2. The installation of the collection system for percolating water for Embankment No. 2 started on April 16, 19 at the elevation of 14' MSL and was completed on April 26, 19. A slope of 0.15 % was maintained both for the lateral trenches and the main pipeline. 32 MARCH 2000 PROGRESS REPORT.DOC
270 The final layout and elevations of the collection system for percolating water for Embankment No. 2 are shown in Drawing No. 2 of Appendix A of this report. The installation of the collection system for percolating water for Embankment No. 1 was initiated on July 6, 19 at the elevation of 1' MSL and was completed on July 12, 19. A slope of 0.15% was maintained both for the lateral trenches and the main pipeline. The pipe connecting the collection systems for percolating water from the two embankments was installed on July 23, 19. On July 26, 19, the collection system for percolating water from Embankment No. 1 and Embankment No. 2 were connected to the manhole. An outlet from the manhole was connected to an existing leachate cleanout. The final layout and elevations of the collection system for percolating water for Embankments No. 1 and No. 2 are shown in Drawing No. 2 of Appendix A of this report. A table summarizing the construction schedule and engineering data associated with the collection systems for percolating water is presented below: TABLE 4: COLLECTION SYSTEMS FOR PERCOLATING WATER Percolated Water System Location Initiation of Installation Completion of Installation Peak Elevation (ft MSL) Slope System No. 1 Embankment No. 1 July 6, 19 Juy 12, % System No. 2 Embankment No. 2 April 16, 19 April 26, % 4.6 Installation of Stormwater Conveyance System On September 2, 19, McCutcheon surveyed the location of the stormwater ditches on the northern side of Embankment No. 2 and on the southern side of Embankment No. 1. The construction of the stormwater conveyance system was limited to the construction of only one ditch around each embankment. The installation of the stormwater ditches was initiated on October 14, 19 and was completed on October 19, 19. The work involved the excavation of the ditches at the base of the two embankments. The slope for the ditches= slopes for Embankment No. 1 and No. 2 were 1% and 33 MARCH 2000 PROGRESS REPORT.DOC
271 0.5%, respectively. An additional ditch connecting the two stormwater ditches was built to carry the stormwater runoff into the northern wetlands transition area. A total of six inches of top soil was placed on the top and the sides of the stormwater ditches, which were then hydroseeded. The configuration of the stormwater conveyance system and a typical detail of the stormwater ditches are presented in Drawing No. 2 and No.3, respectively, of Appendix A of this report. 4.7 Environmental Sampling and Geotechnical Monitoring During Construction A full description of the environmental monitoring and testing conducted during the construction phase is presented in Section 7.0 of this report. The environmental sampling during construction mainly consisted of the following: $ Analytical sampling of the SDM and leachate generated from the SDM samples collected during the winter (material storage phase). $ Organic content tests of SDM samples collected during the material storage in winter. $ Analytical sampling of percolated groundwater collected at the end of the collection systems. $ Analytical sampling of stormwater runoff. $ Air / dust sampling during construction activities. Geotechnical monitoring during construction mainly included the following: $ Field compaction testing. $ Settlement monitoring. $ Embankment slope monitoring. 34 MARCH 2000 PROGRESS REPORT.DOC
272 4. Construction Cost Estimation As presented in the geotechnical section of this report, the SDM is sensitive to moisture. If the dredge material failed the compaction criteria at a general location, it most likely failed the criteria due to excessive moisture content, rather than not reaching the criteria for maximum dry density. Consequently, a great portion of the construction activities was dedicated to drying the SDM to acceptable water content levels. Some concerns about the efforts and costs associated with this activity have been raised by the NJDOT. In fact, during the Task Force meeting of May 26, 19, NJDOT suggested that SAI monitor the moisture contents of the SDM before construction of the embankments. The objective of the water content monitoring was to compare the efforts and costs associated with handling of the dredged material to those associated with handling of conventional materials used for the construction of subbase in roadway projects. On May 2, 19, SAI began collecting samples to determine initial moisture content. At least two SDM samples from each stockpile were collected before construction. The following construction activities were initially considered for the evaluation of the construction efforts: $ trucking and hauling; $ spreading; $ disking and drying; and $ compaction. Timing for the performance of these activities was monitored for each 12-inch lift. In addition, ambient temperature, rain events, and other associated factors, such as equipment downtime and HASP implementation, were observed and monitored. The following assumptions were made in preparing the cost estimate. $ Material costs were not considered since the purpose of this evaluation was to assess incremental costs due to material workability. In addition, costs for trucking and hauling were not considered since these costs are generally similar to those associated with conventional materials. $ The equipment and labor cost for spreading, disking and compaction were included in the cost estimation since these costs are directly associated with the handling of SDM exhibiting 35 MARCH 2000 PROGRESS REPORT.DOC
273 high water content. The costs of the equipment and labor are the actual charges by the subcontractors. $ No additional costs for geotechnical and environmental testing, engineering supervision, construction management, and overhead and profit were considered because these activities were considered similar to other construction activities (i.e., compaction testing) or projectspecific. On an average, each lift of SDM was spread in two days. Disking and compacting generally took two to four days before meeting construction specifications. The number of days for the drying, aerating and compacting efforts depended on the initial moisture content and weather conditions. The cost estimation is summarized in Table B-4-1 of Appendix B-4. The overall construction cost for one cubic yard of the dredged material was estimated to be approximately $.10. As expected, the cost per cubic yard varied for each lift depending on the volume of the dredged material, initial moisture content, and the weather conditions. During rain events, the construction of each lift took longer. A measurable correlation can be established between the construction cost and rain events. Based on the construction periods of rain events and no rain events, the cost analysis was further divided into two groups as presented in Tables B-4-2 and B-4-3 of Appendix B-4, respectively. The cost associated with the lift which experienced rain events during the construction period was estimated as $.60 per cubic yard as compared to the $7.50 per cubic yard of the lift which experienced no rain event. The costs associated with spreading and compacting a conventional material used for the construction of subbase in the roadway projects were estimated using MEANS CostWorks 19 for a project site in Elizabeth Township, New Jersey. The costs for handling one cubic yard of a conventional material were estimated to be approximately $2.00. The costs associated with the handling of dredged material are three to four times higher than the costs associated with the handling of a conventional material. The high costs associated with the dredged materials can be possibly reduced by using different drying methods during the mixing and stabilization of the RDM. The temporary storing of the dredged material during periods of dry and warm weather will help reduce the initial moisture content by minimizing the use of equipment and labor for the on-site aerating and drying of SDM. 5.0 GEOTECHNICAL MONITORING ACTIVITIES 36 MARCH 2000 PROGRESS REPORT.DOC
274 Geotechnical monitoring has been conducted to confirm or obtain new information on the engineering characteristics and behavior of the SDM when used in the construction of embankments. As indicated in Section 2 of this report, geotechnical monitoring and evaluation are being conducted by Soiltek, Inc., under the direction of Dr. Ali Maher. Geotechnical monitoring conducted prior to, during, and after construction mainly include: $ cement content testing; $ subsurface investigation for design of the foundation; $ laboratory testing of SDM strength parameters; $ field compaction monitoring; $ settlement monitoring; $ inclinometer monitoring; and, $ cone penetrometer testing for long-term strength evaluation. The project scedule at which these tests and evaluations have been performed is indicated in the Project Flow Chart presented in Section 1.4 of this report. Prior to construction, a subsurface investigation was conducted to specify the foundation improvement needed to assure stability of the embankments and to ascertain that the foundation settlements would not interfere with the structural analysis of the embankments. The recommendations made in the foundation analysis were incorporated in the final design for construction. This investigation is considered site-specific and is not directly relevant to evaluating engineering properties of the SDM when used in construction of embankments. This section summarizes the geotechnical activities related to characterizing the SDM and the structural behavior of the embankments. A complete description of the status of the geotechnical investigations has been presented by Soiltek, Inc., in a separate report entitled AStatus of Geotechnical Investigations@ dated January 31, 2000 (Soiltek Status Report). A copy of the Soiltek Status Report is included in Appendix F of this report. 5.1 Cement Content Monitoring Field investigations to confirm the cement content in the cement-sdm mixed at the Sealand processing facility was initiated on September 29 and was completed on November 10, 1. These 37 MARCH 2000 PROGRESS REPORT.DOC
275 activities were conducted in order to evaluate the homogeneity of the mixture. Stabilized dredged samples were collected at a frequency of one sample for every 1,000 cubic yards of SDM (almost on a daily basis). The cement content was determined in the laboratory using the Standard Test Method for Cement Content of Soil - Cement Mixtures (ASTM D 06-96). The targeted cement content of % was used as the basis for the comparison of the results. A detailed description of the work conducted and the results obtained is presented in the report entitled, ACement Content Determination of OENJ Amended Dredge in Elizabeth, New Jersey@, prepared by Soiltek, and dated January 25, 19. Generally, the results indicate that the cement content ranged from 1% to 21% with an average cement content of more than %. A copy of this report is attached in Appendix D. 5.2 Geotechnical Laboratory Investigation Laboratory testing needed to determine construction specifications was previously presented in the Revised Final Workplan. The status of the laboratory investigations is presented in the Soiltek Status Report included in Appendix F. When the pilot project was first developed, the use of three different mixtures of SDM was proposed in the construction of the Embankments and temporary access roadway. Each mixture was to contain different percentages of cement and fly ash. Conceptually, it was anticipated that it would be necessary to add both cement and flyash to the raw dredged material to obtain the optimum workability of the dredged material when long term storage was needed. However, experience with the % cement-sdm during the stabilization, stockpiling, and aeration phases revealed that the SDM behaves comparably to typical soils when stored for long periods of time. As such, the addition of fly ash to the mixture in the field to enhance its workability was not considered necessary. Based on the results of the preliminary laboratory tests, past experience with the SDM, and the project logistics, it was decided that the Demonstration Project would be performed using a single admixture, containing % cement and no fly ash. However, to obtain additional information on the properties of different admixtures, a geotechnical laboratory investigation is being performed on the following admixtures (which may be considered for use in future projects or comparison purposes when evaluating the structural integrity of the embankments): (a) Mix A consisting of dredged material with % cement; 3 MARCH 2000 PROGRESS REPORT.DOC
276 (b) Mix B consisting of dredged material with % cement and 10% fly ash; and (c) Mix C consisting of dredged material with 4% cement. The purpose of this investigation is to evaluate the engineering behavior of each mixture when the percent cement is reduced and determine any potential additional benefits (workability and/or strength) resulting from the addition of fly ash to the SDM. According to the Revised Workplan, the geotechnical laboratory work would consist of the following tests and frequencies: Round A: Round B: Round C: Lab Tests at 5% of the Modified Proctor between 2 and 1 Month Curing Time (for Mixes A, B & C) Unified Classification (ASTM D-1140, 422, 431) 3 samples per mix Strength Points) (ASTM D-4767) 3 samples per mix Swell Pressure (ASTM D-4546) 3 samples per mix Consolidation (ASTM D-2435) 3 samples per mix Resilient Modulus (MR AASHTO T74) 3 samples per mix Permeability (ASTM D-504) 3 samples per mix Compaction (ASTM D-1557) 3 samples per mix Durability (ASTM D-559) 3 samples per mix Lab Tests at 90% of the Modified Proctor between 2 and 1 Month Curing Time (for Mixes A, B & C) Unified Classification (ASTM D-1140, 422, 431) 3 samples per mix Strength Points) (ASTM D-4767) 3 samples per mix Swell Pressure (ASTM D-4546) 3 samples per mix Consolidation (ASTM D-2435) 3 samples per mix Resilient Modulus (MR AASHTO T74) 3 samples per mix Permeability (ASTM D-504) 3 samples per mix Compaction (ASTM D-1557) 3 samples per mix Durability (ASTM D-559) 3 samples per mix Lab Tests at 5% of the Modified Proctor between 4 and 6 Months Curing Time (for Mixes A, B & C) Unified Classification (ASTM D-1140, 422, 431) 3 samples per mix Strength Points) (ASTM D-4767) 3 samples per mix 39 MARCH 2000 PROGRESS REPORT.DOC
277 Swell Pressure (ASTM D-4546) Consolidation (ASTM D-2435) Resilient Modulus (MR AASHTO T74) Permeability (ASTM D-504) Compaction (ASTM D-1557) Durability (ASTM D-559) 3 samples per mix 3 samples per mix 3 samples per mix 3 samples per mix 3 samples per mix 3 samples per mix Round D: Lab Tests at 90% of the Modified Proctor between 4 and 6 Months Curing Time (for Mixes A, B & C) Unified Classification (ASTM D-1140, 422, 431) 3 samples per mix Strength Points) (ASTM D-4767) 3 samples per mix Swell Pressure (ASTM D-4546) 3 samples per mix Consolidation (ASTM D-2435) 3 samples per mix Resilient Modulus (MR AASHTO T74) 3 samples per mix Permeability (ASTM D-504) 3 samples per mix Compaction (ASTM D-1557) 3 samples per mix Durability (ASTM D-559) 3 samples per mix The determination of the appropriate compaction criteria for the construction of the roadway and embankments was based on the results of geotechnical testing performed on the mixes. Specifically, laboratory tests at 5% and 90% of the Modified Proctor were conducted to determine moisture and density requirements for the compaction of the SDM. By evaluating the results of the laboratory work conducted in Rounds A and B, the optimum dry density for the % cement SDM was determined to be 70.5 pcf. For the construction of the roadway and the embankments a minimum dry density of 6% of the optimum dry density and a maximum allowable moisture content of 50% were established to ensure proper compaction of the material. As previously mentioned, the Status of the laboratory investigations have been included in the Soiltek Status Report which is presented in Appendix F. The results of the geotechnical laboratory testing will be presented in detail in the final geotechnical report to be prepared at the completion of the Demonstration Project. 5.3 Geotechnical Field Monitoring The geotechnical field testing has included the following activities: 40 MARCH 2000 PROGRESS REPORT.DOC
278 $ Field compaction monitoring $ Settlement monitoring $ Embankment Field Monitoring Preliminary results of the geotechnical testing are included in the Soiltek Status Report attached to Appendix F of this report Field Compaction Monitoring During the construction, field tests were performed to determine moisture content and density using the Troxler Test, the Humboldt Stiffness Gauge and the Clegg Impact Hammer. In the field, the Humboldt Stiffness Gauge and the Clegg Impact Hammer tests were performed by Soiltek, while the Troxler Test was performed by Sadat Associates. The tests were conducted upon compaction of each 12-inch lift until each lift met both the dry density and moisture content criteria. Descriptions of the testing and results are presented in Appendix F of this report. Troxler and Moisture Content Tests The Troxler Nuclear Gage Density Instrument is capable of directly measuring the wet density and moisture content of soils and calculating the dry density based on these parameters. Past experience with the use of this unit to measure these parameters in cement-sdm indicate that moisture, and consequently dry density values obtained in the field are not always accurate. To overcome this deficiency, wet density, dry density and moisture field values were measured as follows: $ A 60-foot by 60-foot grid system was established in each lift for each of the embankments. $ For every 12-inch layer constructed, in-situ wet density measurements of the compacted SDM was made at each point of the grid system using the Troxler unit. $ Samples of the compacted SDM were collected from each location in order to measure the moisture content in the field laboratory as per ASTM D2216. Knowing the moisture content, dry density was then calculated. $ The compaction criteria (a moisture content less than 50%, and a minimum dry density of 41 MARCH 2000 PROGRESS REPORT.DOC
279 6% of the maximum dry density achieved in the lab - 70 pcf) were then evaluated in the field. Actual results of the Troxler and moisture content tests for each of the compacted lifts are presented in Appendix B-3 of this report. Clegg and Humboldt Tests As described in the Soiltek Status Report, the Humboldt Stiffness Gauge (HSG) and Clegg Hammer (CH) were used to determine if a method could be developed that would allow the dry density determination of the dredge material without waiting a minimum of 24 hours for a moisture content determination. A detailed description of the field application and subsequent evaluation of the HSG and the CH tests is included in the Soiltek Status Report. The HSG and CH compaction control tests were generally performed at the same locations of the Troxler tests. These methods were compared to the results of the nuclear density gauge to evaluate the accuracy of dry density predictions. Preliminary results of the analysis performed by Soiltek can be listed as follows: $ Dry densities measured by the HSG/CH tests and the Troxler-Conventional Moisture Content tests are in good agreement for densities ranging between 60 tp 65 pcf. $ The HSG test may produce more accurate results for a wide range of densities if the actual grain size of the material is considered for the constant calibration values. Evaluation of the calibration procedures can also result in finding more accurate testing procedures for the CH test. $ Calibration analysis along with recommendations regarding the applicability of the HSG and CH devices for compaction control of the SDM are being performed and will be included in the final geotechnical report Settlement Monitoring As described in the Soiltek Status Report, settlement plate readings have been collected to monitor settlements at the foundation and within the embankments. 42 MARCH 2000 PROGRESS REPORT.DOC
280 Readings from settlement plates, vertical and horizontal inclinometers have been collected to evaluate settlements and deformations of the embankments. Readings from the settlement plates have been obtained by McCutcheon and was submitted to Soiltek for review and evaluation. The settlement plate monitoring has been conducted on the following dates: $ May, 17, 19 $ June 1, 19 $ July 9, 19 $ July 14, 19 $ July 21, 19 $ July 30, 19 $ August 16, 19 $ August 30, 19 $ September 13, 19 $ October 4, 19 $ October 1, 19 $ November 15, 19 $ December 15, 19 $ January 21, 2000 The data have been processed and graphically represented by Soiltek. Based on the settlement analysis presented in the Soiltek Status Report, foundation settlements for both embankments range from 0.32 to 1.23 feet. Settlements within the embankments are found negligible. A complete analysis of the collected data will be presented in the final geotechnical report Embankment Field Monitoring A total of four vertical inclinometers (two for each embankment) and two horizontal inclinometers (one for each embankment) were installed to monitor the vertical and horizontal movement of the embankments. Data from the horizontal inclinometer have been collected since October 1, 19. All together, three readings from Embankment No. 1 and one reading from Embankment No. 2 have been recorded for evaluation. On the other hand, vertical inclinometer readings have been taken in the field since November 19. Two sets of vertical inclinometer readings for each embankments (top and toe) have been taken so far. 43 MARCH 2000 PROGRESS REPORT.DOC
281 The inclinometer data have been processed and graphically represented by Soiltek. Based on the Soiltek Status Report, 12 to 15 inches of settlement has occurred for embankment No 1 and embankment No 2, respectively. However, the vertical inclinometer readings have not shown any noticeable movements at the monitored slopes of the embankments. A complete analysis of the collected data will be presented in the final geotechnical report Field Curing Evaluation - Cone Penetration Testing Cone penetration tests (ACPT@) have been conducted by Soiltek to determine the in-situ strength characteristics of the dredge material and to monitor changes of strength with time. Additionally, results of the CPTs are being evaluated to verify strength laboratory results. The CPT field investigation and preliminary evaluation are presented in the Soiltek Status Report. As described in this report, a total number of 25 locations were tested for both embankments during the months of October and November, 19. An initial evaluation of results indicates that the laboratory and the field shear strength measurements are within reasonable agreement. 5.4 Preliminary Data Analysis Based on the preliminary evaluation of the field data collected so far, the following conclusions have been included in the Soiltek Status Report: $ Cement inclusion increased the strength of the material significantly under ideal in-place treated conditions. However, the strength gain was reduced due to the continual breaking of cemented bonds in the dredge material due to mixing and disking. This effect has been observed in the laboratory during testing and also in the field by cone penetration testing. $ As long as the dredge material is compacted under the construction compaction criteria, consolidation effects are minimal. This has been confirmed by laboratory testing, as well as by review of the field data collected from the settlement plates. $ Utilizing alternative methods for compaction control, such as the Humboldt Stiffness Gauge and the Cleff Impact Hammer, may allow for a more time efficient way of determining dry density of the cement SDM. However, these devices and methods need to be carefully calibrated with respect to the site conditions prior to any field work. $ The addition of the geomembrane under the embankments allowed for a more even 44 MARCH 2000 PROGRESS REPORT.DOC
282 settlement of the structures. Differential settlement in the embankments was minimized by using this type of foundation improvement. $ Laboratory results and computer models used to predict the slope stability of the embankment have shown that the embankments have a fairly high factor of safety against slope failure. This has been verified from the available inclinometer data. From the field results, it can be concluded that the embankments have structurally performed up to the expected levels. The Soiltek Status Report also presents the following preliminary observations made during construction: $ The SDM is sensitive to moisture. If the dredge material failed the compaction criteria at a general location, it most likely failed the criteria due to excessive moisture content, rather than not reaching the maximum dry density. $ The continual mixing and disking of the dredge material to aid its drying seemed to have an adverse affect on the cementation of the material. (i.e., the cement bonds of the material were continually broken. Then, once the material was recompacted, some of the cementation effect of the material had dissipated from previous cementing. A solution to this problem may be to allow the material to hydrate and compact in place. A greater strength gain may be seen this way.) $ Due to the higher temperatures and less precipitation, the material is much easier to use and place in the summer months than either the spring or fall months. $ Utilizing the geomembranes underneath the embankments allows for an even distribution of settlement to occur during the consolidation of the garbage and organic layers, especially on Embankment #2. Although the actual preloading and its corresponding effects were not directly measured, settlements on Embankment No. 1 seem to be less than Embankment No. 2 due to initial preloading of stockpiled dredge material. 6.0 AIR MONITORING ACTIVITIES 45 MARCH 2000 PROGRESS REPORT.DOC
283 6.1 Introduction The potential occupational and area-wide air quality impacts from the use of SDM in the construction of the embankments were assessed by the collection of personal and area samples of airborne particulate matter. The personal and area sampling program was performed by SAI in association with the Environmental and Occupational Health Sciences Institute (EOHSI). The results of this sampling, as presented by EOHSI, are included in Appendix E-1 of this report. Air quality field studies were performed by measuring the amount of airborne particulates generated and the concentration of various contaminants associated with the particulate matter during the use of SDM. For the purpose of this Demonstration Project, target activities were monitored including the drying/aeration and construction of the embankments and using SDM. Area-wide samples of airborne particulate matter were collected to evaluate the general airborne concentration of contaminants within and around the work areas. The area samples were collected at upwind, downwind and two crosswind locations perpendicular to the upwind and downwind samplers. Concentrations measured at each location were compared to each other to assess relative changes in contaminant concentrations which may be associated with the work activity. Samples of airborne particulate matter were also collected in the workers= breathing zone by fitting personal samplers to on-site workers for determining occupational exposure. The results of the personal sampling were compared to occupational exposure limits defined by the: $ Occupational Safety & Health Administration (AOSHA@); $ National Institute of Occupational Safety & Health (ANIOSH@); and, $ American Conference of Governmental Industrial Hygienists (AACGIH@). The area samples were analyzed for the following: $ total suspended particulates (ATSP@); $ selected metals; $ poly aromatic hydrocarbons (APAHs@); $ polychlorinated biphenyls (APCBs@); and, $ pesticides. 46 MARCH 2000 PROGRESS REPORT.DOC
284 The personal samples, on the other hand, were analyzed for the following: $ respirable particulate matter (particles having an aerodynamic diameter of 10 microns or less- PM 10 ); $ selected metals; $ poly aromatic hydrocarbons (APAHs@); $ polychlorinated biphenyls (APCBs@); and, $ pesticides. To assess worst case concentrations of airborne particulate matter which may be generated from the use of SDM during the construction of the embankments, sampling was performed during the spring and summer months when maximum dust generation was expected. Sampling was performed during two events: $ Event 1 April-May 19 $ Event 2 June-July 19. No sampling was performed on rainy days, since rain suppressed the generation of dust Overview of SDM Processing and Construction Activities Field air sampling was performed considering different aspects of the construction activities. Stabilized dredged material was prepared in the Sealand dredged processing facility by mixing raw dredged material with % cement. The material was then transported by trucks and stockpiled at Parcel G of the OENJ Redevelopment Site. Since the SDM was too moist to be used directly for construction purposes, it was aerated/dried in discrete batches prior to use. The SDM was loaded from the stockpiles using an excavator/trackhoe onto trucks and transported onto the embankment area where it was spread using a dozer. It was then disked 2-3 times a day using disking blades attached to the dozer to turn the SDM for aeration and drying. At the end of each day, or when the SDM had dried to the required moisture content, the SDM was compacted using a roller. The operations of aeration/drying and construction were performed concurrently during the Demonstration Project. In this manner, the embankments/roadway were built by layering SDM in discrete Alifts@ until the target elevation was attained. Sampling Event 1 was conducted during the construction and aeration/drying of SDM at 47 MARCH 2000 PROGRESS REPORT.DOC
285 Embankment No. 2, while Sampling Event 2 was performed during the aeration/drying of the material, and construction of Embankment No. 1 and the temporary access roadway Parameters Selected for Analyses The parameters selected for analyses in the area and personal samples were based on their potential presence in raw dredged material and laboratory-sdm. As indicated in the preliminary characterization data in Table 1 of Appendix E-2, raw dredged material (ARDM@) collected from the Union Dry Dock & Repair site in Hoboken, New Jersey, contained low levels of PAHs ranging from <0.01 mg/kg to 6.5 mg/kg. The analysis of airborne particulate matter was based on the following evaluation of previous SDM sampling results: $ Benzo(a)anthracene, benzo(a)pyrene and benzo(b)fluoranthene were detected in the RDM above the applicable Residential Direct Contact Soil Cleanup Criteria (ARDCSCC@). Benzo(a)pyrene was detected in one sample of laboratory-sdm at 0.69 mg/kg, which is above the RDSCC of 0.66 mg/kg, but it was also present in the laboratory blank. All other PAHs in the RDM and laboratory-sdm were detected at concentrations lower than the RDCSCC. $ The PCBs total concentrations in the RDM and laboratory-sdm exceeded the RDCSCC of 0.49 mg/kg but were below the NRDCSCC of 2 mg/kg. $ Nominal concentrations of pesticides such as beta-bhc, heptachlor epoxide, dieldrin, DDE, DDD, DDT and gamma-chlordane were detected in the raw and lab-sdm. However, none of the pesticide concentrations exceeded the RDCSCC. $ For metals, beryllium was detected at levels ranging from 1.1 to 3.4 mg/kg, exceeding the RDCSCC of 1 mg/kg in seven out of eight samples of RDM and laboratory-sdm. Lead was detected at 467 mg/kg, in excess of the RDSCC of 400 mg/kg in one sample of laboratory- SDM, and zinc was detected at 2,190 mg/kg in one sample of RDM in excess of the NRDCSCC of 1,500 mg/kg. All other metals analyzed were detected at concentrations below the RDCSCC. $ Dioxins and furans in samples of RDM and laboratory-sdm ranged from 1.1 x 10⁻⁶ to 3.76 x 4 MARCH 2000 PROGRESS REPORT.DOC
286 10-3 mg/kg. Based on these data, certain PAHs, PCBs, pesticides and metals were investigated to determine their presence in airborne particulate matter. 6.2 Methods and Materials Meteorological Monitoring On-site meteorological data was recorded for temperature, wind speed and wind direction using a Weather Monitor II (Davis Instruments) meteorological station that was installed prior to any air sampling activities. The Weather Monitor was initially installed 30 feet above the ground surface near the footprint of Embankment No. 2. Over successive re-grading of the Embankment No. 2 area, the final height of the Weather Monitor was approximately 22 feet above ground surface. The Weather Monitor was used primarily to determine site-specific upwind and downwind locations for the positioning of area samplers, and to correlate the sampling data with site-specific meteorological events. After the air sampling program was completed, the Weather Monitor was disassembled and removed from the demonstration site Area Samples Area samples for the measurement of TSP in the ambient air around the SDM drying and construction areas were collected by drawing a measured quantity of air into a covered housing and through unpreserved, pre-weighed quartz fiber filters (Schleicher and Schuell No. 25, 20 x 25 cm). The apparatus used for this purpose was the Graseby General Metals Works High Volume Sampler. Samples were collected in accordance with the Reference Method for the Determination of Suspended Particulate Matter in the Atmosphere (High Volume Method) (40 CFR Part 50, Appendix B procedures). The area samples were collected as composite samples over a period of three to six days. The number of high volume samplers used and their layout is described in Section of this report. At the end of each sampling day, the quartz fiber filters were covered with plexiglass sheets while mounted in their holders, and stored in a refrigerator or icebox onsite. This was done to minimize any sample contamination or losses from volatilization between sampling periods. The filters were brought back to the sample housing in the construction area for the next sampling day, and were 49 MARCH 2000 PROGRESS REPORT.DOC
287 placed at appropriate locations based on the prevailing wind direction. The flow rates (nominally between cubic feet per minute) were checked each day before and after the sampling, and at regular intervals during the day, using a Magnehelic flow measuring device, which had been calibrated using a primary calibrating instrument called a Rootsmeter [1]. Total suspended particulates were measured gravimetrically based on the difference in filter weight before and after the sampling event. The filter was then split into two portions, one portion was analyzed for particulates of PAHs using gas chromatography-mass spectrometry, and PCBs and selected pesticides by gas chromatography with Ni 63 electron capture detector [1], [1] at the Department of Environmental Sciences at Rutgers University, New Brunswick, New Jersey, under the direction of Dr. S. Eisenreich. The second portion of the filter was analyzed for metal particulates using a modification of EPA Method 200. for Inductively Coupled Plasma-Mass at the EOHSI, Piscataway, New Jersey. It was anticipated that due to the low concentrations of metals, PAHs, PCBs, and pesticides detected in the raw and SDM samples, only low concentrations, if any, of these parameters will be detected in the airborne particulates. Even with the three to six day compositing period, it was likely that the majority of the concentrations resulting from this testing program would be less than the applicable method detection limits if the analyses were performed in strict accordance with NJDEP-approved methodologies. Therefore, to obtain lower detection limits (nanograms/m 3 ) during sample analysis, Rutgers University research laboratories were utilized for sample analysis using modified NJDEP [6] [7] [] EPA, July 193, APTI Course Atmospheric Sampling, US Environmental Protection Agency, Air Pollution Training Institute, MD 20, Environmental Research Center, Research Triangle Park, NC 27711, 193, EPA 450/ Franz, T.P., and Eisenreich, S., ASnow Scavenging of Polychlorinated Byphenyls and Polycyclic Aromatic Hydrocarbons in Minnesota@, Environ. Sci. Technol., 1, 32 (12), Simcik, M.F., Franz, T.P., Zhang, H., Eisenriech, S., AGas-Particle Partitioning of PCBs and PAHs in the Chicago Urban and Adjacent Coastal Atmosphere: States of Equilibrium@, Environ. Sci. Technol., 1, 32 (2), MARCH 2000 PROGRESS REPORT.DOC
288 analytical methodologies. This allowed for the generation of more accurate analytical results and more accurate assessments of potential air quality impacts. During the summer months (Event 2), when ambient temperatures were high enough to measure the volatilization of semi-volatile compounds in the SDM, the high volume area samplers were additionally fitted with a polyurethane foam (APUF@) (0.049 g/cm 3 density) adsorbent plug to collect vapor phase concentrations of PCBs, pesticides and PAHs. These analytes were measured using gas chromatography-mass spectrometry at Rutgers University. In addition to the measurement of TSP, separate area samples (upwind and downwind sets) were collected using low flow pumps for PM 10. These samples were analyzed by Princeton Analytical Laboratories, Princeton, New Jersey using the NIOSH 0600 analytical method. Due to a sampling volume limitation of NIOSH Method 0600, samples for PM 10 were collected for approximately two hours Personal Samples Personal samples were collected using SKC Aircheck or Ametek Model MG-4 constant low-flow pumps that were fitted with analyte-specific sampling filters/media onto the construction personnel (operators of loaders, trucks, rolling and disking equipment). The personal samplers were calibrated before and after each sampling day using a bubble flow meter. The NIOSH methods used for sampling and analyses, and the nominal flow rates at which the personal pumps were operated are as follows: Analyte Analytical Method Nominal Flow Rate (L/min) Respirable Particulate Matter (PM 10 ) NIOSH Metals NIOSH Pesticides and PCBs NIOSH Poly aromatic hydrocarbons NIOSH 5506/ The personal samples were collected over an -hour work shift in accordance with applicable NIOSH methods, except the samples for PM 10 which were collected for approximately two hours due to a sample volume limitation of the analytical method (NIOSH 0600). All personal samples were analyzed by Princeton Analytical Laboratories. 51 MARCH 2000 PROGRESS REPORT.DOC
289 6.3 Area and Personal Sample Collection Area Samples Two to four high volume air samplers were used for the collection of area samples. An upwind air sampling location was used to establish background air quality and to assess potential upwind sources of airborne particulates (control sample), whereas downwind and crosswind samplers were used to collect airborne particulates within the construction area. The wind direction was determined each morning from the on-site weather station, and upwind, crosswind and downwind samplers were accordingly positioned approximately 150 feet from the edge of the active drying and construction areas, where the potential for elevated concentrations of airborne particulates was the highest. For screening purposes, only two high volume samplers were used during Event 1. If the wind direction changed during the day, the samplers were relocated according to the appropriate wind direction. However, on days when the wind direction fluctuated significantly, sampling was discontinued. Most days had a constant wind direction, so no major adjustments were necessary after the initial placement of the filter. For Event 2, a total of four high volume samplers was used. In addition to the upwind control location, one sampler was placed directly downwind and two samplers were placed at crosswind locations, perpendicular to the upwind and downwind samplers. This was done to collect representative samples of airborne particulates generated during the sampling day, by accounting for changes in wind direction. Sampling was performed during active drying and construction activities at the Site which ranged from four to eight hours a day. The area samples were collected as composites over three to six days in order to obtain sufficient particulate loading on the quartz-fiber filter, and allow for the adequate detection of metals and target organic compounds in the particulates. Table 2 of Appendix E-2 of this report summarizes the sampling frequency and the analytical parameters. As indicated on Table 2, two sets of composite area samples were collected; i.e., two pairs of upwind and downwind area samples during Event 1. During Event 2, another two sets of area samples were collected, however, each set also consisted of two crosswind samples. A lower compositing interval (i.e., 2-3 days) was used during Event 2 because higher temperatures and drier days at this time were expected to favor greater dust 52 MARCH 2000 PROGRESS REPORT.DOC
290 generation, and sufficient particulate loading was observed on the quartz filters in a shorter time period. Furthermore, since it was summer time, the daily work-shift had been extended to ten hours to expedite embankment construction. In addition, the upwind and downwind samplers were fitted with PUF adsorbent traps for the collection of vapor-phase concentrations of PAHs, PCBs and pesticides. Due to the limited availability of PUF samplers, the crosswind samplers were not fitted with the PUF backup. Five sets of upwind and downwind area samples were collected for PM 10 during Event 1. No additional area samples for PM 10 were collected during Event Personal Samples During the collection of area samples in Events 1 and 2, two -hour work shifts were selected from each sampling event to perform personal sampling. Personal sampling was conducted on days when at least four construction personnel were available within the work area for an eight-hour sampling period. This was done so that all four of the target analytes, i.e., PAHs, PCBs/pesticides, metals and PM 10, could be sampled on the same day under similar work and weather conditions. For reasons explained above, personal sampling for PM 10 was performed for a two-hour period only. Each individual=s activities and specific work areas were noted at the time of sampling. The personal monitoring pumps were provided to construction personnel at the start of the day=s activities and retrieved from them during their lunch break. The same samplers were replaced on the same workers afterwards, and retrieved at the end of the day. Because of the need to dry the SDM (alternate periods of disking and aeration) prior to the construction of subsequent lift of the embankments, many work-shifts at the demonstration Site required less than -hours of labor. As a result, several members of the construction crew split their daily work-shift between the Demonstration Site and the adjacent Jersey Gardens Mall construction site. Therefore, the availability of personnel who could wear a personal sampler and remain within the confines of the SDM Demonstration Site for an entire -hour work-shift was limited. On an average construction day, only one to two personnel were available to dedicate -hours of work at the embankments. In addition, since it was cumbersome for active site workers to be equipped with more than one personal monitor, it was necessary to limit the number of samples that could be collected during each sampling event. The number of personal samples collected during Events 1 and 2 is indicated on Table 2 of Appendix E-2 of this report. 53 MARCH 2000 PROGRESS REPORT.DOC
291 6.4 Results and Data Evaluation Meteorological Data Meteorological data collected during Events 1 and 2 are summarized in Appendix E-2 of this report. The actions taken to compensate for fluctuations in wind direction so that representative samples of airborne particulates would be collected included shifting the sampling locations whenever possible to re-orient the samplers according to the new prevailing wind direction, switching filters, and/or shutting down the samplers when wind directions changed frequently or by 90 degrees or more. These measures are summarized in Appendix E-3 and were based on specific weather conditions observed during sampling Background Conditions and Potential Interferences The OENJ Redevelopment Site, of which Parcel G was used as the Demonstration Site for the construction of embankments, was a former landfill. Sections of the OENJ Redevelopment Site were being redeveloped to construct the Jersey Gardens Mall concurrently with the construction of the demonstration roadway embankments at Parcel G. Therefore, it is possible that the air samples collected upwind and downwind of the embankments were potentially impacted by activities unrelated to the Demonstration Project. Specifically, one crosswind area sample (Sample ID# T070J), collected during Event 2 (July 14-15, 19), was significantly impacted by extraneous activities occurring in the vicinity of the Demonstration Site. These activities involved heavy equipment traffic in the vicinity of one crosswind high volume sampler. Due to the topography of the Site and the limited space around the embankments, it was not possible to move this crosswind sampler to a location that would prevent the interference of nearby unrelated activities. As a result, Sample T070J is noted to have higher dust loadings and consequently, higher concentrations of metals, PCBs/pesticides, and PAHs. Similarly, visual observations during the Event 1 sampling reveal that higher particulate loadings on upwind samplers were due to nearby mall construction activities rather than embankment construction activities. During Event 1, dust from the mall construction site was observed to blow towards the upwind sampler (approximately 1,000 ft from mall construction site) but did not get carried farther to impact the downwind sampler to the same extent (approximately 2,000 feet away from mall construction site). As a result, upwind concentrations for Event 1 are marginally higher 54 MARCH 2000 PROGRESS REPORT.DOC
292 than downwind concentrations for all the parameters analyzed. Further, the OENJ Redevelopment Site is located in a completely industrialized area with several large manufacturing facilities that may potentially emit airborne contaminants. Other sources of potential air pollution include the heavy commercial traffic due to the Elizabeth Sea Port, the Newark Airport and the New Jersey Turnpike which are near the OENJ Redevelopment Site. Specific background impacts/interferences have been described, wherever observed, in the following sections of the report Area Samples Visual observations of SDM used in embankment construction indicate that the material was generally moist so that dust generation from SDM was minimal when the material was stockpiled or compacted after construction of a lift. Minor amounts of SDM became airborne only when the material was transported or actively disked for the purpose of drying. The concentrations of upwind/downwind and crosswind samples have been evaluated with respect to each other. Apparent incremental increases in the concentration of downwind and crosswind samples have been identified herein. However, due to the apparent contributing factors from nearby potential sources, it is difficult to determine if the apparent increases in contaminant concentrations are reflective of the SDM or other sources. As shown in Tables 3 through 5 of Appendix E-2, the area samples showed measurable concentrations of metals, PCBs and PAHs since these parameters were analyzed using very low detection limits (ng/m 3 ). In general, the relative concentration differences between upwind and downwind/crosswind sampling locations for metals, PAHs and PCBs are approximately "1 order of magnitude. However, even with these relative differences in magnitude, the detected concentrations of these parameters indicate that the SDM used in embankment construction was not a major source of airborne metals, PAHs or PCBs in the particulate phase TSP and PM 10 Total Suspended Particles (TSP) observed in the area samples ranged from 0.10 to 1.16 mg/m 3. The differences in TSP in spring and summer do not appear to be significant. During Event 1, the TSP and Respirable Particulate Matter (PM 10 ) concentrations were actually higher at upwind locations than at downwind locations (see Table 6 of Appendix E-2). Visual observations at the time of 55 MARCH 2000 PROGRESS REPORT.DOC
293 sample collection reveal that higher particulate loadings on upwind samplers were due to nearby mall construction activities rather than embankment construction activities. During Event 1, dust from the mall construction site was observed to blow towards the upwind sampler. Dust from this background operation may have also impacted the downwind sampler, but at much lower levels. A comparison of the TSP and PM 10 data shows that although sampling time-frames for the TSP and PM 10 samples were different (16-36 hour composites v/s 2-hour composites), the PM 10 results were within a factor of 2 to 4 of the TSP results. This indicates that a significant portion of the particulate matter in the air at the Demonstration Site was of respirable size. During Event 2 (July 14 to 15, 19), construction and heavy equipment traffic not associated with the use of the SDM was observed to generate dust plumes near one cross wind sampling location (T070J), but did not appear to significantly impact other sampling locations. As a result, higher particulate loadings (TSP) were observed at this crosswind sample compared to the other downwind/crosswind samples collected during this event. The New Jersey Ambient Air Quality Standard for Total Suspended Particulates (0.75 mg/m 3 ) and the National Primary Ambient Air Quality Standard for PM 10 (0.05 mg/m 3 ) are based on 24-hour average concentrations measured during twelve consecutive months. Since the TSP and PM 10 concentrations at the Demonstration Site represent worst-case concentrations determined very close to the source areas (within 150 feet of the drying and construction activities), over a much shorter sampling time-frame, direct comparisons of the TSP and PM 10 worst-case concentrations with the ambient air quality criteria cannot be made Metals Measurable concentrations of metals were detected in the area samples (See Table 3 of Appendix E- 2). For reasons explained above, upwind metal concentrations for Event 1 were higher than downwind metal concentrations due to interferences from nearby sources unrelated to the Demonstration Project. In addition, metal concentrations were also higher in one crosswind sample (T070J) (Event 2) due to unrelated activities occurring in the vicinity of the high volume sampler. The most abundant metals detected were aluminum, barium, copper, magnesium, titanium and zinc. Generally, except for instances where the upwind samples (or the crosswind sample that was apparently affected by nearby construction activity unrelated to the Demonstration Project) indicated higher concentrations than the downwind and crosswind samples, the results for upwind and crosswind samples are within the same order of magnitude. No consistent trends are observed 56 MARCH 2000 PROGRESS REPORT.DOC
294 between the downwind/crosswind samples and the upwind samples, and based on the low concentrations (ng/m 3 ) detected in all the samples collected, the SDM does not appear to be a major source of target metals PCBs/Pesticides As shown in Table 5 of Appendix E-2, relative differences in concentration between the upwind and downwind particulate phase PCBs were insignificant during the Event 1 sampling. For Event 2, during the July 14-15, 19 sampling, one cross-wind sample (T070J) was noted to have particulate phase PCBs that were an order of magnitude higher (5.7 x 10⁻¹ Fg/m 3 ) than the other downwind (3.22 x 10⁻² Fg/m 3 ) and crosswind samples (2.6 x 10⁻² Fg/m 3 ), as well as the upwind sample (3.61 x 10⁻² Fg/m 3 ). However, this crosswind sampling location, as explained previously, was impacted by a higher dust loading due to nearby construction activities that were unrelated to the Demonstration Project. As such, Sample T070J is not a truly representative sample of the Demonstration Site activities. During the July 19-21, 19 sampling, however, a crosswind sample (Sample ID# T070H) was noted to have a significantly higher particulate-phase PCB concentration (.24 x 10-2 Fg/m 3 ) compared to the downwind (2.23 x 10⁻² Fg/m 3 ) and other crosswind (2.96 x 10⁻² Fg/m 3 ) samples, as well as the upwind sample (1.3 x 10⁻² Fg/m 3 ). This relatively higher concentration in the Sample T070H is attributed to changes in the wind direction which may have resulted in potentially higher dust loadings at certain times during the area sampling. Vapor-phase PCB concentrations were slightly higher in the downwind samples than in the upwind samples, although upwind and downwind concentrations were in the same order of magnitude. During the July 14-15, 19 sampling, the upwind PCB vapor concentration was 2.7 Fg/m 3 and the downwind PCB vapor concentration was 5.56 Fg/m 3. For the July 19-21, 19 sampling, the upwind PCB vapor concentration was 2.97 Fg/m 3 and the downwind concentration was 3.56 Fg/m 3. Vapor-phase PCB concentrations observed in the summer were three orders of magnitude higher than particulate phase PCBs at both upwind and downwind sampling locations. A comparison of the observed vapor-phase PCB concentrations to known urban (Chicago) levels of PCBs in summer shows that the vapor phase PCBs at the Demonstration Site, including upwind concentrations, were also approximately three orders of magnitude higher than the Chicago levels (See Table of Appendix E-2). As shown in Table 1 of Appendix E-2, total PCB concentrations in the SDM range from <0.5 Fg/kg to 40 Fg/kg. Based on the results of the particulate phase and vapor concentrations of PCBs, since 57 MARCH 2000 PROGRESS REPORT.DOC
295 significant background contributions are evident, there is no conclusive indication that the SDM is a primary source of PCB emissions in the area. The Demonstration Site is located in a highly industrialized area of Elizabeth, New Jersey, which may possibly have a high background concentration of PCBs. Additional investigation of the vapor phase PCBs would be required to evaluate the SDM as a potential source of PCB emissions, including quantitative data on the magnitude of decay in the PCB concentrations as distance from the SDM source increases. Like PCBs, particulate concentrations of pesticides were lower than vapor-phase pesticide concentrations measured during Event 2. Depending on the volatility of an individual pesticide, vapor concentrations ranged from being within the same order of magnitude to three orders of magnitude higher than the corresponding particulate phase concentrations. Vapor concentrations of heptachlor were the highest noted, followed by concentrations of hexachlorobenzene and 4,4-DDE. However, in most cases, the downwind concentrations of these vapors were only marginally higher than the corresponding upwind concentrations. Particulate concentrations of 4,4-DDT were highest among the particulate phase pesticides, and only marginally higher in the downwind samples compared to the upwind samples. A relatively high, anomalous concentration of pesticides was observed in the cross-wind sample T070J, and as explained in previous sections, this sample was impacted with a higher dust loading than its downwind/crosswind and upwind counterparts due to activities in the vicinity of the sampler that were unrelated to the Demonstration Project. Similarly, another crosswind sample T070I also revealed relatively higher concentrations than its downwind counterpart due to higher dust loadings resulting from temporary shifts in the wind speed and direction during sampling PAHs Upwind PAH concentrations during Event 1 are marginally higher than the downwind concentrations, although both upwind and downwind concentrations are in the same order of magnitude (See Table 4 of Appendix E-2). As explained in Section 6.4.2, due to the location of the upwind samplers, mall construction activities apparently impacted the upwind samplers during Event 1. For the July 14-15, 19 sampling during Event 2, except for sample T070J which was impacted by activities unrelated to the Demonstration Project, the differences between downwind/crosswind samples and the upwind samples are marginal, and within the same order of magnitude. For the July 19-21, 19 sampling, crosswind sample T0701 was noted to have relatively higher PAH concentrations than the downwind/crosswind or upwind samples. The relatively higher concentration of PAHs in crosswind sample T0701 than the downwind sample is attributed to 5 MARCH 2000 PROGRESS REPORT.DOC
296 fluctuations in the wind speed and direction for certain periods during the sampling. In general, PAH vapor concentrations appear to be higher for certain PAHs than particulate phase concentrations, possibly due to differences in volatility of the PAHs. The detected PAH concentrations (both particulate and vapor phase) are of such small magnitude (#1 ng/m 3 for most compounds) that it cannot be conclusively determined whether the SDM is a primary source of PAHs or if significant background contributions exist. Based on the data, however, it can be concluded that PAHs are not emitted in large quantities from the use of SDM Overview of Area Sampling Results The target particulate pollutants and vapor phase PAH concentrations measured in the ambient air around the embankment construction areas are similar to concentrations of each pollutant measured previously or currently in New Jersey and other locations in the United States (Tables 7 to 10 of Appendix E-2) [1] [1]. Because the Demonstration Project was performed in an industrial location, background conditions may have influenced some of the samples, however, even with these interferences, the results indicate that using the dredge material in the manner done at the Demonstration Site does not have a significant effect on the air concentrations of most compounds in the surrounding work place and community environment. Individual compounds, except vapor phase PCBs, measured in the ambient air were no more than an order of magnitude greater than reported in individual samples elsewhere. The exception was vapor phase PCBs, which were at concentrations much greater than observed in a major urban area. In addition, since the samples were collected only ~150 feet from areas of active construction, the diffusion of any air contaminants contributed by the SDM is expected to be significant as distance from the source areas increases Personal Samples [9] [10] Sweet, C.W., Vermette, S.J, ASources of Toxic Trace Elements in Urban Air in Illinois@, Environmental. Science. and Technology, 13, 27 (12), Cari Lavorgna Gigliotti, Environmental Sciences, APolycyclic Aromatic Hydrocarbons in the New Jersey Coastal Atmosphere@, Thesis submitted January MARCH 2000 PROGRESS REPORT.DOC
297 The results for almost all metals, PCBs, pesticides and PAHs were below the applicable detection limits for the personal air samples (see Tables 11 to 14 of Appendix E-2). The specific work activities of the individuals sampled apparently did not significantly impact the concentrations of airborne contaminants to which they were exposed. The airborne concentrations of the target contaminants in the workers= breathing zone were compared to the following applicable occupational exposure limits: $ Occupational Safety and Health Administration (AOSHA@): Maximum Permissible Exposure Limit (APEL@) expressed as a time-weighted average; the concentration of a substance to which most workers can be exposed without adverse effect averaged over a normal -hour workday or a 40-hour work week. The OSHA PEL is a regulatory exposure limit. $ National Institute of Occupational Safety and Health (ANIOSH@): Recommended Exposure Limits (AREL@) for an -10 hour time weighted average. $ American Conference of Governmental Industrial Hygienists (ACGIH): Threshold Limit Value (ATLV@) expressed as a time weighted average; the concentration of a substance to which most workers can be exposed without adverse effects Respirable Particulate Matter The respirable particulate matter (PM 10 ) concentrations observed in personal samples were below the method detection limit during the spring sampling, but measurable levels were found in the summer samples. This is because the SDM was drier in the summer, resulting in the generation of greater airborne dust in the workers= breathing zone. The PM 10 concentrations in the summer, however, were at least one order of magnitude below the PEL of 5 mg/m 3 and the TLV guideline of 3 mg/m 3 for PM 10 and, therefore, within the acceptable ranges for -hour exposure (See Table 11 of Appendix E-2). There are no RELs for respirable dust Metals Measurable levels of chromium, lead, nickel, thallium, selenium, and zinc were noted in all six of the personal samples collected (See Table 12 of Appendix E-2). However, these air concentrations were well below the applicable PELs, RELs or TLVs PCBs and Pesticides 60 MARCH 2000 PROGRESS REPORT.DOC
298 Concentrations of PCBs and pesticides were below the method detection limits (< to <0.01 mg/m 3 ) in all seven personal samples collected for these parameters (See Table 13 of Appendix E- 2). In general, PCB and pesticide concentrations were at least two orders of magnitude less than the applicable PELs or TLVs. The NIOSH REL for PCBs is a conservative guideline used for 10-hour exposure to known human carcinogens (0.001 mg/m 3 /10 hr). However in this case, a comparison of PCB concentrations with this REL cannot be made because the analytical detection limits for PCBs by Princeton Analytical are higher than the REL PAHs Acenaphthene, acenaphthalene, and benzo(e)pyrene were detected at very low concentrations (ranging from to ng/m 3 ), but no PELs, RELs or TLVs have been developed for these compounds. Naphthalene was also detected, but at concentrations well below the applicable PEL, REL or TLV Overview of the Personal Sampling Results Concentrations of PM 10, metals, PCBs, pesticides and PAHs were well below OSHA PELs indicating that breathing zone concentrations of these potential contaminants did not pose adverse health risks to workers using SDM for construction purposes. 6.5 Conclusions and Recommendations Based on the results of the air sampling program described above, the potential impacts to ambient air quality and worker health are not expected to be significant for total and respirable airborne particulates, metals, PAHs and pesticides. While PCBs in the particulate phase do not appear to be present in significant concentrations in both ambient air and in the workers= breathing zone, vaporphase PCB concentrations measured in the area samples were found to be higher than those measured in another urban area. The data do not conclusively indicate that the SDM is the primary source of the observed PCB vapor concentrations. It is possible that background sources may have contributed to the observed PCB vapor concentrations. 61 MARCH 2000 PROGRESS REPORT.DOC
299 7.0 ENVIRONMENTAL FIELD MONITORING ACTIVITIES 7.1 Introduction A comprehensive environmental monitoring plan was developed to assess the environmental characteristics of cement SDM used in the construction of the embankments. Based on this plan, air, stormwater, percolated groundwater and dredged material samples were collected to assess the behavior and chemical properties of SDM. As presented in Section 1.4 of this report, environmental monitoring activities mainly included the sampling and characterization of: $ Solids: Raw Dredged Material (RDM) Stabilized Dredged Material (SDM) $ Liquids Leachate generated from SDM samples Stormwater Runoff Percolated Groundwater $ Air Airborne Particulates / dust samples collected during construction Sampling has been performed at different phases of the project for various parameters in order to characterize the materials involved in the construction and assess potential adverse environmental conditions. The project phase at which the environmental sampling has been performed is indicated in the Project Flow Chart presented in Figure 2 of Section 1.4 of this report. The RDM and SDM were characterized according to NJDEP [1] guidelines set forth to determine the suitability of the material for upland beneficial use. In addition, the RDM and SDM were also analyzed for other parameters as recommended by the US Army Corps of Engineers [1] (AUSACOE@). The stabilized and the raw dredged materials were tested for the same analytical parameters as [11] [12] The Management and Regulation of Dredging Activities and Dredged Material in New Jersey=s Tidal Waters, October 17. USACOE Technical Note DOER-C2, February MARCH 2000 PROGRESS REPORT.DOC
300 recommended by the NJDEP and USACOE. As requested by the NJDEP on March 17, 1, SDM samples were subjected to the Modified Multiple Extraction Procedure The MMEP test is a modified version of the Multiple Extraction Procedure set forth in the EPA Method 1320 [1] which has been used for approval of material deposited at the OENJ-Elizabeth Site. For comparative purposes, the leachates produced by the MMEP were analyzed for the same parameters as the RDM and SDM with the exception of those analyses that can only be performed on soil samples, such as cation exchange capacity or sodium adsorption ratio. In addition to the laboratory testing, air, stormwater and percolated groundwater samples have been collected from the field and analyzed for different parameters to evaluate the actual environmental conditions of the embankments during and after construction. The stormwater and percolated groundwater samples were analyzed for the same parameters as the MMEP leachates. The potential impacts to ambient air quality and worker health from the generation of airborne particles of the SDM were assessed by the collection of area and personal samples. The air quality study and its results are presented in detail in Section 6.0 of this report. Potential long-term changes in the characteristics of the SDM will be determined by collecting samples of SDM from the embankments after their construction has been completed. This data will be compared to the RDM and SDM data collected before and during construction of the embankments to evaluate temporal changes in the chemical characteristics of dredged material. A detailed description of the environmental sampling is presented in the next sections. Table H-1 of Appendix H summarizes the number of samples that were collected and remain to be collected as per the environmental sampling plan. A preliminary screening evaluation of the results is presented in Section 7.5. [13] The Multiple Extraction Procedure (MEP) is designed to simulate the leaching that a waste will undergo from repetitive precipitation of acid rain. The repetitive extractions reveal the highest concentration of each constituent that is likely to leach in a natural environment. Method 1320 is applicable to liquid, solid, and multiphase samples. 63 MARCH 2000 PROGRESS REPORT.DOC
301 7.2 Environmental Sampling Preliminary environmental investigations performed before the construction of the embankments included the characterization of RDM and SDM Environmental Sampling of the RDM Raw dredged material used in the Demonstration Project originated from the Union Dry Dock Site, located in Hoboken, New Jersey. The area where samples were collected included Pier 1, Pier 2 and Pier 3 which are identified in Figure 4. Two rounds of sampling and analysis were performed to characterize the raw dredged material from this location. April 1 Samples The first round of sampling was performed in April 1. The actual location and number of samples collected were based on the NJDEP=s AThe Management and Regulation of Dredging Activities and Dredged Material in New Jersey=s Tidal Waters@, dated October, 17, in consultation with the NJDEP=s Land Use Regulation Program. The sampling scheme was approved in a letter from the NJDEP dated March 17, 1. A total of thirteen (13) sediment core samples were collected at the Union Dry Dock Site as follows: Location of Sediment Core Samples Number of Core Samples Sample ID Composite ID North of Pier A Area between Pier 1 and Pier B South of Pier C Area between Pier 2 and Pier D As indicated above, the sediment core samples collected in each of the above areas were then composited into four composite samples. These samples were analyzed for: $ Semi-volatile organic compounds on the USEPA Target Contaminant List (SVOCs) $ PCBs/Pesticides on the USEPA Target Contaminant List 64 MARCH 2000 PROGRESS REPORT.DOC
302 $ Metals on the Target Analyte List 65 MARCH 2000 PROGRESS REPORT.DOC

303
PD - 6 THRUST RESTRAINT DESIGN EQUATIONS AND SOIL PARAMETERS FOR DUCTILE IRON AND PVC PIPE
 PD - 6 THRUST RESTRAINT DESIGN EQUATIONS AND SOIL PARAMETERS FOR DUCTILE IRON AND PVC PIPE 4 3 2 1 D D C C B B A A 4 3 2 1 Thrust Restraint Design Equations and Soil Parameters These equations and soil
Geotechnical Engineering Report
 Geotechnical Engineering Report Pavement Subgrade Survey State Highway 125 over Hudson Creek Ottawa County, Oklahoma September 23, 21 Terracon Project No. 415121 Prepared for: Guy Engineering Services,
GEOTECHNICAL INVESTIGATION I-15 SIGN BRIDGES LAS VEGAS EA JANUARY
 GEOTECHNICAL INVESTIGATION I-15 SIGN BRIDGES LAS VEGAS EA 73171 JANUARY 06 MATERIALS DIVISION STATE OF NEVADA DEPARTMENT OF TRANSPORTATION MATERIALS DIVISION GEOTECHNICAL SECTION GEOTECHNICAL REPORT I-15
Typical Subsurface Profile. November 28, 2016
 November 28, 2016 RSCCD Facility Planning, District Construction and Support Services 2323 N. Broadway, Suite 112, Santa Ana, CA 92706 Attn: Re: Ms. Allison Coburn Facilities Project Manager P: (714) 480-7530
 FIGURES Printed By: aday Print Date: 3/23/2011 12:48:08 PM File Name: \\geodesign.local\files\jobs\m-r\penskeauto\penskeauto-1\penskeauto-1-01\figures\cad\penskeauto-1-01-vm01.dwg Layout: FIGURE 1 VICINITY
ACKNOWLEDGMENT OF SPONSORSHIP
 ACKNOWLEDGMENT OF SPONSORSHIP This work was sponsored by the American Association of State Highway and Transportation Officials, in cooperation with the Federal Highway Administration, and was conducted
USE OF DREDGED MATERIALS FOR THE CONSTRUCTION OF ROADWAY EMBANKMENTS
 USE OF DREDGED MATERIALS FOR THE CONSTRUCTION OF ROADWAY EMBANKMENTS PREPARED BY: SADAT ASSOCIATES, INC. PRINCETON, NEW JERSEY ON BEHALF OF: OENJ CORPORATION, INC. BAYONNE, NEW JERSEY SUBMITTED TO: NEW
SOIL MECHANICS Assignment #2: Soil Classification Solution.
 Geotechnical Engineering Research Laboratory One University Avenue Lowell, Massachusetts 01854 Edward L. Hajduk, D.Eng, PE Lecturer PA105D Tel: (978) 934 2621 Fax: (978) 934 3052 e mail: Edward_Hajduk@uml.edu
GEOTECHNICAL STUDY PROPOSED CONCRETE ROADWAY TIKI ISLAND COMMUNITY GALVESTON COUNTY, TEXAS PROJECT NO E
 GEOTECHNICAL STUDY PROPOSED CONCRETE ROADWAY TIKI ISLAND COMMUNITY GALVESTON COUNTY, TEXAS PROJECT NO. 15-945E TO VILLAGE OF TIKI ISLAND TIKI ISLAND, TEXAS BY SERVICING TEXAS, LOUISIANA, NEW MEXICO, OKLAHOMA
Concrete basement walls are
 DESIGNING Concrete Basement Walls Make sure the wall is strong enough to resist the lateral pressure of the soil Concrete basement walls are designed to do two main jobs. One job is supporting the house;
SPECIFICATIONS FOR PRECAST MODULAR BLOCK RETAINING WALL SYSTEM (revised 5/8/7)
") Page 1 of 7 STONE STRONG SYSTEMS SPECIFICATIONS FOR PRECAST MODULAR BLOCK RETAINING WALL SYSTEM (revised 5/8/7) PART 1: GENERAL 1.01 Description A. Work includes furnishing and installing precast modular
Page 1 of 7 STONE STRONG SYSTEMS SPECIFICATIONS FOR PRECAST MODULAR BLOCK RETAINING WALL SYSTEM (revised 5/8/7) PART 1: GENERAL 1.01 Description A. Work includes furnishing and installing precast modular
April 7, Webster Street Sub-Surface Stormwater Storage System Bid No Bid Date: 4/13/17 ADDENDUM NO 1
 PUBLIC WORKS DEPARTMENT David A. Jones, P.E., Director April 7, 2017 Webster Street Sub-Surface Stormwater Storage System Bid No. 2017-022 Bid Date: 4/13/17 ADDENDUM NO 1 Please make the following changes
Experience of a Large Scale Unintentionally Long Surcharge on Organic Soils
 Experience of a Large Scale Unintentionally Long Surcharge on Organic Soils Ying Liu, Ph.D., P.E., Senior Engineer, Group Delta Consultants, Inc., 37 Amapola Ave., Suite 212, Torrance, CA. Email: yingl@groupdelta.com
Geotechnical Engineering Report
 Geotechnical Engineering Report Turner Turnpike Widening Milepost 210 to 218 Drainage Structure Pipe Jacking Creek County, Oklahoma July 1, 2016 Terracon Project No. 04165017 Prepared for: Benham Tulsa,
SOIL CLASSIFICATION BASICS Commonly based on grain size and soil consistency. Several classification systems exist:
 SOIL CLASSIFICATION BASICS Commonly based on grain size and soil consistency. Several classification systems exist: 1. Unified System (USCS) (ASTM D2487-11). 2. American Association of State Highway and
In preparation for constructing buildings on a property, the builder. Site Preparation CHAPTER
 CHAPTER 3 Site Preparation In preparation for constructing buildings on a property, the builder must consider a number of factors related to code requirements. The buildings must be located according to
August 15, 2006 (Revised) July 3, 2006 Project No A
 July 3, 2006 Project No A") August 15, 2006 (Revised) July 3, 2006 Project No. 01-05-0854-101A Mr. David Reed, P.E. Protean Design Group 100 East Pine Street, Suite 306 Orlando, Florida 32801 Preliminary Soil Survey Report Polk Parkway
August 15, 2006 (Revised) July 3, 2006 Project No. 01-05-0854-101A Mr. David Reed, P.E. Protean Design Group 100 East Pine Street, Suite 306 Orlando, Florida 32801 Preliminary Soil Survey Report Polk Parkway
TRENCH EXCAVATION AND BACKFILL
 SUDAS Standard Specifications Division 3 - Trench and Trenchless Construction Section 300 - Trench Excavation and Backfill TRENCH EXCAVATION AND BACKFILL PART - GENERAL.0 SECTION INCLUDES A. Trench Excavation
(1) All sanitary landfill facilities, at a minimum, shall include the following:
 All sanitary landfill facilities, at a minimum, shall include the following:") 3745-27-08 Sanitary landfill facility construction. (A) Applicability. The construction requirements for a sanitary landfill facility specified in this rule are applicable to a particular facility or permit
3745-27-08 Sanitary landfill facility construction. (A) Applicability. The construction requirements for a sanitary landfill facility specified in this rule are applicable to a particular facility or permit
PE Exam Review - Geotechnical
 PE Exam Review - Geotechnical Resources and Visual Aids Item Page I. Glossary... 11 II. Parameters... 9 III. Equations....11 IV. Tables, Charts & Diagrams... 14 1. Module 1 - Soil Classification... 14
APPENDIX A DRAINAGE STUDY PHASE 2 ALTERNATIVE IMPROVEMENTS CRYSTAL LAKE ALTERNATIVE 4C IMPROVEMENTS LAKEWOOD PIRATELAND SWASH HORRY COUNTY, SC
 DRAINAGE STUDY PHASE ALTERNATIVE IMPROVEMENTS CRYSTAL LAKE ALTERNATIVE C IMPROVEMENTS ` FOR: LAKEWOOD PIRATELAND SWASH HORRY COUNTY, SC APPENDIX A J-.000 Prepared by: Savannah, GA Charleston, SC Myrtle
BUILDING DEVELOPMENT POLICIES AND PROCEDURES ADMINISTRATIVE/GENERAL
 GEOTECHNICAL GUIDELINES FOR THE USE OF LIME DURING CONSTRUCTION Section Page 4-0X0l Applicability and Restrictions 2 4-0X02 Expansive Soil Determination 5 4-0X03 Mixture Design for Lime Stabilization of
Full-Depth Reclamation with Cement
 Full-Depth Reclamation with Cement 28th Annual Regional Local Roads Conference David L. Rettner Sr. Vice President American Engineering Testing, Inc. Design Construction Field Testing Performance Types
GEOTECHNICAL REPORT B-1942
 GEOTECHNICAL REPORT TUSCARORA BRIDGE REPLACEMENT B-1942 E.A. 73561 March 2011 MATERIALS DIVISION STATE OF NEVADA DEPARTMENT OF TRANSPORTATION MATERIALS DIVISION GEOTECHNICAL SECTION GEOTECHNICAL REPORT
Laboratory Soil Classification
 Laboratory Soil Classification Lin Li, Ph.D. Center for Environmentally Sustainable Transportation in Cold Climates University of Alaska Fairbanks June 6 th, 2016 2016 Summer Transportation Institute,
Performance of Mechanically Stabilized Earth walls over compressible soils
 Performance of Mechanically Stabilized Earth walls over compressible soils R.A. Bloomfield, A.F. Soliman and A. Abraham The Reinforced Earth Company, Vienna, Virginia, USA ABSTRACT: Two projects have recently
Determination of Design Infiltration Rates for the Sizing of Infiltration based Green Infrastructure Facilities
 Determination of Design Infiltration Rates for the Sizing of Infiltration based Green Infrastructure Facilities 1 Introduction This document, developed by the San Francisco Public Utilities Commission
SECTION AGGREGATES
 SECTION 32 05 00 AGGREGATES PART 1 GENERAL 1.01 SUMMARY A. Section Includes: 1. Aggregate base 2. Engineered fill 3. Backfill 4. Fine filter aggregate (non-frost susceptible fill) 5. Riprap 6. Recreational
SECTION EXCAVATION AND EMBANKMENT. B. Subbase Grading A samples for gradation analysis.
 PART 1 GENERAL 1.1 DESCRIPTION A. The WORK under this Section includes providing all labor, materials, tools and equipment necessary for excavation and embankment construction to the lines, grades and
1.02 RELATED WORK: Refer to the following sections for related work: Section 4000-Concrete Materials and Methods
 SECTION 2000- EARTHWORK PART 1- GENERAL 1.01 SCOPE: This Section covers excavation, fill, and compaction of earth and rock for roadway, embankments, structural foundations, and planted areas. Topics include
geotechnical and construction materials consultants
 geotechnical and construction materials consultants City of Dallas Public Works and Transportation Department 320 E. Jefferson Blvd, Room 307 Dallas, Texas 75203 ATTN: Mr. Vincent Lewis, P.E. Email: Vincent.lewis@dallascityhall.com
CEEN Geotechnical Engineering
 CEEN 3160 - Geotechnical Engineering Lab Report 1 Soil Classification prepared by Student Name 1 Student Name 2 Student Name 3 Student Name 4 Tuesday Lab Time 9:30 10:45 Lab Team 1 Submission Date INTRODUCTION
Geotechnical Engineering Report
 Geotechnical Engineering Report Shaw AFB East Gate Entrance Control Facility Amendment Sumter, South Carolina September 13, 2010 Terracon Project No. 73105020A Prepared for: TranSystems North Charleston,
1.364 ADVANCED GEOTECHNICAL ENGINEERING HOMEWORK No. 5
 .364 ADVANCED GEOTECHNICAL ENGINEERING HOMEWORK No. Due: Friday December 2. This question concerns the stability of an open slope cutting that will be used to provide construction access for a 3.2m deep
Pavement Design Webinar
 Pavement Design Webinar JUNE 23, 2016 COLORADO ASPHALT PAVEMENT ASSOCIATION Who is CAPA? Producers /Suppliers Local Agencies Contractors Designers We are a resource for YOU 1 Mike Skinner, PE Director
GEO TECHNICAL INVESTIGATION REPORT (1449-R2-NALANDA UNIVERSITY)
") GEO TECHNICAL INVESTIGATION REPORT (1449-R2-NALANDA UNIVERSITY) AT THE SITE FOR PROPOSED SITE FOR NEW CAMPUS OF NALANDA UNIVERSITY, RAJGIR, DISTT. NALANDA, FOR UNIVERSITY ENGINEER NALANDA UNIVERSITY, COUNCIL
GEO TECHNICAL INVESTIGATION REPORT (1449-R2-NALANDA UNIVERSITY) AT THE SITE FOR PROPOSED SITE FOR NEW CAMPUS OF NALANDA UNIVERSITY, RAJGIR, DISTT. NALANDA, FOR UNIVERSITY ENGINEER NALANDA UNIVERSITY, COUNCIL
SECTION 1100 GRADING 1102 MATERIALS AND DEFINITIONS.
 SECTION 1100 GRADING 1101 SCOPE. This section covers the performance of all work required for grading the project in coordination with all previous work performed at the locations shown on the contract
Geotechnical Properties of FGD Scrubber Material
 2017 World of Coal Ash (WOCA) Conference in Lexington, KY - May 9-11, 2017 http://www.flyash.info/ Geotechnical Properties of FGD Scrubber Material R. E. Pease, PhD, PE 1, Alan F. Rauch, PhD, PE 1, and
Introduction to Foundations on Fill and Backfilling
 Introduction to Foundations on Fill and Backfilling Course No: G01-003 Credit: 1 PDH J. Paul Guyer, P.E., R.A., Fellow ASCE, Fellow AEI Continuing Education and Development, Inc. 9 Greyridge Farm Court
Characterizing Engineering Properties of Foundry Sands
 Characterizing Engineering Properties of Foundry Sands Craig H. Benson, PhD, PE Recycled Materials Resource Center University of Washington chbenson@u.washington.edu www.recycledmaterials.org Recycled
Time-Dependent Strength Behavior of Soil-Bentonite Slurry Wall Backfill
 Time-Dependent Strength Behavior of Soil-Bentonite Slurry Wall Backfill Jeffrey Evans 1, and Christopher Ryan 2 1 Bucknell University, Department of Civil and Environmental Engineering, Lewisburg, PA 17837
Earth Mechanics, Inc. Geotechnical & Earthquake Engineering
 Earth Mechanics, Inc. Geotechnical & Earthquake Engineering TECHNICAL MEMORANDUM DATE: June 3, 2009 EMI PROJECT NO: 01-143 TO: COPY: FROM: SUBJECT: John Chun, P.E. / Port of Long Beach (POLB) Jorge Castillo
GEOTECHNICAL ENGINEERING REPORT
 GEOTECHNICAL ENGINEERING REPORT PROJECT MINECRAFT ACCESS ROAD BOYDTON PLANK ROAD DINWIDDIE COUNTY, VIRGINIA JOB NUMBER: 37775.003 PREPARED FOR: DINWIDDIE COUNTY PO BOX 70 DINWIDDIE COUNTY, STATE 23841
Full Depth Reclamation
 Full Depth Reclamation FDR Has Been Around A While 2 3 What is Full Depth Reclamation (FDR)? Full Depth Reclamation is a pavement rehabilitation technique in which the full flexible pavement section and
SCG INTERNATIONAL TRINIDAD AND TOBAGO LIMITED COUVA CHILDREN S HOSPITAL
 SCG INTERNATIONAL TRINIDAD AND TOBAGO LIMITED COUVA CHILDREN S HOSPITAL GEOTECHNICAL CONSULTANT Prepared by Checked by Approved by Mr. C Allen Dr. Derek Gay Dr. Derek Gay Signature Date Signature Date
CIV E Geotechnical Engineering I Consolidation
 Purpose Determine the magnitude and time rate of settlement for a compressible cohesive soil. Required reading Das 2006 Sections 10.4 to 10.16 (pages 312 to 358). Theory Bringing soil samples into the
Soil Relationships and Classification
 15 Soil Relationships and Classification Thomas F. Wolff Michigan State University 15.1 Soil Classification Grain-Size Characteristics of Soils Atterberg Limits and Plasticity The Unified Soil Classification
Advances in Design of Landfills Over CCR Ponds and Landfills
 Advances in Design of Landfills Over CCR Ponds and Landfills Michael F. Houlihan, P.E., BCCE Geosyntec Consultants Columbia, Maryland 18 October 2012 Overview Current State of Practice Key Design Issues
Site Location. Figure 1: Site Location Map US-24 and I-275 Interchange Ash Township, Monroe County, Michigan
 Site Location 0606 1771 North Dixie Highway Monroe, Michigan 48162 Tel: 734-289-2200 Fax: 734-289-2345 www.manniksmithgroup.com Figure 1: Site Location Map US-24 and I-275 Interchange Ash Township, Monroe
Apparent Coefficient of Friction, f* to be Used in the Design of Reinforced Earth Structures. Technical Bulletin: MSE - 6
 The Reinforced Earth Company 8614 Westwood Center Drive Suite 1100 Vienna, Virginia 22182-2233 Telephone: (703) 821-1175 Telefax: (703) 821-1815 www.reinforcedearth.com Apparent Coefficient of Friction,
Recycled Base Aggregates in Pavement Applications
 Recycled Base Aggregates in Pavement Applications Jeffrey S. Melton, Ph.D. Outreach Director, Recycled Materials Resource Center jeffrey.melton@unh.edu The Big Picture Sustainability Nexus of major issues
A STUDY ON THE PERFORMANCE OF DEEP LAYER SUBGRADE STABILIZATION
 Research Experience for Undergraduates at UNC Charlotte Sean Windt Civil and Environmental Engineering Department A STUDY ON THE PERFORMANCE OF DEEP LAYER SUBGRADE STABILIZATION CONTENTS INTRODUCTION LITERATURE
Applied GeoScience, Inc Hammond Dr., Suite 6 Schaumburg, Illinois
 AGI Project No. 13-276 Subsurface Investigation Report For the Proposed New Retail Center 9601 South Pulaski Road Evergreen Park, Illinois Prepared for Mr. Feras Sweis FHS Design + Build LLC 2010 West
Chapter 11 Compressibility of Soil
 Page 11 1 Chapter 11 Compressibility of Soil 1. The compression of soil layers as a result of foundation or other loadings is caused by (a) deformation of soil particles. (b) relocation of soil particles.
UPDATED 04 OCT GEOTECHNICAL INVESTIGATIONS
 8.0 GEOTECHNICAL INVESTIGATIONS Throughout this section, reference to the Contractor simply means the entity responsible for the subject work. The same procedures and requirements generally apply to anyone
SELF-CONSOLIDATING CONCRETE FOR SLIP-FORM CONSTRUCTION: PROPERTIES AND TEST METHODS
 SELF-CONSOLIDATING CONCRETE FOR SLIP-FORM CONSTRUCTION: PROPERTIES AND TEST METHODS Kejin Wang (1), Surendra P. Shah (2) and Thomas Voigt (3) (1) Department of Civil, Construction and Environmental Engineering,
SECTION RIPRAP, BOULDERS, AND BEDDING
 SECTION 31 37 00 RIPRAP, BOULDERS, AND BEDDING PART 1 GENERAL 1.01 SECTION INCLUDES A. The WORK includes excavation, grading, and installation of riprap, boulders, soil riprap, void-filled riprap, and
Recommended Specifications For Portland Cement Pervious Pavement
 Recommended Specifications For Portland Cement Pervious Pavement Foreword Portland Cement Pervious Concrete Pavements have become increasingly popular as a method to meet water quality water run off regulations
Classification of Soils
 Classification of Soils Soils - What are they? Particulate materials - Sedimentary origins (usually) - Residual Wide range of particle sizes - larger particles: quartz, feldspar - very small particles:
LIGHTWEIGHT FILL DESIGN GUIDANCE
 Preferred Design Procedure LIGHTWEIGHT FILL The Federal Highway Administration (FHWA) and National Cooperative Highway Research Program (NCHRP) have two documents for this technology that contain design
Subsurface Investigation Report. Proposed New 1-Story Building 6447 Grand Avenue Gurnee, Illinois
 AGI Project No. -11 Subsurface Investigation Report For the Proposed New 1-Story Building 6447 Grand Avenue Gurnee, Illinois Prepared for Mr. Steve Panko Key Development Partners, LLC North State Street,
PARKING LOTS 4, 7, AND 8 RECONSTRUCTION REPORT
 PARKING LOTS 4, 7, AND 8 RECONSTRUCTION REPORT Converse Project No. 15-81-177-01 Prepared For: David Evans and Associates, Inc. 17782 17th Street, Suite 200 Tustin, California 92780 Prepared By: 10391
SECTION XXXXX AGGREGATE PIERS PART 1 - GENERAL
 SECTION XXXXX AGGREGATE PIERS PART 1 - GENERAL 1.1 RELATED DOCUMENTS: Drawings and general provisions of the Contract, including General and Supplementary Conditions and other Division 00 and Division
CONCRETE SEGMENTAL RETAINING WALLS
 32 32 23.13 CONCRETE SEGMENTAL RETAINING WALLS 1.00 GENERAL 1.01 DESCRIPTION A. The work shall consist of furnishing and installing concrete segmental retaining wall (CSRW) units to the lines, grades and
CERTIFICATE FOR: CADD CONSULTING ENGINEERS PVT. LTD
 CERTIFICATE This is to certify that the samples are collected from the proposed OPGC PROPOSED FOR SOIL INVESTIGATION WORK FOR CONSTRUCTION OF CHP AREA AT MINE S END The laboratory tests have been performed
Preliminary Geotechnical Exploration Armstrong Tract Rivers Avenue and Hanahan Road North Charleston, South Carolina S&ME Project No.
 Preliminary Geotechnical Exploration Rivers Avenue and Hanahan Road S&ME Project No. 4213-16-016 Prepared for: Charleston Water System 103 Saint Phillip Street Charleston, South Carolina 29403 Prepared
Geotechnical Engineering Report Proposed Communications Tower Spain Park Site Hoover, Alabama
 Geotechnical Engineering Report Proposed Communications Tower Spain Park Site Hoover, Alabama July 24, 2014 Terracon Project No. E1145095 Prepared for: The City Of Hoover Hoover, Alabama Prepared by: Terracon
GEOTECHNICAL INVESTIGATION MDACC GUHN ROAD FLOOD MITIGATION PROJECT 5610 GUHN ROAD HOUSTON, TEXAS REPORT NO
 GEOTECHNICAL INVESTIGATION MDACC GUHN ROAD FLOOD MITIGATION PROJECT 5610 GUHN ROAD HOUSTON, TEXAS REPORT NO. 1140189301 Reported to: URS CORPORATION Houston, Texas Reported by: GEOTEST ENGINEERING, INC.
A Case Study: Foundation Design in Liquefiable Site
 RESEARCH ARTICLE OPEN ACCESS A Case Study: Foundation Design in Liquefiable Site Tahar Ayadat* *(Department of Civil Engineering, College of Engineering, PMU University, P.O. Box 1664, Al-Khobar, 31952,
Geotechnical Engineering Report
 Geotechnical Engineering Report ODOT Geotechnical Research On-Call Services, Task #4 SJN 134994 Lab Testing of Polymer-Based Soil Stabilizing Agents to Prevent Sulfate Heaving March 10, 2016 Terracon Project
Drained and Undrained Behavior of Fiber-Reinforced Sand by Cheng-Wei Chen
 Drained and Undrained Behavior of Fiber-Reinforced Sand by Cheng-Wei Chen Cheng-Wei Chen University of Missouri Columbia Graduate Research Assistant Department of Civil and Environmental Engineering E2509
GEOSYNTHETICS ENGINEERING: IN THEORY AND PRACTICE
 GEOSYNTHETICS ENGINEERING: IN THEORY AND PRACTICE Prof. J. N. Mandal Department of civil engineering, IIT Bombay, Powai, Mumbai 400076, India. Tel.022-25767328 email: cejnm@civil.iitb.ac.in Module - 9
Section 1I-3 - Bioswales
 BIOSWALES (Numbering pending) These specifications compliment the bioswale design portion of the Iowa Stormwater Management Manual in Chapter 2, Section 2I-3. Sections of the following documents, as referenced
Determination of Optimum Cement Content for Stabilization of Soft Soil and Durability Analysis of Soil Stabilized with Cement
 American Journal of Civil Engineering 2018; 6(1): 39-43 http://www.sciencepublishinggroup.com/j/ajce doi: 10.11648/j.ajce.20180601.17 ISSN: 2330-8729 (Print); ISSN: 2330-8737 (Online) Determination of
Chapter 21 GEOTECHNICAL REPORTS
 Chapter 21 GEOTECHNICAL REPORTS Final SCDOT GEOTECHNICAL DESIGN MANUAL June 2010 Table of Contents Section Page 21.1 Introduction... 21-1 21.2 Geotechnical Base Line Report... 21-1 21.3 Bridge Geotechnical
CHAPTER 7 PAVEMENT DESIGN. 1. Gradation (sieve and hydrometer analysis) 3. Moisture density relationships and curves
 3. Moisture density relationships and curves") CHAPTER 7 PAVEMENT DESIGN 7.0 GENERAL The purpose of this chapter is to define the requirements for design of pavement within proposed and existing roadways for new subdivision streets and secondary roads.
CHAPTER 7 PAVEMENT DESIGN 7.0 GENERAL The purpose of this chapter is to define the requirements for design of pavement within proposed and existing roadways for new subdivision streets and secondary roads.
Subsurface Investigations PDCA Professor s Driven Pile Institute. Loren R. Anderson Utah State University June 25, 2015
 Subsurface Investigations PDCA Professor s Driven Pile Institute Loren R. Anderson Utah State University June 25, 2015 Ralph B. Peck (1962) Subsurface engineering is an art; soil mechanics is an engineering
Evaluation Plan for Investigation of In- Place Recycling of Asphalt Concrete as Unbound Base Material
 November 2004 Evaluation Plan for Investigation of In- Place Recycling of Asphalt Concrete as Unbound Base Material PPRC 2003-2004 Strategic Plan Item 2.4.2 Prepared by Partnered Pavement Research Center
Aggregate Specifications
 Qualified Aggregate Technician Kentucky Specifications Aggregate Specifications State, FHWA, FAA, Contractor Kentucky Transportation Cabinet 107 Aggregate Size Designations Nominal Maximum Size The largest
General Stabilization Methods
 Soil Stabilization General Stabilization Methods Mechanical Stabilization Compaction Geosynthetics Embankment Stabilization Chemical Treatment Soil Modification (low doses) Soil Stabilization (high doses)
Prepared for: HDR Engineering, Inc. 200 West Forsyth Street, Suite 800 Jacksonville, Florida Prepared by:
 REPORT OF GEOTECHNICAL EXPLORATION REHABILITATE WHARF STRUCTURE AT BERTHS 6 AND ½ OF BERTH 5 TALLEYRAND MARINE TERMINAL, JACKSONVILLE, FLORIDA E&A PROJECT NO. 0756-0081 Prepared for: HDR Engineering, Inc.
Behavior of Reinforced Embankment on Soft Ground with and without Jet Grouted Soil-Cement Piles
 Behavior of Reinforced Embankment on Soft Ground with and without Jet Grouted Soil-Cement Piles by 1 Dennes T. Bergado and 2 Glen A. Lorenzo 1 Professor and 2 Doctoral Candidate, respectively Geotechnical
REPORT OF GEOTECHNICAL EXPLORATION PUBLIC WORKS SITE SAVANNAH, GEORGIA FOR CHATHAM CO. DEPT. OF PUBLIC WORKS & PARK SERVICES
 REPORT OF GEOTECHNICAL EXPLORATION PUBLIC WORKS SITE SAVANNAH, GEORGIA FOR CHATHAM CO. DEPT. OF PUBLIC WORKS & PARK SERVICES MAY 5, 2009 ECS PROJECT NO. 23:2081 i. - -- ~", " -. _., I ~~ ECS SOUTHEAST,
Geotechnical Testing Laboratory, Inc. Engineering and Construction Materials Testing Services
 Engineering and Construction Materials Testing Services February 27, 15 Central Louisiana Economic and Development Alliance P.O. Box 465 Alexandria, Louisiana 719 Attention: Mr. Rick Ranson Vice President
Ardaman & Associates, Inc. Geotechnical, Environmental and Materials Consultants
 SUBSURFACE SOIL EXPLORATION ANALYSIS AND RECOMMENDATIONS PROPOSED WEIRS AT STATIONS 130+00 AND 16+00 DRAINAGE IMPROVEMENTS TO THE FOUR CORNERS MSBU HENDRY COUNTY, FLORIDA Ardaman & Associates, Inc. Geotechnical,
CHAPTER 3 CONSTRUCTION AND TESTING OF SUBGRADE
 CHAPTER 3 CONSTRUCTION AND TESTING OF SUBGRADE WHAT IS SUBGRADE? SUBGRADE EMBANKMENT FOUNDATION The top surface of an embankment or cut section, shaped to conform to the typical section upon which the
Consultant Specifications for Subsurface Investigation & Geotechnical Analysis and Design Recommendations
 Consultant Specifications for Subsurface Investigation & Geotechnical Analysis and Design Recommendations Mn/DOT Geotechnical Section - Office of Materials & Road Research http://www.mrr.dot.state.mn.us/geotechnical/foundations/tcontract.asp
Shear Strength Characteristics of Coal Dust Mixed Pilani Soil
 IJISET International Journal of Innovative Science, Engineering & Technology, Vol. 3, Issue, 6. ISSN 348-7968 Shear Strength Characteristics of Mixed ilani Soil Kamalesh Kumar, Utpal Sannyashi Department
t ghi yr Cop
 In many situations, soil itself is used as a construction material Highway embankments Railway embankments Earth dams Highway / Airfield pavements Backfilled trenches Landfills When soil is used as foundation
GEOTECHNICAL INVESTIGATION REPORT. FINAL REPORT ON SOIL INVESTIGATION WORK FOR PROPOSED 2 x 25 MVA 66/11kV G-1 SUB-STATION AT DWARKA, NEW DELHI.
 . GEOTECHNICAL INVESTIGATION REPORT FINAL REPORT ON SOIL INVESTIGATION WORK FOR PROPOSED 2 x 25 MVA 66/11kV G-1 SUB-STATION AT DWARKA, NEW DELHI. RAO ENGINEERING ENTERPRISES (GEOTECHNICAL CONSULTANTS &
SECTION CONTROLLED LOW STRENGTH MATERIAL
 SECTION 03300 CONTROLLED LOW STRENGTH MATERIAL PART 1 GENERAL 1.1 DESCRIPTION A. This Section specifies Controlled Low Strength Material (CLSM) to be used as described in this specification, including
PRACTICAL COURSE III CLASSIFICATION & COMPACTION. Res. Assist. İREM KALIPCILAR
 PRACTICAL COURSE III CLASSIFICATION & COMPACTION Res. Assist. İREM KALIPCILAR Group index REMINDER GI = (F 200-35)[0.2 + 0.005 (LL-40)]+0.01(F 200-15)(PI-10) FOR GROUP A-2-6 and A-2-7 GI = 0.01(F 200-15)(PI-10)
Subsurface Environmental Investigation
 Subsurface Environmental Investigation Lake Development East Lake and 21 st Avenue South February 23, 201 Terracon Project No. MP14738A Prepared for: Minneapolis Public Schools Prepared by: Terracon Consultants,
Anchorplex retaining wall construction guide. Building. Anchorplex. Retaining Wall Systems
 Anchorplex retaining wall construction guide Building Anchorplex Retaining Wall Systems Table of Contents and ow to Use This Guide table of contents ow to Use This Guide. 2 About the Anchorplex System.
DaraFill. Concrete. Controlled Low Strength Material
 Concrete E N G I N E E R I N G B U L L E T I N 1 DaraFill Controlled Low Strength Material This Engineering Bulletin describes the test methods and results used to determine several mechanical properties
Earthwork and Ground Technology. Site Improvement
 Earthwork and Ground Technology Site Improvement Slides adapted and upgraded from original presentation slide by College of Engineering, University of Washington. Methods of site improvement Removal and
SITE INVESTIGATION Validation and Interpretation of data
 SITE INVESTIGATION Validation and Interpretation of data Dr. G.Venkatappa Rao The Impact 1 The Need To determine the type of foundation To assess bearing capacity/settlement Location of Ground water table,issues
SWELL AND SWELLING POTENTAL PRESSURE TESTS
 SWELL AND SWELLING POTENTAL PRESSURE TESTS When geotechnical engineers refer to expansive soils, we usually are thinking about clays, and the volume changes that occur as a result of changes in moisture
EFFECT OF CEMENT CONTENT ON UNCONFINED COMPRESSIVE STRENGTH OF JAMSHORO SOIL
 International Symposium on Sustainable Geosynthetics and Green Technology for Climate Change (SGCC) 2 to 21 June 212 Bangkok, Thailand EFFECT OF CEMENT CONTENT ON UNCONFINED COMPRESSIVE STRENGTH OF JAMSHORO
INDEX FOR SPECIFICATIONS FOR JACKING CULVERTS THROUGH EMBANKMENTS SCOPE... 2
 INDEX FOR SPECIFICATIONS FOR JACKING CULVERTS THROUGH EMBANKMENTS 410. 1 SCOPE... 2 410. 2 DEFINITIONS 2.1 Tunneling and Jacking... 2 2.2 Tunneling... 2 2.3 Jacking... 2 410. 3 MATERIALS 3.1 General...