Wellhead Protection Plan
|
|
|
- Arabella Morris
- 5 years ago
- Views:
Transcription

1 SHAKOPEE MDEWAKANTON SIOUX COMMUNITY Wellhead Protection Plan S IOUX T RAIL N.W. P RIOR L AKE, MN 55113
2 Shakopee Mdewakanton Sioux Community Wellhead Protection Plan July 15, 2009
3 TABLE OF CONTENTS ACKNOWLEDGMENTS DOCUMENTATION LIST REQUIRED CONTENT OF WELLHEAD PROTECTION PLAN PUBLIC WATER SUPPLY PROFILE I II III IV EXECUTIVE SUMMARY 1 CHAPTER 1: WELLHEAD PROTECTION PLAN UPDATE 3 CHAPTER 2: DATA ELEMENTS LAND-USE AND PUBLIC UTILITIES PHYSICAL ENVIRONMENTAL DATA ELEMENTS Climate Hydrogeology Soils Water Resources 8 CHAPTER 3: WHP AND DWSMA DELINEATIONS Groundwater Flow Model Overview Data Elements Conceptual Model Description Model Construction Model Calibration Ten-Year Time-of-Travel Zone Delineation TOT Zone Delineation Using Groundwater Flow Model TOT Zone Delineation Using MDH Guidance Comparison of Groundwater Model and MDH Method Results Drinking Water Supply Management Area Delineation 18 CHAPTER 4: VULNERABILITY ASSESSMENTS WELL VULNERABILITY McKenna Wellfield - Jordan aquifer Well Sioux Trail Wellfield - Jordan aquifer Well Sioux Trail Wellfield Ironton/Galesville Aquifer Well DWSMA VULNERABILITY McKenna Wellfield 24
4 4.2.2 Sioux Trail Wellfield 24 CHAPTER 5: CONTAMINANT SOURCE INVENTORY 26 CHAPTER 6: PHYSICAL ENVIRONMENT AND LAND USE CHANGES Land Use (McKenna DWSMA) Land Use (Sioux Trail Jordan and FIG DWSMAs) Influences of Existing Water and Land Government Programs and Regulation Administrative, technical and financial considerations 29 CHAPTER 7: EXPECTED CHANGES TO THE GROUND AND SURFACE WATER McKenna DWSMA Sioux Trail Jordan DWSMA Sioux Trail FIG DWSMA 33 CHAPTER 8: PROBLEMS AND OPPORTUNITIES Problems Technical Problems Administrative Problems Opportunities Technical Opportunities Administrative Opportunities 36 CHAPTER 9: WELLHEAD PROTECTION GOALS Goals Objectives Implementation 37 CHAPTER 10: PROGRAM EVALUATION 42 CHAPTER 11: WATER SUPPLY CONTINGENCY PLAN Purpose Public Water Supply Characteristics Public Water Supply Source Information Treatment 43
5 Storage and Distribution Maps/Plans Priority of water users during a water supply emergency Alternative Water Supply Emergency or Backup Wells Emergency Water Supplies, Delivery and Distribution Source Management Inventory of available emergency equipment and materials Notification Procedures Public Information Plan Mitigation and Conservation Plan Mitigation Conservation 48 CHAPTER 12: PROCEDURES FOR AMENDING AN EXISTING PLAN 49 REFERENCES 50 TABLES 53 FIGURES 70 GLOSSARY 85 APPENDICES 89
6 TABLES Table 1. Generalized regional SMSC hydrostratigraphic column Table 2. Community groundwater age, based on USGS CFC-12 analysis Table 3. Mean annual lake, pond and wetland water chemistry Table 4. Maximum, mean and minimum discharge Table 5. Mean water chemistry values Table 6. Volume of water pumped (gallons) from Community public water supply wells Table 7. Hydraulic conductivity zones (K h ) Table 8. Groundwater model leakance zones Table 9. MODFLOW packages used Table 10. Model pumping rates Table 11. Published range in bedrock aquifer porosity values Table 12. Ten-year calculated fixed radius for SMSC PWS wells Table 13. Delineation technique comparisons Table 14. Summary of Community well and DWSMA vulnerability determinations Table 15. Community PWS well vulnerability assessment summary Table 16. Actual and potential contaminant sources within the Sioux Trail DWSMA Table 17. Actual and potential contaminant sources within the McKenna DWSMA Table 18. Land use projections within the DWSMAs Table 19. Water use and change by category Table 20. Public water supply characteristics Table 21. Maximum and Minimum Daily Water Use (2006) Table 22. Water supply priorities Table 23. Emergency Water Supply Contacts Table 24. Emergency Equipment and Suppliers Table 25. Lead Coordinating Agency - SMSC Staff Table 26. Incident Assessment Team... 69
7 FIGURES Figure 1: Land use and Property Boundaries 71 Figure 2. Public Utilities. 72 Figure 3. Mean monthly precipitation and temperature, Jordan, Minnesota, Figure 4. Regional bedrock geology 74 Figure 5. Hydrogeologic cross-sections (see figure 4 for locations). From Runkel et al Figure 6. Local bedrock hydrogeology 76 Figure 7. Soil data 77 Figure 8. Surface water resources 78 Figure 9. Historical and projected Community annual water use (gallons/year) 79 Figure 10. Conceptual groundwater flow model for the SMSC water supply (Wuolo 2004). 79 Figure 11. Drinking water supply management areas. 80 Figure 12. MGS estimated bedrock surface recharge rates 81 Figure 13. Potential contaminant sources 82 Figure 14. Potential contaminant sources - wells and generators 83 Figure 15. Community land use 84
8 APPENDICES Appendix A Appendix B Appendix C Appendix D Appendix E Appendix F Appendix G Appendix H SMSC Well and Borehole Logs Community Geophysical Logs Well Maintenance Records Public Water Supply Well Chemistry Original SMSC WHPP (enclosed CD) Vulnerability Worksheets SMSC Contaminant Spill History Potential Contaminant Source Survey
9 ACKNOWLEDGMENTS The Shakopee Mdewakanton Sioux Community would like to thank the following entities for their contribution to this wellhead protection plan. Shakopee Mdewakanton Sioux Community Tribal Business Council - The Tribal Business Council provided the vision and tools that were necessary to produce this wellhead protection plan. It is through their support of the SMSC Land Department and their desire to comply with state regulations that this report exists. Environmental Protection Agency, Region 5 - The Environmental Protection Agency provided key reference materials. Specifically, Janice Bartlett provided assistance by answering questions regarding Environmental Protection Agency methods for developing a source water protection plan and the differences in the Minnesota Rules regarding wellhead protection planning. Janice also assisted in the Contaminant Source Inventory and the development of a quality assurance project plan for source water protection. Staff from the Cities of Prior Lake and Shakopee Steve Albrecht from the City of Prior Lake and John Crooks from Shakopee Public Utilities Commission provided valuable input during the wellhead protection planning process. Minnesota Rural Water Association - The Minnesota Rural Water Association provided numerous training opportunities. Specifically, Dave Neiman played a pivotal role in the development of the management section of this wellhead protection plan. Dave was also instrumental in facilitating meetings between the tribe, surrounding communities and their residents. Minnesota Department of Health - The Department of Health provided essential training opportunities and facilitated meetings between the tribe and local communities. Specifically, Art Persons and Steve Robertson played crucial roles in the initial planning and modeling process. Helpful feedback was also provided upon request.
10 DOCUMENTATION LIST STEP RULE PART, SUBPART DATE PERFORMED Date MDH Notice Given: , subp.3 December 1999 Mandatory Completion Date: , subp.3 December 2001 Plan Manager Designated: , subp. 2 November 1999 Plan Notice Sent to Local Units of Government (LGU s) and MDH: subp. 3 LGU Informed December 1999 Meetings with LGU s Held: , subp. 5 February 2000 Scoping Decision Notice Received: , subp. 2 October 2000 Aquifer Test Plan Submitted: , subp. 1 Test Completed 1997 Approval Review Notice Received from MDH: , subp. 2 NA Delineation and Vulnerability Assessment Submitted: March 2001 Approved Review Notice Received from MDH: , subp. 2 NA WHPA and DWSMA Area Delineation and Vulnerability Assessment Submitted to LGU s: , subp. 6 May17, 2001 Public Information Meeting Held: , subp. 7 November and December 2000 Scoping Meeting II Held: , subp. 1 NA Scoping Decision Notice Received: , subp. 2 NA Remaining Portion of Plan Submitted to LGU s: , subp. 1 & 2 March 2001 Review Received from LGU s: , subp. 3 July 2, 2001 Review Considered: , subp. 3 July 6, 2001 Public Hearing Conducted: , subp. 4 July 16, 2001 Remaining Portion of WHP Plan Submitted: , subp. 1 9/4/01 Approved Review Notice Received: MDH Review/ EPA Review 12/21/01 02/06/02 WHP Updated 6/12/09
11 REQUIRED CONTENT OF WELLHEAD PROTECTION PLAN REQUIRED CONTENT OF WELLHEAD PROTECTION PLAN RULE PART, SUBPART CHAPTER ADDRESSED Data Elements; Assessment: Wellhead Protection Area and Drinking Water Supply Management Area Delineation: Vulnerability Assessment: Impact of Changes on Water Supply Well: Issues, Problems, and Opportunities: Wellhead Protection Goals: Objectives and Plan of Action: Evaluation Program: Alternate Water Supply; Contingency Strategy:
12 PUBLIC WATER SUPPLY PROFILE PUBLIC WATER SUPPLY System Name: McKenna; Sioux Trail Operator: Jeremy Gosewisch, Public Works Director Telephone Number: (952) WELLHEAD PROTECTION TEAM MANAGER Name: Scott Walz Telephone Number: (952) LAND AND NATURAL RESOURCES MANAGER Name: Stanley Ellison Telephone Number: (952) SUPPORT STAFF Name: Ole Olmanson Telephone Number: (952) GENERAL INFORMATION System/ Well Minnesota Unique Well Number Public Water Supply Number McKenna / Jordan Sioux Trail / Jordan Sioux Trail / Ironton- Galesville Size of Population Served: County: ,720 per U.S. Environmental Protection Agency population equivalent calculation in 2008 Scott County, Minnesota_
13 EXECUTIVE SUMMARY The Shakopee Mdewakanton Sioux Community, hereinafter Community, is a federally recognized Indian Tribe with land in Prior Lake and Shakopee, Scott County, Minnesota. Reservation boundaries contain approximately 3000 acres in the Eastern Broadleaf Forest province (Big Woods) of Minnesota. The Community s land base contains over 200 acres of wetlands, two lakes and several intermittent streams. Currently there are three public water supply wells in use that provide consumers with water. The McKenna system includes Minnesota Unique Well (MUW) #554090, which provided water to 95 residences in The Sioux Trail system includes MUW # and MUW # The Sioux Trail System provided water to 117 residences, several businesses including an RV park, Dakota Mall, Dakota Sport and Fitness, Playworks, two casinos and one hotel complex in Where possible, this Wellhead Protection Plan (WHPP) follows the recommended guidelines from both the Environmental Protection Agency and the Minnesota Department of Health regarding such a plan. Regular communication between the Community and surrounding local units of government and the general public allowed for public involvement during the preparation process. The Wellhead Protection Areas (WHPAs) for the Jordan aquifer public water supply wells (PWSs) were originally delineated by the Minnesota Department of Health using a groundwater flow model developed using the U.S. Geological Survey s finite-difference code MODFLOW. The WHPA for the Franconia-Ironton-Galesville aquifer public water supply well was originally delineated by the Minnesota Department of Health using the Metropolitan Area Groundwater Lower Aquifers Model - Layers 4 and 5. This model was developed using the Multi-Layer Analytic Element Model (MLAEM) software. These existing WHPAs were modified using a groundwater flow model built by Barr Engineering Company (Barr). This model code was again based on the U.S. Geological Survey s finite-difference code MODFLOW-2000, and the modeling program GMS 6.0 was used for pre- and post-processing. Drinking Water Supply Management Areas (DWSMAs) were defined based on the Wellhead Protection Area delineation, and the vulnerability of each DWSMA was assessed. The DWSMAs for both Jordan aquifer wells (MUW # and #525938) were found to have a vulnerability rating of moderate. The surficial geology and chemical data were the determining factors for these ratings, because the surficial geology around those wells lacks a consistent protective layer, but age dating indicates slow recharge. The DWSMA for the Ironton-Galesville aquifer well (MUW #253021) was found to be non-vulnerable due to the extensive protection offered by the overlying St. Lawrence Formation and the upper part of the Franconia Formation. The Community Land Department completed a search for all known and possible contaminant sources in the McKenna and Sioux Trail wellfields DWSMAs. This search included a review of existing environmental databases, the completion of an inner wellhead management zone contaminant source inventory and a potential contaminant source survey conducted by staff in 1
14 the Community Land, Public Works, Maintenance Departments, Community businesses and the SMSC Gaming Enterprise (GE) which oversees the operation of the casinos and associated businesses. A Plan of Action was adopted based on the vulnerability assessments and contaminant survey results. It is a three-part strategy based on education, services, and regulation. This approach has been applied to all of our primary and secondary goals. Our primary goals include safe management of wells and underground storage tanks which pose a potential threat to groundwater resources within wellhead protection areas. Secondary goals include managing stormwater runoff, hazardous waste, and septic systems. Secondary goals are included in this plan to increase the protection of ground and surface water resources above what is offered through the primary goals. This Wellhead Protection Plan complements other plans adopted by the Community for the management of nonpoint source pollution, wetlands, surface water and groundwater, these plans include the Non-point Source Pollution Management Plan, The Wetland Management Plan, the Separate Storm Sewer System Spill Response Contingency Plan, and others. It is the hope of the SMSC Wellhead Protection Committee that members of the public will be better informed by the information contained herein, and that they will be moved to take action in their individual daily lives to minimize potential problems with the quality of water currently enjoyed by residents of the Shakopee Mdewakanton Sioux Community. 2
15 Chapter 1: WELLHEAD PROTECTION PLAN UPDATE In 2001 the Community adopted Minnesota Rules part , subpart 1, item C as a guideline for amending this Plan. The Community will review and update their Wellhead Protection Plans every ten years to ensure that the plan reflects current conditions within the DWSMA. Minnesota Rules part , subpart 1, item A states that a WHPP update is needed if another well is added to the public water supply system. While another well has not yet been added to the Community water supply system, conditions within the DWSMA have changed enough to warrant the update of this WHP plan. The update of this WHPP included: 1) a review of Community Land Department GIS data, in order to provide up-to-date land use and natural resource distribution maps; 2) a literature review of new research publications that impact the interpretation of local aquifers, water supply projections, and development plans in surrounding communities; 3) the construction of a more detailed groundwater flow model and subsequent re-delineation of ten-year-time-of-travel zones for each well; and 4) a complete review of federal, state, and local contaminant databases and a field survey of potential contaminant sources within the DWSMAs. 3
16 CHAPTER 2: DATA ELEMENTS Data quality can often be the difference between a valid or invalid natural resource plan. The origin of our data is provided, and data quality is discussed at the conclusion of each data element section and elsewhere in the plan as appropriate. Much of this introductory data is not required under the Minnesota Rules, but has been provided for those who have limited experience with the landscape of south central Minnesota. 1.1 LAND-USE AND PUBLIC UTILITIES Rapid population growth in the Twin Cities metropolitan area over the past ten years has substantially altered the landscape in and around the Community. Agriculture has traditionally dominated land use in the area, but the growing population has resulted in the conversion of land use from agriculture to residential and light commercial. In 2007, Community lands were 41% agriculture, 15% natural, 13% residential, 9% wetland, 11% commercial, and 11% other (drainage, parks and transportation)(figure 1). These numbers are in a constant state of change. Community parcels consist of trust and fee lands. Trust lands are those parcels held in trust for the Community by the Federal government; state and local civil regulatory laws do not apply, Federal and tribal environmental laws and regulations are generally applicable. Fee lands are owned by the Community but not held in trust; they are subject to federal, state and local laws. All Community parcels are connected to public water, sewer, gas, and electricity (figure 2). Power utility is provided by the Minnesota Valley Electrical Corporation and the Shakopee Public Utilities Commission. State licensed private contractors provide garbage utility. The Community currently has two public water supply wells in the Jordan aquifer (capable of producing a combined 2200 gal/min) and one in the Ironton-Galesville aquifer (capable of producing 800 gal/min). A fourth water supply well penetrates both the Prairie du Chien and Jordan aquifers (capable of producing 850 gal/min); this well is currently used for irrigation of The Meadows at Mystic Lake golf course but could be connected to the public water supply system in the event of an emergency (Appendix A). A handful of private wells are still active, and the Community is actively working to properly seal these wells as they are abandoned. The Community maintains a connection to the Prior Lake municipal water supply system, providing both communities with emergency water supplies. Community sewer service was provided by the Metropolitan Council s Blue Lake Treatment Plant in Shakopee, MN from 1989 until 2006 when a new waste water reclamation facility was constructed by the Community. The new plant has a designed peak wet weather discharge of approximately 2.78 million gallons of wastewater per day (10,523 m 3 /day), although the plant is only expected to discharge a maximum of about 0.64 million gallons on an average day. Community residential housing consists of approximately one half to one-acre lots. Government and commercial development is focused within the central and southern portion of the reservation and primarily consists of the government center, maintenance buildings and casinorelated development. Land Department staff monitor land use and update records frequently. Utilities information is compiled and stored by Bolton & Menk, Inc.; it is considered moderate quality data due tothe 4
17 rapid growth of the area, the lack of one consistent surveying crew or method, and the fact that we do not have detailed information for non-tribal lands. 1.2 PHYSICAL ENVIRONMENTAL DATA ELEMENTS Climate The Community is located near the boundary between the semi-humid climate regime of the eastern U.S. and the semi-arid regime to the west. Because it is located near the center of the North American Continent, Minnesota is subject to a variety of air masses that control its climate. Precipitation and temperature data were obtained from the High Plains Regional Climate Center ( Data from an observation station in Jordan, MN were used. The Jordan station is approximately twenty miles west of the Community and represents the nearest long term high quality data source. The climate data does not play a pivotal role in the management of this wellhead protection plan. Precipitation: The primary source of moisture for precipitation in Minnesota is the tropical maritime air that moves into the State from the south and southwest. The spatial variation of mean (normal) annual precipitation across Minnesota is determined by proximity to these moist air masses coming northward out of the Gulf of Mexico. The normal annual precipitation total for the period 1948 to 2004 recorded at the weather station in Jordan, MN is inches. Nearly two-thirds of Minnesota s annual precipitation falls during the growing season of May through September, a period during which the Gulf of Mexico moisture is often available (figure 3). Only seven percent of the average annual precipitation falls in the winter (December through February) when the dry polar air masses prevail. Temperature: Normal temperatures follow the approximate seasonal distribution that could typically be expected with warm, humid summers and cold, polar air dominated winters. The normal annual temperature for the period 1948 to 2004 was 54.6 F. July is typically the warmest month of the year while January is typically the coolest (figure 3). Cold, dry continental polar air dominates the winter season, occasionally replaced by somewhat milder maritime polar air. Due to the lack of topographic relief, northern polar air masses can travel out of the arctic unimpeded, resulting in temperatures in excess of forty degrees below zero. During the summer, hot dry continental air masses from the desert southwest share predominance with warm and moist maritime tropical air that originates over the Gulf of Mexico. The spring and fall seasons are transition periods composed of alternate intrusions of air from various sources Hydrogeology The Community s hydrogeologic resources include deep regional bedrock aquifers and shallow perched aquifers in unconsolidated glacial and fluvial sediments (table 1). While a few individual supply wells in the area draw water from the unconsolidated sediments, most 5
18 wells draw water from the Prairie du Chien and Jordan formations. A few wells penetrate the Franconia, Ironton, and Galesville formations at even greater depth. Local well logs, available online in the Minnesota County Well Index (MN CWI) ( provide valuable data about the distribution and thickness of geologic units beneath the Community. Additional information about the character of Community aquifers was determined through three aquifer tests conducted on the Jordan and Ironton-Galesville aquifers (Strobel and Delin 1996; Ruhl 1999; Winterstein 2005) and through revised geologic mapping and geophysical research at the Community by the Minnesota Geological Survey (Runkel et al 2005). A review of regional hydrogeologic research provided a sense of aquifer heterogeneity (Pfannkuch 1998; MPCA 1999, Barrett 2002; Ruhl 2002; Runkel et al 2003; Runkel et al 2006). These resources provide high quality data that has a direct bearing on the delineations and well and drinking water supply management area vulnerability assessments. This in turn has an impact on the development of the goals, objectives, plan of action and management sections of this plan. Bedrock Hydrogeology: The Community is located on the eastern side of a buried bedrock plateau capped by the Ordovician Prairie du Chien Group. The Minnesota River flows through a bedrock valley to the north of the Community, where bedrock units are exposed in some places. Bedrock beneath the Community is composed of alternating layers of Paleozoic sandstone, shale, and limestone. Groundwater flows relatively slowly through each aquifer s matrix porosity, but may move very rapidly through secondary pores (systematic and nonsystematic fractures and solution features) found in all bedrock aquifers. In general, groundwater flows in a north-northwesterly direction beneath the Community and discharges in the Minnesota River. Localized groundwater flow in the bedrock aquifers varies due to the variable permeability and thickness of each unit (figure 4). Since the original Community WHPP, the definition of local aquifers has been refined to reflect our improved understanding of groundwater flow. Many traditional aquifers have been subdivided into multiple aquifers and confining layers. For example, the Prairie du Chien-Jordan aquifer is now known to contain two aquifers separated by a leaky confining unit. The Franconia-Ironton-Galesville aquifer also contains two aquifers with a leaky confining unit between them (Table 1). Hydrogeologic mapping was conducted for the Community by the MGS in Results are presented in figures 5 and 6. Aquifer tests and groundwater modeling indicate that the Jordan aquifer behaves as an independent confined porous media aquifer, but well logs and outcrops indicate a hydraulic connection to the overlying partially confined Prairie du Chien Aquifer by fractures and solution cavities (Ruhl 1999, Strobel and Delin 1996, Wuolo 2004, Runkel et al 2005). Aquifer tests, groundwater modeling, geophysical logs and well logs indicate that the Ironton-Galesville aquifer is an independent confined aquifer (Appendix A, B), but geologic maps indicate a possible connection between the Ironton-Galesville aquifer and adjacent surficial and bedrock aquifers in buried bedrock valleys (figure 5) (Winterstein 2006, Wuolo 2004, Runkel et al 2005). CFC-12 analysis of groundwater in the Jordan and Ironton-Galesville aquifers indicate that water 6
19 being pumped from these aquifers is greater than 50 years old (Table 2) (Strobel and Delin 1996, Winterstein 2005). Surficial Hydrogeology: The bedrock aquifers are covered by complex glacial deposits that include outwash terraces near the Minnesota River and till at higher elevations to the south (figure 5). In the SMSC, elevation ranges from a high of 1030 at the water tower on Flandreau Trail to a low of 770 feet above sea level at the far northeast corner of the Community. The escarpment separating these two landscapes is a combination of fluvial sediments and till mixed by slumping and stream erosion. Where these surficial sediments have a relatively low vertical hydraulic conductivity, the water table is perched above the potentiometric surfaces of the bedrock aquifers. Groundwater flow direction in surficial aquifers is difficult to accurately predict due to complex inter-tonguing between impermeable fine-grained sediment and porous sand and gravel. Ten sediment cores were collected (figure 6) (Appendix A) to illustrate the character of surficial deposits across the Community. On the southern half of the Community, water is perched above an impermeable layer of till; this water table generally mimics topography. Below this perched water table, surficial sediments are often unsaturated. On the northern half of the Community, surficial deposits are primarily sand. In these conditions, groundwater moves vertically down into the bedrock aquifers below. Infiltration on the outwash terraces has been monitored by the SMSC since The maximum observed infiltration rate is 14 cfs (34,000 m 3 /day), following large summer storms. Higher infiltration rates are expected if an upstream culvert is enlarged to allow more flow onto the outwash terrace Soils The primary factors that affect the rate of soil formation include climate, topographic relief, soil parent material, time, and the biologic processes of vegetation and organisms. A soil survey of the Community trust and fee lands was conducted by Peterson Environmental Consulting, Inc. (2000). When compared to the 1959 Scott County Soil Survey, this survey documents the alteration of over 700 acres of the Community by cut and fill activities associated with residential, commercial, and governmental development. Approximately 20% of this land is now impervious surface (figure 7). The available soil data are considered to be high quality. Their greatest use is providing information for land use management and estimates of recharge potential. Three soil associations were mapped in the Community. The general distribution of the soil associations is shown on figure 7; these boundaries are not exact and should only be used to quickly estimate the most likely soil in an area. The Estherville-Sparta-Dickman association is characterized by nearly level to undulating, well to excessively drained, loamy soils formed in loess mantled sand and gravel deposits on glacial outwash terraces (Peterson Environmental Consulting, Inc. 2000). Minor components of this association include Kasota and Waukegan soils. This association dominates the northern portion of the Community, on the glacial outwash terraces of the Minnesota River. 7
20 The Waukegan-Minneiska-Hayden association is characterized by nearly level to very steep well and moderately well drained soils of the escarpment separating the outwash terraces from the till plain (Peterson Environmental Consulting, Inc. 2000). Minor components of this association include Kasota, Dickman, and Storden soils. This association is found along the transition between the northern outwash terrace and the southern glacial moraine in the central portion of the Community, immediately north of Scott County Road 42. The Hayden-Le Sueur-Webster association is characterized by gently sloping to moderately steep, well drained to very poorly drained soils formed in loamy calcareous glacial till on uplands (Peterson Environmental Consulting, Inc. 2000). Minor components of this association include Lester, Glencoe, Palms, and Houghton soils. This association dominates the southern portion of the Community, on the glacial till deposits. The runoff and infiltration rates for soils across the Community vary considerably. In general, the northern portion of the Community is characterized by high infiltration and low runoff potential. The opposite is true for the southern Community, where very high runoff rates lead to very low infiltration (figure 7) Water Resources Community lands are fully contained within the USGS 8 digit watershed hydrologic unit code Within the Community boundaries are approximately 200 acres of wetlands, 2 miles of streams, and 2 lakes totaling 43 acres (Figure 8) (Community Land Department GIS database 2008). The Community utilizes groundwater from the Prairie du Chien, Jordan, and Ironton- Galesville aquifers. The limited Community surface water resources have no significant recreation resource potential, although they do provide important cultural meaning to the Community. Land Department staff actively identify and monitor surface water resources on tribal lands and have a high level of confidence in this data. Wetland delineations follow the procedures set forth in the 1987 Federal Wetland Delineation Manual. The surface water quality sampling procedures include stringent quality assurance protocols such as the use of state certified labs for sample analysis, the USGS s established sampling protocols and an EPA approved Quality Assurance Project Plan (QAPP) (SMSC 2005). Groundwater used for domestic water consumption is monitored on a daily basis by the Public Works Department. Monthly and yearly groundwater samples are collected by the Public Works Department and the analysis is performed by a state certified lab. Local groundwater age was determined by the USGS, based on CFC-12 (Stobel and Delin, 1996; Winterstein 2005). Surface Water Surface water quality in the Community is affected by a variety of land uses. The most important of these are runoff from parking lots and managed turf, which contribute nutrients and sediment to Community wetlands and lakes. Surface water quality has been monitored since 1999 at selected sites (figure 8), and annual water quality sampling reports are submitted to the Environmental Protection Agency (SMSC 2008). A summary of selected water bodies is included here. 8
21 There are two lakes in the Community. Arctic Lake is a 15-acre polymicitic lake located on the southern border of Community owned property. The primary land use affecting the lake water quality has been agricultural activities occurring on steep slopes around approximately 1/4 of the lake (table 3). Mystic Lake is a 65-acre basin located east of County Road 83. The primary land use affecting lake water quality is golf course and residential turf management (table 3). The Community manages approximately 1/4 of the lake. Water quality data collection began in Over ten acres of stormwater ponds capture runoff from Mystic Lake Casino parking lots; other stormwater ponds capture runoff from residential lots. Water quality in two Community stormwater ponds is monitored to assess pond efficiency in retaining pollutants. Bluffview Pond is a 1.34-acre stormwater pond constructed to treat runoff from a residential housing development (table 3). Petsch Pond is a 5.12-acre storm water pond constructed to hold stormwater runoff from a combined agricultural and residential area (table 3). Petsch Pond was removed during construction of a new residential development in Water quality data collection began in There are many wetlands in the Community; water samples are collected and analyzed at nine of them (figure 8). Data from two wetlands are included in table 3 to illustrate the variability of Community wetland water chemistry. Wetland C1L is surrounded by commercial development; Wetland S1a is in a wooded and residential area. Water quality data collection began in Streams in and around the Community are ephemeral, primarily acting as outlets to overflowing ponds and wetlands following snowmelt and summer rainstorms. Four ephemeral streams flow across the Community, and stream discharge and chemistry data were collected at sites 1-5 during the spring, summer and fall, beginning in Stream discharge data was collected at Lucky 7 Stream beginning in the summer of Mean annual results are summarized in Tables 4 and 5 below. Groundwater Groundwater is pumped from both individual and public water supply wells in the Community (figure 6). The public water supply wells are found in two small wellfields. The McKenna wellfield currently has only one active well open to the Jordan aquifer, Minnesota Unique Well (MUW) # The Sioux Trail wellfield currently has two active public water supply wells open to the Jordan and Ironton-Galesville aquifers: MUW # (Jordan) and MUW # (Ironton-Galesville). A third well, open to both the Prairie du Chien and Jordan aquifers (MUW #705725) is currently used for irrigation but could be connected to the public water supply in the event of an emergency (Appendix A). Public water supply wells are serviced every five years (Appendix C). Private wells most commonly penetrate the Prairie du Chien-Jordan aquifer. A few private wells draw water from unconsolidated valley fill sediments. The Community is actively working to connect private residences to the public water supply and to properly abandon these wells. Quantity 9
22 The modern Community drinking water supply system was finalized in 1999 with the construction of the Ironton-Galesville well. The Community used approximately 181 million gallons of water in 2008, according to Community Public Works Department. This annual volume is expected to rise in the future with increasing commercial and residential development. Groundwater Use Projection The Sioux Trail wellfield supplied water to approximately 120 residences, several businesses, two casinos and a hotel complex in The McKenna wellfield supplied water to approximately 78 residences in There is one subdivision of nine homes (called Eagle Creek) that is located several miles away from existing SMSC water lines which has its water supplied by the City of Prior Lake. The meters from these homes provide valuable water use data. Most Community commercial and governmental water use is metered; residential water use is not. Residential water use in the Sioux Trail wellfield can be approximated by subtracting commercial and governmental water use from the total volume of water pumped from the Sioux Trail wellfield, but this leads to an over estimation of residential water use. Water in the McKenna wellfield is used solely for residential purposes and thus provides a better means for estimating residential water use. Recreational water use throughout the Community (e.g. swimming pools) continues to grow. Improvements to the water distribution system are also occurring. A new wastewater treatment facility and one-million gallon (3,785 m 3 ) water tower were connected to the Sioux Trail system in late A water treatment plant and 100,000 gallon (379 m 3 ) water tower were added to the McKenna wellfield in Data from was used to predict water needs into the future (figure 9, table 6). Average annual residential water use was determined by examining the water meter records from the Eagle Creek subdivision. The average volume of water used per home per year was determined to be 142,000 gallons (537 m 3 ) based on data from 2006 and This includes water for swimming pools, lawn care and small private businesses. During these years, the average daily water use per Community member was approximately 177 gallons (0.7 m 3 ). In 2002, the Metropolitan Council determined that the average per capita daily demand for Twin Cities municipalities was between 45 and 154 gallons. Average water use per household is assumed to remain constant into the future. After 2005, most new homes will be built on the northern portion of the reservation, which is supplied solely by the McKenna wellfield (Well #554090). Pumping rates at the McKenna well were projected by multiplying the average annual Community household water use by the number of new homes expected to be built there, and adding this volume to pumping volumes in New home construction is precisely known due to our small population growth. Pumping rates in the Sioux Trail wellfield will increase with increasing commercial and governmental development. Commercial and governmental water use was projected by 10
23 extending the linear trend exhibited from to 2020 (figure 9). Residential water use will increase relative to new home construction which is well known and predictable. Beginning in 2000, the Ironton-Galesville aquifer (MUW #253021) provided approximately 75% of the water pumped annually from the Sioux Trail wellfield. The Jordan aquifer (MUW #525938) provided the remaining 25% (Ehresman, 2006). The volume of water pumped from each well varies considerably through the year, however, based on well maintenance needs. It is common for one well to supply 100% of the water for up to almost a year at a time. The current Sioux Trail wellfield pumping schedule is a significant change from the original Community WHPP, which assumed 40% of the Sioux Trail wellfield pumping would be assigned to the Ironton-Galesville aquifer and 60% would be assigned to the Jordan aquifer. The Community is currently monitoring water level fluctuations in the Ironton-Galesville aquifer to determine the regional effects of pumping from that aquifer. Although there are identifiable impacts, there are no known water-use conflicts at this time. Age Water from all three PWS wells (MUW #554090, MUW # and MUW #253021) was age tested by the U.S. Geological Survey using the method Rasmussen 1993 tank no. 2 Standard Oregon Coastal Air (table 2). The CFC-12 data indicated that the water in all three wells is more than 40 years old. Quality The Community s drinking water is tested daily at the McKenna and Sioux Trail pump houses and throughout the distribution system for chlorine, fluoride, and iron. The drinking water is also tested monthly at the McKenna and Sioux Trail pump houses for bacteria. Community drinking water is tested at the McKenna and Sioux Trail pump houses on a three-year cycle for VOCs, SOCs and IOCs. These tests are requested by the EPA and are based on surrounding land uses. Water in the Ironton-Galesville aquifer was initially tested on 9/10/1998, 5 months before the well was completed. The EPA analyzed the results and the water was deemed acceptable for drinking. Chemistry data can be found in Appendix E. Chemistry data indicate that the Community water supply is not immediately vulnerable to nearby land use activities; levels of nitrate+nitrite, pathogens, VOCs, SOCs and IOCs are consistently below EPA limits for drinking water in all public water supply wells. 11
24 CHAPTER 3: WHP AND DWSMA DELINEATIONS The first component of this Wellhead Protection Plan update was the creation of a new groundwater flow model incorporating revised hydrogeologic parameters for Community aquifers. This model was used to delineate new ten-year time-of-travel zones; these zones were then used to define Drinking Water Supply Management Areas (DWSMAs) for the wells. Please refer to the original WHPP for a description of the original ten-year time-of-travel zone delineation process (Appendix F). 3.1 Groundwater Flow Model Overview Barr Engineering Co. (Barr) developed and calibrated a three-dimensional, regional, groundwater flow model for the Community in It was updated to reflect a new water use projection based on data through The groundwater flow model numerically simulates regional groundwater flow through the surficial drift, Prairie du Chien-Jordan, and Franconia- Ironton-Galesville aquifers using the U.S. Geological Survey s finite-difference code, MODFLOW It was developed and ran in the graphical user interface GMS 4.0 and was capable of simulating both steady-state and transient conditions. A summary of the model is included below; construction details are included in the report, GMS4.0/MODFLOW Groundwater Flow Model of the Shakopee Mdewakanton Sioux Community (Wuolo 2004) (Appendix G). In 2006 this model was updated to run under GMS6.0. It retains all of the original functionality and now derives benefits from the additional features available with GMS6.0. This model was built for the purpose of delineating time-of-travel zones for wellhead protection areas and evaluating well interference effects from nearby high-capacity wells. It is important to understand possible sources of error in the model results in order to use the model appropriately. For example: The model assumes that aquifers behave as homogeneous porous media; the model does not consider turbulent flow through discrete fracture zones. The low resolution of geologic mapping does not allow consideration of small-scale variability in aquifer properties. General estimates of effective porosity are applied uniformly throughout the model; effective porosity controls the shape of particle traces. Calibration targets are inherently flawed due to measurements by different people, different years, different seasons, the presence of multi-aquifer wells, the presence of nearby pumping, and inaccuracy in ground surface elevation measurements. One of the largest sources of uncertainty stems from the model s inability to accurately describe turbulent flow directions and rates through fractures and sinkholes. This problem is partially addressed through the ten-year-time-of-travel zone delineation process. 12
25 3.1.1 Data Elements Sources of model data include hydrogeologic studies, data collection activities, and previously constructed groundwater flow models. Initial model parameter values were based on the Minnesota Department of Health s model (MODFLOW code built in GMS 3.1) for source water protection and the Minnesota Pollution Control Agency s Metro Model (Analytic Element model MLAEM code) (Wuolo 2004). The model was refined using additional hydrogeologic data, including: Minnesota Geological Survey bedrock elevation and extent data, Minnesota Geological Survey County Well Index (CWI) data, Minnesota Department of Natural Resources water appropriations data from 2004 SWUDS database, Community aquifer test data for two Jordan wells (Strobel & Delin 1996; Ruhl 1999), Community well construction and water use data from a water system analysis report prepared by Bolton & Menk, Inc. (2003), and Community Public Works data regarding pumping rates and water usage Conceptual Model Description The general characteristics of groundwater flow in an area are most easily described using a conceptual model which illustrates the extent of the model, the number and type of active aquifers and aquitards, and the locations of groundwater recharge and discharge areas (Figure 10) (Wuolo 2004). Extent of the Model Due to the regional scope of wellhead protection planning, this model extends a considerable distance beyond the Community s water supply wells. The model is bounded on the north and northwest by the Minnesota River, the major regional groundwater discharge area. The eastern boundary is the Credit River. The model extends south to the headwaters of the Vermillion River. Aquifers and Aquitards The Barr model contains four aquifers and one aquitard. The model does not extend below the Franconia-Ironton-Galesville aquifer, because the Community does not pump from deeper aquifers. The base of the Franconia-Ironton-Galesville aquifer sits on the Eau Claire Formation, a laterally extensive regional aquitard. Model hydrostratigraphy is represented by six layers, although only 5 are active. The lowermost layer (Layer 6) represents the Franconia-Ironton- Galesville aquifer. The remaining layers, in ascending order, are: the St. Lawrence Formation, the Jordan Sandstone, the Prairie du Chien Group, the Unconsolidated Quaternary Aquifer, and the Unconsolidated Aquifer (inactive Layer 1). Table 1 provides more details about the character of these units. Groundwater Recharge and Discharge The primary source of recharge to the aquifers is infiltrating precipitation. Recharging precipitation is estimated to be between 2 and 12 inches/year. Aquifer recharge also occurs, in 13
26 smaller volumes, from leakage through the bottom of perched lakes (e.g. Prior Lake) and from losing streams (e.g. Credit River headwaters) (Wuolo 2004). The primary source of groundwater discharge is seepage into the Minnesota River. Groundwater discharge also occurs at pumping wells, quarries, and from gaining streams (Eagle Creek and Boiling Springs) (Wuolo 2004) Model Construction Model Grid The model domain is subdivided into grid cells; this is the mesh through which a finite difference model such as MODFLOW solves the differential equations of groundwater flow. The model grid is composed of cells that vary from 10 m 2 near the Community s water supply wells to 500 m 2 at the edges of the model. Not all grid cells are active; inactive cells are those not needed as part of the model computation. Examples of inactive cells include areas where the aquifer is not present or cells that go dry during a simulation. Layer Thickness The thickness of each model layer is defined by the difference in base elevation between one layer and the layer above it. Elevation data was obtained from the Minnesota Geological Survey and entered into the model as polygon zones of equal elevation (Wuolo 2004). Horizontal Hydraulic Conductivity Values of horizontal hydraulic conductivity (K H ) were determined through the model calibration process. Calculated K H values from local pump tests fall within model ranges (Ruhl 1999, Winterstein 2005). Initial model parameter values were based on the Minnesota Department of Health s model (MODFLOW code built in GMS 3.1) for source water protection and the Minnesota Pollution Control Agency s Metro Model (Analytic Element model MLAEM code) (Wuolo 2004). Table 7 summarizes the K H values used in this model. Leakance Leakance is a term referring to the ease with which water can move between model layers in response to differences in hydraulic head. In this model, leakance values are used to represent the aquitards between aquifer layers; a low leakance value means that a strong aquitard is present below a layer. Leakance values were determined during the calibration process. Table 8 summarized the leakance values used in the model. Recharge Recharge is applied to the top of Layer 2 (the uppermost aquifer in the Community model area). Initial recharge values were based on regional studies and range from to meters a year (Wuolo 2004). Final recharge values were determined through the model calibration process. The model includes 16 recharge zones, ranging in value from 0.0 to 1801 x 10-6 m/day. 14
27 Rivers and Lakes Rivers and lakes in the model are represented in three ways: as MODFLOW Constant Head cells, Rivers, or Drains. Table 9 lists the MODFLOW packages used to represent rivers and lakes and how surface water features were assigned to these packages. Constant head boundaries Because the Community model represents only a small component of the regional groundwater flow system, the model needs to account for groundwater moving in and out of the area as through-flow or under-flow. This was done by assigning constant head cells along the edges of the model domain to simulate regional groundwater flow entering and leaving the model. The initial constant head values for the boundaries were obtained largely by a telescoping mesh refinement approach from the regional MDH Scott-Dakota County model. The model calibration process was used to refine the constant head values. Wuolo (2004) determined that the boundaries are set sufficiently far from the area of interest (Community well field) that they should not meaningfully impact the model results. Pumping wells (steady state) The model includes high capacity wells, for which there are water appropriations permit records; examples include water supply wells for Prior Lake and Shakopee. Commercial and industrial wells are also included, when data is available. The average daily pumping rates for these wells were originally calculated from annual reported pumping for 2004, these values were updated in Bottom and top layers are assigned to each well based on the reported aquifer(s) penetrated according to the SWUDS database from MN DNR. The pumping rates assigned to the Community s three public supply wells were determined based on water use projections of 2011 pumping rates. The model was calibrated using these well locations and pumping rates Model Calibration The steady-state groundwater flow model was calibrated using water level observation targets in all five active model layers reported by the Minnesota Pollution Control Agency in their calibration data base for the Metro Model. A total of 465 equally weighted targets were used. It is important to note that there is substantial uncertainty in the calibration targets, due in part to: Measurements at different locations collected at different times of the year and in different years Errors in identifying the aquifer(s) Data from multi-aquifer wells Inaccuracy in the locations of ground surface elevation points Effects from nearby pumping The calibration was performed automatically using automated inverse model PEST. Based on this method, the model is deemed to be acceptably calibrated when used for the purposes for which it was built (delineating time-of-travel zones for wellhead protection areas and evaluating well interference effects from nearby high-capacity wells). 15
28 3.2 Ten-Year Time-of-Travel Zone Delineation Community Drinking Water Supply Management Areas (DWSMAs) were delineated using a ten-year time-of-travel (TOT) criterion defined by the MDH. The MDH delineates DWSMAs using the largest annual actual or projected pumping rate during the time period 5 years prior to the WHP process and 5 years into the future (Table 10). Community pumping stresses were projected for 2011, and 2006 pumping rates were used for surrounding Community wells (as reported in the MN DNR water appropriation permit database) TOT Zone Delineation Using Groundwater Flow Model The computer code MODPATH was used to illustrate the 10-year TOT zones created by Community pumping rates. This code relies on solution files from the MODFLOW model to compute the pathways that water particles take from land surface to the well. Sixty starting particles were set at each well, and each particle was set to move backward in time, away from the well, for 10 years. The area that these particles covered in 10 years is designated as the 10- year TOT zone (Figure 11) TOT Zone Delineation Using MDH Guidance A new methodology provided by the Minnesota Department of Health, Guidance for Delineating Wellhead Protection in Fractured and Solution-Weathered Bedrock, was used to evaluate the potential impacts of secondary porosity on Community public supply well (PSW) capture zone analysis (Minnesota Department of Health, 2005). These guidelines were adopted to consider secondary porosity in Community wellhead protection delineation. The Ironton-Galesville Aquifer is considered to respond to pumping as an equivalent porous media aquifer because 1) it remains hydraulically confined under pumping conditions, 2) caliper and geophysical logs indicate that the aquifer is minimally fractured (Runkel et al, unpublished report, 2005), 3) an aquifer test indicates the absence of recharge boundaries, and a homogeneous, isotropic aquifer, and 4) chemical, isotopic and physical data indicate that the aquifer water is well-mixed and not subject to rapid chemical or physical changes (USGS, 2005) (Table 2). The Jordan aquifer is considered to respond to pumping as an equivalent porous media aquifer because it remains hydraulically confined under pumping conditions in the Community. MDH Technique 3 was therefore employed to delineate the 10-year TOT zone for the Sioux Trail Jordan aquifer well (MUW#525938). The porous media numerical groundwater flow model was used to delineate the capture zone for the well, assuming all water was supplied by the Jordan aquifer. MDH WHP Delineation Technique 4 was also used to confirm this conclusion (Minnesota Department of Health, 2005). This method applies to wells that are open solely in porous media aquifers and that are hydraulically connected to fracture or solution-weathered bedrock aquifer. Step 1 The hydraulic connection between the porous media and fractured rock aquifers was assessed. Jordan aquifer test results indicate that there is a hydraulic connection between the Jordan and 16
29 overlying Prairie du Chein aquifers in the vicinity of the McKenna Jordan aquifer well (MUW# ) (Ruhl 1999). Step 2 A ten-year, calculated fixed radius was generated for each Prairie du Chien and Jordan well, using the following formula: Q R = nlπ Where: Q Volume of water pumped out of the aquifer in 10 years L Aquifer thickness, defined as the known transmissive portion of the open borehole. Otherwise, thickness is the lesser of the length of the open borehole or 200 ft. n Aquifer porosity A literature review yielded the aquifer porosity values found in Table 11. Per MDH guidelines, the aquifer thickness is assumed to be the lesser of the open borehole length or 200 ft. In this case, aquifer thickness is considered to equal the open borehole length Comparison of Groundwater Model and MDH Method Results The volume of water projected to be pumped from the Jordan aquifer over a ten-year period (based on the maximum pumping rate between 2001 and 2011) was compared to the volume of water contained by the aquifers within the 10-year TOT zone delineated by the porous media numerical groundwater flow model. The volume of water contained by the aquifer within the model-delineated 10-year TOT zone was calculated for each well using the following formula: Q = A*n*L Where: Q Volume of water contained within model-delineated 10-year TOT zone A Area of the modeled 10-year TOT zone, based on the maximum pumping rate between 2001 and 2011 L Aquifer thickness, defined as the known transmissive portion of the open borehole. Otherwise, thickness is the lesser of the length of the open borehole or 200 ft. n Aquifer porosity Because the difference between the volume of water pumped over ten years based on the maximum pumping rate between 2001 and 2011 and the volume of water stored within capture zones delineated by a porous media groundwater flow model is less than 10% when porosity is estimated within the range of published literature values for these aquifer types, the porous media groundwater flow model is an appropriate tool for delineating the Jordan aquifer wells DWSMAs. 17
30 3.3 Drinking Water Supply Management Area Delineation The purpose of defining a drinking water supply management area is to determine areas where particular land uses must be specially managed because they have a significant chance of affecting the quality of the drinking water supply. DWSMAs are a reflection of the 10-year TOT zones, but they may be shifted slightly beyond the TOT bounds to follow more easily recognizable landmarks such as roads and section lines. The Community DWSMAs are defined on Figure 11. Any parcel that is wholly or partially included in the WHPA delineation was included in the DWSMA. DWSMA vulnerability (discussed in Chapter 4) was color-coded to reflect differing levels of management: Zone 1 was defined as 100 surrounding each wellhead. Zone 2 was defined by parcels that contain any portion of the Community DWSMA. Zone 2 will be the focus of multi-jurisdictional drinking water supply management actions. The previous Community WHPP included specific descriptions of DWSMA boundaries using Township and Range section numbers and property owner names. Rapid urban development in and around the Community makes identifying individual property owners inappropriate for the updated WHPP. 18
31 CHAPTER 4: VULNERABILITY ASSESSMENTS Wellhead protection rules in Minnesota include assessing both well vulnerability and the vulnerability of the drinking water supply management area. Vulnerability assessments were completed for all three public water supply wells during the initial WHPP process and again during this update. Vulnerability assessments are needed to: 1) determine the degree of risk that land uses may have on the quality of the groundwater entering the public water supply well, 2) guide the amount of effort needed to conduct an inventory of potential contaminant sources, and 3) help define the measures for controlling potential contaminant sources so they do not present a threat to the public water supply well. The methods used to calculate the vulnerability assessments for each well and the DWSMA have been previously established and used in Minnesota by the Department of Health. 4.1 WELL VULNERABILITY Well vulnerability assessments address three components: (1) geologic sensitivity, (2) water chemistry and isotopic composition, and (3) well construction, maintenance, and use. Well construction is further characterized by casing integrity, casing depth, pumping rate and distance from sources of contamination. Each component is assigned points based on the characteristics of that component. The points are summed to give an overall assessment of the well vulnerability. If the total score is 45 or greater, the well is considered vulnerable. If the score is between 5 and 40, priority for the phasing-in of the state s WHP program i is referenced to the population served and the well is considered not vulnerable. Geologic sensitivity, and therefore the intrinsic protection provided by the overlying geologic material, is first determined for each well by calculating an L score. The vulnerability assessment worksheets in Appendix G contain the L scores and the allocation of points for the wells. An L score is described in document, Assessing Well and Aquifer Vulnerability For Wellhead Protection produced by the Minnesota Department of Health in 1997: To assess geologic sensitivity determine the cumulative thickness of the confining unit(s) and reduce this value to an L score. To do this, divide the thickness which overlies the aquifer by ten and round this value down to the nearest whole number. Then, add these numbers to determine the cumulative L score. For example, if a confined aquifer were overlain by two clay units that were 33 feet and 25 feet thick respectively, the L score for that well would be: 33/ /10 = L-3 + L-2 =L-5. 19
32 Confining units by definition in the DNR method must be at least 10 feet in thickness. The chemical and isotopic data are assessed by considering nitrate-nitrogen concentrations and tritium units or the carbon content. This component of the vulnerability assessment is intended to determine the relative age of the water and further describe the human impact on the groundwater system. Vulnerable wells typically have water that shows signs of recent recharge, such as concentrations of tritium higher than 1 TU. Age dating or recharge characteristics can also be detected by CFC age dating, as was the case with the Community wells. Elevated levels of nitrates (> 1 mg/l) may also be an indicator of recent recharge. Well construction considers casing integrity, cased depth, pumping rate and isolation distances. Poor casing integrity, whether cracked or not properly grouted, can allow contaminants to enter the well. Generally, the greater the casing depth is below the land surface the more protection that is offered by the overlying geologic materials. Pumping rate can affect the time that it takes for a contaminant to move to the well. As pumping rates rise, the cone of depression expands and the vertical and horizontal migration of contaminants towards the well tends to increase. Complete Community public water supply well logs are located in Appendix A. The vulnerability of each well was quantified using a Vulnerability Assessment Worksheet developed by the Minnesota Department of Health. Table 14 gives a brief synopsis of the allocation of points calculated for the vulnerability worksheets. For the complete vulnerability assessment worksheets see Appendix G McKenna Wellfield - Jordan aquifer Well A total score of 35 indicates that this well is non-vulnerable. A lack of a definite confining layer will be the most important feature when considering activities regarding this well. A DNR vulnerability rating of moderate is indicated for the McKenna Jordan well, based primarily on the L score. An L score of zero for this well reflects the lack of an effective confining unit above the aquifer (Appendix A). Although over two hundred and fifty feet of material overlies the open hole, no impermeable layer exists between the land surface and the open well hole. The surficial glacial deposits in the vicinity of the McKenna well are composed of 100 feet of mixed sand and gravel. The Prairie du Chien Group, composed of fractured dolomite with thin sandstone layers, begins approximately 110 feet below the surface and extends to a depth of approximately 263 feet below the surface. The Jordan Sandstone aquifer is below the Prairie du Chien Group; it begins at a depth of 263 feet below land surface. CFC-12 analysis indicated that the water in the well was recharged prior to 1945, suggesting water moving vertically will reach the aquifer within several years to decades (Table 2). The McKenna well was properly installed on September 26, 1994 by Bergerson Caswell, Inc., a licensed well driller. The casing is steel, welded and grouted throughout according to State specifications. On September 23, 2004 the pump was removed and the well was bailed. Fill was removed from 345 to 370 (Nubbe 2005). The casing was video-logged and 20
33 determined to be intact at that time. The McKenna well is cased from land surface to a depth of 264. The well is open from 264 to 370. While the pumping rate is highly variable throughout the season, the average pumping rate between 1994 and 2005 was approximately 15 gpm, based on Community Public Works records. The 2011 projected pumping rate is 78 gpm (assuming 40,764,609 gal/year). These average rates represent the total volume of water pumped distributed evenly across the time period considered. Because the McKenna well is greater than 50 deep, only contaminant sources within 50 of the wellhead must be considered in the well vulnerability assessment. There are no sources located within 50 of the well. Chemical and isotopic data indicate that the McKenna well has not been impacted by land use activities to date. As mentioned previously, CFC-12 data indicate relatively long flowpaths to this well, allowing time for chemical and biological processes to mitigate some possible contaminants. Very low levels of nitrate-nitrite (0.06 ppm) were noted in August of Nitrate-nitrite levels have never been recorded at levels greater than 1 ppm at this well. The McKenna well has never tested positive for pathogens. Test results for chemical compounds in the well water have never exceeded the background level (Sahba, 2000) Sioux Trail Wellfield - Jordan aquifer Well A total score of 35 indicates that this well is non-vulnerable. The proximity of the sanitary sewer line will be the most important feature when considering activities regarding this well. A DNR vulnerability rating of low is indicated for the Sioux Trail Jordan well. An L score of 5 for this well reflects the presence of approximately 50 of till above the aquifer (Appendix A). The surficial deposits in the vicinity of the Sioux Trail Jordan well are composed of 140 feet of glacial drift. Nearby boreholes indicate that the drift is composed of 10 of sandy clay beneath topsoil, followed by 40 of till, then 100 of sand over weathered Prairie du Chien bedrock. The Jordan Sandstone aquifer is below the Prairie du Chien Group; it begins at a depth of 297 below land surface. The CFC-12 data indicated that the water in the well was pre-1955 water, suggesting water moving vertically will reach the aquifer within several years to decades (Table 2). The Sioux Trail Jordan well was properly installed on August 26, 1993 by Bergerson Caswell, Inc., a licensed well driller. The casing is steel, welded and grouted throughout according to state specifications. In April 2006, the pump was removed and a large volume of sediment was bailed out of the well. Video-logging revealed a breach in the casing near the wellhead (Downhole Well Services, LLC. 2006). Repairs were made immediately. It is possible that road construction near the wellhead in 2005 compromised the casing. The Sioux Trail Jordan well is cased from land surface to a depth of 307. The well is open from 307 to 395. While the pumping rate is highly variable throughout the season, the average pumping rate between 1994 and 2005 was approximately 86 gpm, based on Community Public Works Department records. The 2011 projected pumping rate is 113 gpm (assuming 59,450,416 21
34 gal/year). These average rates represent the total volume of water pumped distributed evenly across the time period considered. Because the Sioux Trail Jordan well is greater than 50 deep, only contaminant sources within 50 of the wellhead must be considered in the well vulnerability assessment. A sanitary sewer line is located within 50 of the well, because of this the Community will increase the frequency of video inspections to ensure that any possible leaks are detected and repaired as soon as possible. Chemical and isotopic data indicate that the Sioux Trail Jordan well has not been significantly impacted by land use activities to date. As mentioned previously, CFC-12 data indicate relatively long flowpaths to this well, allowing time for chemical and biological processes to mitigate some possible contaminants. Very low levels of nitrate-nitrite (0.06 ppm) were noted at the Sioux Trail water treatment plant in August of The source of nitrogen is uncertain, as both the Jordan aquifer and Ironton-Galesville aquifer were being pumped simultaneously. Nitrate-nitrite levels have never been recorded at levels greater than 1 ppm at this well. Water from the Sioux Trail wellfield has never tested positive for pathogens. Water samples collected in the Sioux Trail water treatment plant tested positive for o-xylene and p&m-xylene (0.2 and 0.3 μg/l respectively, which is very near the EPA reporting limit of 0.2 μg/l) in July of Again, the source of these compounds is unclear because both the Jordan and Ironton-Galesville aquifers were being pumped at that time. It is also possible that these compounds were present due to contamination during the sample collection and analysis process. Test results for chemical compounds in the well water have never exceeded the background level (Sahba, 2000) Sioux Trail Wellfield Ironton/Galesville Aquifer Well A total score of 25 indicates that this well is non-vulnerable. The proximity to sanitary and storm sewer lines will be the most important features when considering activities regarding this well. A DNR vulnerability rating of very low is indicated for the Sioux Trail wellfield Ironton- Galesville aquifer well. An L score of 15 for this well reflects the presence of approximately 50 of till and 100 of impermeable silty dolomite, shale and very fine-grained sandstone above the aquifer (Appendix A). The surficial deposits in the vicinity of the Sioux Trail IG well are composed of 170 of glacial drift. Nearby boreholes indicate that the drift is composed of 10 of sandy clay beneath topsoil, followed by 40 of till, then 100 of sand over weathered Prairie du Chien bedrock. In the Sioux Trail IG well, Prairie du Chien bedrock is encountered at 168 below land surface. The Jordan Sandstone aquifer is below the Prairie du Chien Group and begins at a depth of 312. The St. Lawrence Formation, a regional aquitard, is below the Jordan Sandstone. It begins at approximately 493 below land surface. The thickness of the St. Lawrence Formation and the upper Franconia Formation, as determined from the well log, is approximately 100 feet. Gamma logs, developed during well construction, substantiate the low permeability unit as approximately feet thick. The CFC-12 data indicated that the water in the well was pre-1945 water, suggesting water moving vertically will reach the aquifer within several years to decades (Table 2). 22
35 The Sioux Trail wellfield Ironton-Galesville aquifer well was properly installed on January 1, 1999 by Mineral Services Plus, LLC, a licensed well driller. The casing is steel, welded and grouted throughout according to state specifications. In November 2004, the pump was removed and the well was bailed. Fill was removed from 625 to 638 ; Bailing was stopped after 94 hours (Nubbe 2005). The Sioux Trail wellfield Ironton-Galesville aquifer well is cased from land surface to a depth of 570. The well was open from 570 to 667 immediately after drilling; the hole is currently open from 570 to 638 due to sediment eroding from the walls of the open hole. While the pumping rate is highly variable throughout the season, the average pumping rate between 1994 and 2005 was approximately 81 gpm, based on Community Public Works records. The 2011-projected pumping rate is 349 gpm. These average rates represent the total volume of water pumped distributed evenly across the time period considered. Because the Sioux Trail wellfield Ironton-Galesville aquifer well is greater than 50 feet deep, only contaminant sources within 50 of the wellhead must be considered in the well vulnerability assessment. Sanitary and storm sewer lines are located within 50 feet of the well, because of this the Community will increase the frequency of video inspections to ensure that any possible leaks are detected and repaired as soon as possible. In the past household hazardous waste, heavy equipment, and salt storage were located within 500 feet of the well, all of these potential contaminant sources have been moved and no longer affect this well. Chemical and isotopic data indicate that the Sioux Trail wellfield Ironton-Galesville aquifer well has not been significantly impacted by land use activities to date. As mentioned previously, CFC-12 data indicate relatively long flowpaths to this well, allowing time for chemical and biological processes to mitigate some possible contaminants. Very low levels of nitrate-nitrite (0.06 ppm) were noted at the Sioux Trail pumphouse in August of Very low levels of nitrate-nitrite (0.06 ppm) were noted at the Sioux Trail water treatment plant in August of The source of nitrogen is uncertain, as both the Jordan aquifer and Ironton-Galesville aquifer were being pumped simultaneously. Nitrate-nitrite levels have never been recorded at levels greater than 1 ppm at this location. Water from the Sioux Trail wellfield has never tested positive for pathogens. Water samples collected in the Sioux Trail water treatment plant tested positive for o-xylene and p&m-xylene (0.2 and 0.3 μg/l respectively, which is very near the EPA reporting limit of 0.2 μg/l) in July of Again, the source of these compounds is unclear because both the Jordan and Ironton-Galesville aquifers were being pumped at that time. It is also possible that these compounds were present due to contamination during the sample collection and analysis process. Test results for chemical compounds in the well water have never exceeded the background level (Sahba, 2000). 4.2 DWSMA VULNERABILITY DWSMA vulnerability examines the vulnerability of the aquifer(s) within the 10-year capture zone of each well. It is based on the amount of geologic protection above the aquifer, usually related to the presents of confining layers such as clay and shale. Logs of water supply wells near the tribal PWS wells, a review of chemical and isotopic data for each well, 23
36 and a review of local geologic mapping were used in this assessment. The Minnesota County Well Index (MDH, 2006), the Scott County Atlas (Balaban, 1982), and the Community Geologic Map (Runkel et. al., 2005) provide information about the vulnerability of the bedrock aquifers to contamination McKenna Wellfield Jordan Aquifer Well Recent geologic mapping of the Community by the Minnesota Geological Survey indicates that the surficial geology in the McKenna wellfield DWSMA is characterized by less than 50 feet of clay over more than 50 feet of sand and gravel above bedrock which may be susceptible to rapid recharge (Runkel et al 2005). An interval of fractured limestone at the bedrock surface was noted in a private well drilled less than a quarter-mile from the McKenna wellfield public well, increasing the vulnerability of the Jordan aquifer at this location. There are three documented private wells in the well s 10-year TOT (MDH 2006), although only one penetrates the Jordan aquifer. The construction of a new subdivision, county road, and associated stormwater containment systems in 2005 and 2006 has increased the number of potential contaminants in the DWSMA. Previous land use was primarily agricultural pasture and row crops. The surficial geology was the determining factor in the McKenna wellfield Jordan aquifer DWSMA vulnerability assessment (Error! Reference source not found.). Because the surficial geology around the McKenna well is composed primarily of sand, gravel and fractured limestone, the McKenna Jordan aquifer DWSMA was determined to have a moderate vulnerability. Long flow paths to the well, indicated by CFC data, suggest the DWSMA does not warrant a vulnerable rating Sioux Trail Wellfield Jordan Aquifer Well The Minnesota Geological Survey map of surficial sediments in the Sioux Trail wellfield Jordan aquifer ten-year time-of-travel zone indicates the presence of at least two thick to moderately thick (ten to over a hundred feet) layers of clayey sediments above the Prairie du Chien bedrock. A minor valley eroded into the Prairie Du Chien bedrock beneath the central Sioux Trail wellfield DWSMA increases the likelihood that the bedrock surface may be characterized by solution-enhanced fractures (figures 5 and 6) (Runkel et. al., 2005). There are no private wells in the well s 10-year TOT (MDH, 2006). The Sioux Trail wellfield Jordan aquifer DWSMA is approaching maximum development potential, reducing the likelihood of new contaminant sources. Land use, surficial geology and long flowpaths (suggested by CFC data) were the determining factors in the Sioux Trail wellfield Jordan aquifer DWMSMA vulnerability assessment. This DWSMA was determined to have a moderate vulnerability. 24
37 Ironton-Galesville Aquifer Well Geologic maps, well logs, chemistry data, and flow meter data indicate that the Ironton- Galesville aquifer has a low vulnerability. An examination of the Ironton-Galesville well and gamma logs (Appendix A, B) revealed that there is a confining layer at an approximate depth of 490 feet. The St. Lawrence Formation and the Franconia Formation extend to an approximate depth 600 feet below the surface. Flow meter logging by the Minnesota Geological Survey indicate that porous media flow supplies the majority of water to the Ironton-Galesville well; large fractures were not present locally (Runkel et al 2005). There are 18 wells that penetrate at least part of the Franconia-Ironton-Galesville aquifer within 4 miles of the Community Ironton-Galesville DWSMA, although none of these wells are located within the 10-year TOT for the well (MN CWI, 2005) (figures 5 and 6). Due to the thickness of the protective layers over the drinking water supply management area, the Franconia-Ironton-Galesville DWSMA was determined to be non-vulnerable. 25
38 CHAPTER 5: CONTAMINANT SOURCE INVENTORY The Shakopee Mdewakanton Sioux Community Land Department completed a search for all actual and potential contaminant sources in the McKenna and Sioux Trail wellfields DWSMAs during the original WHPP process. A new contaminant search was conducted for this updated WHPP. This search included a review of EPA Envirofacts multisystem search engine ( a review of the Shakopee Public Utilities Commission Wellhead Protection Plan, the completion of an Inner Wellhead Management Zone Contaminant Source Inventory following MDH guidelines, and a Potential Contaminant Source Survey conducted by the SMSC Land, Public Works and Maintenance Departments (Table 16, Table 17, Figure 13, Figure 14). 26
39 CHAPTER 6: PHYSICAL ENVIRONMENT AND LAND USE CHANGES To determine the expected changes in the physical environment and land uses within and surrounding Community lands, the following sources were examined (Figure 15): 1. Shakopee Mdewakanton Sioux Community Comprehensive Land Use Plan. 2. City of Prior Lake, Minnesota 2020 Comprehensive Plan. 3. Shakopee WHPP Due to the limited residential space on tribal lands, it is expected that a majority of the agricultural lands on the fee and trust parcels throughout the reservation will be converted to medium density residential housing. This is a current and future tribal priority as the median age of Community Members is twenty-one years and the population is expected to grow. The majority of future tribal residential expansion is likely to occur outside of both drinking water supply management areas. Because of the proximity to the cities, the agricultural areas adjacent to tribal lands are being converted to residential areas. It is expected that increasing residential area will require additional commercial growth as well. 27
40 6.1 Land Use (McKenna DWSMA) Unlike the Sioux Trail DWSMA, much of the McKenna DWSMA lies outside of the Community s boundary. Approximately 24% of the 140 acre McKenna DWSMA is under the sole jurisdiction of the City of Prior Lake. The McKenna DWSMA is composed of a variety of land uses including agriculture, wetland, urban low/medium density residential, high density residential and institutional. The agricultural lands that currently comprise about 40% of the DWSMA, are non-tribal and have had recent crops of corn and beans. The urban low/medium density land use areas account for approximately 35% of the DWSMA and are under the jurisdiction of Prior Lake and the Community. A fitness complex occupies an 8% section of the DWSMA. A large senior living and church complex has been constructed on land that was formerly agricultural or open space and is considered high density residential. This parcel accounts for about 6% of the total DWSMA area. The remaining 11% is made up of institutional, natural or wetland type land uses. The City of Prior Lake may convert some of the agricultural areas to medium or high density residential housing. All other areas are projected to remain the same throughout The increase in Prior Lake residential housing in the McKenna DWSMA will require additional water but these needs will be met with systems that are already in place. At this time the SMSC Public Works Department anticipates the installation of one additional Jordan well to provide backup to the residents in the McKenna area. If this happens care will be taken during well placement to protect the integrity of the current DWSMA. It is likely that the resulting ten year travel time will overlap with the current DWSMA, in which case the DWSMA would be expanded to accommodate both wells. 6.2 Land Use (Sioux Trail Jordan and FIG DWSMAs) All of the land within the Sioux Trial Jordan and FIG DWSMAs is owned and managed by the Community. Management options vary from parcel to parcel, however, because nontrust land falls under city, county, and state jurisdiction while trust land is under federal jurisdiction. This has implications for such projects as installing a well or permitting for wetland fill. On trust land the Community is required to follow federal laws. On fee lands the Community is required to follow state laws and local ordinances. A mixture of commercial, institutional, residential and natural areas is the current dominant land uses in the DWSMA. The commercial landscape consists primarily of a casino/hotel complex and the adjacent parking areas, and a recreational vehicle camping area. The grasslands are primarily managed turf and small sections of managed prairie grasses. Though many changes have been made since 2000, it is unlikely that land use will significantly change in the future. The engineering firm Bolton and Menk, Inc. was employed to conduct a consumption and supply study, which was completed in July The Sioux Trail Jordan DWSMA and the 28
41 FIG DWSMA delineations were provided to the engineering firm so due consideration could be given to system expansion. The conclusions of this study indicated that future water needs can be met with increased storage. This additional storage is now in place. At this time the SMSC Public Works Department anticipates the installation of one additional Jordan well to provide backup to the Sioux Trail well system. If this happens care will be taken during well placement to protect the integrity of the current DWSMA. It is likely that the resulting ten year time will overlap with the current DWSMA, in which case the DWSMA would be expanded to accommodate all three wells. 6.3 Influences of Existing Water and Land Government Programs and Regulation The various departments that exist within the Community government influence natural resource management through the programs that are implemented and the regulations that are created. While the natural resource programs are in their early stages, the Community is dedicated to their existence. Examples include: Program Drinking water sampling program Education program Erosion control Forest management Parks management Land use management Plan review Surface water sampling program Wetlands management program Wildlife management Department Public Works Department Land Department Land Department Land Department Public Works Department Land Department Land Department Land Department Land Department Land Department The Land Department interacts with each of the departments and businesses within the Community. This is especially true when new projects are proposed which have the possibility of impacting the natural resources. The Land Department staff also reviews plans from surrounding local communities that have the potential to affect the natural resources of the Community. Pollution control permits and drainage issues are examples of projects that the Land Department is involved with. The combination of the programs mentioned above ensures that the Land Department staff will have input on new projects that have the potential for impact on ground or surface waters. 6.4 Administrative, technical and financial considerations The Community is dedicated to maintaining a natural resource staff with technical and administrative capabilities in their respective fields. The staff consists of a Land Manager, an 29
42 Environmental Specialist, an Assistant Environmental Specialist, a Water Resource Specialist, and two Water Resource Technicians. The Land Department staff is funded through a combination of SMSC and grant funds. The staff participates in training for various components of natural resource management depending on the project. The SMSC plans to maintain a natural resource staff into the foreseeable future. Thus, there will be a member of the Land Department that will be capable of implementing and managing the Wellhead Protection Program. Decisions about financial viability are project dependent. The objectives contained in this WHPP are expected to be financially viable. Numerous funding alternatives will be explored before a goal or objective is considered unattainable. To date, no objectives have been compromised due to financial barriers. Terms employed in the Land Use Section Shakopee Mdewakanton Sioux Community Urban Low/Medium Density Residential Single family homes on one acre lots Institutional - government institution and/or government maintained facility Commercial - retail and/or recreation related business From -City of Prior Lake, Minnesota 2020 Comprehensive Plan Rural Density - up to one unit per 40 acres Urban Low-to-Medium Density - up to 10 units per acre Urban High Density -up to 30 units per acre 30
43 CHAPTER 7: EXPECTED CHANGES TO THE GROUND AND SURFACE WATER As land surrounding the reservation continues to be converted from agriculture to residential, commercial and industrial land uses, the associated water resources will continue to be stressed due to anthropogenic sources. The majority of the land use changes within the McKenna Drinking Water Supply Management Area are outside of the jurisdictional control of the Community. Although the Community owns the property within the Sioux Trail DWSMAs, jurisdictional control is shared with the State of Minnesota on portions of the property. On these shared portions the Community is required to follow the standard permitting procedures for most ground and surface water projects. 7.1 McKenna DWSMA The conversion in land use from agricultural to urban medium or high density will continue to bring about several changes that are relevant to water resources(table 19). The following are areas of concern, in order of importance, that are associated with an increase in residential area: I. Increase in the use of groundwater supplies through domestic water use II. Increase in impervious area a) Increase in peak flow volumes and rates b) Increase in chemicals (i.e. antifreeze, oil, etc.) associated with parking areas c) Decrease in infiltration recharge III. Increase in managed turf a) Increase in chemicals (i.e. fertilizer and pesticide) associated with managed turf care b) Additional water supplies needed for managed turf care IV. Increase in public utilities, including sewer, water, electric, telephone and other public utilities The increase in the use of consumptive water supplies is a primary concern as it relates to the availability of sufficient water supplies to meet Community needs. The conversion to medium and high density urban housing will require additional water but the city of Prior Lake plans to meet these needs with the current system. It is expected that the current McKenna system consisting of a well, treatment facility and tower will meet the Community needs for at least 20 years, but an additional well is planned for backup purposes. After development of the forest and agricultural land north of the McKenna DWSMA, The Community will have little remaining open land space in the area of the McKenna well and thus changes to the land use are not expected. The area immediately north of the McKenna DWSMA is currently being developed as low density (1 acre lots). 31
44 A land use conversion from agriculture to residential will decrease the amount of pesticides, herbicides and fertilizers used to produce row crops. This decrease in row crop management is likely to be replaced with the high intensity management of turf grass and impervious areas. The associated fertilizers, pesticides, herbicides, metals and salts could have detrimental effects on the receiving surface waters. Surface water contamination could lead to intensified algae blooms, vegetation and wildlife habitat loss and a subsequent lack of diversity in the receiving water bodies. Due to the well location upgradient of new Community development, well depth and the relative age of the water currently being withdrawn, groundwater contamination from the aforementioned contaminants is not a primary concern. The land use changes will require additional sanitary and storm sewer systems as well as other public utilities. Surface water conveyance structures may be expected to have some impact on the surface water resources however; it is the practice of the SMSC to treat all storm water before allowing infiltration. All other utilities are not expected to impact the ground or surface waters within the DWSMA. 7.2 Sioux Trail Jordan DWSMA Commercial expansion within and near the DWSMA has occurred steadily since the WHP was originally written and approved in This expansion is expected to slow as most developable sites have been built out. The commercial expansion that does take place will likely be dominated by small business growth. Since the Tribal Council is aware of the DWSMAs, every attempt will be made to protect the surface and groundwater resources. The following are areas of concern, in order of importance, that are typically associated with an increase in commercial enterprises: I. Increase in the use of groundwater supplies through commercial water use and new high capacity wells II. Increase in impervious surface area a) Increase in peak flow volumes and rates b) Increase in chemicals (i.e. antifreeze, oil, etc.) associated with parking areas c) Decrease in infiltration recharge III. Increase in managed turf a) Increase in chemicals (i.e. fertilizer and pesticide) associated with managed turf care b) Additional water supplies needed for managed turf care IV. Increase in public utilities, including sewer, water, electric, telephone and other public utilities V. Increase in hazardous waste As with the McKenna well, the conversion of land use from agriculture to residential or commercial will decrease the amount of pesticides, herbicides and fertilizers used to produce row crops. This decrease in row crop management is generally replaced with the high intensity management of turf grass and impervious areas. The associated fertilizers, pesticides, herbicides, metals and salts could have detrimental effects on the receiving 32
45 surface waters. Surface water contamination could include increased algae blooms, vegetation and wildlife habitat loss and a subsequent lack of diversity in the receiving water bodies. Future storm water retention and detention ponds will be designed to limit infiltration or have treatment prior to infiltration, and reduce the volume and rate of water releases. Due to the depths of each well and the relative age of the water currently being withdrawn, possible groundwater contamination from the aforementioned contaminants is not a primary concern. The land use changes will require additional sanitary and storm sewer systems as well as other public utilities. Surface water conveyance structures may be expected to have some impact on the surface water resources. All other utilities are not expected to impact the ground or surface waters. 7.3 Sioux Trail FIG DWSMA Because of the non-vulnerable assessment, the areas of concern associated with the FIG DWSMA are limited to an increase in pumping rates and new high capacity wells. It is expected that an increase in commercial area will result in increased groundwater withdrawals. It is not expected that new high capacity wells will be necessary in the next 10 years. The following are areas of concern, in order of importance: I. The increase in the use of groundwater supplies through commercial water use II. III. The construction of new high capacity wells Contamination introduced through FIG monitoring wells 33
46 CHAPTER 8: PROBLEMS AND OPPORTUNITIES This section has been designed to identify potential problems and opportunities related to the management of the three drinking water supply management areas. In general, Community land use controls are adequate in the areas of groundwater development and groundwater quality control. The Community has made an effort to complement existing county, city, and regional controls and regulations. Strategies for surface water management including storm water, erosion control, wetland protection, and conservation, are being developed which mimic federal, state and city regulations and ordinance where appropriate. Currently, the Community is working on a water resources management plan that will include surface water management strategies. All proposed projects, Community and non-community, are reviewed by departmental offices. Through the compilation of this report, associated public review process and subsequent update of the report, issues of concern (both positive and negative) were seen to fall into two categories: technical concerns and administrative concerns. 8.1 Problems Technical Problems The problems presented below relate to each of the three DWSMAs with the exception of the potential contaminants, which is not applicable to the Sioux Trail FIG well based on the nonvulnerable assessment. 1. Inadequate Data Much of this plan is based on a need for detailed local data. Some data, such as climate and soil data, does not have a dramatic impact on the wellhead protection area delineations or ground water susceptibility to contamination. However, aquifer characteristics, pumping rates, and land use have a very large impact on the assessment and subsequent management of the wellhead protection areas. Land use data, in particular, is a difficult data element to track, due to past changes in land use. A system must be maintained to update this data on a regular basis. 2. Water Quantity/Quality Concerns The population growth of Prior Lake and Shakopee will require additional groundwater supplies for these communities. The Prairie du Chein/Jordan aquifer has been the first choice for high capacity wells because it is the most economically feasible option. Without intensive investigation in the planning stages of well placement, there may be well interference and supply problems. Currently the Minnesota Department of Natural Resources requires extra scrutiny and monitoring for any possible new Prairie du Chein/Jordan well. Well construction within the drinking water supply management areas could influence water supply capabilities, alter the drinking water supply management area delineations, and introduce contaminants into the water supply. Because of recent land acquisitions, 34
47 the Community s Comprehensive Plan is undergoing changes on a continual basis. Land use projections indicate that the SMSC may need to increase groundwater withdrawals. Also, the rate of increase in groundwater use by Community Members and businesses may require additional water supplies in the future. In 2003 a water system analysis was conducted by Bolton & Menk. This analysis concluded that the water needs of the Community in the next ten to twenty years can be met by increasing storage and by cooperating with the surrounding cities. Both of these objectives have been accomplished since the release of this study. 3. Potential Contaminants Due to a moderate vulnerability assessment, pesticides, herbicides and nutrients as well as storm water runoff rate, quantity and quality are not a primary concern. The Potential Contaminant Source Inventory revealed several areas of concern that the Community must address to ensure high water quality. The potential contaminants of concern include: a) Above ground fuel tanks in close proximity to the McKenna and Sioux Trail Jordan DWSMAs b) Underground storage tanks in close proximity to the Sioux Trail Jordan DWSMA c) Septic systems within the McKenna DWSMA d) Agricultural practices within the McKenna DWSMA e) High intensity lawn care within the Sioux Trail Jordan DWSMA f) Storm sewer line within 50 feet of well (no ) Administrative Problems Multi-jurisdictional Management The McKenna Drinking Water Supply Management Area crosses into the jurisdiction of Prior Lake. From a management stand point this is seen a potential area of concern. Land uses with known contaminants will be difficult to control outside of Community jurisdiction. These jurisdictional issues are a cause for concern to non-community members as well. Landowners in the McKenna DWSMA have attended public meetings to express concerns that they will face regulation by the Community. This highlights the need for clear communication between the Community and neighboring residents. One possible resolution is to work closely with surrounding communities to develop a memorandum of agreement which clearly states the jurisdictional roles each body has regarding DWSMAs. 8.2 Opportunities Technical Opportunities The cooperation between the Community and the City of Prior Lake has afforded the reality of a connection between water systems for emergency supply and backup uses. Data sharing is also occurring between the Community and the surrounding municipalities. The construction of a waste water treatment facility has provided the Community with the ability to reclaim water that would otherwise be lost to the surface water system. Treated 35
48 effluent is routed through a series of ponds leading to The Meadows golf course, this water is used as needed for irrigation on the course. Additionally, the waste water treatment facility was built with a 31,000 sq. ft. green roof to aid in storm water retention and temperature abatement. During dry periods, treated effluent from the facility is used to irrigate the roof Administrative Opportunities 1. Public Education Maintaining the quality of the water is a vital interest to all Community and non- Community members. Through education, services and in a limited number of cases regulation, the drinking water will continue to be of high quality. Educating the businesses and the public about the benefits of protecting the groundwater resource is the preferred option. Limiting the rate of increase in groundwater consumption will require educating business and the public about the primary ways in which water is wasted. 2. Multi-Jurisdictional Cooperation Although the Community is not mandated under State law to create a Wellhead Protection Plan, the Community is attempting to closely follow the State guidelines for wellhead protection. It is hoped that this procedure will produce uniformity in ground water management strategies among surrounding communities. Because the McKenna and Sioux Trail Drinking Water Supply Management Areas are under multiple jurisdictional authorities, several opportunities have been pursued with Prior Lake, Shakopee, Scott County, and the State. These include: a) Cooperative efforts in more accurately defining the groundwater flow regime, b) Cooperative efforts in public education, and c) Sharing of data. 36
49 CHAPTER 9: WELLHEAD PROTECTION GOALS Through the wellhead protection planning process identified goals were used to establish a set of objectives. A careful examination of the goals and objectives in light of the intended scope and contents of this document led to the development of specific action items. The implementation of these action items will aid in the achievement of the objectives and goals. 9.1 Goals The development of this report has led to the establishment of the following goals: Continue to maintain drinking water quality levels that meet or exceed all quality standards Protect aquifers through proper well management Reduce contamination risks associated with surface activities Maintain or improve cooperation with nearby governing bodies in an effort to address regional aquifer protection Reduce water use per capita Increase public awareness of groundwater issues 9.2 Objectives The following objectives were developed to address the stated goals: 1. Limit new well development 2. Locate and seal abandoned wells 3. Ensure proper management of storage tanks 4. Identify new contaminant sources 5. Review current drinking water testing schedules and procedures and develop a Quality Assurance Protection Plan 6. Use a variety of media formats to raise public awareness concerning water quality 7. Consider employing water conservation techniques to achieve a target ratio of maximum daily to average daily pumping rates of 2.6 or less 8. Monitor drinking water supply well pumping data 9. Improve surface water quality through testing and management 9.3 Implementation Objective 1: Limit new well development 37
50 Action 1: Partners: Time frame: Cost: Maintain communication with public works department and surrounding local governments to keep abreast of any well installation plans and encourage placement outside of DWSMAs. SMSC, City of Shakopee, City of Prior Lake Ongoing Staff time Objective 2: Locate and seal abandoned wells Action 2a: Partners: Time frame: Cost: Through the use of the Scott County Well Index, communication with surrounding local governments and land acquisition identify abandoned wells within or near the DWSMAs. SMSC, City of Shakopee, City of Prior Lake, Scott County Ongoing Staff time Action 2b: Seal abandoned wells within DWSMAs on Community held lands or recommend sealing of wells on non-community lands. Partners: SMSC, City of Shakopee, City of Prior Lake Time frame: Ongoing Cost: Staff time, sealing cost for Community wells Action 2c: Partners: Time frame: Cost: Maintain database of all wells within or near DWSMAs SMSC Ongoing Staff time Objective 3: Ensure proper management of storage tanks Action 3a: Partners: Time frame: Cost: Action 3b: Partners: Time frame: Cost: Require all storage tank owners on Community lands to comply with all applicable regulations regarding above and underground storage tanks and work with any storage tank owners on non-community lands to comply with their local governing body SMSC, other tank owners Ongoing Staff time Require all storage tank owners on Community lands to submit quarterly reports regarding storage tank use to the Land Department SMSC, local tank owners Quarterly Staff time 38
51 Action 3c: Provide training for tank owners. Training topics to include maintenance, inspection and safety Partners: Any tank owner Time frame: Every 2-3 years Cost: $400 Action 3d: Partners: Time frame: Cost: Action 3e: Partners: Time frame: Cost: Consider having staff member obtain EPA certification for tank inspection SMSC, EPA Within 3 years $0 (if acted upon there may be travel expense) Discourage installation of new storage tanks within or near DWSMAs through agreement with surrounding governing bodies SMSC, City of Shakopee, City of Prior Lake Ongoing Staff time Objective 4: Identify new or undiscovered contaminant sources Action 4a: Partners: Time frame: Cost: Action 4b: Partners: Time frame: Cost: Monitor redevelopment or new development plans to check for potential contaminant sources within or near the DWSMAs SMSC, City of Shakopee, City of Prior Lake Ongoing Staff time Maintain communication with emergency response departments regarding spills or other activity that could compromise groundwater health within or near the DWSMAs SMSC, SMSC emergency services, City of Shakopee, City of Prior Lake Ongoing Staff time Objective 5: Review current drinking water testing schedules and procedures Action 5a: Partners: Time frame: Cost: Evaluate current methods for drinking water testing to determine if current activity is sufficient. Develop new methods if necessary SMSC, Public Works staff Within 2 years of Plan approval Staff time 39
52 Action 5b: Partners: Time frame: Cost: Work with Public Works Department to develop a Quality Assurance Project Plan for sampling SMSC, Public Works staff Within 2 years Staff time Objective 6: Use a variety of media formats to raise public awareness concerning water quality Action 6a: Partners: Time frame: Cost: Action 6b: Partners: Time frame: Cost: Action 6c: Partners: Time frame: Cost: Action 6d: Partners: Time frame: Cost: Redevelop and update department website to provide a dynamic medium for water resources information exchange SMSC In progress, ongoing Staff time Use the Community newsletter (Iapi Oaye) to provide information regarding wellhead protection SMSC Annually Staff time Make copies of the drinking water Consumer Confidence Report available to the public through mail, track racks or electronically SMSC Annually Staff time, $0-500 (format dependant) Use mailings to distribute information regarding WHP issues including proper fertilization techniques, waste disposal, septic system maintenance or feedlot management SMSC annually on a rotating basis Staff time, postage Objective 7: Consider employing water conservation techniques to achieve a target ratio of maximum daily to average daily pumping rates of 2.6 or less Action 7a: Partners: Time frame: Investigate use of irrigation restrictions to conserve or moderate water use. Examples include odd / even house number watering days, or irrigation ban during warmest hours of the day SMSC, Business Council Within one year of Plan approval 40
53 Cost: Action 7b: Partners: Time frame: Cost: Staff time Consider requiring all irrigation systems have precipitation sensors installed to reduce water use when it is unnecessary SMSC, Business Council Within one year of Plan approval Staff time Objective 8: Monitor drinking water supply well pumping data Action 8: Partners: Time frame: Cost: Use SCADA systems to monitor pumping rates and aquifer drawdown on all Community drinking water supply wells SMSC, Public Works staff Ongoing for Sioux Trail water supply, when installed for McKenna Staff time Objective 9: Improve surface water quality through testing and management Action 9a: Partners: Time frame: Cost: Action 9b: Partners: Time frame: Cost: Require pre-treatment of storm water before infiltration is allowed SMSC Ongoing Staff time Encourage low impact development to promote groundwater recharge. Examples include rain gardens, porous pavement or green roofs SMSC, Business Council Ongoing Staff time 41
54 CHAPTER 10: PROGRAM EVALUATION An evaluation program is essential during the management phase of the Wellhead Protection Plan to ensure that the plan of action is proceeding accordingly. The Shakopee Mdewakanton Sioux Community will evaluate the progress of the Plan of Action for the McKenna and Sioux Trail DWSMAs on an annual basis. The evaluation program exists for several reasons: 1) To ensure that wellhead protection measures are implemented. 2) To evaluate the progress of plan implementation. 3) To make certain that the Wellhead Protection Plan is useful as a reference for tribal planners. A written Wellhead Protection Program Evaluation Report will be submitted annually to the Environmental Protection Agency in conjunction with the submittal of the Consumer Confidence Report. This timing is preferential as it will include the well water sampling results for the previous year. Copies will also be provided to the Community Business Council, the wellhead protection file, the Minnesota Department of Health and the Minnesota Rural Water Association. The Evaluation Report will contain a progress report to document implementation of wellhead protection measures during the previous fiscal year. Specifically the progress report will include: a) The existence and location, with regard to the PWS, of newly discovered potential contaminant sources, b) Any changes in land use that was not anticipated, c) New problems or opportunities, d) An alteration or restructuring of wellhead protection goals, e) Recent information that would lead to a reassessment of well or DWSMA vulnerability, f) Any changes in, or the implementation of, the Water Supply Contingency Plan, and g) The success of the implementation of the plan of action. 42
55 CHAPTER 11: WATER SUPPLY CONTINGENCY PLAN 11.1 Purpose This portion of the Shakopee Mdewakanton Sioux Community Wellhead Protection Plan is intended for use during times when the public water supply suffers partial or total loss of capability to supply water to the consumers Public Water Supply Characteristics Public Water Supply Source Information For more information on the public water supply please see Table Treatment Sioux Trail System Water treatment at the Sioux Trail facility is conducted on a daily basis by the Public Works Department. Treatment consists of the following: Aeration of raw water Pre chlorination Addition of potassium permanganate Detention filtration Chemical addition - orthophosphate, fluoride and chlorine Testing of the Sioux Trail system is also completed on a daily basis for chlorine, iron, manganese and fluoride. Total coliform tests are performed fifteen times per month at representative sample sites throughout the distribution system. A revised population assessment by the Environmental Protection Agency (EPA) prompted an increase from one per month to its current level. Other tests, such as metals and VOCs, are conducted according to time lines established by the EPA. McKenna system The McKenna facility primarily consists of a pump station with a polyphosphate addition used to sequester the iron and manganese in the water. Testing of the McKenna system is completed on a daily basis for chlorine and fluoride. Total coliform tests are performed on a monthly basis at representative sample sites throughout the distribution system. 43
56 Other tests, such as metals and VOCs, are conducted according to timelines established by the EPA Storage and Distribution Sioux Trail System The Sioux Trail System has the capability for 1.3 million gallons of elevated storage. One elevated storage tower (300,000 gal.) is located in Norman Crooks Park adjacent to the Community Center at 2330 Sioux Trail, the second (1 million gal.) is located across from the fire station at 2525 Flandreau Trail. The primary 6 to 10 transmission line for the Sioux Trail water supply follows County Road 83. This system is now looped to allow for the isolation of particular zones. McKenna Well The McKenna system has an elevated storage capacity of 100,000 gallons. Individual streets can be isolated throughout the McKenna system. If quantity or quality problems become apparent, service to the non-isolated portions of the system can continue. This system is connected to the Prior Lake water supply which can be utilized during an emergency Maps/Plans Water mains, gate valves and fire hydrants, can be located by obtaining maps from the Public Works Office at 2975 Sioux Trail N.W. Bolton Menk Engineering, Inc. will be contacted should the alternative plans be needed Priority of water users during a water supply emergency In an emergency, water shortages may exist while the situation is corrected. After the extent of the problem is defined, the next step will be allotting water to consumers. Priorities were established using an overall ranking scheme (Table 21, Table 22). Water consumers were grouped into eighteen categories. These categories were then ranked in order of importance. In the event of an emergency water shortage, consumers or water uses in the lowest ranking categories will not be given access to water until the emergency has been dealt with Alternative Water Supply Emergency or Backup Wells The Community has two high production wells serving the Sioux Trail system. One well is withdrawing water from the Jordan Aquifer while the second well is withdrawing water from the Franconia-Ironton-Galesville aquifer. The separate wells provide the capability for mitigation under three circumstances: well contamination, well malfunction, and aquifer contamination. Switching to the other well and flushing the system can mitigate all of these. Both of these wells are connected to the treatment system. The supply system is also looped which allows for isolation of particular areas. 44
57 In addition, a high capacity PDC/Jordan well exists and is currently used as supplemental mixing for irrigation water. In an emergency situation, this well could be connected to the Sioux Trail water supply system within two days and act as a back up well until the crisis was resolved. Currently this well is not physically connected to the drinking water system. The McKenna system is both looped and connected with the Prior Lake water supply system. In the event of an emergency the Community has the option of isolating the affected area or using water from the Prior Lake system as the situation dictates. The McKenna system is planned to be connected with the Sioux Trail system in the next several years, this will provide an alternate water supply for both the McKenna and Sioux Trail consumers Emergency Water Supplies, Delivery and Distribution Mineral Service Plus, LLC is the company responsible for servicing the wells. They have also been contracted to supply water to the Community should total system collapse occur. They have a 2,100 gallon tanker which would be used to transport water from Prior Lake or Savage. Depending on the nature of the problem, the water could be treated and pumped into one of the two (or both) existing pressure storage tanks for Community use. The expected response time for this service is somewhat dependent on weather and the materials needed. In the past, they have provided emergency service to the wells within one to two hours. In order to ensure the fastest possible response time, communication lines must be clear. The following contact list is on file with Mineral Service Plus, LLC, the Public Works Department, the Land Department, and the Tribal Administrator (Table 23) Source Management Because the Sioux Trail system has a well in both the Jordan and Franconia-Ironton- Galesville aquifers, blending water is an option that could be explored. For instance, should the Jordan aquifer exhibit signs of excess nitrates, water could be blended with water from the Franconia-Ironton-Galesville aquifer. However, since water demand currently is not beyond the capabilities of either source of supply, it is more likely that the contaminated source of water would be excluded in preference for the uncontaminated source. In the next several years, the capability may exist for blending McKenna well water with Sioux Trail well water Inventory of available emergency equipment and materials For a list of available emergency equipment and materials, please see Table Notification Procedures Upon discovery of an emergency situation, the Community staff listed in Table 25 will be notified. They will then notify other relevant staff members (Table 26) and coordinate the information release strategy. The information release strategy will depend on the urgency of 45
58 the situation. Should either the McKenna or Sioux Trail systems become unusable, consumers will be notified by a phone call or house visit immediately. If it is determined that rationing water is necessary, consumers will be notified and provided the information as detailed below Public Information Plan This portion of the contingency plan is dedicated to the distribution of public information should a quality or quantity problem appear with either the McKenna well or the Sioux Trial wells. This will also apply to problems discovered in the distribution system. All public notices will contain the following information: 1. A description of the violation or situation, including contaminant levels, if applicable, 2. When the violation or situation occurred, 3. Any potential adverse health effects (using standard health effects language from Appendix B of the public notification rule of the standard monitoring language), 4. The population at risk, 5. Whether alternative water supplies should be used, 6. Procedures that consumers should follow, 7. What the system personnel are doing to correct the violation or situation, 8. When the water system expects to return to compliance or resolve the situation, 9. The name and phone number of the water system operator, and 10. A statement encouraging distribution of the notice to others, where applicable. Quality Emergency notice templates have been developed by the Environmental Protection Agency and are based on a tiered system. What is described below is the trigger mechanism of a public notice. Tier 1 (Immediate Notice, Within 24 Hours) Notice as soon as practical or within 24 hours via radio, TV, hand delivery, posting or other method specified by Environmental Protection Agency, along with other methods if needed to reach persons served. Public water suppliers must initiate consultation with the EPA within 24 hours. The EPA may establish additional requirements during consultation. Fecal coliform violations; failure to test for fecal coliform after initial total coliform sample tests positive Nitrate, nitrite, or total nitrate and nitrite MCL violation; failure to take confirmation sample Chlorine dioxide MRDL violation in distribution system; failure to take samples in distribution system when required Exceedance of maximum allowable turbidity level, if elevated to Tier 1 by primary agency Waterborne disease outbreak or other waterborne emergency Other violation or situations determined by the primacy agency Tier 2 (Notice as Soon as Possible, within 30 days) 46
59 Notice as soon as practical or within 30 days. Repeat notice every three months until violation is resolved. Community water suppliers: notice via mail or direct delivery. All public water suppliers must use an additional delivery method reasonably calculated to reach other consumers not notified by the first method. All MCL, MRDL, and treatment technique violations, except where Tier 1 notice is required Monitoring violations, if elevated to Tier 2 by primary agency Failure to comply with variance and exemption conditions Tier 3 (Annual Notice) Notice within 12 months; repeated every twelve months for unresolved violations. Notices for individual violations can be combined in an annual notice (including the CCR, if public notification requirements can still be met). CWSs: Notice via mail or direct delivery. NCWSs: Notice via posting, direct delivery, or mail. The EPA may permit alternate methods. All PWSs must use additional delivery methods reasonably calculated to reach other consumers not notified by the first method. Monitoring or testing procedure violations, unless the EPA elevates to Tier 2 Operation under a variance and exemption Special public notices (fluoride secondary maximum contaminant level (SMCL) exceedance, availability of unregulated contaminant monitoring results) The primary spokesperson for the media and/or public comment in the event of an emergency or contamination incident will be: Bill Rudnicki Tribal Administrator Cell Phone Work Telephone Since the Community is relatively small, information will be distributed directly to the Community members through a team that will be assembled by the Tribal Administrator Mitigation and Conservation Plan Mitigation The mitigation section of the Contingency Plan identifies ways to reduce the vulnerability of water supply system to disruption and to improve the Community s response capabilities. A. Infrastructure maintenance/upgrades/maps The Sioux Trail system is maintained on a daily basis. As necessary, the chemical feed pumps are maintained and/or refurbished, the service pumps, valves and piping are inspected, and the filter bed is regenerated. Maps are updated as new equipment or distribution lines are installed. B. Regular inspection of tower, well and pump house Tower inspection is completed quarterly. The process involves climbing the tower and visually inspecting the tower. The well and pump house are 47
60 inspected daily. This includes a visual inspection of the valves, the treatment system and the distribution system. C. Staff emergency training Training needs are dictated and scheduled by the Public Works Coordinator. Personnel are trained according to system need, which includes emergency response. D. System valving to isolate problems Both the McKenna and Sioux Trail systems have numerous locations that allow for isolation. Now that the systems are looped, the capability exists for the shutdown of portions of the system, while other parts of the system are being fixed, maintained or treated. E. Sanitation procedures for construction repairs After construction or maintenance the system is flushed and then chlorinated for 24 hours Conservation a) Public Education: An education campaign is currently in place. Throughout the development of the Wellhead Protection Plan, Community Members have been kept informed through public notices and newsletter articles. In 1999 a Water Resource Protection Packet was distributed to Community Members. This packet contained ground and surface water information, methods of conservation and pollution prevention, a magnet with conservation methods and a recycling guide. Efforts such as these will be continued periodically. b) Ordinances: Several ordinance options are being explored. One such option that has worked well in moderating spikes in residential water use in Shakopee, MN is aimed at reducing the amount used for lawn and landscape maintenance. This ordinance allows lawn watering on even sides of the street on even days of the month and the odd sides of the street on odd days of the month, time restrictions may also be employed to reduce water loss due to evaporation during periods of high temperature. Required use of low flow devices and rainfall gauges used in conjunction with sprinkling systems are additional options that are under consideration. c) Re-use: The SMSC water treatment plant uses reverse osmosis to soften the community water supply. This action eliminates the need for commercial and residential water softening units. As a result, the waste water treatment plant effluent will be a viable source for irrigation which will reduce overall pumping values. 48
61 CHAPTER 12: PROCEDURES FOR AMENDING AN EXISTING PLAN As land designation and use continue to evolve around the drinking water supply management areas, amendments to the existing plan will need to be addressed. Amendments are required in the following two cases: 1. The plan must be amended whenever a new well is added to the public water supply system. 2. MDH guidelines stipulate that this plan must be amended every ten years. To ensure that the amendment is finalized before that time, the process must begin no later than eight years after the EPA and MDH approve the initial plan. This amendment process will allow for changes in the WHP area boundaries to reflect the pumping effects of new wells. Specifically, these new wells may change ground water flow boundaries and/or change the ground water flow field. The amendment process will follow the same procedures used to develop the initial plan. The Documentation List located at the beginning of this plan details the procedures used to develop this plan. Plan amendments will also follow the same criteria used in the initial plan. This includes criteria for evaluating vulnerability ratings, determining DWSMA boundaries, assessing potential contaminates, and creating management objectives. 49
62 References Aronow, S., and Hobbs, H.C., 1982, Surficial geologic map, Map C-1, plate 2, in Balaban, N.H. and McSwiggen, P.L., eds., Geologic Atlas, Scott County, Minnesota, County Atlas Series, Minnesota Geological Survey, Map C-1, 6 plates. Barr Engineering Co., GMS 4.0/MODFLOW Groundwater Flow Model of The Shakopee Mdewakanton Sioux Community. Bringham Young University, Groundwater Modeling System (GMS), Version 2.9, BYU Engineering Graphics Laboratory. Delin, G.N., 1991, Hydrogeology and simulation of ground-water flow in the Rochester area, Southeastern Minnesota, : U.S. Geological Survey Water-Resources Investigations Report , 102 p. Delin, G.N. and M.L. Strobel, Analysis of Hydrogeologic Properties in the Prairie du Chein-Jordan aquifer, Shakopee Mdewakanton Sioux Community, Southeastern Minnesota. U.S. Geological Survey Open File Report Ehresman, Kurt, 2006, Personal Communication. Hansen, D.D., and J.K. Seaberg, 2000, Metropolitan Area Groundwater Model Project Summary: Lower Aquifers Model Layers 4 and 5, Version Minnesota Pollution Control Agency. Kanivetsky, R. And B. Palen, Hydrogeology of Scott County, Map C-1, Plate 6, in Balaban, N.H. nad McSwiggan, P.L., eds., Geologic Atlas, Scott County, Minnesota, County Atlas Series, Minnesota Geological Survey, Map C-1, 6 plates. McDonald, M.g. and A.W. Harbaugh, A modular three-dimensional finite-difference ground-water flow model. Techniques of Water-Resources Investigations 06-A1, USGS, 576 p. Metropolitan Council, 2004, Regional Report: Water Demand and Planning in the Twin Cities Metropolitan Area, an Update to the Long-Term Water Supply Plan. Minnesota Climatology Working Group, ( Minnesota Department of Natural Resources - Division of Waters, June 1991, Criteria and Guidelines for Assessing Geologic Sensitivity of Groundwater Resources in Minnesota, Page 9 and Pages Minnesota Department of Natural Resources Web Site, ( 50
63 Minnesota Geological Survey and Minnesota Department of Health, County Well Index V Tim Wahl and Bob Tipping Meyer, G.N., 1982, Surficial geologic cross sections, map C-1, plate 3, in Balaban, N.H. and McSwiggan, P.L., eds., Geologic Atlas, Scott County, Minnesota, County Atlas Series, Minnesota Geological Survey, Map C-1, 6 plates. Nolan, Pete, 2006, Personal Communication. Olsen, B.M., 1982, Bedrock geology, Map C-1, plate 5, in Balaban, N.H., and McSwiggan, P.L., eds., Geologic Atlas, Scott County, Minnesota, County Atlas Series, Minnesota Geological Survey, Map C-1, 6 plates. Ruhl, R.F., 1999, Hydrogeologic Properties of the Prairie du Chien-Jordan aquifer, Shakopee Mdewakanton Sioux Community, Southeaster Minnesota, United States Geological Survey Water-Resources Investigations Report Runkel, Anthony C., Tipping, Robert G., and Meyer, Gary, 2005, Mapping and Hydrogeologic Research in Support of Groundwater Management, Shakopee Mdewakanton Sioux Community, Scott County, Minnesota, Prepared for the Shakopee Mdewakanton Sioux Community, June 2005, 36 p. Sahba, R. 7/11/00. Personal Communication about the levels of SOC, VOC and IOC in the Shakopee Mdewakanton Sioux Community wells. United States Environmental Protection Agency. Seaberg, S.K., 2000, Metropolitan Area Groundwater Model Project Summary: Overview of the Twin Cities Metropolitan Groundwater Model, Version Minnesota Pollution Control Agency. Shakopee Mdewakanton Sioux Community, 2006, Quality Assurance Project Plan for Water Quality and Quantity Study, 81 p. Shaw, S.P., and C.G. Fredine, 1956, Wetlands of the United States, Their Extent, and Their Value for Waterfowl and Other Wildlife, U.S. Department of the Interior, Fish and Wildlife Service, Circular 39, Washington, D.C., 67p. Smith, R.L., 1980 (after Shaw & Fredine 1956), Ecology and Field Biology, 3rd ed., Harper and Row, New York, 835p. Tipping, R., G., 2006, Subsurface Recharge and Surface Infiltration, Minnesota Geological Survey, County Atlas Series, Atlas C-17, Plate 6 U.S. Geological Survey, 1992, Groundwater Atlas of the United States - Segment 9 (or Hydrologic Investigations Atlas 730-J), Reston, VA. 51
64 U.S. Soil Conservation Service, 1959, Scott County Soil Survey, United States Department of Agriculture. Winterstein, T.A., 2005, Hydraulic Properties of the Ironton and Galesville Sandstones, Shakopee Mdewakanton Sioux Community, Southeaster Minnesota, United States Geological Survey Scientific Investigations Report Wuolo, Ray W. (Barr Engineering Co.), 2004, GMS 4.0/MODFLOW Groundwater Flow Model of the Shakopee Mdewakanton Sioux Community, Prepared for the Shakopee Mdewakanton Sioux Community, August 2004, 92 p. 52
65 Tables 53

66 Table 1. Generalized regional SMSC hydrostratigraphic column 54
67 MUW # Sample Date Temp (C) Estimated Recharge Elv. (ft asl) [CFC-12] (pmol.kg) Modeled CFC-12 Recharge Date Notes /9/ Slight contamination with CFC-11? /9/ Very old water /9/ Recharged before /9/ Slight contamination with CFC-11? /9/ Very old water /9/ Recharged in the 1950 s or earlier /8/ Early 1940's or older water with some CFC- 11 contamination /8/ Early 1940's or older water /8/ Early 1940's or older water Table 2. Community groundwater age, based on USGS CFC-12 analysis. 55
68 Mean Annual Parameter Value Total Phosphorus (mg/l) Orthophosphate (mg/l) Mystic Lake Arctic Lake Bluffview Pond Petsch Pond (thru 2004) Wetland C1L Wetland S1a NO 2 + NO 3 (mg/l) Chlorophyll A (mg/l) Total Kjeldahl Nitrogen (mg/l) Ammonia (mg/l) Total Suspended Solids (mg/l) Temperature (C ) ph Specific Conductivity (μs/cm) Total Dissolved Solids (g/l) Dissolved Oxygen (mg/l) Redox (mv) Table 3. Mean annual lake, pond and wetland water chemistry This data is for selected water bodies in the Community bsed on data collected between 1999 and
69 Discharge Stream 1 Stream 2 Stream 3 Stream 4 Stream 5 Lucky 7 Min (m 3 /sec) Mean (m 3 /sec) Max (m 3 /sec) Table 4. Maximum, mean and minimum discharge Based on data collected from 1999 to 2006 for streams located in the Community. Lucky 7 Stream data from June 2004 to December Mean Chemistry Value Stream 1 Stream 2 Stream 3 Stream 4 Stream 5 Lucky 7 Total Phosphorus (mg/l) NA Orthophosphate (mg/l) NA NO 2 + NO 3 (mg/l) NA Chlorophyll A (mg/l) NA Total Kjeldahl Nitrogen (mg/l) NA Ammonia (mg/l) NA Total Suspended Solids (mg/l) NA Temperature (C ) ph Specific Conductivity (μs/cm) Total Dissolved Solids (g/l) Dissolved Oxygen (mg/l) Redox (mv) Table 5. Mean water chemistry values Based on data collected from 1999 to 2005 for streams located in the Community. Lucky 7 Stream data from May 2005 to September
70 Year McKenna Jordan (MUW #554090) Sioux Trail Jordan (MUW #525938) Sioux Trail IG (MUW #253021) ,258,780 35,230,306 Not online ,960,600 48,858,251 Not online ,651,400 67,956,936 Not online ,669,005 85,615,999 Not online ,948,400 95,302,700 Not online ,873,200 14,385,454 92,718, ,534,400 3,032, ,967, ,943,600 48,736,309 84,335, ,048,800 35,472,923 90,049, ,929,500 51,828,000 92,737, ,192,000 79,176,000 27,246, ,099,000 55,288,000 79,640, ,663,700 13,046, ,596, ,636,233 76,474,000 68,992, ,646, ,304,000 8,663,000 Table 6. Volume of water pumped (gallons) from Community public water supply wells Layer Number of K H Zones in Layer Range of K H in Layer 1 NA NA to 41.8 m/day to m/day to m/day and 5 m/day and 5 m/day Table 7. Hydraulic conductivity zones (K h ) The number and range in values of horizontal hydraulic conductivity (K H ) zones in the SMSC numerical groundwater flow model (Wuolo 2004). Layer Number of Leakance Zones in Range of Leakance in Layer Layer 1 NA NA to x 10-6 /day to 7003 x 10-6 /day and 17 x 10-6 /day and 17 x 10-6 /day 6 NA NA Table 8. Groundwater model leakance zones The number and range in values of leakance zones in the SMSC numerical groundwater flow model (Wuolo 2004). 58
71 Model Package Package Assumptions Surface Water Feature Constant Head The water level elevation in the aquifer is user-defined at specific locations. Appropriate at locations where the piezometric elevation is well known, or is known to be relatively constant through time. Credit River - lower reach River Drain The water elevation (stage) in the river feature is user-defined and assumed to never run dry. A river feature transmits water to the aquifer at a rate determined by the hydraulic head difference between river stage elevation and piezometric elevation in the aquifer adjacent to the river. A stage elevation for the drain feature is calculated by the model, based on the modeled piezometric elevation surface. If the piezometric surface drops below the drain feature, the drain will go dry. Credit River - upper reach Deans Lake Flood Plain Lakes Minnesota River Prior Lake Eagle Creek Former Shiely Quarry Kraemer Quarry Table 9. MODFLOW packages used MODFLOW packages used in the SMSC numerical groundwater flow model (Wuolo 2004). Community Well ID Year of Max Pumping from 2001 to 2011 Steady State Pumping Rate for Modeled 10-Year TOT Delineation McKenna Jordan m 3 /d (77 gpm) Sioux Trail Jordan m 3 /d (172 gpm) Sioux Trail IG ,439 m 3 /d (264 gpm) Table 10. Model pumping rates Steady-state pumping rates used to delineate ten-year time of travel zones in the SMSC numerical groundwater flow model. 59
72 Aquifer Porosity Value Data Source Prairie du Chien Group Norvitch and others, 1973 Limestone Freeze and Cherry, McWhorter and Sunada, Fetter, Todd, 1959 Jordan Sandstone Norvitch and others, 1973 Sandstone Freeze and Cherry, McWhorter and Sunada, Fetter, Todd, 1959 Table 11. Published range in bedrock aquifer porosity values. Community Well ID McKenna Jordan Sioux Trail Jordan Volume pumped out of aquifer in 10 years at rates used to delineate TOT zones 1,543,950 m 3 (407,868,400 gal) 3,423,700 m 3 (905,238,400 gal) Aquifer thickness (L) 32 m (106 ft) 29 m (94 ft) Estimated Aquifer Porosity (%)* 3% (min) 49% (max) 25.8% (optimal) 3% (min) 49% (max) 29.7% (optimal) Calculated, tenyear, fixed radius for each well (R) 715 m (2,347 ft) m (580 ft) 244 m (800 ft) 1,119 m (3,6721 ft) 277 m (909 ft) 356 m (116 ft) Table 12. Ten-year calculated fixed radius for SMSC PWS wells,using MDH delineation recommendations (MDH 2005). *Three estimates of aquifer porosity were used to evaluate the validity of using the porous media numerical groundwater flow model to delineate capture zones for wells in aquifers affected by karst development. Minimum and maximum porosity estimates were used to identify the likely range in well capture zone size. The porosity estimates defined as optimal result in less than 1% difference between the volume of water projected to be pumped from the Prairie du Chien and Jordan aquifers over a ten year period (based on the maximum pumping rate between 2001 and 2011) and the volume of water contained by the aquifers within the 10-year TOT zone delineated by the groundwater flow model. 60
73 Community Well ID McKenna Jordan. Sioux Trail Jordan Area of the modeled 10- year TOT zone 186,749 m 2 (46 acres) 396,095m 2 (98 acres) Aquifer thickness (L) 32 m (106 ft) 29 m (94 ft) Estimated Aquifer Porosity (%) 3% (min) 49% (max) 25.8% (optimal) 3% (min) 49% (max) 29.7% (optimal) Volume of water contained within model-delineated 10- year TOT (Q) 179,279 m 3 (47,360,500 gal) 2,928,224 m 3 (773,554,900 gal) 1,541,780 m 3 (407,295,200 gal) 344,602 m 3 (91,034,220 gal) 5,628,505 m 3 (1,486,894,000 gal) 3,411,563 m 3 (901,239,600 gal) Table 13. Delineation technique comparisons Comparison of numerical groundwater flow model delineation results and MDH Technique 4 delineation results. WELL VULNERABILITY DWSMA VULNERABILITY Well ID Rating Justification Rating Justification McKenna Wellfield: MUW # Non-Vulnerable Lack of potential contaminant sources Moderate Water >40 years old Sioux Trail Wellfield: MUW # Non-Vulnerable Presence of confining layer Moderate Water >40 years old MUW # Non-Vulnerable Presence of multiple protective confining layers Low Presence of confining layers; water >40 years old Table 14. Summary of Community well and DWSMA vulnerability determinations. 61
74 McKenna Wellfield MUW # (Jordan aquifer) MUW # (Jordan aquifer) Sioux Trail Wellfield MUW # (Ironton-Galesville aquifer) Points Description Points Description Points Description DNR Vulnerability Rating 25 L score: 0 15 L score: 5 0 L score: 15 Casing Integrity 0 Properly Installed 0 Properly Installed 0 Properly Installed Casing Depth Pumping Rate 5 78 gpm: projected 2011 average annual rate gpm: projected 2011 average annual rate gpm: projected 2011 average annual rate Isolation Distance from contaminant source 0 No sources 10 sanitary sewer 20 Sanitary and storm sewer Chemical and isotopic information 0 CFC-12: < CFC-12: < CFC-12: <1945 Total Score Assessment Non-vulnerable Non-vulnerable Non-vulnerable If the score is 45 or more, the well is considered vulnerable. If the score is between 5 and 40, priority for phasing into the state s WHP program is referenced to population served. If the score is 40 or less, the well is considered not vulnerable. Table 15. Community PWS well vulnerability assessment summary. 62
75 Table 16. Actual and potential contaminant sources within the Sioux Trail DWSMA. Parcel ID Site Name Address Potential Source Priority Information Source Shakopee Dakota Convenience Store Mystic Lake Drive NW Prior Lake MN Underground Storage Tank (4), Gasoline Service High SMSC Potential Contaminant Shakopee Dakota Convenience Store Car Wash Shakopee Mdewakanton Sioux Community Shakopee Mdewakanton Emergency Services 2515 Dakota Trail NW Prior Lake MN Flandreau Trail NW Prior Lake MN Flandreau Trail Prior Lake MN Station Registered Storage Tank FIG Monitoring Well Chemical Storage Facility; Heavy Equipment Storage High High High Survey SPUC WHP CWI SMSC Potential Contaminant Survey Meadows at Mystic lake Howard Lake Rd NW Prior Lake MN Fertilizer & Pesticide application Low SMSC Potential Contaminant Survey Little Six Casino Land Department Cindy Stade- Lieske Amy Stade Nathan Crooks Tracy Stade 2330 Sioux Trail Prior Lake, MN Sioux Trail 2211 Sioux Trail 2301 Sioux Trail Mystic Lake Blvd Aboveground Storage Tanks, Chemical Storage, Emergency Generator, Private and Public Wells High SPUC Wellhead Protection Plan, SMSC Potential Contaminant Survey, EPA Envirofacts Database, CWI, SMSC Records Alicia Crooks 2390 Sioux Trail Cherie Crooks- Bathel 2370 Sioux Trail Danny Crooks Mystic Lake Blvd Mystic Lake Casino Hotel Laundry Department and WRF th Street NW Prior Lake MN Chemical Storage Facility, Permitted Discharges to Water High SMSC Potential Contaminant Survey; EPA Envirofacts Database 63
76 Parcel ID Site Name Address Potential Source Priority Information Source Meadows at Mystic Lake, Dakotah Meadows RV Park, Mystic Lake Casino Hotel, Playworks Howard Lake Rd NW Shakopee MN Fertilizer & Pesticide application, Golf Course, AST, Chemical Storage Facility, Heavy Equipment Storage, unsealed well, Gasoline Service Station, Hazardous Waste Site (RV pump), Underground Storage Tank, Aboveground Storage Tanks, Hazardous Waste Handler, Golf Course High SMSC Potential Contaminant Survey Little Six Casino 2330 Sioux Trail NW Prior Lake MN Mystic Lake 2330 Sioux Trail NW Casino Hotel Prior Lake MN Closed dump, AST Moderate SMSC Land dept records Aboveground Moderate SMSC Storage Tanks, Air Potential Releases Reported Contaminant Survey, EPA Envirofacts Database Shakopee Mdewakanton Sioux Community NA Shakopee Mdewakanton Sioux Community 3200 Dakota Parkway Prior Lake MN Sioux Trail NW Prior Lake MN Well & 1 Uncertain Well Low CWI, SMSC Records Cemetary Low SMSC Potential Contaminant Survey NA ST DWSMA throughout Municipal sewage line Low SMSC Land dept records NA ST DWSMA 3 Stormwater basins Low SMSC Land dept records NA ST DWSMA throughout Wetlands Low SMSC Land dept records 64
77 Table 17. Actual and potential contaminant sources within the McKenna DWSMA. Parcel ID Site Name Address Potential Source Priority Information Source Shakopee Mdewakanton Sioux Community SMSC NORTH RESIDENTIAL Lot-O-L Block-00A Prior Lake MN Observation Well (MUW #253020) High MN CWI Richard & Dolores McKenna N Berens Rd. NW Prior Lake MN Gravel Mining Permit Richard Palla McKenna Road UST, IWS: MUW # Craig & Wanda 3834 N Berens Rd NW Gravel Mining Ahlman Prior Lake MN Permit, Well Shakopee Sumac Lane Chemical Storage Mdewakanton Prior Lake MN (new pumphouse), Sioux Emergency Community generator near well NA Dick McKenna McKenna DWSMA 3736 N Berens Rd. NW Prior Lake MN McKenna Road McKenna Road Individual water supply wells Underground storage tank Septic System Municipal Sewage Line Ag field, potential chemicals Moderate High Moderate High Moderate High High Low Low SMSC Land dept records SMSC Land dept records SMSC Potential Contaminant Survey, SMSC Land dept records SMSC Land dept records SMSC Land dept records NA McKenna DWSMA McKenna Road Ephemeral Stream Low SMSC Land dept records 65
78 DWSMA Land Use Jurisdiction Land Use By Percentage within DWSMA (2000) Land Use By Percentage Within DWSMA (2020) Percentage Change McKenna Agricultural Prior Lake 36.2% 0.0% -36.2% Wetland Minnesota 27.7% 0.0% -27.7% Urban low/medium Prior Lake 19.1% 34.6% +15.5% density residential Institutional SMSC 10.6% 10.6% 0.0% Natural Prior Lake 6.4% 0.0% -6.4% Urban high density residential Prior Lake 0% 54.8% +54.8% Sioux Trail Grassland Prior Lake/SMSC 24.6% 2.8% -21.8% Commercial Prior Lake/SMSC 23.4% 61.2% Wetland Prior Lake/SMSC 18.7% 15.7% -3.0% Agricultural Prior Lake/SMSC 13.5% 0.0% -13.5% Forest Prior Lake/SMSC 8.0% 6.3% -1.7% Institutional SMSC 5.1% 5.1% 0% proposed parkway Urban low/medium density residential 2.1% +2.1% SMSC 6.7% 6.7% 0% Table 18. Land use projections within the DWSMAs Use Type 2006 Water Demand (gal/yr) Water Demand Change from 2000 (%) Car Washes Commercial 2,447,500-12% Casinos Commercial 39,485,870-32% Church Social 8,500 na Community Center Social/Government 624,820 19% Fire Station Government 139,500 na Hotel Commercial 28,560,000 68% Public Works Govenment 925, % Restaurants Commercial 14,491, % Retail Commercial 549,120-15% RV Park Commercial 525,100-26% Service Providers Social 10,070,400 22% Table 19. Water use and change by category 66
79 McKenna Well Sioux Trail Jordan Well Franconia-Ironton Galesville Well Supply Source Jordan Aquifer Jordan Aquifer Franconia-Ironton-Galesville Aquifer Casing Depth (ft.) Open Hole Depth (ft.) Well Diameter (in.) 20 24in. to in. to in. to in. to in. to 570 Open Hole Diameter (in.) UTM North m m m UTM East m m m Well Capacity (gpm) Well Production (gpm) Table 20. Public water supply characteristics Maximum daily use (gpd) Minimum daily use (gpd) Sioux Trail System 746,097 (July) 240,777 (December) McKenna Well 72,861 (July) 11,939 (February) Table 21. Maximum and Minimum Daily Water Use (2006) 67
80 Water Consumer/Uses Priority Community Members 1 Government Center 2 Mystic Lake Casino 3 Playworks 4 Little Six Casino 5 Mystic Lake Casino Hotel 1 6 Mystic Lake Casino Hotel 2 7 DDC 8 SMSC Gaming Enterprise 9 Convenience Store 10 Dakota Sport and Fitness 11 Public Works Building 12 SDCS Mall Tenants 13 RV Park 14 SMSC/LSI Watering/Irrigation 15 Car Washes 16 Residential Lawn Watering 17 Table 22. Water supply priorities Primary Contact 24 Hour Phone Number Mineral Services Plus Danny Nubbe Mobile: (612) , Home: (763) Nick Shultz Mobile: (612) , Home: (952) Secondary Contact Scott County Dispatch (952) City of Prior Lake HOT LINE: (952) Steve Albrect, Public Works (952) City of Savage HOT LINE: (952) Terry Thene, Utilities (612) City of Shakopee HOT LINE: (952) Bruce Loney (952) John Crooks (952) Table 23. Emergency Water Supply Contacts 68
81 Description Owner Telephone Location Well repair Mineral Services/ Danny Nubbe Cologne, MN Pump repair Mineral Services/ Danny Nubbe Cologne, MN Electrician Ries Electric St. Paul, MN Backhoe SMSC Public Works Prior Lake, MN Chemical feed Hawkins Chemical/ SMSC Public Works Minneapolis, MN Meter repair Mineral Services/ Danny Nubbe Cologne, MN Generator Ziegler Shakopee, MN Valves Mineral Services/ Danny Nubbe Cologne, MN Pipe and fittings Mineral Services/ Danny Nubbe Cologne, MN Table 24. Emergency Equipment and Suppliers System Personnel Name Cell Phone Work Telephone Tribal Administrator Bill Rudnicki Public Works Admin Jeremy Gosewisch Land Manager Stan Ellison Gaming Enterprise Paul Clendening Health Administrator James Lien Table 25. Lead Coordinating Agency - SMSC Staff System Personnel Name Cell Phone Work Telephone Tribal Administrator Bill Rudnicki Public Works Administrator Jeremy Gosewich Land Manager Stan Ellison Public Works Asst. Manager Kurt Ehresman Reclamation Supervisor Ron Quade Table 26. Incident Assessment Team 69
82 Figures 70

83 Figure 1: Land use and Property Boundaries 71

84 Figure 2. Public Utilities. 72
85 Mean Monthly Precipitation and Temperature Jordan, MN ( ) 5 80 Precipitation (in) Temperature (F) 0 0 January February March April May June July August September October November December Month Mean Monthly Precipitation Mean Monthly Temperature Figure 3. Mean monthly precipitation and temperature, Jordan, Minnesota,

86 Figure 4. Regional bedrock geology 74

87 Figure 5. Hydrogeologic cross-sections (see figure 4 for locations). From Runkel et al

88 Figure 6. Local bedrock hydrogeology

89 Figure 7. Soil data 77

90 Figure 8. Surface water resources 78
 Values after 2008 are projected. Figure 10.")
91 Millions of Gallons Year Total SMSC Pumping (Gallons) Sioux Trail Metered Non-Residential Water Use (Gallons) Estimated Sioux Trail Residential Water Use Estimated McKenna Residential Water Use Figure 9. Historical and projected Community annual water use (gallons/year) Values after 2008 are projected. Figure 10. Conceptual groundwater flow model for the SMSC water supply (Wuolo 2004). 79

92 Figure 11. Drinking water supply management areas. 80

93 Figure 12. MGS estimated bedrock surface recharge rates 81

94 Figure 13. Potential contaminant sources 82

95 Figure 14. Potential contaminant sources - wells and generators 83

96 Figure 15. Community land use 84
97 GLOSSARY A Anisotropy - The condition under which one of more of the hydraulic properties of an aquifer vary according to the direction of flow. Aquifer - A subterranean layer of porous material (such as rock, gravel or sand) containing water which may be withdrawn from wells for human use. Aquifer Recharge Zone - Region in which water from rain or snow percolates (sinks) into an aquifer, replenishing the supply of groundwater. Aquitard - A low permeability unit that can store groundwater and also transmit it slowly from one aquifer to another. Aquifuge - An absolutely impermeable unit that neither stores nor transmits water. Artificial Recharge Well - A well that is used to recharge depleted aquifers and may inject fluids from a variety of sources such as lakes, streams, domestic wastewater treatment plants, other aquifers, etc. C Casing - A pipe or cubing placed in a well or boring to: A) prevent the walls from caving; B) seal off surface drainage; or C) prevent gas, water, or other fluids from entering the well. Confining Layer/Unit - A rock unit having a very low hydraulic conductivity that restricts the movement of groundwater either into or out of adjacent aquifers. Class V Injection Well - This is a well classification used by the United States Environmental Protection Agency. A Class V Injection Well includes drainage wells, geothermal re-injection wells, domestic wastewater disposal wells, mineral and fossil fuel recovery related wells, industrial/commercial/utility disposal wells, recharge wells, and miscellaneous wells (which includes abandoned drinking water wells). Community Water Supply System - A public water system that pipes water for human consumption to at least 15 service connections used by year-round residents, or one that regularly serves at least 25 year-round residents. Examples include municipalities, housing subdivisions, apartment buildings, mobile home parks, hospitals, and correctional facilities. Contamination - The presence or addition of any substance to water which is or may become injurious to the health, safety, or welfare of the general public or private individuals using the well; and which is or may become injurious to domestic, commercial, industrial, agricultural, or other uses which are being made of such water. D Delineation - The process used to determine the Well Head Protection Area boundaries. Discharge - The volume of water flowing in a stream or through an aquifer past a specific point in a given period of time. Dissolution channels - Water moving through a rock (such as limestone) may dissolve some of the rock, leaving void spaces or dissolution channels. This is an example of a secondary opening. Drinking Water Supply Management Area (DWSMA) - The area around the drinking water supply well that will be managed. This area contains the entire WHPA. The boundaries are determined using identifiable landmarks, such as roads and property boundaries. 85
98 E Ephemeral Stream - A stream that runs for very short periods of time, on the order of a day. Evapotranspiration - The sum of evaporation (the process by which water passes from the liquid to the vapor state) and transpiration (the process by which plants give off water vapor through their leaves). F Filter strip - An area between a water body and human land use is left in permanent vegetation, in order to filter pollutants out of runoff and prevent erosion. Fluvial - Related to streams or rivers. G Geologic/Bedrock Sensitivity - Refers to the intrinsic ability of earth materials to protect a well or well field from contaminant sources. The DNR defines geologic sensitivity as being proportional to the time required for water to move vertically from the land surface to an aquifer. Shorter travel times mean the geologic sensitivity is greater; whereas, longer times indicate a lower sensitivity. Greenway - Same as Filter Strip. Groundwater - The water contained below the surface of the earth in the saturated zone including - without limitation - all water, whether under confined, unconfined, or perched conditions, in near-surface unconsolidated sediment or regolith, or in rock formations deeper underground. H Hydraulic Conductivity - Depends on the size and arrangement of the water-transmitting openings (pores). The volume of water that will move in a unit of time under a unit hydraulic gradient through a unit area. A coefficient of proportionality describing the rate at which water can move through a permeable medium. The density and kinematic viscosity of the water must be considered in determining hydraulic conductivity. Hydraulic Head - The sum of the elevation head, the pressure head, and the velocity head at a given point in an aquifer. Hydraulic Gradient - The slope of the water table or potentiometric surface. Hydrostratigraphic Units - A geologic unit that can be defined as either an aquifer or aquitard. I Impermeable - Being unable to transmit water through a material. Infiltration - The flow of water downward from the land surface into and through the upper soil layers. Intermittent Stream - A stream which does not run all year long. L Local Unit of Government - A statutory or home rule charter city, town, county, soil and water conservation district, watershed district, organization formed for the joint exercise of powers under Minnesota Statutes, section , local health board, or other special purpose district of authority with local jurisdiction in water and related land resources management. Layer 4 - This is a component of the conceptual model used to map groundwater movement in the Fraconia- Ironton-Galesville aquifer. Layer 4 refers to the Fraconia-Ironton-Galesville aquifer, which is separated from the Jordan Sandstone above by the St. Lawrence Formation. 86
99 Leaky Layer This is a component of the conceptual model used to map groundwater movement in the Fraconia-Ironton-Galesville aquifer. Leaky Layer 3-4 refers to the St. Lawrence Formation, a regional confining layer that generally allows only negligible leakage to lower aquifers. M Metro Model - This is the short form for the Twin Cities Metropolitan Groundwater Model. It is a computer model that simulates regional groundwater flow in the seven-county Twin Cities metropolitan area. It was developed by the staff from the MPCA. It is based on the analytic element method and simulates multi-aquifer groundwater flow. P Pathogens - Disease-producing organisms. Perennial stream - A stream which holds water throughout the year. Permeability - A measure of how easily water can flow through material (such as through an aquifer). Potentiometric surface - The water level in tightly cased wells open to a confined aquifer stands at the level of the potentiometric surface of the aquifer. Porosity - The ratio of void space to the total volume of a soil or rock. This measurement tells us how much water a rock can contain when it is saturated. Public Water Supply Well (PWS) - A public water supply well provides drinking water for human use to 15 or more service connections OR to 25 or more persons for at least 60 days a year. A public water supply well is further defined as either a Community or noncommunity water supply well. Pumping Discharge Rate - The volume of water discharged by a well per unit of time. R Recharge area - An area in which there are downward components of hydraulic head in an aquifer. Infiltration moves downward into the deeper parts of an aquifer in a recharge area. Rock outcrop/subcrop - An exposed section of bedrock. S Storativity - The volume of water an aquifer releases from or takes into storage per unit surface area of the aquifer per unit change in head. It is equal to the product of specific storage and aquifer thickness. In an unconfined aquifer, the storativity is equivalent to the specific yield. Also called storage coefficient. Stormwater Management Structures - These are structures put in place to mitigate the impacts of storm runoff. Strata - A single layer of sedimentary rock, generally consisting of one kind of matter representing continuous deposition. Subsurface geochemistry - Chemistry of the soils and bedrock beneath the land surface. T Ten Year Time-Of-Travel Zone - An area within which groundwater will move through a portion of an aquifer and the overlying geologic materials and into a well in less than 10 years. Topographic relief - The difference in elevation between the highest and lowest points of a geographic area. 87
100 Transmissivity - The rate at which water of a prevailing density and viscosity is transmitted through a unit width of an aquifer or confining bed under a unit hydraulic gradient. It is a function of properties of the liquid, the porous media, and the thickness of the porous media. V Vegetated swale - When runoff channels on slopes are planted in permanent vegetation to reduce gully erosion. Vulnerability - Refers to the susceptibility of a water supply to contamination from activities at the land surface. W Water Table - The level in the saturated zone at which the hydraulic pressure is equal to atmospheric pressure and is represented by the water level in unused wells. Wellhead Protection Area (WHPA) - The area where water supplying a public well comes from. Can also be thought of as the recharge area to the public well. Ultimately the area to be managed by the WHP plan. These boundaries are scientifically calculated. List of Acronyms Used in this Report: BMP Best Management Practice CWS - Community Water Supply DWSMA - Drinking Water Supply Management Area EPA - Environmental Protection Agency FIG - Fraconia-Ironton-Galesville MCL - Maximum Contaminate Level MDH - Minnesota Department of Health MPCA -Minnesota Pollution Control Agency MRDL - Maximum Recommended Daily Limit MLAEM -Multi-Layer Analytic Element Model MNDNR - Minnesota Department of Natural Resources COMMUNITY - Shakopee Mdewakanton Sioux Community PDJ - Prairie du Chien-Jordan ppm - parts per million PWS - Public Water Supply IWS - Individual Water Supply USGS - United States Geological Survey VARELSs - Variable Strength Areal Elements VOC - Volatile Organic Compound WHP - Wellhead Protection Plan WHPA - Wellhead Protection Area 88
101 APPENDICES 89
102 APPENDIX A: SMSC WELL AND BOREHOLE LOGS
103
104
105
106
107
108
109
110
111
112
113
114
115
116
117
118
119 APPENDIX B: COMMUNITY GEOPHYSICAL LOGS
120
121
122
123
124
125 APPENDIX C: WELL MAINTENANCE RECORDS
126
127
128 APPENDIX D: PUBLIC WATER SUPPLY WELL CHEMISTRY 78
129 Analytical method Units EPA MCL (MCGL) I/G Well McKenna Treatment Plant Sioux Trail Treatment Plant McKenna Treatment Plant Sioux Trail Treatment Plant Sioux Trail Treatment Plant McKenna Treatment Plant McKenna Treatment Plant Sioux Trail Treatment Plant PDC/J (Golf) Well 1,1-Dichloroethane μg/l 5.0 ND ND 1,1,1,2-Tetrachloroethane μg/l ND ND 1,1,2,2-Tetrachloroethane μg/l ND ND 1,2,3-Trichlorobenzene μg/l ND ND 1,2,4-Trichlorobenzene μg/l ND ND 1,1,1-Trichloroethane μg/l 3.0 ND ND 1,1,2-Trichloroethane μg/l 5.0 ND ND 1,2,3-Trichloropropane μg/l ND ND 1,1,2- Trichloroflouroethane μg/l ND ND 1,2,4-Trimethylbenzene μg/l 70.0 ND ND 1,3,5-Trimethylbenzene μg/l ND ND 1,2-Dichloroethane μg/l ND ND 1,1-Dichloroethene μg/l ND ND 1,2-Dibromo-3- chloropropane (DBCP) μg/l 0.2 ND ND 1,2-Dibromoethane (EDB) μg/l ND ND 1,2-Dichlorobenzene μg/l ND ND 1,3-Dichlorobenzene μg/l ND ND 1,4-Dichlorobenzene μg/l ND ND 1,2-Dichloropropane μg/l ND ND 1,3-Dichloropropane μg/l ND ND 2,2-Dichloropropane μg/l ND ND 1,1-Dichloropropene μg/l ND ND 2-Chlorotoluene μg/l ND ND 2,4-D μg/l 70.0 ND ND 2,4-DB μg/l ND ND 2,4,5-T μg/l ND ND 2,4,5-TP (Silvex) μg/l 50.0 ND ND 3,5-Dichlorobenzoic Acid μg/l ND ND 4-Chlorotoluene μg/l ND ND 4-Nitrophenol μg/l ND ND Acetone μg/l ND ND Aciflurofen μg/l ND ND Allyl chloride μg/l ND ND Ammonia as N mg/l 0.28 Antimony μg/l 6.0 ND ND Arsenic mg/l ND ND Barium mg/l Bentazon μg/l ND ND Benzene μg/l ND ND 79
130 Analytical method Units EPA MCL (MCGL) I/G Well McKenna Treatment Plant Sioux Trail Treatment Plant McKenna Treatment Plant Sioux Trail Treatment Plant Sioux Trail Treatment Plant McKenna Treatment Plant McKenna Treatment Plant Sioux Trail Treatment Plant PDC/J (Golf) Well Bentazon μg/l ND ND Benzene μg/l ND ND Beryllium mg/l ND ND Bicarbonate Alkalinity mg/l 340 Boron mg/l 0.14 Bromobenzene μg/l ND ND Bromochloromethane μg/l ND ND Bromodichloromethane μg/l (0.0) ND Bromoform μg/l (0.0) ND ND ND ND Bromomethane μg/l ND ND Cadmium mg/l ND ND Calcium mg/l Carbonate Alkalinity mg/l ND Carbon tetrachloride μg/l 5.0L ND ND Chloramben μg/l ND ND Chlorobenzene μg/l ND ND Chloride mg/l ND Chlorodibromomethane μg/l ND ND 1.1 ND Chloromethane μg/l ND ND Chloroform μg/l Chlorophyll A mg/l 2.0 Chromium μg/l ND ND cis-1,2-dichloroethene μg/l ND ND cis-1,3-dichloropropene μg/l ND ND Cynide, Free μg/l ND ND Dibromoacetic Acid μg/l ND ND Dibromomethane μg/l ND ND Dicamba μg/l ND ND Dichloroacetic Acid μg/l (0.0) ND 1.8 Dichlorodiflouromethane μg/l ND ND Dichloroflouromethane μg/l ND ND Dichlorprop μg/l ND ND Dinoseb μg/l 7.0 ND ND Ethylbenzene μg/l ND ND Ethyl ether μg/l ND ND Fluoride mg/l Glyphosate μg/l ND ND Gross Alpha pci/l ± Gross Beta pci/l ± Hardness, Total mg/l 420
131 Analytical method Units EPA MCL (MCGL) I/G Well McKenna Treatment Plant Sioux Trail Treatment Plant McKenna Treatment Plant Sioux Trail Treatment Plant Sioux Trail Treatment Plant McKenna Treatment Plant McKenna Treatment Plant Sioux Trail Treatment Plant PDC/J (Golf) Well Hexachlorobutadiene μg/l ND ND Iron mg/l Isopropyltoluene μg/l ND ND Lead mg/l Magnesium mg/l Manganese mg/l MCPA μg/l ND ND MCPP μg/l ND ND Mercury μg/l 2.0 ND ND Methylene Chloride μg/l ND ND Methyl ethyl ketone (MEK) μg/l ND ND Methyl isobutyl ketone (MTBK) μg/l ND ND Methyl tertiary butyl ether (MTBE) μg/l ND ND Monobromoacetic Acid μg/l ND ND Monochloroacetic Acid μg/l ND ND Napthalene μg/l ND ND n-butylbenzene μg/l ND ND Nickel μg/l ND ND Nitrate mg/l Nitrate+Nitrite mg/l ND ND n-propylbenzene μg/l ND ND Orthophosphate as P mg/l Pentachlorophenol (PCP) μg/l 1.0 ND ND o-xylene μg/l 0.2 ND Picloram μg/l ND ND Phosphorus, Total as P mg/l p-isopropyltoluene μg/l ND ND p&m-xylene μg/l 0.3 ND Potassium mg/l 3.00 Potassium mg/l 4.1 Radium-226 PCi/L Radium-228 PCi/L sec-butylbenzene μg/l ND ND Selenium μg/l 50.0 ND ND Silver mg/l Sodium mg/l Styrene μg/l ND ND Sulfate mg/l Tetrachloroethene μg/l ND ND Tetrahydrofuran (THF) μg/l ND ND
132 Analytical method Units EPA MCL (MCGL) I/G Well McKenna Treatment Plant Sioux Trail Treatment Plant McKenna Treatment Plant Sioux Trail Treatment Plant Sioux Trail Treatment Plant McKenna Treatment Plant McKenna Treatment Plant Sioux Trail Treatment Plant PDC/J (Golf) Well tert-butylbenzene μg/l ND ND Thallium μg/l 0.5 ND ND Total Alkalinity mg/l 340 Total Dissolved Solids mg/l Total Kjeldahl N mg/l ND Total Suspended Solids mg/l ND Total Trihalomethanes μg/l Toluene μg/l ND ND trans-1,2-dichloroethene μg/l ND ND trans-1,3- Dichloropropene μg/l ND ND Trichloroacetic Acid μg/l (300.0 ) Trichlorethene (TCE) μg/l ND ND 0.6 ND Trichloroflouromethane μg/l ND ND 0.5- Turbidity NTU Vinyl chloride μg/l 2.0 ND ND Zinc mg/l ND = Non-Detect
133 APPENDIX E: ORIGINAL SMSC WHPP (Enclosed CD)
134 APPENDIX F: VULNERABILITY WORKSHEETS
135 Vulnerability Assessment Worksheet Well Name/No. Sioux Trail Ironton-Galesville aquifer Well Public Water Supplier ID No Minnesota Unique Well No DNR vulnerability rating assign the following point values: Very High Vulnerable High Vulnerable Moderate 25 points Low ( L score of 1 o 3) 20 points Low ( L score of 4 to 7) 15 points Very Low ( L score of 8 to 11) 10 points Very Low ( L score of 12 or greater) (~120 to 150 ft of protective geologic units) 5 points TOTAL POINTS 5 points 2. Casing integrity assign the following point values: Each breach of the casing 20 points Each casing string not grouted or extending to the land surface 10 points Each category for which information requested is unknown 5 points Each string of properly installed casing 0 points TOTAL POINTS 0 points 3. Casing depth assign the following point values: <50 feet 20 points 50 to 200 feet 10 points 201 to 500 feet 5 points >500 feet (570 ft) 0 points TOTAL POINTS 0 points 4. Pumping rate assign the following point values: >1000 gallons/minute 20 points 501 to 1000 gallons/minute (max annual pumping rate is in this range) 10 points 50 to 500 gallons/minute (average annual pumping rate is in this range) 5 points <50 gallons/minute 0 points TOTAL POINTS 5-10 points
136 5. Isolation distance from contaminant source For wells <50 feet deep, assign 10 points to each source located within 100 feet of the well For wells >50 feet deep, assign 10 points to each source located within 50 feet of the well TOTAL POINTS 6. Chemical and isotopic information: Volatile Organic Compounds Detection (o,m mxylene detected at pump house on 7/03) Synthetic Organic Compounds Detection Nitrate-Nitrogen Results 10 points 10 points Vulnerable Vulnerable >10 parts/million Vulnerable >3 but 10 parts/million 30 points 1 to 3 parts/million 10 points <1 parts/million Tritium Results >1 TU Vulnerable <1 TU 0 points 14 Carbon Results For wells in which the 14 carbon content of the water indicates an age approximation of at least several centuries, subtract 20 points from the score. TOTAL POINTS 7. Grand total score: 1. DNR Vulnerability Rating 5 2. Casing Integrity 0 3. Casing Depth 0 0 points 4. Pumping Rate Isolation Distance from Contaminant Sources Chemical and Isotopic Information 0 GRAND TOTAL If the score is 45 or more, the well is considered vulnerable. If the score is between 5 and 40, priority for phasing into the state s WHP program is referenced to population served. If the score is 0 or less, the well is considered not vulnerable. Moderately Vulnerable
137 Vulnerability Assessment Worksheet Well Name/No. Sioux Trail Jordan aquifer Well (Well #4) Public Water Supplier ID No Minnesota Unique Well No DNR vulnerability rating assign the following point values: Very High Vulnerable High Vulnerable Moderate 25 points Low ( L score of 1 o 3) 20 points Low ( L score of 4 to 7) (~40 to 50 ft of protective geologic units) 15 points Very Low ( L score of 8 to 11) 10 points Very Low ( L score of 12 or greater) 5 points TOTAL POINTS 15 points 2. Casing integrity assign the following point values: Each breach of the casing (1 breach found in 4/06 but repaired immediately) 20 points Each casing string not grouted or extending to the land surface 10 points Each category for which information requested is unknown 5 points Each string of properly installed casing 0 points TOTAL POINTS 0 points 3. Casing depth assign the following point values: <50 feet 20 points 50 to 200 feet 10 points 201 to 500 feet (307 ft) 5 points >500 feet 0 points TOTAL POINTS 5 points 4. Pumping rate assign the following point values: >1000 gallons/minute 20 points 501 to 1000 gallons/minute 10 points 50 to 500 gallons/minute (both max and average annual pumping rate is in this range) 5 points <50 gallons/minute 0 points TOTAL POINTS 5 points 5. Isolation distance from contaminant source
138 For wells <50 feet deep, assign 10 points to each source located within 100 feet of the well For wells >50 feet deep, assign 10 points to each source located within 50 feet of the well TOTAL POINTS 6. Chemical and isotopic information: Volatile Organic Compounds Detection (o,m mxylene detected at pump house on 7/03) Synthetic Organic Compounds Detection Nitrate-Nitrogen Results 10 points 10 points Vulnerable Vulnerable >10 parts/million Vulnerable >3 but 10 parts/million 30 points 1 to 3 parts/million 10 points <1 parts/million Tritium Results >1 TU Vulnerable <1 TU 0 points 14 Carbon Results For wells in which the 14 carbon content of the water indicates an age approximation of at least several centuries, subtract 20 points from the score. TOTAL POINTS 7. Grand total score: 0 points 1. DNR Vulnerability Rating Casing Integrity 0 3. Casing Depth 5 4. Pumping Rate 5 5. Isolation Distance from Contaminant Sources Chemical and Isotopic Information 0 GRAND TOTAL 35 If the score is 45 or more, the well is considered vulnerable. If the score is between 5 and 40, priority for phasing into the state s WHP program is referenced to population served. If the score is 0 or less, the well is considered not vulnerable. Moderately Vulnerable
139 Vulnerability Assessment Worksheet Well Name/No. McKenna Jordan aquifer Well Public Water Supplier ID No Minnesota Unique Well No DNR vulnerability rating assign the following point values: Very High Vulnerable High Vulnerable Moderate 25 points Low ( L score of 1 o 3) 20 points Low ( L score of 4 to 7) 15 points Very Low ( L score of 8 to 11) 10 points Very Low ( L score of 12 or greater) 5 points TOTAL POINTS 25 points 2. Casing integrity assign the following point values: Each breach of the casing 20 points Each casing string not grouted or extending to the land surface 10 points Each category for which information requested is unknown 5 points Each string of properly installed casing 0 points TOTAL POINTS 0 points 3. Casing depth assign the following point values: <50 feet 20 points 50 to 200 feet 10 points 201 to 500 feet (264 ft) 5 points >500 feet 0 points TOTAL POINTS 5 points 4. Pumping rate assign the following point values: >1000 gallons/minute 20 points 501 to 1000 gallons/minute 10 points 50 to 500 gallons/minute (both max and average annual pumping rate is in this range) 5 points <50 gallons/minute 0 points TOTAL POINTS 5 points
140 5. Isolation distance from contaminant source For wells <50 feet deep, assign 10 points to each source located within 100 feet of the well For wells >50 feet deep, assign 10 points to each source located within 50 feet of the well TOTAL POINTS 6. Chemical and isotopic information: Volatile Organic Compounds Detection Synthetic Organic Compounds Detection Nitrate-Nitrogen Results 0 points 0 points Vulnerable Vulnerable >10 parts/million Vulnerable >3 but 10 parts/million 30 points 1 to 3 parts/million 10 points <1 parts/million Tritium Results >1 TU Vulnerable <1 TU 0 points 14 Carbon Results For wells in which the 14 carbon content of the water indicates an age approximation of at least several centuries, subtract 20 points from the score. TOTAL POINTS 7. Grand total score: 0 points 1. DNR Vulnerability Rating Casing Integrity 0 3. Casing Depth 5 4. Pumping Rate 5 5. Isolation Distance from Contaminant Sources 0 6. Chemical and Isotopic Information 0 GRAND TOTAL 35 If the score is 45 or more, the well is considered vulnerable. If the score is between 5 and 40, priority for phasing into the state s WHP program is referenced to population served. If the score is 0 or less, the well is considered not vulnerable. Moderately Vulnerable
141 Appendix G: SMSC Contaminant Spill History Contaminant release records are maintained by the SMSC Land Department. Date Location Substance Volume Action Taken 4/2/1997 Adjacent to the Sioux Trail Jordan Aquifer wellhead Diesel fuel Unknown, but assumed to be less than 15 gallons Asphalt and soil removed. 8/2/2001 Shakopee Dakota Convenience Store Gasoline Estimated to be gallons Pumps were closed. Prior Lake Fire Department flushed drain lines. MPCA contacted. 4/1/2002 Dakotah Meadows RV Park Gasoline Estimated to be less than 10 gallons Prior Lake Fire Department responded to call for assistance. 2/15/2003 Job-site storage yard at Mystic Lake Casino Hydraulic fluid Approximately 20 gallons Sand was used to absorb oil under the parked crane. Snow and ice prevented fluid from seeping into ground. Contaminated sand and soil was removed. 9/3/ Mystic Lake Drive 4/6/2004 The Meadows at Mystic Lake golf course Jordan Aquifer irrigation wellhead Diesel fuel 4 gallons Runoff was captured using dikes and absorbent was used to contain fuel. LSI sweeper collected debris. Diesel fuel gallons West Central Environmental Consultants cleaned the majority of the spill. Bay West was contracted to clean wetlands contaminated by the spill. 11/15/2005 McKenna water tower construction Hydraulic fluid Approximately 15 gallons Stevens Drilling & Environmental excavated the impacted soil
142 3/12/2008 SMSC Public Works Building Hydraulic fluid Shell DONAX TD Approximately 7 gallons Allowed to evaporate 3/19/2008 SMSC #1 Convenience Store Gasoline Small amount <20 gallons from underground pipe Contamination levels below action threshold. No action taken 8/20/2008 SMSC #1 Convenience Store Gasoline storage tank leak Unknown quantity < 100 gallons 650 tons of contaminated soil were removed and disposed of through Waste Management 10/15/2008 Mystic Lake parking ramp Hydraulic fluid Unknown quantity < 10 gallons Concrete surface cleaned up with booms, spill pads, and spill dry.
143 Appendix H: Potential Contaminant Source Survey

144

145

146

147

148
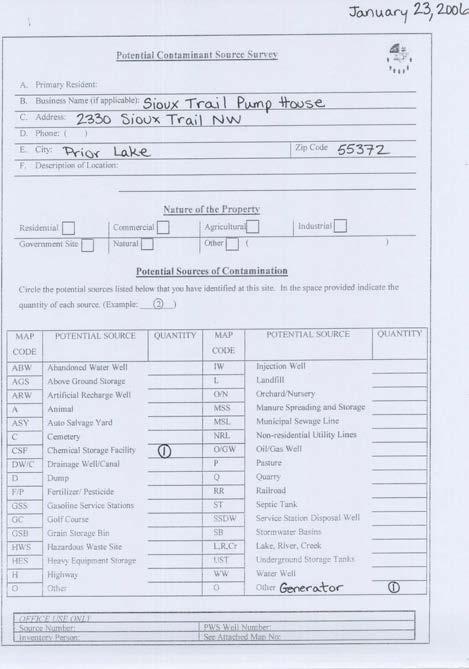
149

150
Supplemental Guide II-Delineations
 Supplemental Guide II-Delineations Contents Source Water Protection Area Delineation... 1 Delineation Criteria for Systems Using Groundwater Sources... 2 Time of Travel... 4 Flow Boundaries... 4 Delineation
APPENDIX 5: SAMPLE MODEL RESULTS
 APPENDIX 5: SAMPLE MODEL RESULTS A. Evaluation of Groundwater Sustainability in the Ramsey Area B. Evaluation of Groundwater Sustainability in the Woodbury Area C. Evaluation of Future Drawdown Conditions
groundwater/surface-water interactions Evan Christianson, PG Barr Engineering Company
 groundwater/surface-water interactions Evan Christianson, PG Barr Engineering Company Discussion of. Groundwater/Surface-Water Interactions Groundwater Recharge Impacts from Pumping Potential effect on
WHPA AND DWSMA DELINEATIONS AND VULNERABILITY ASSESSMENTS
 APPENDIX I WHPA AND DWSMA DELINEATIONS AND VULNERABILITY ASSESSMENTS WHPA and DWSMA Delineations and Vulnerability Assessments -Appendix I contains the first part of the plan, consisting of the delineation
Environmental Resource Inventories. What are ERIs? Significance of information How to use them
 Environmental Resource Inventories What are ERIs? Significance of information How to use them Environmental Resource Inventory - ERI Compiled by the environmental commission Information about the natural
2.0 DESCRIPTION OF WATER SUPPLY DELINEATION OF THE WELLHEAD PROTECTION AREA METHODOLOGY UNCERTAINTY ANALYSIS...
 TABLE OF CONTENTS PAGE 1.0 INTRODUCTION...1 2.0 DESCRIPTION OF WATER SUPPLY...2 3.0 PHYSICAL SETTING...2 3.1 GEOLOGY...3 3.2 HYDROGEOLOGY...3 4.0 DELINEATION OF THE WELLHEAD PROTECTION AREA...4 4.1 METHODOLOGY...6
Wellhead Protection Plan. Part I
 Wellhead Protection Plan Part I Wellhead Protection Area Delineation Drinking Water Supply Management Area Delineation Well and Drinking Water Supply Management Area Vulnerability Assessments For Green
County Geologic Atlases. Applications and Uses
 County Geologic Atlases Applications and Uses Jim Berg, Hydrogeologist Minnesota Department of Natural Resources Ecological and Water Resources, St. Paul, Minnesota County Geologic Atlas Progress 2013
2015 WELLHEAD PROTECTION PLAN Part 2
 City of Excelsior 339 Third Street Excelsior, MN 55331 (952) 474-5233 2015 WELLHEAD PROTECTION PLAN Part 2 WSB Project No. 2073-21 701 Xenia Avenue South, Suite 300 Minneapolis, MN 55416 Tel: (763) 541-4800
Shakopee Mdewakanton Sioux Community. Groundwater Protection Plan For the protection of our groundwater resources SMSC Land Department
 Shakopee Mdewakanton Sioux Community Groundwater Protection Plan For the protection of our groundwater resources SMSC Land Department 2009 Shakopee Mdewakanton Sioux Community Groundwater Protection Plan
The Michigan Wellhead Protection Program Guide
 The Michigan Wellhead Protection Program Guide Michigan Department of Environmental Quality Drinking Water & Environmental Health Section February 2006 State of Michigan Jennifer Granholm, Governor Department
WELLHEAD PROTECTION PLAN FOR THE CITY OF NORTH MANKATO, MINNESOTA
 WELLHEAD PROTECTION PLAN FOR THE CITY OF NORTH MANKATO, MINNESOTA September 2017 Forward This document presents the wellhead protection (WHP) plan for the City of North Mankato that will help provide for
Memorandum. Introduction. Carl Einberger Joe Morrice. Figures 1 through 7
 Memorandum TO: Michelle Halley, NWF DATE: October 9, 2007 FROM: Carl Einberger Joe Morrice PROJ. NO.: 9885.000 CC: Project File PROJ. NAME: National Wildlife Federation ATTACHMENTS: Tables 1 through 6
Predicting Groundwater Sustainability: What Tools, Models and Data are Available?
 Predicting Groundwater Sustainability: What Tools, Models and Data are Available? Ray Wuolo Barr Engineering Company Assessing Sustainability is All About: Predicting (or describing) how potentiometric
WELLHEAD PROTECTION DELINEATION REPORT FOR THE VILLAGE OF BEAR LAKE DECEMBER 2002
 WELLHEAD PROTECTION DELINEATION REPORT FOR THE VILLAGE OF BEAR LAKE DECEMBER 2002 Prepared by: Gosling Czubak Engineering Sciences, Inc. 1280 Business Park Drive Traverse City, Michigan 48686 Telephone:
4 DETERMINATION OF WELLHEAD PROTECTION AREAS
 4 DETERMINATION OF WELLHEAD PROTECTION AREAS A wellhead protection area is defined as the surface and subsurface area surrounding a well, wellfield or spring that supplies a public water supply through
SECTION 3 NATURAL RESOURCES
 SECTION 3 NATURAL RESOURCES The natural environment plays a large role in planning for future development. Environmental conditions, such as topography, wetlands, floodplains, and water bodies, can often
STRAWMAN OUTLINE March 21, 2008 ISWS/ISGS REPORT ON THE OPPORTUNITIES AND CHALLENGES OF MEETING WATER DEMAND IN NORTH-EAST ILLINOIS
 STRAWMAN OUTLINE March 21, 2008 ISWS/ISGS REPORT ON THE OPPORTUNITIES AND CHALLENGES OF MEETING WATER DEMAND IN NORTH-EAST ILLINOIS REPORT TO BE DELIVERED TO THE RWSPG BY SEPTEMBER 30, 2008 Table of Contents
BAEN 673 / February 18, 2016 Hydrologic Processes
 BAEN 673 / February 18, 2016 Hydrologic Processes Assignment: HW#7 Next class lecture in AEPM 104 Today s topics SWAT exercise #2 The SWAT model review paper Hydrologic processes The Hydrologic Processes
Characterizing Groundwater and Surface- Water Interactions in Selected Northeast Twin Cities Lakes
 Characterizing Groundwater and Surface- Water Interactions in Selected Northeast Twin Cities Lakes Chapter A: Statistical Analysis and Field Study Chapter B: Groundwater-Flow Simulation Perry M. Jones,
Amendment to the Wellhead Protection Plan. Part I
 Amendment to the Wellhead Protection Plan Part I Delineation of Wellhead Protection Area Drinking Water Supply Management Area Delineation Well and Drinking Water Supply Management Area Vulnerability Assessments
Vermillion River Headwaters Groundwater Recharge Area Inventory and Protection Plan
 Vermillion River Headwaters Groundwater Recharge Area Inventory and Protection Plan A project funded through a Metro Environmental Partnership grant from the Metropolitan Council with technical analysis
4.4 MODEL CODE DESCRIPTION 4.5 WATER SOURCES AND SINKS 4.6 MODEL DOMAIN AND BOUNDARIES. SLR South Africa
 Page 4-18 The developed model should therefore be seen as an initial site model which should be refined and recalibrated once more groundwater monitoring and other data become available. 4.4 MODEL CODE
General Groundwater Concepts
 General Groundwater Concepts Hydrologic Cycle All water on the surface of the earth and underground are part of the hydrologic cycle (Figure 1), driven by natural processes that constantly transform water
DYNFLOW accepts various types of boundary conditions on the groundwater flow system including:
 Section 6 Groundwater Flow Model A groundwater flow model was developed to evaluate groundwater flow patterns in the site area and to provide a basis for contaminant transport modeling. 6.1 Model Code
Flow-Through Lake/Wetland: Generalized Monitoring Strategy
 General Hydrologic Characteristics of Flow-Through Lakes & Wetlands Flow-through lakes are surface expressions of the water table and are in direct hydraulic connection with the water-table aquifer. They
Potential effects evaluation of dewatering an underground mine on surface water and groundwater located in a rural area
 Potential effects evaluation of dewatering an underground mine on surface water and groundwater located in a rural area ITRODUCTIO Michel Mailloux* Eng. M.Sc, Vincent Boisvert, M.Sc, Denis Millette, Eng.,
CHAPTER 7 PHYSICAL INVENTORY OF THE CITY
 CHAPTER 7 PHYSICAL INVENTORY OF THE CITY Chapter 7: Physical Inventory of the City 39 This page intentionally left blank. Chapter 7: Physical Inventory of the City 40 SECTION 1 PHYSICAL SETTING While communities
East Maui Watershed Partnership Adapted from Utah State University and University of Wisconsin Ground Water Project Ages 7 th -Adult
 INTRODUCTION What is groundwater? Water contained in saturated soil and rock materials below the surface of the earth. It is not NEW water, but is recycled water through the hydraulic cycle. The source
Movement and Storage of Groundwater The Hydrosphere
 Movement and Storage of Groundwater The Hydrosphere The water on and in Earth s crust makes up the hydrosphere. About 97 percent of the hydrosphere is contained in the oceans. The water contained by landmasses
Aquifer Characterization and Drought Assessment Ocheyedan River Alluvial Aquifer
 Aquifer Characterization and Drought Assessment Ocheyedan River Alluvial Aquifer Iowa Geological Survey Water Resources Investigation Report 10 Aquifer Characterization and Drought Assessment Ocheyedan
2.0 Land and Water Resource Inventory
 2.0 Land and Water Resource Inventory 2.1 Climate and Precipitation Data The Twin Cities metropolitan area climate is a humid continental climate, with moderate precipitation, wide daily temperature variations,
Gaining Stream: Generalized Monitoring Strategy
 General Hydrologic Characteristics of Gaining Streams Most stream reaches in the metro area are gaining reaches (i.e. the stream flow increases in the downstream direction due to inflow of groundwater).
Source Water Assessment Program (SWAP) Report for Heath Elementary School
 Report for Heath Elementary School") Source Water Assessment Program (SWAP) Report for Heath Elementary School What is SWAP? The Source Water Assessment Program (SWAP), established under the federal Safe Drinking Water Act, requires every
Source Water Assessment Program (SWAP) Report for Heath Elementary School What is SWAP? The Source Water Assessment Program (SWAP), established under the federal Safe Drinking Water Act, requires every
DEVELOPMENT OF AQUIFER TESTING PLANS. Brent Bauman, P.G. / Erin Lynam, Aquatic Biologist
 DEVELOPMENT OF AQUIFER TESTING PLANS Brent Bauman, P.G. / Erin Lynam, Aquatic Biologist DEVELOPMENT OF AQUIFER TESTING PLANS Goals of Aquifer Testing What questions are we trying to answer Staff review
Aquifer Science Staff, January 2007
 Guidelines for Hydrogeologic Reports and Aquifer Tests Conducted Within the Jurisdictional Boundaries of the Barton Springs / Edwards Aquifer Conservation District I. Introduction Aquifer Science Staff,
City of Park Rapids WELLHEAD PROTECTION PLAN
 City of Park Rapids WELLHEAD PROTECTION PLAN Image of contractor sealing City well s 1 and 2 October 11, 2016 January 2018 1 TABLE OF CONTENTS Page Number I. PUBLIC WATER SUPPLY PROFILE 3 II. EXECUTIVE
WELLHEAD PROTECTION PLAN Part 2
 WELLHEAD PROTECTION PLAN Part 2 Part 2: Potential Contaminant Source Management Strategy Impacts of Expected Changes to Land and Water Resources Issues, Problems & Opportunities Wellhead Protection Plan
NATURAL FEATURES, LAND SUITABILITY FOR DEVELOPMENT AND DEVELOPMENT CONCERNS
 East Central Wayne County Comprehensive Plan - Natural Features, Land Suitability Page 170 NATURAL FEATURES, LAND SUITABILITY FOR DEVELOPMENT AND DEVELOPMENT CONCERNS Introduction The residents of East
GROUNDWATER AND GENEVA LAKE
 GROUNDWATER AND GENEVA LAKE INTRODUCTION For years it was assumed that groundwater was a significant source of water to Geneva Lake. Local folklore once contended that the water in Geneva Lake came all
Our Eastern Shore Groundwater Part IV Groundwater Quality on the Eastern Shore: How safe is our groundwater and are there ways we can protect it?
 Our Eastern Shore Groundwater Part IV Groundwater Quality on the Eastern Shore: How safe is our groundwater and are there ways we can protect it? Britt McMillan, Malcolm Pirnie, Inc. Mercury Venus Mars
groundwater. Because watersheds are complex systems, each tends to respond differently to natural or human activities.
 The private development of Altos del María is located at an altitude between 550 and 1,000 meters above sea level in the environmentally sensitive Cordillera Central of Panama that separates the Pacific
Groundwater Flow Demonstration Model Activities for grades 4-12
 Groundwater Flow Demonstration Model Activities for grades 4-12 NR/WQ/2012-5 SET-UP Please allow time to practice using the groundwater model before conducting demonstrations. 1. Remove the groundwater
Maintaining and Improving the Health of All Minnesotans
 Protecting, Maintaining and Improving the Health of All Minnesotans 7/10/17 Stephanie Adams 12 Hwy 28 E St 2 Morris, MN 56267 Dear Stephanie: Subject: Initial Comment Letter, One Watershed One Plan Thank
Groundwater 3/16/2010. GG22A: GEOSPHERE & HYDROSPHERE Hydrology
 GG22A: GEOSPHERE & HYDROSPHERE Hydrology Definitions Groundwater Subsurface water in soil or rock that is fully saturated. Aquifer Contains enough saturated material to yield significant quantities of
Albemarle County Hydrogeologic Assessment Summary Report
 Albemarle County Hydrogeologic Assessment Summary Report Phase II Groundwater Availability and Sensitivity Assessment with Proposed Groundwater Assessment Standards Presented To: County of Albemarle Department
Illinois State Water Survey Division
 Illinois State Water Survey Division GROUND-WATER SECTION SWS Contract Report 456 SUMMARY REPORT: REGIONAL ASSESSMENT OF THE GROUND-WATER RESOURCES IN EASTERN KANKAKEE AND NORTHERN IROQUOIS COUNTIES by
CITY OF HOYT LAKES, MINNESOTA SOURCE WATER ASSESSMENT
 CITY OF HOYT LAKES, MINNESOTA SOURCE WATER ASSESSMENT November 2002 Public Water Supplier ID 1690028 Facility Contact: Minnesota Department of Health Contact: Mr. Floyd Nelson, Supervisor Ms. Beth Kluthe
Hydrogeology 101 3/7/2011
 Hydrogeology 101 W. Richard Laton, Ph.D., PG, CPG Associate Professor of Hydrogeology California State University, Fullerton Department of Geological Sciences 1 Hydrogeology 101 The objective is to obtain
SECTION III LAND AND WATER RESOURCE INVENTORY
 III. LAND AND WATER RESOURCE INVENTORY In conformance with the Metropolitan Surface Water Management Act and as required in Minnesota Rules Section 8410.0060, this section of the plan provides a general
WELLHEAD PROTECTION PLAN Amendment
 City of Mahnomen, Minnesota WELLHEAD PROTECTION PLAN Amendment Part 2 Potential Contaminant Source Inventory Potential Contaminant Source Management Strategy Evaluation Plan Emergency/Conservation Plan
4. Groundwater Resources
 4. Groundwater Resources 4-1 Majority (97 %) of unfrozen fresh water on earth exists as groundwater. In comparison to surface water, - groundwater is available all year around - groundwater is mostly invisible
Appendix B Stormwater Site Plan Submittal Requirements Checklist
 Stormwater Site Plan Submittal Requirements Checklist The Submittal Requirements Checklist is intended to aid the design engineer in preparing a Stormwater Site Plan. All items included in the following
Issue paper: Aquifer Water Balance
 Issue paper: Aquifer Water Balance 1. Introduction And Background 1.1. Purpose and Scope The population in Kitsap County has grown rapidly in recent years and is expected to increase substantially in the
2 ROLES AND RESPONSIBILITIES
 2 ROLES AND RESPONSIBILITIES Overview Ground water protection within the NNEPA occurs through a coordinated effort between various NNEPA departments - the Air / Toxics department, Waste Regulatory & Compliance
Song Lake Water Budget
 Song Lake Water Budget Song Lake is located in northern Cortland County. It is a relatively small lake, with a surface area of about 115 acres, and an average depth of about 14 feet. Its maximum depth
Irrigation. Branch. Groundwater Quality in the Battersea Drainage Basin
 AGRICULTURE, FOOD AND RURAL DEVELOPMENT Irrigation Branch Groundwater Quality in the Battersea Drainage Basin Groundwater quality in the Battersea drainage basin was monitored between 1995 and 21 to characterize
CENTRAL COAST POST-CONSTRUCTION REQUIREMENTS IMPLEMENTATION GUIDANCE SERIES 1
 CENTRAL COAST POST-CONSTRUCTION REQUIREMENTS IMPLEMENTATION GUIDANCE SERIES 1 SERIES ISSUE #2: DECENTRALIZED STORMWATER MANAGEMENT TO COMPLY WITH RUNOFF RETENTION POST-CONSTRUCTION STORMWATER CONTROL REQUIREMENTS
Wellhead Protection Issues Related to Mining Activities Minnesota Rural Water Conference March 4, 2014
 Wellhead Protection Issues Related to Mining Activities Minnesota Rural Water Conference March 4, 2014 Terry Bovee Source Water Protection Unit Minnesota Department of Health Purpose Response to requests
Rainwater Harvesting for Enhanced Groundwater Recharge Through Capture of Increased Runoff from Site Development
 Southern Illinois University Carbondale OpenSIUC 2006 Conference Proceedings 7-18-2006 Rainwater Harvesting for Enhanced Groundwater Recharge Through Capture of Increased Runoff from Site Development Mark
Assessment of the Groundwater Quantity Resulting from Artificial Recharge by Ponds at Ban Nong Na, Phitsanulok Province, Thailand
 Research article erd Assessment of the Groundwater Quantity Resulting from Artificial Recharge by Ponds at Ban Nong Na, Phitsanulok Province, Thailand SIRIRAT UPPASIT* Faculty of Technology, Khon Kaen
Characteristics of Land Resources
 Chapter Chapter 1 Characteristics of Land Resources The geology, soils and topography of Woodford County T he geology, soils and topography of an area are important to the community planning process for
Groundwater Occurrence & Movement: An Introductory Discussion with Application to Northeastern Illinois
 Groundwater Occurrence & Movement: An Introductory Discussion with Application to Northeastern Illinois H. Allen Wehrmann, P.E., Director Center for Groundwater Science Illinois State Water Survey April
Black River Watershed Management Plan Plan
 Black River Watershed Management Plan Plan Final Report Part II: Appendices May 2010 This watershed management plan was prepared for the New York State Department of State Division of Coastal Resources
True False Click and Drag Artesian wells are naturally under pressure and require no additional pumps to get the water out of the ground.
 True False Click and Drag Artesian wells are naturally under pressure and require no additional pumps to get the water out of the ground. Groundwater recharge is the water from infiltration Groundwater
B-7. Predictive Assessment Model of Quaternary Alluvium Hydrogeology. J:\scopes\04w018\10000\FVD reports\final EIA\r-EIA app.doc
 B-7 Model of Quaternary Alluvium Hydrogeology J:\scopes\04w018\10000\FVD reports\final EIA\r-EIA app.doc PREDICTIVE ASSESSMENT MODELING OF THE QUATERNARY ALLUVIUM HYDROGEOLOGY EAGLE PROJECT MARQUETTE COUNTY,
Groundwater in Bayfield County. Madeline Gotkowitz Hydrogeologist April 23, 2015
 Groundwater in Bayfield County Madeline Gotowitz Hydrogeologist April 23, 2015 Groundwater in Bayfield County Groundwater basics Hydrogeology across Wisconsin Hydrogeology in Bayfield County Mapping groundwater
Investigation of a Floodplain Pond to Improve Alluvial Aquifer Sustainability: A Quantity and Quality Report
 Investigation of a Floodplain Pond to Improve Alluvial Aquifer Sustainability: A Quantity and Quality Report Water Resources Investigation Report 16 i P a g e Investigation of a Floodplain Pond to Improve
Regional Municipality of Peel
 Regional Municipality of Peel Wellhead Protection Area Delineations and Vulnerability Assessments for Alton 1-2 Standby Wells, Cheltenham PW1/ PW2 Amended PTTW, and Caledon Village Proposed Well 5 (TW2-05).
Groundwater basics. Groundwater and surface water: a single resource. Pore Spaces. Simplified View
 Groundwater and surface water: a single resource Santa Cruz River, Tucson Groundwater basics Groundwater is water found within the pore spaces of geologic material beneath the surface of the Earth. It
Protecting, maintaining and improving the health of all Minnesotans
 Protecting, maintaining and improving the health of all Minnesotans DATE: TO: FROM: SUBJECT: Licensed and Registered Well Contractors John Linc Stine, Director Environmental Health Division P.O. Box 64975
Karst Spring: Generalized Monitoring Strategy
 General Hydrologic Characteristics of Karst Springs Karst spring means a location of concentrated groundwater discharge from conduits in bedrock (predominantly solution enhanced conduits or zones in carbonate
Background Information on the. Peace River Basin
 Background Information on the Peace River Basin Resource Conservation & Development Department August 24 Background Physiography The Peace River drainage basin occupies large parts of Polk, Hardee, DeSoto,
Groundwater. Groundwater Movement. Groundwater Movement Recharge: the infiltration of water into any subsurface formation.
 On March 22, 2014, a major landslide occurred near Oso, Washington. Death toll currently at 30, with 15 still missing. Groundwater Before and After Swipe http://bit.ly/pen1jt N. Fork Stillaguamish River
Updated Vulnerability Assessment and Scoring of Wellhead Protection Areas Regional Municipality of York
 Addendum Report Updated Vulnerability Assessment and Scoring of Wellhead Protection Areas Regional Municipality of York Prepared For: The Regional Municipality of York Environmental Services Environmental
Numerical Groundwater Flow Model Report. Caloosa Materials, LLC 3323 Gulf City Road Ruskin, Florida 33570
 Numerical Groundwater Flow Model Report Caloosa Materials, LLC 3323 Gulf City Road Ruskin, Florida 33570 GHD 2675 Winkler Ave Suite 180 Fort Myers, FL 33901 11138224 Report July 27, 2017 Table of Contents
Environmental Information Worksheet
 Environmental Information Worksheet Water System Owner (Attach additional sheets if necessary) Needs and Alternatives Provide a brief narrative that describes: Current drinking water system needs. Project
Capturing Storm Water in Semi-arid Climate
 Capturing Storm Water in Semi-arid Climate REBEKA SULTANA, PHD CALIFORNIA STATE UNIVERSITY, LONG BEACH NATHANIEL SUMMERVILLE, PE CALIFORNIA STATE UNIVERSITY LONG BEACH (STUDENT PROJECT MANAGER) AND CH2M
Calcareous Fen: Generalized Monitoring Strategy
 Calcareous Fen: Generalized Monitoring Strategy General Hydrologic Characteristics of Trout Streams Fens are wetlands fed by groundwater. Calcareous fens are wetlands fed by groundwater containing high
Stormwater Erosion Control & Post-Construction Plans (Stormwater Quality Plans)
") Stormwater Erosion Control & Post-Construction Plans (Stormwater Quality Plans) Allen County Stormwater Plan Submittal Checklist The following items must be provided when applying for an Allen County Stormwater
Stormwater Erosion Control & Post-Construction Plans (Stormwater Quality Plans) Allen County Stormwater Plan Submittal Checklist The following items must be provided when applying for an Allen County Stormwater
Chapter 6 Erosion & Stormwater Study Team
 Chapter 6 Erosion & Stormwater Study Team Objective How do we stabilize the Las Vegas Wash environment to most effectively reduce erosion and enhance wetlands? Introduction The Las Vegas Wash (Wash) has
Groundwater and surface water: a single resource. Santa Cruz River, Tucson
 Groundwater and surface water: a single resource Santa Cruz River, Tucson 1942 1989 1 Groundwater basics Groundwater is water found within the pore spaces of geologic material beneath the surface of the
Groundwater Levels and Pumpage in the East St. Louis Area, Illinois,
 Circular 112 STATE OF ILLINOIS DEPARTMENT OF REGISTRATION AND EDUCATION Groundwater Levels and Pumpage in the East St. Louis Area, Illinois, 1967-1971 by W. H. BAKER, JR. ILLINOIS STATE WATER SURVEY URBANA
BCWMC 2015 Watershed Management Plan. Executive Summary
 BCMWC 2015 Watershed Management Plan Executive Summary Contents Executive Summary... ES-1 Section 1 Introduction... ES-1 Section 2 Land and Water Resource Inventory... ES-2 Section 3 Assessment of Issues
Numerical Modeling of Groundwater Flow in the Navajo Sandstone Aquifer at the Tuba City, Arizona, Disposal Site 15167
 Numerical Modeling of Groundwater Flow in the Navajo Sandstone Aquifer at the Tuba City, Arizona, Disposal Site 15167 ABSTRACT Richard Bush*, Timothy Bartlett** *US DOE, Office of Legacy Management **Stoller
WELLHEAD PROTECTION PLAN FOR THE. City of Bertha. Nonvulnerable Setting
 WELLHEAD PROTECTION PLAN FOR THE City of Bertha Nonvulnerable Setting March, 0 Table of Contents Page Forward Chapter - Introduction... Chapter - Identification and Assessment of the Data Elements Used
DEPARTMENT OF ENVIRONMENTAL QUALITY WATER QUALITY DIVISION PERMIT APPLICATION FORM UNDERGROUND INJECTION CONTROL (UIC) CLASS V WELL
 CLASS V WELL") DEPARTMENT OF ENVIRONMENTAL QUALITY WATER QUALITY DIVISION PERMIT APPLICATION FORM UNDERGROUND INJECTION CONTROL (UIC) CLASS V WELL Mail To: WDEQ/WQD ATTN: UIC Program 122 W. 25 th St. 4W Cheyenne, WY
DEPARTMENT OF ENVIRONMENTAL QUALITY WATER QUALITY DIVISION PERMIT APPLICATION FORM UNDERGROUND INJECTION CONTROL (UIC) CLASS V WELL Mail To: WDEQ/WQD ATTN: UIC Program 122 W. 25 th St. 4W Cheyenne, WY
Why Care About Contaminants in Groundwater?
 Why Care About Contaminants in Groundwater? Subject/ target grade: Middle School (8 th grade) Earth Science Duration: Two 50 minute periods Setting: Classroom Materials and Equipment Needed: Per class
CITY OF FARIBAULT WELLHEAD PROTECTION PLAN. This plan is in effect from July 2010 to July 2020
 CITY OF FARIBAULT WELLHEAD PROTECTION PLAN This plan is in effect from July 2010 to July 2020 Forward This document presents the Wellhead Protection (WHP) Plan for the City of Faribault (the City) that
ORDINANCE # 854. Stormwater Management / Operation and Maintenance Requirements
 ORDINANCE # 854 Stormwater Management / Operation and Maintenance Requirements Section 1. Purpose and Authority In accordance with the provisions of Chapters 98, 124, 126, 440, 444, and 446h of the General
INITIAL TOWNSHIP TESTING OF NITRATE IN PRIVATE WELLS WASHINGTON COUNTY 2014 SUMMARY
 INITIAL TOWNSHIP TESTING OF NITRATE IN PRIVATE WELLS WASHINGTON COUNTY 2014 SUMMARY November 2015 Minnesota Department of Agriculture Pesticide and Fertilizer Management Division In accordance with the
CITY OF ST. PAUL SOURCE WATER ASSESSMENT
 CITY OF ST. PAUL SOURCE WATER ASSESSMENT September 2001 PWS ID 1620026 City Contact: Mr. David Schuler St. Paul Regional Water Services 8 Fourth Street East St. Paul, Minnesota 55101 Telephone Number:
INFRASTRUCTURE ELEMENT/NATURAL GROUNDWATER AQUIFER RECHARGE SUB-ELEMENT
 I. INTRODUCTION A. Purpose As provided in this Natural Groundwater Aquifer Recharge Sub-element, the City of Ocoee has developed guidelines based on the St. Johns River Water Management District s programs.
WELLHEAD PROTECTION PLAN
 April 2003 City of Cloquet, Minnesota WELLHEAD PROTECTION PLAN Part 2 Potential Contaminant Source Inventory Potential Contaminant Source Management Strategy Evaluation Plan Emergency/Conservation Plan
GROUNDWATER. Water Resources of NYS: The Nature of its Underground Water. Composite Groundwater Environment. Groundwater Resources of NYS
 Water Resources of NYS: The Nature of its Underground Water Prof. Anthony Grande AFG 2014 1 GROUNDWATER Groundwater - water occupying the pore spaces and cracks in rocks and unconsolidated material. The
GROUND WATER. Practice Note # water. sensitive. urban. design \ \ \ \ \ \ \ \ \ \ \ \ \ \ \ \ \ \ \ \ \ \ \ \ \ \ \ \
 2013 water. sensitive. urban. design \ \ \ \ \ \ \ \ \ \ \ \ \ \ \ \ \ \ \ \ \ \ \ \ \ \ \ \ Practice Note #8 GROUND Water Smart design is the effective planning, design and building of homes, subdivisions,
Using Fractran Fracture Flow Modeling in Tandem with Modflow to Assist in the Development of Wellfield Protection Zones for Municipal Wells in Bedrock
 Using Fractran Fracture Flow Modeling in Tandem with Modflow to Assist in the Development of Wellfield Protection Zones for Municipal Wells in Bedrock T.K. Wiezel 1, G.G. Violette 1 and S.T. Hamilton 2
PUBLIC UTILITIES. Water Service
 PUBLIC UTILITIES Planning for public utilities is crucial to the successful growth of any community. The following section describes the current services provided to residents of Gloucester County and
Hello my name is Joy Loughry and I am with the groundwater technical unit of the Minnesota department of natural resources. Today I am going to talk
 Hello my name is Joy Loughry and I am with the groundwater technical unit of the Minnesota department of natural resources. Today I am going to talk about how the state of Minnesota manages its Water resources
(this cover page left intentionally blank)
") 4. Siting the Well (this cover page left intentionally blank) 4. Siting the Well Chapter Table of Contents Chapter Table of Contents Chapter Description... 4 Regulatory Requirements Well Siting... 4 Relevant
4. Siting the Well (this cover page left intentionally blank) 4. Siting the Well Chapter Table of Contents Chapter Table of Contents Chapter Description... 4 Regulatory Requirements Well Siting... 4 Relevant