Supplemental Figure 1. Floral commitment in Arabidopsis WT and mutants.
|
|
|
- Juniper Dean
- 5 years ago
- Views:
Transcription


 Commitment of plant with different genotypes with initial growth of 2 weeks in SDs.")
1 Percentage of induction Supplemental Data. Torti et al. (2012). Plant Cell /tpc A LD LDs +1 LDs LDs LDs LD 50 μm AP1 B C wt Col soc1-2 ful-2 svp-41, 1 week SD svp-41, 2 weeks SD Photoperiod Supplemental Figure 1. Floral commitment in Arabidopsis WT and mutants. (A) In situ hybridization of APETALA1 probe on WT Col grown for two weeks in SDs and shifted to LDs for the indicated number of days. (B) Commitment of WT Col to flower with different duration of the initial growth in SDs. (C) Commitment of plant with different genotypes with initial growth of 2 weeks in SDs. In (B) and (C): Exposure to day length as shown on X-axis. Y-axis, percentage of induction, calculated as described in the Methods. Error bars represent standard deviation. At least eight plants were used to score flowering time of each condition or genotype. 1


2 50 µm Supplemental Figure 2. In situ hybridization on WT Col apices in double shift experiments using probes for SOC1, FUL, SVP and AP1. Analysis of gene expression after transient exposure of SD-grown plants to LDs. Plants were grown for two weeks in SDs, transferred to LDs and transferred back to SDs as indicated above each panel. Scale bar is 50 μm and refers to all panels. 2

3 soc1-2 ful-2 svp-41 soc1-2 ful-2 Supplemental Figure 3. Comparison of inflorescences of soc1-2 ful-2 and svp-41 soc1-2 ful-2 plants. Photographs were taken after flowering and represent plants sown at the same time and grown in the same conditions. 3
 0 LD, before microdissection. (B) 0 LD, after microdissection. (C) 1 LD, before microdissection. (D) 1 LD, after microdissection. (E) 3 LDs, before microdissection.")
4 Supplemental Figure 4. Laser microdissection performed on WT Col apices during the floral transition. Plants were grown for two weeks in SDs prior to LD induction. (A) 0 LD, before microdissection. (B) 0 LD, after microdissection. (C) 1 LD, before microdissection. (D) 1 LD, after microdissection. (E) 3 LDs, before microdissection. (F) 3 LDs, after microdissection. 4


5 Supplemental Figure 5. K-means clustering of the up-regulated genes. Genesis software was used to clusters the 202 up-regulated genes. Three (panels (A), (B) and (C)) of the 8 clusters generated are shown in the figure. K-means clustering was performed using Pearson squared as distance. TPM: transcripts per million (see text for details). For each replicate, numbers represent number of long days after shift. 5
 Number of reads of both TAIR annotated ORFs combined show induction similar to that")
 Schematic representation of double annotation of At2G18160 and At2G18162 in TAIR (which")
6 Supplemental Figure 6. Annotation and sequence reads of FTM3 (At2G18160). (A) Number of reads of both TAIR annotated ORFs combined show induction similar to that observed for SOC1. TPM: transcripts per million (see text for details). (B) Schematic representation of double annotation of At2G18160 and At2G18162 in TAIR (which are actually both part of At2G18160). 6

7 7
8 8


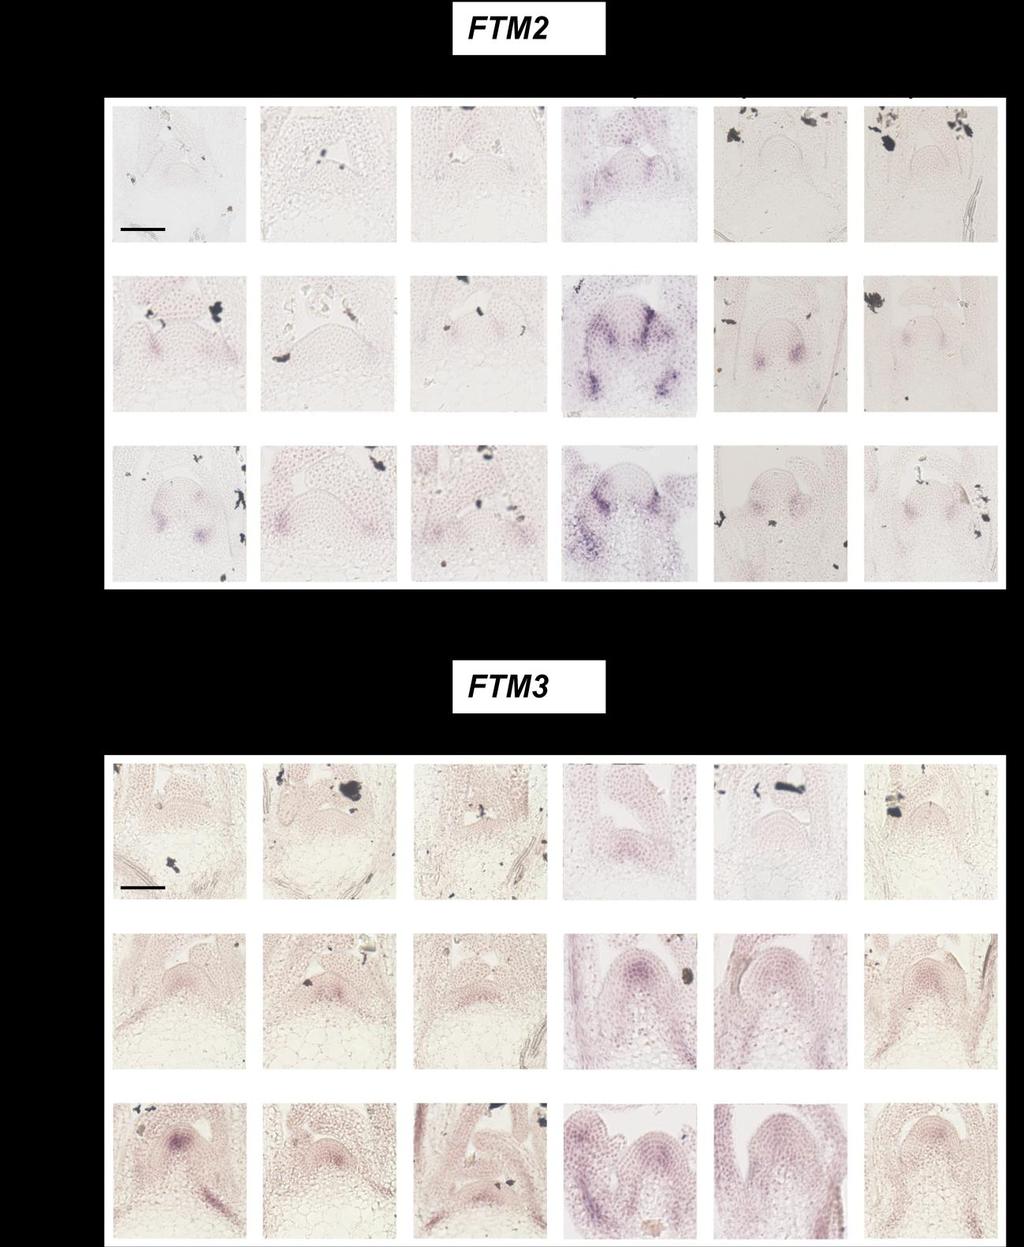
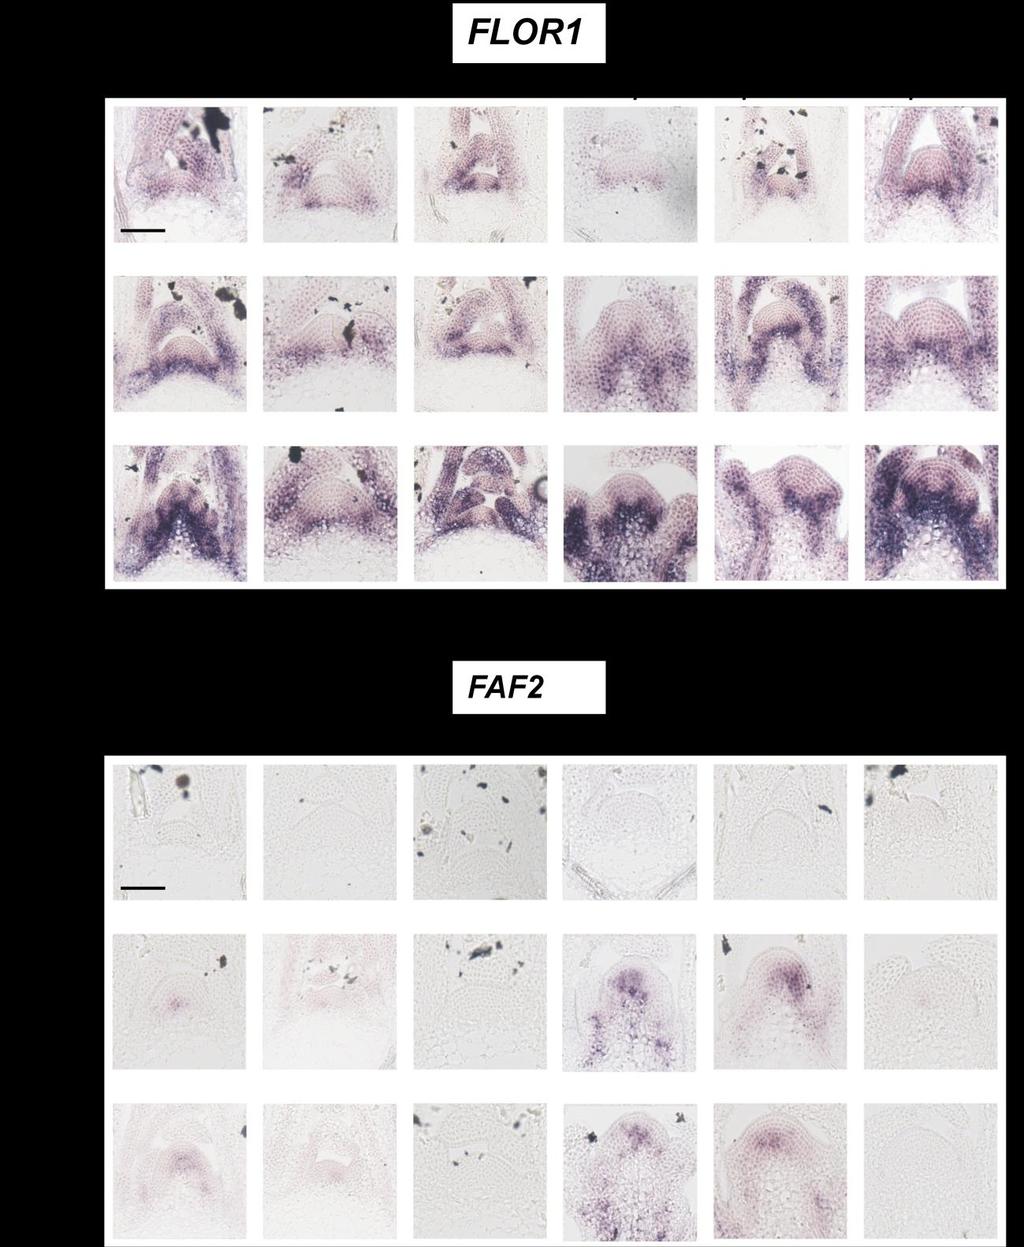
9 Supplemental Figure 7. Time course of in situ hybridizations in different genotypes for genes identified as being upregulated during floral induction. Complete in situ hybridization time courses of on apices of WT Col and the illustrated mutant genotypes grown for two weeks in SDs and then transferred to LDs for 3 and 5 LDs. The genes used as probes are shown on the top of each panel. The svp-41 mutant flowers early under SDs, and therefore these plants were grown for only 10 SDs before transfer. Samples were harvested at ZT8. Scale bar is 50 μm. 9

10 Supplemental Figure 8. Time course analysis of SOC1 expression in Col and ft-10 tsf-1. SOC1 expression upon transfer from SDs to LDs in WT Col and ft-10 tsf-1. Scale bar is 50 µm. 10


11 Supplemental Figure 9. Genetic and molecular analysis of flor1 mutations. (A) Expression of FLOR1 measured by q-rt PCR. The two lines with T-DNA insertions are compared to WT Col. Two biological replicates of the experiment were performed and for each of them three technical replicates were compared in the PCR reaction. Error bars represent standard deviation in one experiment. (B) Flowering time scored as total number of leaves both in LD and SD conditions for flor1-1 allele in combination with other mutations and control lines. At least eight genetically identical plants were used to score flowering time of each genotype. Error bars represent standard deviation. 11
12 Supplemental Table 1. List of primers used in this study. Genotyping soc1-2 SOC1-F TTCTTCTCCCTCCAGTAATGC SOC1-R GAGTTTTGCCCCTCACCATA SALKLB-R TGGTTCACGTAGTGGGCCATCG svp-41 SVP-1F GACCCACTAGTTATCAGCTCAG SVP-1R (wt) AAGTTATGCCTCTCTAGGAC SVP-2R (mut) AAGTTATGCCTCTCTAGGTT ful-2 FULseq2F GCCGAGACGTTTCACAAAGT FULseq2R TTGCCTTGAGCTTAGCATGT flor1-1 and flor1-2 FLOR1-F3 GCATCCACACATAATCACGA FLOR1-R AAGGGGAGTTCCACAAAGAC SALKLB-F TGGTTCACGTAGTGGGCCATCG Real-time PCR ACTIN2 qrt-act-f GGTAACATTGTGCTCAGTGGTGG qrt-act-r AACGACCTTAATCTTCATGCTGC FT FT-F CGAGTAACGAACGGTGATGA FT-R CGCATCACACACTATATAAGTAAAACA SOC1 SOC1small-R GTGATCTCCACTCAACAAAAA SOC1small-R CAACAAGAGAGAAGCAGCTTTA FTM1 FTM1-F CCCGATGCTATTCGAACATT FTM1-R TCTCTCGTCTGCACGCTCT FLOR1 FLOR1-F TCTACGGGAAGATACCACC FLOR1-R AAGGGGAGTTCCACAAAGAC AP1 qap1_f CCTATGGCAATGAGGAGGAA qap1_r CATCGAACATTTGCCAAAATA LFY LFY-RTrw GGTACGCGAAGAAATCAGGA LFY-RTre ATGACGACAAGCGATGTTCA Templates for in situ probes SOC1 SOC1T3-F ATTAACCCTCACTAAAGGGAATCGAGGAGCTGCAACAGAT SOC1T7-R TAATACGACTCACTATAGGGTTGACCAAACTTCGCTTTCA FUL FULT7-R TAATACGACTCACTATAGGGACGTCTCGACAACGGAGTTC FULT3-F ATTAACCCTCACTAAAGGGAGGGGGAAGATCTTGATTCGT FTM1 FTM1-F CCCGATGCTATTCGAACATT FTM1-T7-R TAATACGACTCACTATAGGGTCTCTCGTCTGCACGCT FTM2 FTM2-F CAATGTTGATCTGTCCGGTA FTM2-T7-R TAATACGACTCACTATAGGGCGAGAGATAGCGAAATGAGC FTM3 FTM3-F TTCAATCCAACGGTGCAG FTM3-T7-R TAATACGACTCACTATAGGGCATTAGCCATAATGGGTTGG FLOR1 FLOR1-F TCTACGGGAAGATACCACCA FLOR1-T7-R TAATACGACTCACTATAGGGAAGGGGAGTTCCACAAAGAC FAF2 FAF2-F ATTCAGCAGAAGATGCAAGG FAF2-T7-R TAATACGACTCACTATAGGGTCTCCTCAAGAAATCGTACTAAAAA SPL4 SPL4-F CCAAAATGGAGGGTAAGAGA SPL4-T7-R TAATACGACTCACTATAGGGCTCCGGTGATACAGTTTTGC LFY LFY-F GGAGCGAGTTACATAAACAAGC LFY-T7-R TAATACGACTCACTATAGGGGCATCCACCACGTCCAGA 12
13 Supplemental methods Analysis of the short-sequence reads for the promiscuous counts The reads with poly A or T stretches longer than 8 bp or more than one unknown position, N, where discarded. Afterwards, they were trimmed to the first position from the tail with a quality value above 25 with the FASTX toolkit (available at The trimmed reads were purged from clonal reads, i.e., reads that start with the exact same sequence and could be artifacts from multiple sequencing of the same molecule. The remaining reads were mapped to the TAIR9 genome with bowtie (Langmead et al., 2009), allowing for three mismatches and only uniquely mapping reads were counted. The unmapped reads were remapped with BLAST (Altschul et al., 1990) towards the TAIR9 cdna sequences in order to extract reads that hit splice junctions. Many of the gene models in Arabidopsis thaliana overlap each other on the genome, e.g., splice variants. While it is not possible to designate the origin of reads mapping within a region present in several gene models, all gene models were clustered on overlap with single linkage. To generate the input data for differential expression analysis, we counted the reads overlapping these clusters, rather than the gene models. Supplemental references Langmead, B., Trapnell, C., Pop, M., and Salzberg, S.L. (2009) Ultrafast and memoryefficient alignment of short DNA sequences to the human genome. Genome Biol 10:R25. Altschul, S.F., Gish, W., Miller, W., Myers, E.W., and Lipman, D.J. (1990). Basic local alignment search tool. J Mol Biol 215,
A Repressor Complex Governs the Integration of
 Developmental Cell 15 Supplemental Data A Repressor Complex Governs the Integration of Flowering Signals in Arabidopsis Dan Li, Chang Liu, Lisha Shen, Yang Wu, Hongyan Chen, Masumi Robertson, Chris A.
SUPPLEMENTARY INFORMATION
 AS-NMD modulates FLM-dependent thermosensory flowering response in Arabidopsis NATURE PLANTS www.nature.com/natureplants 1 Supplementary Figure 1. Genomic sequence of FLM along with the splice sites. Sequencing
Supplemental Data. mir156-regulated SPL Transcription. Factors Define an Endogenous Flowering. Pathway in Arabidopsis thaliana
 Cell, Volume 138 Supplemental Data mir156-regulated SPL Transcription Factors Define an Endogenous Flowering Pathway in Arabidopsis thaliana Jia-Wei Wang, Benjamin Czech, and Detlef Weigel Table S1. Interaction
Supplemental Data. Na Xu et al. (2016). Plant Cell /tpc
. Plant Cell /tpc") Supplemental Figure 1. The weak fluorescence phenotype is not caused by the mutation in At3g60240. (A) A mutation mapped to the gene At3g60240. Map-based cloning strategy was used to map the mutated site
Supplemental Figure 1. The weak fluorescence phenotype is not caused by the mutation in At3g60240. (A) A mutation mapped to the gene At3g60240. Map-based cloning strategy was used to map the mutated site
- 1 - Supplemental Data
 - 1-1 Supplemental Data 2 3 4 5 6 7 8 9 Supplemental Figure S1. Differential expression of AtPIP Genes in DC3000-inoculated plants. Gene expression in leaves was analyzed by real-time RT-PCR and expression
Supplemental Data. Zhou et al. (2016). Plant Cell /tpc
. Plant Cell /tpc") Supplemental Figure 1. Confirmation of mutant mapping results. (A) Complementation assay with stably transformed genomic fragments (ComN-N) (2 kb upstream of TSS and 1.5 kb downstream of TES) and CaMV
Supplemental Figure 1. Confirmation of mutant mapping results. (A) Complementation assay with stably transformed genomic fragments (ComN-N) (2 kb upstream of TSS and 1.5 kb downstream of TES) and CaMV
Supplementary Figure 1. jmj30-2 and jmj32-1 produce null mutants. (a) Schematic drawing of JMJ30 and JMJ32 genome structure showing regions amplified
 Schematic drawing of JMJ30 and JMJ32 genome structure showing regions amplified") Supplementary Figure 1. jmj30-2 and jmj32-1 produce null mutants. (a) Schematic drawing of JMJ30 and JMJ32 genome structure showing regions amplified by primers used for mrna expression analysis. Gray
Supplementary Figure 1. jmj30-2 and jmj32-1 produce null mutants. (a) Schematic drawing of JMJ30 and JMJ32 genome structure showing regions amplified by primers used for mrna expression analysis. Gray
Supplemental Data. Meng et al. (2011). Plant Cell /tpc B73 CML311 CML436. Gaspé Flint
. Plant Cell /tpc B73 CML311 CML436. Gaspé Flint") Gaspé Flint B73 CML311 CML436 A B C D 10 th leaf 10 th leaf 10 th leaf Supplemental Figure 1. Whole plant images of the four varieties used in this study (A) Extreme early flowering temperate line Gaspé
Gaspé Flint B73 CML311 CML436 A B C D 10 th leaf 10 th leaf 10 th leaf Supplemental Figure 1. Whole plant images of the four varieties used in this study (A) Extreme early flowering temperate line Gaspé
Supplemental Figure 1.
 Supplemental Data. Charron et al. Dynamic landscapes of four histone modifications during de-etiolation in Arabidopsis. Plant Cell (2009). 10.1105/tpc.109.066845 Supplemental Figure 1. Immunodetection
Using mutants to clone genes
 Using mutants to clone genes Objectives: 1. What is positional cloning? 2. What is insertional tagging? 3. How can one confirm that the gene cloned is the same one that is mutated to give the phenotype
A subclass of HSP70s regulate development and abiotic stress responses in Arabidopsis thaliana
 1 2 3 4 5 6 7 8 9 10 11 12 13 14 15 16 17 18 19 20 21 Journal of Plant Research A subclass of HSP70s regulate development and abiotic stress responses in Arabidopsis thaliana Linna Leng 1 Qianqian Liang
Nature Genetics: doi: /ng Supplementary Figure 1. ChIP-seq genome browser views of BRM occupancy at previously identified BRM targets.
 Supplementary Figure 1 ChIP-seq genome browser views of BRM occupancy at previously identified BRM targets. Gene structures are shown underneath each panel. Supplementary Figure 2 pref6::ref6-gfp complements
Figure S1. Figure S2 RT-PCR. qpcr RT-PCR. Northern. IVSwt ΔIVS IVS IVS IVS. NTC mock IVSwt ΔIVS IVS IVS. mock IVSwt ΔIVS
 Figure S1 40 cycles IVS IVS IVS NTC wt Δ Δ mut pri-mirna163 * Fig. S1 Transcripts generated from the MIR163 gene variants in which splice sites have been mutated are not spliced. products were separated
Supplemental Data. Wu and Xue (2010). Plant Cell /tpc
. Plant Cell /tpc") Supplemental Data. Wu and Xue (21). Plant Cell 1.115/tpc.11.75564 A P1-S P1-A P2-S P2-A P3-S P3-A P4-S P4-A B Relative expression Relative expression C 5. 4.5 4. 3.5 3. 2.5 2. 1.5 1..5 5. 4.5 4. 3.5 3.
Supplemental Data. Wu and Xue (21). Plant Cell 1.115/tpc.11.75564 A P1-S P1-A P2-S P2-A P3-S P3-A P4-S P4-A B Relative expression Relative expression C 5. 4.5 4. 3.5 3. 2.5 2. 1.5 1..5 5. 4.5 4. 3.5 3.
PIE1 ARP6 SWC6 KU70 ARP6 PIE1. HSA SNF2_N HELICc SANT. pie1-3 A1,A2 K1,K2 K1,K3 K3,LB2 A3, A4 A3,LB1 A1,A2 K1,K2 K1,K3. swc6-1 A3,A4.
 A B N-terminal SWC2 H2A.Z SWC6 ARP6 PIE1 HSA SNF2_N HELICc SANT C pie1-3 D PIE1 ARP6 5 Kb A1 200 bp A3 A2 LB1 arp6-3 A4 E A1,A2 A3, A4 A3,LB1 K1,K2 K1,K3 K3,LB2 SWC6 swc6-1 A1,A2 A3,A4 K1,K2 K1,K3 100
Supplemental Data. Cui et al. (2012). Plant Cell /tpc a b c d. Stem UBC32 ACTIN
. Plant Cell /tpc a b c d. Stem UBC32 ACTIN") A Root Stem Leaf Flower Silique Senescence leaf B a b c d UBC32 ACTIN C * Supplemental Figure 1. Expression Pattern and Protein Sequence of UBC32 Homologues in Yeast, Human, and Arabidopsis. (A) Expression
A Root Stem Leaf Flower Silique Senescence leaf B a b c d UBC32 ACTIN C * Supplemental Figure 1. Expression Pattern and Protein Sequence of UBC32 Homologues in Yeast, Human, and Arabidopsis. (A) Expression
Supplementary Figure 1 qrt-pcr expression analysis of NLP8 with and without KNO 3 during germination.
 Supplementary Figure 1 qrt-pcr expression analysis of NLP8 with and without KNO 3 during germination. Seeds of Col-0 were harvested from plants grown at 16 C, stored for 2 months, imbibed for indicated
Supplemental Data. Guo et al. (2015). Plant Cell /tpc
. Plant Cell /tpc") Supplemental Figure 1. The Mutant exb1-d Displayed Pleiotropic Phenotypes and Produced Branches in the Axils of Cotyledons. (A) Branches were developed in exb1-d but not in wild-type plants. (B) and (C)
Supplemental Figure 1. The Mutant exb1-d Displayed Pleiotropic Phenotypes and Produced Branches in the Axils of Cotyledons. (A) Branches were developed in exb1-d but not in wild-type plants. (B) and (C)
Construction of plant complementation vector and generation of transgenic plants
 MATERIAL S AND METHODS Plant materials and growth conditions Arabidopsis ecotype Columbia (Col0) was used for this study. SALK_072009, SALK_076309, and SALK_027645 were obtained from the Arabidopsis Biological
The RAD51pro::GFP strain was created using the standard agrobacterium-mediated floral
 SUPPLEMENTAL EXPERIMENTAL PROCEDURES Generation of the RAD51pro::GFP transgene The RAD51pro::GFP strain was created using the standard agrobacterium-mediated floral dip transformation on atxr5/6 mutants
Supplementary Materials: 1. Supplementary Figures S1-S9. 2. Supplementary Tables S1-S2
 Supplementary Materials: 1. Supplementary Figures S1-S9 2. Supplementary Tables S1-S2 S1 1. Supplementary Figures Fig. S1. Genotypes of tcp20 mutants. Fig. S2. Root phenotypes of tcp20 mutants. Fig. S3.
REFERENCES 1. Fujita PA, Rhead B, Zweig AS, et al. The UCSC Genome Browser database: update Nucleic Acids Res Langmead B, Trapnell C,
 Ligation-mediated PCR to amplify transposon junction sequences This procedure is described in detail elsewhere (Brett, BT et al., in preparation). Briefly, 1-2 µg of genomic DNA extracted from SB-induced
Supplementary Information. The flowering gene SINGLE FLOWER TRUSS drives heterosis for yield in tomato
 Supplementary Information The flowering gene SINGLE FLOWER TRUSS drives heterosis for yield in tomato Uri Krieger 1, Zachary B. Lippman 2 *, and Dani Zamir 1 * 1. The Hebrew University of Jerusalem Faculty
Supplemental Data. Benstein et al. (2013). Plant Cell /tpc
. Plant Cell /tpc") Supplemental Figure 1. Purification of the heterologously expressed PGDH1, PGDH2 and PGDH3 enzymes by Ni-NTA affinity chromatography. Protein extracts (2 µl) of different fractions (lane 1 = total extract,
Supplemental Figure 1. Purification of the heterologously expressed PGDH1, PGDH2 and PGDH3 enzymes by Ni-NTA affinity chromatography. Protein extracts (2 µl) of different fractions (lane 1 = total extract,
Fig. S1. Clustering analysis of expression array and ChIP-PCR assay in the ARF3 locus. (A) Typical examples of the transgenic plants used for
 Typical examples of the transgenic plants used for") Fig. S1. Clustering analysis of expression array and ChIP-PCR assay in the ARF3 locus. (A) Typical examples of the transgenic plants used for ChIP-chip and ChIP-PCR assays. The presence of pas1:t7:as1
Fig. S1. Clustering analysis of expression array and ChIP-PCR assay in the ARF3 locus. (A) Typical examples of the transgenic plants used for ChIP-chip and ChIP-PCR assays. The presence of pas1:t7:as1
Transcriptomics analysis with RNA seq: an overview Frederik Coppens
 Transcriptomics analysis with RNA seq: an overview Frederik Coppens Platforms Applications Analysis Quantification RNA content Platforms Platforms Short (few hundred bases) Long reads (multiple kilobases)
Annotation and the analysis of annotation terms. Brian J. Knaus USDA Forest Service Pacific Northwest Research Station
 Annotation and the analysis of annotation terms. Brian J. Knaus USDA Forest Service Pacific Northwest Research Station 1 Library preparation Sequencing Hypothesis testing Bioinformatics 2 Why annotate?
A Naturally Occurring Epiallele associates with Leaf Senescence and Local Climate Adaptation in Arabidopsis accessions He et al.
 A Naturally Occurring Epiallele associates with Leaf Senescence and Local Climate Adaptation in Arabidopsis accessions He et al. Supplementary Notes Origin of NMR19 elements Because there are two copies
Supplementary Fig. 1. Microscopic image of cotyledon adaxial epidermis of 3-dayold Col, epf2-1, ros1-4 and rdd. Scale bar, 100 m.
 Supplementary Fig. 1. Microscopic image of cotyledon adaxial epidermis of 3-dayold Col, epf2-1, ros1-4 and rdd. Scale bar, 100 m. Supplementary Fig. 2. The small-cell-cluster phenotype of different ros1
0.5% Sucrose. Supplemental Data. Chao et al. (2011). Plant Cell /tpc Col-0 tsc10a-2. Root length (mm)
. Plant Cell /tpc Col-0 tsc10a-2. Root length (mm)") A 0% 0.5% 1% Col-0 tsc10a-2 B Root length (mm) 35 30 25 20 15 10 5 0 0% 0.50% 1% 2% 4% Sucrose concentration 2% 4% Sucrose Col-0 tsc10a-2 Supplemental Figure 1. The effect of sucrose on root growth of
A 0% 0.5% 1% Col-0 tsc10a-2 B Root length (mm) 35 30 25 20 15 10 5 0 0% 0.50% 1% 2% 4% Sucrose concentration 2% 4% Sucrose Col-0 tsc10a-2 Supplemental Figure 1. The effect of sucrose on root growth of
Poly-A signals. amirna. pentr/d-topo for Gateway cloning
 popon inducible system A Poly-A signals CaMV 35S minimal promoter TMV omega translational enhancer HYG KAN RR 35S 35S LhGR GUS Ω pop6 Ω Gene construct B - Dex + Dex CACC prs300 (mir319a) CACC amirna pentr/d-topo
Supplemental Figure 1. Transcript profiles of Arabidopsis IPMS1 and IPMS2 in different tissues and developmental stages.
 Transcript level (intensity) Supplemental Data. Xing et al. Plant Cell (2017) 10.1105/tpc.17.00186 1600 1400 1200 1000 800 600 400 200 0 IPMS1 IPMS2 Supplemental Figure 1. Transcript profiles of Arabidopsis
SUPPLEMENTARY INFORMATION
 Ca 2+ /calmodulin Regulates Salicylic Acid-mediated Plant Immunity Liqun Du, Gul S. Ali, Kayla A. Simons, Jingguo Hou, Tianbao Yang, A.S.N. Reddy and B. W. Poovaiah * *To whom correspondence should be
Alternative Cleavage and Polyadenylation of RNA
 Developmental Cell 18 Supplemental Information The Spen Family Protein FPA Controls Alternative Cleavage and Polyadenylation of RNA Csaba Hornyik, Lionel C. Terzi, and Gordon G. Simpson Figure S1, related
Intron distance to transcription start (nt)*
*") Schwab et al. SOM: Enhanced microrna accumulation through stemloop-adjacent introns 1 Supplemental Table 1. Characteristics of introns used in this study Intron name Length intron (nt) Length cloned fragment
Schwab et al. SOM: Enhanced microrna accumulation through stemloop-adjacent introns 1 Supplemental Table 1. Characteristics of introns used in this study Intron name Length intron (nt) Length cloned fragment
Supplemental Data. Sethi et al. (2014). Plant Cell /tpc
. Plant Cell /tpc") Supplemental Data Supplemental Figure 1. MYC2 Binds to the E-box but not the E1-box of the MPK6 Promoter. (A) E1-box and E-box (wild type) containing MPK6 promoter fragment. The region shown in red denotes
Supplemental Data Supplemental Figure 1. MYC2 Binds to the E-box but not the E1-box of the MPK6 Promoter. (A) E1-box and E-box (wild type) containing MPK6 promoter fragment. The region shown in red denotes
Nature Genetics: doi: /ng.3556 INTEGRATED SUPPLEMENTARY FIGURE TEMPLATE. Supplementary Figure 1
 INTEGRATED SUPPLEMENTARY FIGURE TEMPLATE Supplementary Figure 1 REF6 expression in transgenic lines. (a,b) Expression of REF6 in REF6-HA ref6 and REF6ΔZnF-HA ref6 plants detected by RT qpcr (a) and immunoblot
The homeo'c gene AGAMOUS (AG) in Arabidopsis. Presenta'on by: Yang Liu and Zhonghang Zhang (Daisy) February 27th, 2018
 in Arabidopsis. Presenta'on by: Yang Liu and Zhonghang Zhang (Daisy) February 27th, 2018") The homeo'c gene AGAMOUS (AG) in Arabidopsis Presenta'on by: Yang Liu and Zhonghang Zhang (Daisy) February 27th, 2018 Arabidopsis Flower George Haughn, UBC Genes Direc'ng Flower Development in Arabidopsis
The homeo'c gene AGAMOUS (AG) in Arabidopsis Presenta'on by: Yang Liu and Zhonghang Zhang (Daisy) February 27th, 2018 Arabidopsis Flower George Haughn, UBC Genes Direc'ng Flower Development in Arabidopsis
Biotechnology. Chapter 20. Biology Eighth Edition Neil Campbell and Jane Reece. PowerPoint Lecture Presentations for
 Chapter 20 Biotechnology PowerPoint Lecture Presentations for Biology Eighth Edition Neil Campbell and Jane Reece Lectures by Chris Romero, updated by Erin Barley with contributions from Joan Sharp Copyright
Combinatorial activities of SHORT VEGETATIVE PHASE and FLOWERING LOCUS C define distinct modes of flowering regulation in Arabidopsis
 Mateos et al. Genome Biology (2015) 16:31 DOI 10.1186/s13059-015-0597-1 RESEARCH Open Access Combinatorial activities of SHORT VEGETATIVE PHASE and FLOWERING LOCUS C define distinct modes of flowering
Supplemental Data. Wang et al. Plant Cell. (2013) /tpc
 /tpc") SNL1 SNL Supplemental Figure 1. The Expression Patterns of SNL1 and SNL in Different Tissues of Arabidopsis from Genevestigator Web Site (https://www.genevestigator.com/gv/index.jsp). 1 A 1. 1..8.6.4..
SNL1 SNL Supplemental Figure 1. The Expression Patterns of SNL1 and SNL in Different Tissues of Arabidopsis from Genevestigator Web Site (https://www.genevestigator.com/gv/index.jsp). 1 A 1. 1..8.6.4..
File name: Supplementary Information Description: Supplementary figures and supplementary tables. File name: Peer review file Description:
 File name: Supplementary Information Description: Supplementary figures and supplementary tables. File name: Peer review file Description: Supplementary Figure 1. dcas9-mq1 fusion protein induces de novo
 http://fire.biol.wwu.edu/trent/trent/direct_detection_of_genotype.html 1 Like most other model organism Arabidopsis thaliana has a sequenced genome? What do we mean by sequenced genome? What sort of info
SUPPLEMENTARY INFORMATION
 Gene replacements and insertions in rice by intron targeting using CRISPR Cas9 Table of Contents Supplementary Figure 1. sgrna-induced targeted mutations in the OsEPSPS gene in rice protoplasts. Supplementary
Using mutants to clone genes
 Using mutants to clone genes Objectives 1. What is positional cloning? 2. What is insertional tagging? 3. How can one confirm that the gene cloned is the same one that is mutated to give the phenotype
Activation of a Floral Homeotic Gene in Arabidopsis
 Activation of a Floral Homeotic Gene in Arabidopsis By Maximiliam A. Busch, Kirsten Bomblies, and Detlef Weigel Presentation by Lis Garrett and Andrea Stevenson http://ucsdnews.ucsd.edu/archive/graphics/images/image5.jpg
Supplementary Information
 Supplementary Information MED18 interaction with distinct transcription factors regulates plant immunity, flowering time and responses to hormones Supplementary Figure 1. Diagram showing T-DNA insertion
Supplemental data. Zhao et al. (2009). The Wuschel-related homeobox gene WOX11 is required to activate shoot-borne crown root development in rice.
. The Wuschel-related homeobox gene WOX11 is required to activate shoot-borne crown root development in rice.") Supplemental data. Zhao et al. (2009). The Wuschel-related homeobox gene WOX11 is required to activate shoot-borne crown root development in rice. A B Supplemental Figure 1. Expression of WOX11p-GUS WOX11-GFP
Supplemental data. Zhao et al. (2009). The Wuschel-related homeobox gene WOX11 is required to activate shoot-borne crown root development in rice. A B Supplemental Figure 1. Expression of WOX11p-GUS WOX11-GFP
DAY 1 DAY 2 DAY 3. GUS activity. Time h (ZT) Cluster 1. Cluster 2 Cluster 3. Cluster 4. Cluster 5. Cluster 6
 Cluster 1. Cluster 2 Cluster 3. Cluster 4. Cluster 5. Cluster 6") Supplemental Data. Giraud et al. (21). Plant Cell 1.115/tpc.11.74518 A) B) 6 5 4 3 2 1 DAY 1 2 15 1 5 IP SITE II DAY 2 7 6 5 4 3 2 1 IP SITE II DAY 3 IP SITE II ealtive transcript abundance 12 1 75 5 25
Supplemental Data. Giraud et al. (21). Plant Cell 1.115/tpc.11.74518 A) B) 6 5 4 3 2 1 DAY 1 2 15 1 5 IP SITE II DAY 2 7 6 5 4 3 2 1 IP SITE II DAY 3 IP SITE II ealtive transcript abundance 12 1 75 5 25
TECH NOTE Pushing the Limit: A Complete Solution for Generating Stranded RNA Seq Libraries from Picogram Inputs of Total Mammalian RNA
 TECH NOTE Pushing the Limit: A Complete Solution for Generating Stranded RNA Seq Libraries from Picogram Inputs of Total Mammalian RNA Stranded, Illumina ready library construction in
Supplemental Data. Sentandreu et al. (2011). Plant Cell /tpc
. Plant Cell /tpc") SUPPLEMENTAL ANALYSIS 1. Definition of the PIF3-regulated transcriptome in the dark. We applied an ANOVA approach using the Rosetta Resolver platform to look for genes whose expression was statistically
SUPPLEMENTAL ANALYSIS 1. Definition of the PIF3-regulated transcriptome in the dark. We applied an ANOVA approach using the Rosetta Resolver platform to look for genes whose expression was statistically
Supplemental materials
 Supplemental materials Materials and methods for supplemental figures Yeast two-hybrid assays TAP46-PP2Ac interactions I. The TAP46 was used as the bait and the full-length cdnas of the five C subunits
Experimental Design. Sequencing. Data Quality Control. Read mapping. Differential Expression analysis
 -Seq Analysis Quality Control checks Reproducibility Reliability -seq vs Microarray Higher sensitivity and dynamic range Lower technical variation Available for all species Novel transcript identification
SUPPLEMENTARY INFORMATION
 SUPPLEMENTARY INFORMATION doi:10.1038/nature12474 Supplementary Figure 1 Analysis of mtdna mutation loads in different types of mtdna mutator mice. a, PCR, cloning, and sequencing analysis of mtdna mutations
6/256 1/256 0/256 1/256 2/256 7/256 10/256. At3g06290 (SAC3B)
") Chr.III M 5M 1M 15M 2M 23M BAC clones F22F7 F1A16 F24F17 F24P17 T8E24 F17A9 F21O3 F17A17 F18C1 F2O1 F28L1 F5E6 F3E22 T1B9 MLP3 Number of recombinants 6/256 1/256 /256 1/256 2/256 7/256 1/256 At3g629 (SAC3B)
Chr.III M 5M 1M 15M 2M 23M BAC clones F22F7 F1A16 F24F17 F24P17 T8E24 F17A9 F21O3 F17A17 F18C1 F2O1 F28L1 F5E6 F3E22 T1B9 MLP3 Number of recombinants 6/256 1/256 /256 1/256 2/256 7/256 1/256 At3g629 (SAC3B)
Supplementary Fig 1. The responses of ERF109 to different hormones and stresses. (a to k) The induced expression of ERF109 in 7-day-old Arabidopsis
 The induced expression of ERF109 in 7-day-old Arabidopsis") Supplementary Fig 1. The responses of ERF109 to different hormones and stresses. (a to k) The induced expression of ERF109 in 7-day-old Arabidopsis seedlings expressing ERF109pro-GUS. The GUS staining
Supplementary Fig 1. The responses of ERF109 to different hormones and stresses. (a to k) The induced expression of ERF109 in 7-day-old Arabidopsis seedlings expressing ERF109pro-GUS. The GUS staining
Supplemental Data. Li et al. (2015). Plant Cell /tpc
. Plant Cell /tpc") Supplemental Data Supplemental Figure 1: Characterization of asr3 T-DNA knockout lines and complementation transgenic lines. (A) The scheme of At2G33550 (ASR3) with gray boxes indicating exons and dash
Supplemental Data Supplemental Figure 1: Characterization of asr3 T-DNA knockout lines and complementation transgenic lines. (A) The scheme of At2G33550 (ASR3) with gray boxes indicating exons and dash
Supplemental Data. Jing et al. (2013). Plant Cell /tpc
. Plant Cell /tpc") Supplemental Figure 1. Characterization of epp1 Mutants. (A) Cotyledon angles of 5-d-old Col wild-type (gray bars) and epp1-1 (black bars) seedlings under red (R), far-red (FR) and blue (BL) light conditions,
Supplemental Figure 1. Characterization of epp1 Mutants. (A) Cotyledon angles of 5-d-old Col wild-type (gray bars) and epp1-1 (black bars) seedlings under red (R), far-red (FR) and blue (BL) light conditions,
Introduction to Short Read Alignment. UCD Genome Center Bioinformatics Core Tuesday 14 June 2016
 Introduction to Short Read Alignment UCD Genome Center Bioinformatics Core Tuesday 14 June 2016 From reads to molecules Why align? Individual A Individual B ATGATAGCATCGTCGGGTGTCTGCTCAATAATAGTGCCGTATCATGCTGGTGTTATAATCGCCGCATGACATGATCAATGG
SUPPLEMENTARY INFORMATION
 doi:10.1038/nature09861 & &' -(' ()*+ ')(+,,(','-*+,&,,+ ',+' ' 23,45/0*6787*9:./09 ;78?4?@*+A786?B- &' )*+*(,-* -(' ()*+ ')(+,,(','-*+,&,,+ ',+'./)*+*(,-*..)*+*(,-*./)*+*(,-*.0)*+*(,-*..)*+*(,-*
SUPPLEMENTARY INFORMATION
 SUPPLEMENTARY INFORMATION doi:10.1038/nature10928 Materials and Methods 1. Plant material and growth conditions. All plant lines used were in Col-0 background unless otherwise specified. pif4-101 mutant
Supplemental Data. Farmer et al. (2010) Plant Cell /tpc
 Plant Cell /tpc") Supplemental Figure 1. Amino acid sequence comparison of RAD23 proteins. Identical and similar residues are shown in the black and gray boxes, respectively. Dots denote gaps. The sequence of plant Ub is
Supplemental Figure 1. Amino acid sequence comparison of RAD23 proteins. Identical and similar residues are shown in the black and gray boxes, respectively. Dots denote gaps. The sequence of plant Ub is
Recent technology allow production of microarrays composed of 70-mers (essentially a hybrid of the two techniques)
") Microarrays and Transcript Profiling Gene expression patterns are traditionally studied using Northern blots (DNA-RNA hybridization assays). This approach involves separation of total or polya + RNA on
Microarrays and Transcript Profiling Gene expression patterns are traditionally studied using Northern blots (DNA-RNA hybridization assays). This approach involves separation of total or polya + RNA on
Schematic representation of the endogenous PALB2 locus and gene-disruption constructs
 Supplementary Figures Supplementary Figure 1. Generation of PALB2 -/- and BRCA2 -/- /PALB2 -/- DT40 cells. (A) Schematic representation of the endogenous PALB2 locus and gene-disruption constructs carrying
AD BD TOC1. Supplementary Figure 1: Yeast two-hybrid assays showing the interaction between
 AD X BD TOC1 AD BD X PIFΔAD PIF TOC1 TOC1 PIFΔAD PIF N TOC1 TOC1 C1 PIFΔAD PIF C1 TOC1 TOC1 C PIFΔAD PIF C TOC1 Supplementary Figure 1: Yeast two-hybrid assays showing the interaction between PIF and TOC1
Supplementary Data 1.
 Supplementary Data 1. Evaluation of the effects of number of F2 progeny to be bulked (n) and average sequencing coverage (depth) of the genome (G) on the levels of false positive SNPs (SNP index = 1).
Functional conservation and diversification of the soybean maturity gene E1 and its homologs in legumes
 Functional conservation and diversification of the soybean maturity gene E1 and its homologs in legumes Xingzheng Zhang 1,2#, Hong Zhai 1#, Yaying Wang 1,2, Xiaojie Tian 1,2, Yupeng Zhang 1,2, Hongyan
Standard Data Analysis Report Agilent Gene Expression Service
 Standard Data Analysis Report Agilent Gene Expression Service Experiment: S534662 Date: 2011-01-01 Prepared for: Dr. Researcher Genomic Sciences Lab Prepared by S534662 Standard Data Analysis Report 2011-01-01
Two Mark question and Answers
 1. Define Bioinformatics Two Mark question and Answers Bioinformatics is the field of science in which biology, computer science, and information technology merge into a single discipline. There are three
Supplemental Data Supplemental Figure 1.
 Supplemental Data Supplemental Figure 1. Silique arrangement in the wild-type, jhs, and complemented lines. Wild-type (WT) (A), the jhs1 mutant (B,C), and the jhs1 mutant complemented with JHS1 (Com) (D)
Supplementary Figures
 Supplementary Figures A B Supplementary Figure 1. Examples of discrepancies in predicted and validated breakpoint coordinates. A) Most frequently, predicted breakpoints were shifted relative to those derived
Nature Methods: doi: /nmeth Supplementary Figure 1. Pilot CrY2H-seq experiments to confirm strain and plasmid functionality.
 Supplementary Figure 1 Pilot CrY2H-seq experiments to confirm strain and plasmid functionality. (a) RT-PCR on HIS3 positive diploid cell lysate containing known interaction partners AT3G62420 (bzip53)
Supplementary Figure 1
 Supplementary Figure 1 Supplementary Fig. 1 shrna mediated knockdown of ZRSR2 in K562 and 293T cells. (a) ZRSR2 transcript levels in stably transduced K562 cells were determined using qrt-pcr. GAPDH was
RNA-Sequencing analysis
 RNA-Sequencing analysis Markus Kreuz 25. 04. 2012 Institut für Medizinische Informatik, Statistik und Epidemiologie Content: Biological background Overview transcriptomics RNA-Seq RNA-Seq technology Challenges
Supplemental Figure 1
 Supplemental Figure 1 A LK sls1 lks1-2 F 1 sls1 B LK sls1 lks1-2 F 1 lks1-2 sls1 F 1 lks1-2 sls1 F 2 Col lks1-2 Col+LKS1 Col Col+LKS1 Supplemental Figure 1. Genetic analysis of sls1 mutant. (A) and (B)
GREG GIBSON SPENCER V. MUSE
 A Primer of Genome Science ience THIRD EDITION TAGCACCTAGAATCATGGAGAGATAATTCGGTGAGAATTAAATGGAGAGTTGCATAGAGAACTGCGAACTG GREG GIBSON SPENCER V. MUSE North Carolina State University Sinauer Associates, Inc.
SUPPLEMENTAL FILES. Supplemental Figure 1. Expression domains of Arabidopsis HAM orthologs in both shoot meristem and root tissues.
 SUPPLEMENTAL FILES SUPPLEMENTAL FIGURE LEGENDS Supplemental Figure 1. Expression domains of Arabidopsis HAM orthologs in both shoot meristem and root tissues. RT-PCR amplification of AtHAM1, AtHAM2, AtHAM3,
Supplementary Information
 Supplementary Information Supplementary Fig. 1. Seed dormancy and germination responses of RVE1 and PIF1. (a) Diagram of RVE1 and the T-DNA insertion of the rve1-2 mutant (SAIL_326_A01). Black boxes represent
Chapter 20 Biotechnology
 Chapter 20 Biotechnology Manipulation of DNA In 2007, the first entire human genome had been sequenced. The ability to sequence an organisms genomes were made possible by advances in biotechnology, (the
Genome annotation & EST
 Genome annotation & EST What is genome annotation? The process of taking the raw DNA sequence produced by the genome sequence projects and adding the layers of analysis and interpretation necessary
Wheat TILLING Mutants Show That the Vernalization Gene VRN1 Down-Regulates the Flowering Repressor VRN2 in Leaves but Is Not Essential for Flowering
 Wheat TILLING Mutants Show That the Vernalization Gene VRN1 Down-Regulates the Flowering Repressor VRN2 in Leaves but Is Not Essential for Flowering Andrew Chen 1, Jorge Dubcovsky 1,2,3 * 1 Department
Supplementary Figure 1. Homozygous rag2 E450fs mutants are healthy and viable similar to wild-type and heterozygous siblings.
 Supplementary Figure 1 Homozygous rag2 E450fs mutants are healthy and viable similar to wild-type and heterozygous siblings. (left) Representative bright-field images of wild type (wt), heterozygous (het)
Nature Methods: doi: /nmeth Supplementary Figure 1. DMS-MaPseq data are highly reproducible at elevated DMS concentrations.
 Supplementary Figure 1 DMS-MaPseq data are highly reproducible at elevated DMS concentrations. a, Correlation of Gini index for 202 yeast mrna regions with 15x coverage at 2.5% or 5% v/v DMS concentrations
How to deal with your RNA-seq data?
 How to deal with your RNA-seq data? Rachel Legendre, Thibault Dayris, Adrien Pain, Claire Toffano-Nioche, Hugo Varet École de bioinformatique AVIESAN-IFB 2017 1 Rachel Legendre Bioinformatics 27/11/2018
High-throughput genotyping of CRISPR/Cas9-mediated mutants using fluorescent
 High-throughput genotyping of CRISPR/Cas9-mediated mutants using fluorescent PCR-capillary gel electrophoresis Muhammad Khairul RAMLEE, Tingdong YAN, Alice M. S. CHEUNG, Charles CHUAH, Shang LI Figure
Mapping Next Generation Sequence Reads. Bingbing Yuan Dec. 2, 2010
 Mapping Next Generation Sequence Reads Bingbing Yuan Dec. 2, 2010 1 What happen if reads are not mapped properly? Some data won t be used, thus fewer reads would be aligned. Reads are mapped to the wrong
Supplementary information
 Supplementary information Supplementary figures Figure S1 Level of mycdet1 protein in DET1 OE-1, OE-2 and OE-3 transgenic lines. Total protein extract from wild type Col0, det1-1 mutant and DET1 OE lines
Supplemental Figure 1 A
 Supplemental Figure 1 A Supplemental Data. Han et al. (2016). Plant Cell 10.1105/tpc.15.00997 BamHI -1616 bp SINE repeats SalI ATG SacI +1653 bp HindIII LB HYG p35s pfwa LUC Tnos RB pfwa-bamhi-f: CGGGATCCCGCCTTTCTCTTCCTCATCTGC
From Variants to Pathways: Agilent GeneSpring GX s Variant Analysis Workflow
 From Variants to Pathways: Agilent GeneSpring GX s Variant Analysis Workflow Technical Overview Import VCF Introduction Next-generation sequencing (NGS) studies have created unanticipated challenges with
AD-FIL AD-YAB2 -2 BD-JAZ3 AD-YAB3 AD-YAB5 AD-FIL -4 3AT BD-JAZ3 AD-YAB3
 3 4 9 10 11 12 AD-FIL AD-YAB5 2 B AD-YAB3 1 BD-JAZ 5 6 7 8 AD-FIL A AD-YAB2 Supplemental Data. Boter et al. (2015). Plant Cell 10.1105/tpc.15.00220 BD AD-YAB2-2 -2 BD-JAZ3 AD-YAB3 BD AD-YAB5-4 AD-FIL -4
Supplemental Information
 Supplemental Information Supplemental Figure 1. The Heterologous Yeast System for Screening of Arabidopsis JA Transporters. (A) Exogenous JA inhibited yeast cell growth. Yeast cells were diluted to various
RNA-sequencing. Next Generation sequencing analysis Anne-Mette Bjerregaard. Center for biological sequence analysis (CBS)
") RNA-sequencing Next Generation sequencing analysis 2016 Anne-Mette Bjerregaard Center for biological sequence analysis (CBS) Terms and definitions TRANSCRIPTOME The full set of RNA transcripts and their
RNA-sequencing Next Generation sequencing analysis 2016 Anne-Mette Bjerregaard Center for biological sequence analysis (CBS) Terms and definitions TRANSCRIPTOME The full set of RNA transcripts and their
Multiplex Assay Design
 Multiplex Assay Design Geeta Bhat, Luminex Molecular Diagnostics; Toronto. APHL/CDC Newborn Screening Molecular Workshop, CDC, Atlanta, GA June 28-30, 2011 Luminex Multiplexed Solutions. For Life. Luminex
Experimental Tools and Resources Available in Arabidopsis. Manish Raizada, University of Guelph, Canada
 Experimental Tools and Resources Available in Arabidopsis Manish Raizada, University of Guelph, Canada Community website: The Arabidopsis Information Resource (TAIR) at http://www.arabidopsis.org Can order
Fig. A1 Characteristics of HepP and its homology to other proteins. Fig. A2 Amino acid sequence of the 78-kDa predicted protein encoded by zbdp
 Additional file 1 This file contains: Fig. A1 Characteristics of HepP and its homology to other proteins Fig. A2 Amino acid sequence of the 78-kDa predicted protein encoded by zbdp Fig. A3 Nucleotide sequences
Supplementary Figures
 Supplementary Figures Supplementary Figure 1 Experimental schema for the identification of circular RNAs in six normal tissues and seven cancerous tissues. Supplementary Fiure 2 Comparison of human circrnas
Figure S1. Characterization of the irx9l-1 mutant. (A) Diagram of the Arabidopsis IRX9L gene drawn based on information from TAIR (the Arabidopsis
 Diagram of the Arabidopsis IRX9L gene drawn based on information from TAIR (the Arabidopsis") 1 2 3 4 5 6 7 8 9 10 11 12 Figure S1. Characterization of the irx9l-1 mutant. (A) Diagram of the Arabidopsis IRX9L gene drawn based on information from TAIR (the Arabidopsis Information Research). Exons
1 2 3 4 5 6 7 8 9 10 11 12 Figure S1. Characterization of the irx9l-1 mutant. (A) Diagram of the Arabidopsis IRX9L gene drawn based on information from TAIR (the Arabidopsis Information Research). Exons
Supplementary Materials
 Supplementary Materials Table S1. Oligonucleotide sequences and PCR conditions used to amplify the indicated genes. TA = annealing temperature; gdna = genomic DNA; cdna = complementary DNA; c = concentration.
Marker types. Potato Association of America Frederiction August 9, Allen Van Deynze
 Marker types Potato Association of America Frederiction August 9, 2009 Allen Van Deynze Use of DNA Markers in Breeding Germplasm Analysis Fingerprinting of germplasm Arrangement of diversity (clustering,
Development 143: doi: /dev : Supplementary information
 Figure S1: Micro-CT 3D reconstruction of meristems from 15-day-old seedlings of Col-0, jba- 1D er-20 and clv3-2 jba1d/+ er-20. In blue, manual segmentation of the shoot apical meristem. Scale bars: 100