Supplemental Data. Wu and Xue (2010). Plant Cell /tpc
|
|
|
- Dwain Richardson
- 5 years ago
- Views:
Transcription
1 Supplemental Data. Wu and Xue (21). Plant Cell 1.115/tpc A P1-S P1-A P2-S P2-A P3-S P3-A P4-S P4-A B Relative expression Relative expression C P1 16 DAG 23 DAG 28 DAG 35 DAG P DAG 23 DAG 28 DAG 35 DAG 16 DAG 23 DAG 28 DAG 35 DAG P2 16 DAG 23 DAG 28 DAG 35 DAG P4 LB3/KASI-A (3 cycles) LB3/KASI-A (35 cycles) ACTIN (25 cycles) KASI/ / Supplemental Figure 1. Transcription Analysis of KASI Gene in Mutant. (A) Schematic representation of the primers used for analyzing the KASI expression by qrt-pcr analysis. The T-DNA insertion is located in the 5 -UTR (51 bp upstream of the ATG start codon, indicated by a triangle) and the positions of four pairs of primers (P1, P2, P3, P4) are indicated. Black boxes, real lines and dotted line indicate the exons, introns and promoter region, respectively. (B) qrt-pcr analysis indicated that the KASI transcripts were existent in mutant using primers downstream of the T-DNA insertion (four pairs of primers indicated in A). The 7th rosette leaves of and were sampled and the relative gene expression was compared with that of. The ratios were rescaled by setting the expression of at 16 DAG to 1.. The data were from three biological replicates and presented as means±sd. (C) RT-PCR analysis using LB3 primer paired with KASI-A confirmed the existence of the T-DNA fragment in KASI mrna of mutant. Two independent mutant lines (heterozygous or homozygous mutant) were used for analysis.
2 Supplemental Data. Wu and Xue (21). Plant Cell 1.115/tpc Relative expression kas I Supplemental Figure 2. qrt-pcr Analysis Shows That the Correct KASI Transcripts Is Also Deficient at 35 DAG of Mutant. The relative KASI gene expression is compared with that of, which is set as 1.. Primers (5U-S and KASI-real-A) flanking the T-DNA insertion were used. The data were from three biological replicates and presented as means±sd.


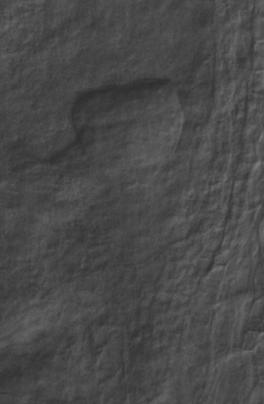
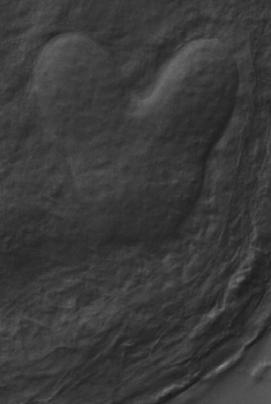
3 Supplemental Data. Wu and Xue (21). Plant Cell 1.115/tpc Supplemental Figure 3. Chloroplast Division Is Defective in Mutant at 19 DAG. Light microscopy (differential interference contrast, DIC) of glutaraldehydefixed mesophyll cells of and at 19 DAG were analyzed. Green or red arrows indicate the cells contain enlarged or normal chloroplasts, respectively. Bars=5 μm.
4 Supplemental Data. Wu and Xue (21). Plant Cell 1.115/tpc A PE (mol% of total PE) PC (mol% of total PC) B DAG 35 DAG 35 34:2 34:3 34:4 36:2 36:3 36:4 36:5 36:6 38:2 38:3 38:4 38:5 4:2 23 DAG DAG :2 34:3 34:4 36:2 36:3 36:4 36:5 36:6 38:2 38:4 4:2 4:3 42:2 PC (mol% of total PC) PE (mol% of total PE) :2 34:3 34:4 36:2 36:3 36:4 36:5 36:6 38:2 38:3 38:4 38:5 4:2 34:2 34:3 34:4 36:2 36:3 36:4 36:5 36:6 38:2 38:4 4:2 4:3 42:2 Supplemental Figure 4. Molecular Species of Phosphatidylcholine (PC) and Phosphatidylethanolamine (PE) in and Rosette Leaves. Species of specific phospholipid (% of the corresponding phospholipid) of rosette leaves from and mutant were analyzed using LC-MS (Q-TOF). Samples were prepared from the 7th, 8th, and 9th rosette leaves of and at 23 DAG and 35 DAG. The data were from four biological replicates and presented as means±sd. (A) The relative amounts (%) of different molecular species of PC in mutant at 23 DAG (left) and 35 DAG (right). The different species are presented as total acyl carbons: total double bonds. (B) The relative amounts (%) of different molecular species of PE in mutant at 23 DAG (left) and 35 DAG (right).the different species are presented as total acyl carbons: total double bonds.


, two distinct Z-ring was observed in one chloroplast")

5 Supplemental Data. Wu and Xue (21). Plant Cell 1.115/tpc Supplemental Figure 5. Disordered Z-Ring Placement in chloroplast. Fixed, embedded leaf sections from 7th rosette leaves at 16 DAG of and were probed using FtsZ2-1 antibody, followed by incubation with anti-rabbit secondary antibodies labeled with Alexa Fluor 488. Z-ring placement is examined with immunofluorescence. Compared to the normal Z-ring placement in chloroplast, of which the FtsZ formed a ring-like structure in the dividing chloroplasts (upper panel), two distinct Z-ring was observed in one chloroplast of mutant (arrows, bottom panel). Left panel, Alexa Fluor 488 signal; middle panel, bright-field images to reveal the chloroplast shape; right panel, merged of left, middle panel and chlorophyll autofluorescence. Bars=5 μm.


6 Supplemental Data. Wu and Xue (21). Plant Cell 1.115/tpc pkasi:kasil11 pkasi:kasil14 pkasi:kasil11 Supplemental Figure 6. The Developmental Defects of Embryo and Bean in Is Recovered under Complementary Expression of KASI. Bars=5 μm (embryo) or 1 cm (silique).

 Schematic representation of the KAR1 gene.")

.")
.")
. Samples were prepared from rosette leaves of kar1 and.")
7 Supplemental Data. Wu and Xue (21). Plant Cell 1.115/tpc A KAR1-5U-S ATG KAR1-A TAG LBa1 KAR1-realtime-A Relative expression B kar mod1 kar1 Supplemental Figure 7. Identification of the kar1 Mutant and Chloroplast Ultrastructure of kar1 and mod1 Mutants. (A) Schematic representation of the KAR1 gene. The T-DNA insertion site, which is located in the 5 -UTR, is indicated by a triangle. The positions of primers used to identify the heterozygous or homozygous lines or to detect the expression of the KAR1 gene are indicated. The sense primer KAR1-5U-S is located in the 5 -UTR upstream of the insertion site (upper panel). The T-DNA insertion in the kar1 mutant was confirmed by PCR amplification using T- DNA bound primers (LBa1) paired to the gene specific primers (KAR1-A). Aanalysis of KAR1 transcription by qrt-pcr using KAR1-5U-S and KAR1-realtime-A primers confirmed the deficient expression of KAR1 in kar1 mutant (bottom panel). Samples were prepared from rosette leaves of kar1 and. The qrt-pcr was biologically replicated for three times and the data were presented as means±sd. (B) Transmission electron microscopy analysis revealed the normal chloroplast ultrastructure in the mesophyll cells of kar1-1 and mod1 mutants at 23 DAG grown at 23 o C. Samples were prepared from the 7 th rosette leaves from kar1, mod1 and. Bars=2 μm (1, 3, 5) or 5 nm (2, 4, 6).
8 Supplemental Data. Wu and Xue (21). Plant Cell 1.115/tpc Relative expression * kas I * Developmental stages Supplemental Figure 8. KASIII Transcription Was Up-Regulated in at 28 and 35 DAG. The KASIII expression is examined by qrt-pcr and relative expression is calculated by comparison with that of at 16 DAG, which was set as 1.. The samples of five developmental stages are same as described in Figure 7A. The data were from three biological replicates and presented as means±sd. Significant differences are analyzed by using a heteroscedastic student s t test (*, p<.1).
9 Supplemental Data. Wu and Xue (21). Plant Cell 1.115/tpc Supplemental Table 1. GC-MS quantification of seed FA content of and mutant (value data of Figure 9D). The contents of FA compositions are presented as means±sd from four biological replicates. Significant differences are analyzed by one-tailed student s t test and marked as overstriking (p<.1). Values show the relative amounts (%). FA16: FA16:1 FA18: FA18:1 FA18: ±.15.49± ± ± ±.16 kas1 9.63±.12.62± ± ± ±.84 FA18:3 FA2: FA2:1 FA2:2 FA22: FA22: ± ± ± ±.5.17±.2 1.5±.4 kas ± ± ± ±.11.39± ±.15
10 Supplemental Data. Wu and Xue (21). Plant Cell 1.115/tpc Supplemental Table 2. GC-MS quantification of seed FA from and three independent transgenic lines with complementary expression of KASI (11, 14 and 11, value data of Figure 8E). The contents of FA compositions are presented as means±sd from three biological replicates. Values show the relative amounts (%). FA16: FA16:1 FA18: FA18:1 FA18:2 1.12±.12.43± ± ± ±.37 pkasi:kasi ±.2.39± ± ± ±.2 pkasi:kasi ±.14.44± ± ± ±.28 pkasi:kasi ±.1.44± ± ± ±.6 FA18:3 FA2: FA2:1 FA2:2 FA22: FA22: ± ± ± ±.3.25±.1 1.5±.6 pkasi:kasi ± ± ± ±.3.26± ±.2 pkasi:kasi ± ± ± ±.3.25± ±.3 pkasi:kasi ± ± ± ±.1.26± ±.2
11 Supplemental Data. Wu and Xue (21). Plant Cell 1.115/tpc Supplemental Table 3. Primers used for qrt-pcr analysis. Gene Sequences (5-3 ) ACTIN 5 -CCGGTATTGTGCTCGATTCTG-3 5 -TTCCCGTTCTGCGGTAGTGG-3 KASI 5 -TCGCAAAACACACATCACACAC-3 5 -GTGATTGACGATTTGATGGTAAG-3 FtsZ1 5 -TCTCTCCGATGGAATCTGCG-3 5 -CAGTGCCAAGCCCACGAGT-3 FtsZ2 5 -CCGAGTAACTACAATGAGGCG-3 5 -ATTATCAGGCAAAACAGGAGAC-3 MinE 5 -TCATCATCACCACCGTAATCG-3 5 -GCAAGAACCTTCACCTGACC-3 ARC6 5 -CTGAGCAGGTTGATCTTTTTG-3 5 -TCGCAGGAATCTCCATAGCC-3 ARC5 5 -GTTATCGCTGTTATTGAAGGG-3 5 -ACCCCCATAGAGACGCATC-3 PDV2 5 -GGCTTTTGCGTATTCGTGATG-3 5 -CTTTCCCTTTGTACTCCTTAA-3 MSL2 5 -GAGTAATCCGAGCGATACAAG-3 5 -CCAAGACCTCCAGCAGTGAG-3 MSL3 5 -CTGGCACAGTAGAGCAAGTC-3 5 -TCAAGATGACTGATGGCAAGA-3 KASIII 5 -TGGTCTTCCTGCTTCTGCC CCGCTTCTCACTGCCTCAT-3 KASI-P1 5 -ATGCAAGCTCTTCAATCTTCAT-3 5 -GTTTAGGAGCGGAGACAGTG-3 KASI-P2 5 -GCTATTATTCCTATTGGGTTG-3 5 -TTGGAGCACCACGTTTCATT-3 KASI-P3 5 -AACGCCACCAAGTCTATGAT-3 5 -AACCTCGTGTTGCTTCTTCT-3 KASI-P4 5 -TATCGGTTACTATCATCATCCA-3 5 -CAACATTCCGCAGACAAGAG-3
Supplemental Data. Benstein et al. (2013). Plant Cell /tpc
. Plant Cell /tpc") Supplemental Figure 1. Purification of the heterologously expressed PGDH1, PGDH2 and PGDH3 enzymes by Ni-NTA affinity chromatography. Protein extracts (2 µl) of different fractions (lane 1 = total extract,
Supplemental Figure 1. Purification of the heterologously expressed PGDH1, PGDH2 and PGDH3 enzymes by Ni-NTA affinity chromatography. Protein extracts (2 µl) of different fractions (lane 1 = total extract,
A Nucleus-Encoded Chloroplast Protein YL1 Is Involved in Chloroplast. Development and Efficient Biogenesis of Chloroplast ATP Synthase in Rice
 A Nucleus-Encoded Chloroplast Protein YL1 Is Involved in Chloroplast Development and Efficient Biogenesis of Chloroplast ATP Synthase in Rice Fei Chen 1,*, Guojun Dong 2,*, Limin Wu 1, Fang Wang 3, Xingzheng
Supplemental Data. Cui et al. (2012). Plant Cell /tpc a b c d. Stem UBC32 ACTIN
. Plant Cell /tpc a b c d. Stem UBC32 ACTIN") A Root Stem Leaf Flower Silique Senescence leaf B a b c d UBC32 ACTIN C * Supplemental Figure 1. Expression Pattern and Protein Sequence of UBC32 Homologues in Yeast, Human, and Arabidopsis. (A) Expression
A Root Stem Leaf Flower Silique Senescence leaf B a b c d UBC32 ACTIN C * Supplemental Figure 1. Expression Pattern and Protein Sequence of UBC32 Homologues in Yeast, Human, and Arabidopsis. (A) Expression
Supplemental Data. Na Xu et al. (2016). Plant Cell /tpc
. Plant Cell /tpc") Supplemental Figure 1. The weak fluorescence phenotype is not caused by the mutation in At3g60240. (A) A mutation mapped to the gene At3g60240. Map-based cloning strategy was used to map the mutated site
Supplemental Figure 1. The weak fluorescence phenotype is not caused by the mutation in At3g60240. (A) A mutation mapped to the gene At3g60240. Map-based cloning strategy was used to map the mutated site
A Repressor Complex Governs the Integration of
 Developmental Cell 15 Supplemental Data A Repressor Complex Governs the Integration of Flowering Signals in Arabidopsis Dan Li, Chang Liu, Lisha Shen, Yang Wu, Hongyan Chen, Masumi Robertson, Chris A.
PIE1 ARP6 SWC6 KU70 ARP6 PIE1. HSA SNF2_N HELICc SANT. pie1-3 A1,A2 K1,K2 K1,K3 K3,LB2 A3, A4 A3,LB1 A1,A2 K1,K2 K1,K3. swc6-1 A3,A4.
 A B N-terminal SWC2 H2A.Z SWC6 ARP6 PIE1 HSA SNF2_N HELICc SANT C pie1-3 D PIE1 ARP6 5 Kb A1 200 bp A3 A2 LB1 arp6-3 A4 E A1,A2 A3, A4 A3,LB1 K1,K2 K1,K3 K3,LB2 SWC6 swc6-1 A1,A2 A3,A4 K1,K2 K1,K3 100
(phosphatase tensin) domain is shown in dark gray, the FH1 domain in black, and the
 domain is shown in dark gray, the FH1 domain in black, and the") Supplemental Figure 1. Predicted Domain Organization of the AFH14 Protein. (A) Schematic representation of the predicted domain organization of AFH14. The PTEN (phosphatase tensin) domain is shown in dark
Supplemental Figure 1. Predicted Domain Organization of the AFH14 Protein. (A) Schematic representation of the predicted domain organization of AFH14. The PTEN (phosphatase tensin) domain is shown in dark
Supplemental Data. Guo et al. (2015). Plant Cell /tpc
. Plant Cell /tpc") Supplemental Figure 1. The Mutant exb1-d Displayed Pleiotropic Phenotypes and Produced Branches in the Axils of Cotyledons. (A) Branches were developed in exb1-d but not in wild-type plants. (B) and (C)
Supplemental Figure 1. The Mutant exb1-d Displayed Pleiotropic Phenotypes and Produced Branches in the Axils of Cotyledons. (A) Branches were developed in exb1-d but not in wild-type plants. (B) and (C)
Table S1. List of primers used in this study.
 Gene/Construct/ mutant Primer name Sequence (5 ->3 ) Confimation of T-DNA insertion clh1-1 LBb1 5 GCGTGGACCGCTTGCTGCAACT3 1LP1 5 CCGAAAATGATAAATGCATGG3 1RP1 5 ATGTCCAGCTCGAAAGATTCC3 clh2-1 Lb4 5 CTACAAATTGCCTTTTCTTATCGAC3
- 1 - Supplemental Data
 - 1-1 Supplemental Data 2 3 4 5 6 7 8 9 Supplemental Figure S1. Differential expression of AtPIP Genes in DC3000-inoculated plants. Gene expression in leaves was analyzed by real-time RT-PCR and expression
Construction of plant complementation vector and generation of transgenic plants
 MATERIAL S AND METHODS Plant materials and growth conditions Arabidopsis ecotype Columbia (Col0) was used for this study. SALK_072009, SALK_076309, and SALK_027645 were obtained from the Arabidopsis Biological
Supplemental Data. Sethi et al. (2014). Plant Cell /tpc
. Plant Cell /tpc") Supplemental Data Supplemental Figure 1. MYC2 Binds to the E-box but not the E1-box of the MPK6 Promoter. (A) E1-box and E-box (wild type) containing MPK6 promoter fragment. The region shown in red denotes
Supplemental Data Supplemental Figure 1. MYC2 Binds to the E-box but not the E1-box of the MPK6 Promoter. (A) E1-box and E-box (wild type) containing MPK6 promoter fragment. The region shown in red denotes
WiscDsLox485 ATG < > //----- E1 E2 E3 E4 E bp. Col-0 arr7 ARR7 ACTIN7. s of mrna/ng total RNA (x10 3 ) ARR7.
 ARR7.") A WiscDsLox8 ATG < > -9 +0 > ---------//----- E E E E E UTR +9 UTR +0 > 00bp B S D ol-0 arr7 ol-0 arr7 ARR7 ATIN7 D s of mrna/ng total RNA opie 0. ol-0 (x0 ) arr7 ARR7 Supplemental Fig.. Genotyping and
A WiscDsLox8 ATG < > -9 +0 > ---------//----- E E E E E UTR +9 UTR +0 > 00bp B S D ol-0 arr7 ol-0 arr7 ARR7 ATIN7 D s of mrna/ng total RNA opie 0. ol-0 (x0 ) arr7 ARR7 Supplemental Fig.. Genotyping and
Supplementary Figure 1. jmj30-2 and jmj32-1 produce null mutants. (a) Schematic drawing of JMJ30 and JMJ32 genome structure showing regions amplified
 Schematic drawing of JMJ30 and JMJ32 genome structure showing regions amplified") Supplementary Figure 1. jmj30-2 and jmj32-1 produce null mutants. (a) Schematic drawing of JMJ30 and JMJ32 genome structure showing regions amplified by primers used for mrna expression analysis. Gray
Supplementary Figure 1. jmj30-2 and jmj32-1 produce null mutants. (a) Schematic drawing of JMJ30 and JMJ32 genome structure showing regions amplified by primers used for mrna expression analysis. Gray
Supplemental Data. Jing et al. (2013). Plant Cell /tpc
. Plant Cell /tpc") Supplemental Figure 1. Characterization of epp1 Mutants. (A) Cotyledon angles of 5-d-old Col wild-type (gray bars) and epp1-1 (black bars) seedlings under red (R), far-red (FR) and blue (BL) light conditions,
Supplemental Figure 1. Characterization of epp1 Mutants. (A) Cotyledon angles of 5-d-old Col wild-type (gray bars) and epp1-1 (black bars) seedlings under red (R), far-red (FR) and blue (BL) light conditions,
Supplementary Figure 1 An overview of pirna biogenesis during fetal mouse reprogramming. (a) (b)
 (b)") Supplementary Figure 1 An overview of pirna biogenesis during fetal mouse reprogramming. (a) A schematic overview of the production and amplification of a single pirna from a transposon transcript. The
Supplementary Figure 1 An overview of pirna biogenesis during fetal mouse reprogramming. (a) A schematic overview of the production and amplification of a single pirna from a transposon transcript. The
SUPPLEMENTARY INFORMATION
 AS-NMD modulates FLM-dependent thermosensory flowering response in Arabidopsis NATURE PLANTS www.nature.com/natureplants 1 Supplementary Figure 1. Genomic sequence of FLM along with the splice sites. Sequencing
Alternative Cleavage and Polyadenylation of RNA
 Developmental Cell 18 Supplemental Information The Spen Family Protein FPA Controls Alternative Cleavage and Polyadenylation of RNA Csaba Hornyik, Lionel C. Terzi, and Gordon G. Simpson Figure S1, related
Integrated Omics Study Delineates the Dynamics of Lipid Droplets in Rhodococcus Opacus PD630
 School of Natural Sciences and Mathematics 2013-10-22 Integrated Omics Study Delineates the Dynamics of Lipid Droplets in Rhodococcus Opacus PD630 UTD AUTHOR(S): Michael Qiwei Zhang 2013 The Authors This
Nature Genetics: doi: /ng Supplementary Figure 1. ChIP-seq genome browser views of BRM occupancy at previously identified BRM targets.
 Supplementary Figure 1 ChIP-seq genome browser views of BRM occupancy at previously identified BRM targets. Gene structures are shown underneath each panel. Supplementary Figure 2 pref6::ref6-gfp complements
Supplemental Data Supplemental Figure 1.
 Supplemental Data Supplemental Figure 1. Silique arrangement in the wild-type, jhs, and complemented lines. Wild-type (WT) (A), the jhs1 mutant (B,C), and the jhs1 mutant complemented with JHS1 (Com) (D)
SUPPLEMENTARY INFORMATION
 Gene replacements and insertions in rice by intron targeting using CRISPR Cas9 Table of Contents Supplementary Figure 1. sgrna-induced targeted mutations in the OsEPSPS gene in rice protoplasts. Supplementary
Supplemental Figure 1.
 Supplemental Data. Charron et al. Dynamic landscapes of four histone modifications during de-etiolation in Arabidopsis. Plant Cell (2009). 10.1105/tpc.109.066845 Supplemental Figure 1. Immunodetection
A novel tool for monitoring endogenous alpha-synuclein transcription by NanoLuciferase
 A novel tool for monitoring endogenous alpha-synuclein transcription by NanoLuciferase tag insertion at the 3 end using CRISPR-Cas9 genome editing technique Sambuddha Basu 1, 3, Levi Adams 1, 3, Subhrangshu
BS 50 Genetics and Genomics Week of Oct 24
 BS 50 Genetics and Genomics Week of Oct 24 Additional Practice Problems for Section Question 1: The following table contains a list of statements that apply to replication, transcription, both, or neither.
SUPPLEMENTARY INFORMATION
 Ca 2+ /calmodulin Regulates Salicylic Acid-mediated Plant Immunity Liqun Du, Gul S. Ali, Kayla A. Simons, Jingguo Hou, Tianbao Yang, A.S.N. Reddy and B. W. Poovaiah * *To whom correspondence should be
- PDI5. - Actin A 300-UTR5. PDI5 lines WT. Arabidopsis Chromosome 1. PDI5 (At1g21750) SALK_ SALK_ SALK_015253
 SALK_ SALK_ SALK_015253") Supplemental Data. Ondzighi et al. (2008). Arabidopsis Protein Disulfide Isomerase-5 Inhibits ysteine Proteases During Trafficking to Vacuoles Prior to Programmed ell Death of the dothelium in Developing
Supplemental Data. Ondzighi et al. (2008). Arabidopsis Protein Disulfide Isomerase-5 Inhibits ysteine Proteases During Trafficking to Vacuoles Prior to Programmed ell Death of the dothelium in Developing
Supplemental Information
 Supplemental Information Itemized List Materials and Methods, Related to Supplemental Figures S5A-C and S6. Supplemental Figure S1, Related to Figures 1 and 2. Supplemental Figure S2, Related to Figure
Supplemental Data. Ondzighi-Assoume et al. Plant Cell (2016) /tpc G 60
 /tpc G 60") Supplemental ata. Ondzighi-Assoume et al. Plant ell (26).5/tpc.5.946 ABA/Alexa 488 Merge Bright-field luorescence intensity A G 6 Average of fluorescence intensity of endodermis B Z 4 a a RAM 2 c Supplemental
Supplemental ata. Ondzighi-Assoume et al. Plant ell (26).5/tpc.5.946 ABA/Alexa 488 Merge Bright-field luorescence intensity A G 6 Average of fluorescence intensity of endodermis B Z 4 a a RAM 2 c Supplemental
Supplemental Figure 1. Alignment of the NbGAPC amino acid sequences with their Arabidopsis homologues.
 Supplemental Figure 1. Alignment of the NbGAPC amino acid sequences with their Arabidopsis homologues. Homologs from N. benthamiana (NbGAPC1, NbGAPC2, NbGAPC3), Arabidopsis (AtGAPC1, AT3G04120; AtGAPC2,
Sperm cells are passive cargo of the pollen tube in plant fertilization
 In the format provided by the authors and unedited. SUPPLEMENTARY INFORMATION VOLUME: 3 ARTICLE NUMBER: 17079 Sperm cells are passive cargo of the pollen tube in plant fertilization Jun Zhang 1, Qingpei
Nature Structural and Molecular Biology: doi: /nsmb Supplementary Figure 1. Validation of CDK9-inhibitor treatment.
 Supplementary Figure 1 Validation of CDK9-inhibitor treatment. (a) Schematic of GAPDH with the middle of the amplicons indicated in base pairs. The transcription start site (TSS) and the terminal polyadenylation
Supplemental Data. Zhang et al. (2010). Plant Cell /tpc
. Plant Cell /tpc") Supplemental Figure 1. uvs90 gene cloning The T-DNA insertion in uvs90 was identified using thermal asymmetric interlaced (TAIL)-PCR. Three rounds of amplification were performed; the second (2 nd ) and
Supplemental Figure 1. uvs90 gene cloning The T-DNA insertion in uvs90 was identified using thermal asymmetric interlaced (TAIL)-PCR. Three rounds of amplification were performed; the second (2 nd ) and
Supplemental Figure 1. Floral commitment in Arabidopsis WT and mutants.
 Percentage of induction Supplemental Data. Torti et al. (2012). Plant Cell 10.1105/tpc.111.092791 A +0 +0 LD LDs +1 LDs +3 +3 LDs +5 +5 LDs LD 50 μm AP1 B C 140 120 100 80 60 40 20 0-20 -40 wt Col soc1-2
Schematic representation of the endogenous PALB2 locus and gene-disruption constructs
 Supplementary Figures Supplementary Figure 1. Generation of PALB2 -/- and BRCA2 -/- /PALB2 -/- DT40 cells. (A) Schematic representation of the endogenous PALB2 locus and gene-disruption constructs carrying
Supplemental Data. Zhou et al. (2016). Plant Cell /tpc
. Plant Cell /tpc") Supplemental Figure 1. Confirmation of mutant mapping results. (A) Complementation assay with stably transformed genomic fragments (ComN-N) (2 kb upstream of TSS and 1.5 kb downstream of TES) and CaMV
Supplemental Figure 1. Confirmation of mutant mapping results. (A) Complementation assay with stably transformed genomic fragments (ComN-N) (2 kb upstream of TSS and 1.5 kb downstream of TES) and CaMV
Supplemental Data. Farmer et al. (2010) Plant Cell /tpc
 Plant Cell /tpc") Supplemental Figure 1. Amino acid sequence comparison of RAD23 proteins. Identical and similar residues are shown in the black and gray boxes, respectively. Dots denote gaps. The sequence of plant Ub is
Supplemental Figure 1. Amino acid sequence comparison of RAD23 proteins. Identical and similar residues are shown in the black and gray boxes, respectively. Dots denote gaps. The sequence of plant Ub is
Supplemental Figure 1 A
 Supplemental Figure 1 A Supplemental Data. Han et al. (2016). Plant Cell 10.1105/tpc.15.00997 BamHI -1616 bp SINE repeats SalI ATG SacI +1653 bp HindIII LB HYG p35s pfwa LUC Tnos RB pfwa-bamhi-f: CGGGATCCCGCCTTTCTCTTCCTCATCTGC
Figure S1. Figure S2. Figure S3 HB Anti-FSP27 (COOH-terminal peptide) Ab. Anti-GST-FSP27(45-127) Ab.
 Ab. Anti-GST-FSP27(45-127) Ab.") / 36B4 mrna ratio Figure S1 * 2. 1.6 1.2.8 *.4 control TNFα BRL49653 Figure S2 Su bw AT p iw Anti- (COOH-terminal peptide) Ab Blot : Anti-GST-(45-127) Ab β-actin Figure S3 HB2 HW AT BA T Figure S4 A TAG
/ 36B4 mrna ratio Figure S1 * 2. 1.6 1.2.8 *.4 control TNFα BRL49653 Figure S2 Su bw AT p iw Anti- (COOH-terminal peptide) Ab Blot : Anti-GST-(45-127) Ab β-actin Figure S3 HB2 HW AT BA T Figure S4 A TAG
Supplemental Data. Li et al. (2015). Plant Cell /tpc
. Plant Cell /tpc") Supplemental Data Supplemental Figure 1: Characterization of asr3 T-DNA knockout lines and complementation transgenic lines. (A) The scheme of At2G33550 (ASR3) with gray boxes indicating exons and dash
Supplemental Data Supplemental Figure 1: Characterization of asr3 T-DNA knockout lines and complementation transgenic lines. (A) The scheme of At2G33550 (ASR3) with gray boxes indicating exons and dash
What are the Properties of the Protein EMB2777?
 Of EMB2777 and F14J22.20 - exons & introns by Hanbee O What are the Properties of the Protein EMB2777?! Embryo defective / seed lethal transcriptional factor o Sas10 / U3 ribonucleoprotein (Utp) family
Supplemental Data. Huo et al. (2013). Plant Cell /tpc
. Plant Cell /tpc") Supplemental Data. Huo et al. (2013). Plant Cell 10.1105/tpc.112.108902 1 Supplemental Figure 1. Alignment of NCED4 Amino Acid Sequences from Different Lettuce Varieties. NCED4 amino acid sequences are
Supplemental Data. Huo et al. (2013). Plant Cell 10.1105/tpc.112.108902 1 Supplemental Figure 1. Alignment of NCED4 Amino Acid Sequences from Different Lettuce Varieties. NCED4 amino acid sequences are
Supplementary Fig 1. The responses of ERF109 to different hormones and stresses. (a to k) The induced expression of ERF109 in 7-day-old Arabidopsis
 The induced expression of ERF109 in 7-day-old Arabidopsis") Supplementary Fig 1. The responses of ERF109 to different hormones and stresses. (a to k) The induced expression of ERF109 in 7-day-old Arabidopsis seedlings expressing ERF109pro-GUS. The GUS staining
Supplementary Fig 1. The responses of ERF109 to different hormones and stresses. (a to k) The induced expression of ERF109 in 7-day-old Arabidopsis seedlings expressing ERF109pro-GUS. The GUS staining
Supplemental Figure 1. Characterization of LHT1 T-DNA mutations.
 A LHT1 (At5g40780) 500 bp -3-6-7-1,-4-2 -5 1 3624 ATG * TAA F2 R3 F1 R2 R1 F3 R4-1, 1-4(SALK_034566/036871): 1706 cggtttnnntaatttgttttcttttcagggg ACCGGGAATTGCAGTGTTGGTTTTGTCATGGGT NNN CATAAC 1772-2 (SALK_026389):
Supplemental Data. Seo et al. (2014). Plant Cell /tpc
. Plant Cell /tpc") Supplemental Figure 1. Protein alignment of ABD1 from other model organisms. The alignment was performed with H. sapiens DCAF8, M. musculus DCAF8 and O. sativa Os10g0544500. The WD40 domains are underlined.
Supplemental Figure 1. Protein alignment of ABD1 from other model organisms. The alignment was performed with H. sapiens DCAF8, M. musculus DCAF8 and O. sativa Os10g0544500. The WD40 domains are underlined.
Supplementary Information
 Supplementary Information Super-resolution imaging of fluorescently labeled, endogenous RNA Polymerase II in living cells with CRISPR/Cas9-mediated gene editing Won-Ki Cho 1, Namrata Jayanth 1, Susan Mullen
Fig. S1. Effect of p120-catenin overexpression on the interaction of SCUBE2 with E-cadherin. The expression plasmid encoding FLAG.
 Fig. S1. Effect of p120-catenin overexpression on the interaction of SCUBE2 with E-cadherin. The expression plasmid encoding FLAG.SCUBE2, E-cadherin.Myc, or HA.p120-catenin was transfected in a combination
Supplementary information
 Supplementary information Supplementary figures Figure S1 Level of mycdet1 protein in DET1 OE-1, OE-2 and OE-3 transgenic lines. Total protein extract from wild type Col0, det1-1 mutant and DET1 OE lines
Confocal immunofluorescence microscopy
 Confocal immunofluorescence microscopy HL-6 and cells were cultured and cytospun onto glass slides. The cells were double immunofluorescence stained for Mt NPM1 and fibrillarin (nucleolar marker). Briefly,
Supplemental Data. Lee et al. Plant Cell. (2010) /tpc Supplemental Figure 1. Protein and Gene Structures of DWA1 and DWA2.
 /tpc Supplemental Figure 1. Protein and Gene Structures of DWA1 and DWA2.") Supplemental Figure 1. Protein and Gene Structures of DWA1 and DWA2. (A) Protein structures of DWA1 and DWA2. WD40 region was determined based on the NCBI conserved domain databases (B, C) Schematic representation
Supplemental Figure 1. Protein and Gene Structures of DWA1 and DWA2. (A) Protein structures of DWA1 and DWA2. WD40 region was determined based on the NCBI conserved domain databases (B, C) Schematic representation
Supplemental Materials
 Supplemental Materials Flores-Pérez et al., Supplemental Materials, page 1 of 5 Supplemental Figure S1. Pull-down and BiFC controls, and quantitative analyses associated with the BiFC studies. (A) Controls
Revised: RG-RV2 by Fukuhara et al.
 Supplemental Figure 1 The generation of Spns2 conditional knockout mice. (A) Schematic representation of the wild type Spns2 locus (Spns2 + ), the targeted allele, the floxed allele (Spns2 f ) and the
2. (So) get (fragments with gene) R / required gene. Accept: allele for gene / same gene 2
 get (fragments with gene) R / required gene. Accept: allele for gene / same gene 2") M.(a). Cut (DNA) at same (base) sequence / (recognition) sequence; Accept: cut DNA at same place. (So) get (fragments with gene) R / required gene. Accept: allele for gene / same gene (b). Each has / they
M.(a). Cut (DNA) at same (base) sequence / (recognition) sequence; Accept: cut DNA at same place. (So) get (fragments with gene) R / required gene. Accept: allele for gene / same gene (b). Each has / they
Erhard et al. (2013). Plant Cell /tpc
. Plant Cell /tpc") Supplemental Figure 1. c1-hbr allele structure. Diagram of the c1-hbr allele found in stocks segregating 1:1 for rpd1-1 and rpd1-2 homozygous mutants showing the presence of a 363 base pair (bp) Heartbreaker
Supplemental Figure 1. c1-hbr allele structure. Diagram of the c1-hbr allele found in stocks segregating 1:1 for rpd1-1 and rpd1-2 homozygous mutants showing the presence of a 363 base pair (bp) Heartbreaker
embryos. Asterisk represents loss of or reduced expression. Brackets represent
 Supplemental Figures Supplemental Figure 1. tfec expression is highly enriched in tail endothelial cells (A- B) ISH of tfec at 15 and 16hpf in WT embryos. (C- D) ISH of tfec at 36 and 38hpf in WT embryos.
Supplemental Figure 1. VLN5 retains conserved residues at both type 1 and type 2 Ca 2+ -binding
 Supplemental Figure 1. VLN5 retains conserved residues at both type 1 and type 2 Ca 2+ -binding sites in the G1 domain. Multiple sequence alignment was performed with DNAMAN6.0.40. Secondary structural
Supplementary Figure Legends
 Supplementary Figure Legends Figure S1 gene targeting strategy for disruption of chicken gene, related to Figure 1 (f)-(i). (a) The locus and the targeting constructs showing HpaI restriction sites. The
SUPPLEMENT MATERIALS FOR CURTIN,
 1 2 3 4 5 6 7 8 9 10 11 12 13 14 15 16 17 18 19 20 21 22 23 24 25 26 27 28 29 30 SUPPLEMENT MATERIALS FOR CURTIN, et al. Validating genome-wide association candidates: Selecting, testing, and characterizing
SUPPLEMENTAL FILES. Supplemental Figure 1. Expression domains of Arabidopsis HAM orthologs in both shoot meristem and root tissues.
 SUPPLEMENTAL FILES SUPPLEMENTAL FIGURE LEGENDS Supplemental Figure 1. Expression domains of Arabidopsis HAM orthologs in both shoot meristem and root tissues. RT-PCR amplification of AtHAM1, AtHAM2, AtHAM3,
Supplementary Figure 1
 Supplementary Figure 1 Supplementary Fig. 1 shrna mediated knockdown of ZRSR2 in K562 and 293T cells. (a) ZRSR2 transcript levels in stably transduced K562 cells were determined using qrt-pcr. GAPDH was
6/256 1/256 0/256 1/256 2/256 7/256 10/256. At3g06290 (SAC3B)
") Chr.III M 5M 1M 15M 2M 23M BAC clones F22F7 F1A16 F24F17 F24P17 T8E24 F17A9 F21O3 F17A17 F18C1 F2O1 F28L1 F5E6 F3E22 T1B9 MLP3 Number of recombinants 6/256 1/256 /256 1/256 2/256 7/256 1/256 At3g629 (SAC3B)
Chr.III M 5M 1M 15M 2M 23M BAC clones F22F7 F1A16 F24F17 F24P17 T8E24 F17A9 F21O3 F17A17 F18C1 F2O1 F28L1 F5E6 F3E22 T1B9 MLP3 Number of recombinants 6/256 1/256 /256 1/256 2/256 7/256 1/256 At3g629 (SAC3B)
Supplemental Data. Wang et al. Plant Cell. (2013) /tpc
 /tpc") SNL1 SNL Supplemental Figure 1. The Expression Patterns of SNL1 and SNL in Different Tissues of Arabidopsis from Genevestigator Web Site (https://www.genevestigator.com/gv/index.jsp). 1 A 1. 1..8.6.4..
SNL1 SNL Supplemental Figure 1. The Expression Patterns of SNL1 and SNL in Different Tissues of Arabidopsis from Genevestigator Web Site (https://www.genevestigator.com/gv/index.jsp). 1 A 1. 1..8.6.4..
Supplementary information to accompany: A novel role for the DNA repair gene Rad51 in Netrin-1 signalling
 Supplementary information to accompany: A novel role for the DNA repair gene Rad51 in Netrin-1 signalling Glendining KA 1, Markie D 2, Gardner RJM 4, Franz EA 3, Robertson SP 4, Jasoni CL 1 Supplementary
SUPPLEMENTARY INFORMATION
 doi:10.1038/nature12119 SUPPLEMENTARY FIGURES AND LEGENDS pre-let-7a- 1 +14U pre-let-7a- 1 Ddx3x Dhx30 Dis3l2 Elavl1 Ggt5 Hnrnph 2 Osbpl5 Puf60 Rnpc3 Rpl7 Sf3b3 Sf3b4 Tia1 Triobp U2af1 U2af2 1 6 2 4 3
Supplemental Data. Tang et al. Plant Cell. (2012) /tpc
 /tpc") Supplemental Figure 1. Relative Pchlide Fluorescence of Various Mutants and Wild Type. Seedlings were grown in darkness for 5 d. Experiments were repeated 3 times with same results. Supplemental Figure
Supplemental Figure 1. Relative Pchlide Fluorescence of Various Mutants and Wild Type. Seedlings were grown in darkness for 5 d. Experiments were repeated 3 times with same results. Supplemental Figure
Supplemental Data. Hu et al. Plant Cell (2017) /tpc
 /tpc") 1 2 3 4 Supplemental Figure 1. DNA gel blot analysis of homozygous transgenic plants. (Supports Figure 1.) 5 6 7 8 Rice genomic DNA was digested with the restriction enzymes EcoRⅠ and BamHⅠ. Lanes in the
1 2 3 4 Supplemental Figure 1. DNA gel blot analysis of homozygous transgenic plants. (Supports Figure 1.) 5 6 7 8 Rice genomic DNA was digested with the restriction enzymes EcoRⅠ and BamHⅠ. Lanes in the
Supplemental materials
 Supplemental materials Materials and methods for supplemental figures Yeast two-hybrid assays TAP46-PP2Ac interactions I. The TAP46 was used as the bait and the full-length cdnas of the five C subunits
Supporting Information
 Supporting Information Deng et al. 10.1073/pnas.1102117108 Fig. S1. Predicted structure of Arabidopsis bzip60 RNA. Lowest free energy form (ΔG = 309.72 (initially 343.10) of bzip60 mrna folded by M-Fold
Supplementary Information. Optimization of the production of knock-in alleles by CRISPR/Cas9 microinjection into the mouse zygote
 Supplementary Information Supplementary Figures S1 to S5 and Tables S1 to S3. Optimization of the production of knock-in alleles by CRISPR/Cas9 microinjection into the mouse zygote Aurélien Raveux, Sandrine
Supplemental Data. Steiner et al. Plant Cell. (2012) /tpc
 /tpc") Supplemental Figure 1. SPY does not interact with free GST. Invitro pull-down assay using E. coli-expressed MBP-SPY and GST, GST-TCP14 and GST-TCP15. MBP-SPY was used as bait and incubated with equal amount
Supplemental Figure 1. SPY does not interact with free GST. Invitro pull-down assay using E. coli-expressed MBP-SPY and GST, GST-TCP14 and GST-TCP15. MBP-SPY was used as bait and incubated with equal amount
3 -end. Sau3A. 3 -end TAA TAA. ~9.1kb SalI TAA. ~12.6kb. HindШ ATG 5,860bp TAA. ~12.7kb
 Supplemental Data. Chen et al. (2008). Badh2, encoding betaine aldehyde dehydrogenase, inhibits the biosynthesis of 2-acetyl-1-pyrroline, a major component in rice fragrance. A pcam-cah/cah Sau3A Promoter
File name: Supplementary Information Description: Supplementary figures and supplementary tables. File name: Peer review file Description:
 File name: Supplementary Information Description: Supplementary figures and supplementary tables. File name: Peer review file Description: Supplementary Figure 1. dcas9-mq1 fusion protein induces de novo
PCR analysis was performed to show the presence and the integrity of the var1csa and var-
 Supplementary information: Methods: Table S1: Primer Name Nucleotide sequence (5-3 ) DBL3-F tcc ccg cgg agt gaa aca tca tgt gac tg DBL3-R gac tag ttt ctt tca ata aat cac tcg c DBL5-F cgc cct agg tgc ttc
Cell proliferation was measured with Cell Counting Kit-8 (Dojindo Laboratories, Kumamoto, Japan).
.") 1 2 3 4 5 6 7 8 Supplemental Materials and Methods Cell proliferation assay Cell proliferation was measured with Cell Counting Kit-8 (Dojindo Laboratories, Kumamoto, Japan). GCs were plated at 96-well
1 2 3 4 5 6 7 8 Supplemental Materials and Methods Cell proliferation assay Cell proliferation was measured with Cell Counting Kit-8 (Dojindo Laboratories, Kumamoto, Japan). GCs were plated at 96-well
Supplementary Information
 Supplementary Information MicroRNA-212/132 family is required for epithelial stromal interactions necessary for mouse mammary gland development Ahmet Ucar, Vida Vafaizadeh, Hubertus Jarry, Jan Fiedler,
A subclass of HSP70s regulate development and abiotic stress responses in Arabidopsis thaliana
 1 2 3 4 5 6 7 8 9 10 11 12 13 14 15 16 17 18 19 20 21 Journal of Plant Research A subclass of HSP70s regulate development and abiotic stress responses in Arabidopsis thaliana Linna Leng 1 Qianqian Liang
Supporting information
 Supporting information Construction of strains and plasmids To create ptc67, a PCR product obtained with primers cc2570-162f (gcatgggcaagcttgaggacggcgtcatgt) and cc2570+512f (gaggccgtggtaccatagaggcgggcg),
Supplemental Data. Dai et al. (2013). Plant Cell /tpc Absolute FyPP3. Absolute
. Plant Cell /tpc Absolute FyPP3. Absolute") A FyPP1 Absolute B FyPP3 Absolute Dry seeds Imbibed 24 hours Dry seeds Imbibed 24 hours C ABI5 Absolute Dry seeds Imbibed 24 hours Supplemental Figure 1. Expression of FyPP1, FyPP3 and ABI5 during seed
A FyPP1 Absolute B FyPP3 Absolute Dry seeds Imbibed 24 hours Dry seeds Imbibed 24 hours C ABI5 Absolute Dry seeds Imbibed 24 hours Supplemental Figure 1. Expression of FyPP1, FyPP3 and ABI5 during seed
Supplementary Information. Isl2b regulates anterior second heart field development in zebrafish
 Supplementary Information Isl2b regulates anterior second heart field development in zebrafish Hagen R. Witzel 1, Sirisha Cheedipudi 1, Rui Gao 1, Didier Y.R. Stainier 2 and Gergana D. Dobreva 1,3* 1 Origin
3. Translation. 2. Transcription. 1. Replication. and functioning through their expression in. Genes are units perpetuating themselves
 Central Dogma Genes are units perpetuating themselves and functioning through their expression in the form of proteins 1 DNA RNA Protein 2 3 1. Replication 2. Transcription 3. Translation Spring 2002 21
To assess the localization of Citrine fusion proteins, we performed antibody staining to
 Trinh et al 1 SUPPLEMENTAL MATERIAL FlipTraps recapitulate endogenous protein localization To assess the localization of Citrine fusion proteins, we performed antibody staining to compare the expression
Supplementary Information
 Supplementary Information MED18 interaction with distinct transcription factors regulates plant immunity, flowering time and responses to hormones Supplementary Figure 1. Diagram showing T-DNA insertion
HC70AL SUMMER 2014 PROFESSOR BOB GOLDBERG Gene Annotation Worksheet
 HC70AL SUMMER 2014 PROFESSOR BOB GOLDBERG Gene Annotation Worksheet NAME: DATE: QUESTION ONE Using primers given to you by your TA, you carried out sequencing reactions to determine the identity of the
Supplementary data. sienigma. F-Enigma F-EnigmaSM. a-p53
 Supplementary data Supplemental Figure 1 A sienigma #2 sienigma sicontrol a-enigma - + ++ - - - - - - + ++ - - - - - - ++ B sienigma F-Enigma F-EnigmaSM a-flag HLK3 cells - - - + ++ + ++ - + - + + - -
Supplemental Data. Hachez et al. Plant Cell (2014) /tpc Suppl. Figure 1A
 /tpc Suppl. Figure 1A") Suppl. Figure 1A Suppl. Figure 1B Supplemental Figure 1: Results of the commercial screening of interactants using split ubiquitin technique. (A) Isolated preys (192) using the bait construct pbt3-n- as
Suppl. Figure 1A Suppl. Figure 1B Supplemental Figure 1: Results of the commercial screening of interactants using split ubiquitin technique. (A) Isolated preys (192) using the bait construct pbt3-n- as
Supplemental Figure 1. Transcript profiles of Arabidopsis IPMS1 and IPMS2 in different tissues and developmental stages.
 Transcript level (intensity) Supplemental Data. Xing et al. Plant Cell (2017) 10.1105/tpc.17.00186 1600 1400 1200 1000 800 600 400 200 0 IPMS1 IPMS2 Supplemental Figure 1. Transcript profiles of Arabidopsis
Nature Methods: doi: /nmeth Supplementary Figure 1. DMS-MaPseq data are highly reproducible at elevated DMS concentrations.
 Supplementary Figure 1 DMS-MaPseq data are highly reproducible at elevated DMS concentrations. a, Correlation of Gini index for 202 yeast mrna regions with 15x coverage at 2.5% or 5% v/v DMS concentrations
Supplemental Data. Borg et al. Plant Cell (2014) /tpc
 /tpc") Supplementary Figure 1 - Alignment of selected angiosperm DAZ1 and DAZ2 homologs Multiple sequence alignment of selected DAZ1 and DAZ2 homologs. A consensus sequence built using default parameters is shown
Supplementary Figure 1 - Alignment of selected angiosperm DAZ1 and DAZ2 homologs Multiple sequence alignment of selected DAZ1 and DAZ2 homologs. A consensus sequence built using default parameters is shown
Maps of Papillomavirus mrna Transcripts
 Maps of Papillomavirus mrna Transcripts mrna Transcript Maps Carl Baker a and Charles Calef b a Basic Research Laboratory, DBS, National Cancer Institute, NIH, Bethesda, MD 20892-5055 b MS K710, Los Alamos
Supplemental Data. Ko et al. (2014). Plant Cell /tpc Supplemental Figure 1. Evidence of T-DNA Insertion in ms142 Mutant.
. Plant Cell /tpc Supplemental Figure 1. Evidence of T-DNA Insertion in ms142 Mutant.") Supplemental Figure 1. Evidence of T-DNA Insertion in ms142 Mutant. (A) DNA gel blotting to hptii probe confirmed single T-DNA insertion (marked with arrow) in ms142 mutant. (B) T-DNA tagged construction
Supplemental Figure 1. Evidence of T-DNA Insertion in ms142 Mutant. (A) DNA gel blotting to hptii probe confirmed single T-DNA insertion (marked with arrow) in ms142 mutant. (B) T-DNA tagged construction
Lecture 2: Biology Basics Continued. Fall 2018 August 23, 2018
 Lecture 2: Biology Basics Continued Fall 2018 August 23, 2018 Genetic Material for Life Central Dogma DNA: The Code of Life The structure and the four genomic letters code for all living organisms Adenine,
Fig. S1. Molecular phylogenetic analysis of AtHD-ZIP IV family. A phylogenetic tree was constructed using Bayesian analysis with Markov Chain Monte
 Fig. S1. Molecular phylogenetic analysis of AtHD-ZIP IV family. A phylogenetic tree was constructed using Bayesian analysis with Markov Chain Monte Carlo algorithm for one million generations to obtain
Supplemental Figure 1 HDA18 has an HDAC domain and therefore has concentration dependent and TSA inhibited histone deacetylase activity.
 Supplemental Figure 1 HDA18 has an HDAC domain and therefore has concentration dependent and TSA inhibited histone deacetylase activity. (A) Amino acid alignment of HDA5, HDA15 and HDA18. The blue line
Supplementary Information. c d e
 Supplementary Information a b c d e f Supplementary Figure 1. atabcg30, atabcg31, and atabcg40 mutant seeds germinate faster than the wild type on ½ MS medium supplemented with ABA (a and d-f) Germination
Fig. S1. TPL and TPL N176H protein interactions. (A) Semi-in vivo pull-down assays using recombinant GST N-TPL and GST N-TPL N176H fusions and
 Semi-in vivo pull-down assays using recombinant GST N-TPL and GST N-TPL N176H fusions and") Fig. S1. TPL and TPL N176H protein interactions. (A) Semi-in vivo pull-down assays using recombinant GST N-TPL and GST N-TPL N176H fusions and transgenic Arabidopsis TPL-HA lysates. Immunoblotting of input
Fig. S1. TPL and TPL N176H protein interactions. (A) Semi-in vivo pull-down assays using recombinant GST N-TPL and GST N-TPL N176H fusions and transgenic Arabidopsis TPL-HA lysates. Immunoblotting of input
ABI3 Controls Embryo De-greening Through Mendel's I locus
 Supporting Online Material for ABI3 Controls Embryo De-greening Through Mendel's I locus Frédéric Delmas a,b,c, Subramanian Sankaranarayanan d, Srijani Deb d, Ellen Widdup d, Céline Bournonville b,c,norbert
SUPPLEMENTARY INFORMATION
 doi:10.1038/nature09861 & &' -(' ()*+ ')(+,,(','-*+,&,,+ ',+' ' 23,45/0*6787*9:./09 ;78?4?@*+A786?B- &' )*+*(,-* -(' ()*+ ')(+,,(','-*+,&,,+ ',+'./)*+*(,-*..)*+*(,-*./)*+*(,-*.0)*+*(,-*..)*+*(,-*
*** *** * *** *** *** * *** ** ***
 Figure S: OsMADS6 over- or down-expression is stable across generations A, OsMADS6 expression in overexpressing (OX, OX, dark bars) and corresponding control (OX, WT, white bars) T4 plants. B, OsMADS6
Supplemental Figure legends Figure S1. (A) (B) (C) (D) Figure S2. Figure S3. (A-E) Figure S4. Figure S5. (A, C, E, G, I) (B, D, F, H, Figure S6.
 (B) (C) (D) Figure S2. Figure S3. (A-E) Figure S4. Figure S5. (A, C, E, G, I) (B, D, F, H, Figure S6.") Supplemental Figure legends Figure S1. Map-based cloning and complementation testing for ZOP1. (A) ZOP1 was mapped to a ~273-kb interval on Chromosome 1. In the interval, a single-nucleotide G to A substitution
Supplemental Figure legends Figure S1. Map-based cloning and complementation testing for ZOP1. (A) ZOP1 was mapped to a ~273-kb interval on Chromosome 1. In the interval, a single-nucleotide G to A substitution
Supplemental Figure 1
 12 1 8 Embryo 6 5 4 Silk 6 4 2 3 2 1 1 15 21 24 3 35 4 45 days after pollination 2 6 12 24 72 hours after pollination 35 6 3 25 2 15 1 5 Endosperm 8 12 21 22 3 35 4 45 days after pollination 5 4 3 2 1