The Role of Services in Domestic and International Value Chains: An Initial Analysis of Trends in Services Value Added in the Indian Economy
|
|
|
- Albert Whitehead
- 6 years ago
- Views:
Transcription

1 The Role of Services in Domestic and International Value Chains: An Initial Analysis of Trends in Services Value Added in the Indian Economy Presentation to Centre for WTO Studies Indian Institute for Foreign Trade New Delhi, 22 August 2014 Jane Drake-Brockman International Trade Centre

 and the World Trade Organisation")

2 What is ITC? ITC is a trade-related technical assistance agency under the joint auspices of United Nations Conference on Trade and Development (UNCTAD) and the World Trade Organisation (WTO) Within the United Nations system, ITC is the niche development partner focused on support for SME competitiveness to achieve export success in developing countries.
3 Overview of Contents Importance of Services to the global and Indian economy Leapfrogging to services: East Asian models of services growth versus India s services revolution Rise of Global Value Chains Transformation of international trade; growing dominance of B2B trade in intermediates Trade in Value-Added Tasks Servification of the Economy Role of India s services industries in GVC participation Trade, development and industry policy insights

4 Importance of Services Source; World Bank (2011)
5 Importance of Services Output and GNI per capita, % Agriculture value added % Industry value added % Services value added Percent GNI per capita
, The Service Revolu.on in South Asia, Figure 1.3-4, p.")
6 Services as a Driver for Development 6 Source: World Bank (2009), The Service Revolu.on in South Asia, Figure 1.3-4, p. 41
7 India s Services Revolution Services-led growth has mushroomed in South Asia, enabling South Asia to grow almost as fast as East Asia, but with a very different growth pattern. In East Asia, e.g. Hong Kong, SAR or Singapore, the services economy has been focused on enabling trade in Goods Eg Hong Kong-based services such as finance, logistics, maritime services, and trade related services of all kinds have developed largely in response to the need to enhance the efficiency of the dynamic manufacturing base in the Pearl River delta These services are firmly embedded in goods exports from the region In South Asia, there has been an explosion of business services, seemingly independent of manufacturing.
8 Leapfrogging to services 8 Evidence has emerged that developing countries are shifting towards services sooner, at at a lower per capita GDP than had been the case in the traditional development trajectory. This suggests that services could provide an alternative engine for development, enabling some latecomers to leapfrog the traditional approach.
9 Services sector growing fastest in LDCs 9 Services, etc., value added (% of GDP) Years LDC Low income Lower middle income Middle income High income World Average Growth Rates LDC 13.06% LIC 9.97% LMIC 7.06% MIC 3.66% HIC 5.43% World 4.86%
10 Contribution of services exports to GDP 8.0% 7.5% 7.0% 6.5% 6.0% LDC High income Low income 5.5% World 5.0% Middle Income 4.5% 4.0%
11 China PRC Services are still underrepresented in GDP, compared with an average of 54% of GDP for developing countries as a group. Sector is targetted for accelerated development and close policy attention; determination to frog leap forward and catch up Importance of services sector recognized in China s Five Year National Development Plan and was an explicit focus in its economic stimulus package during the global recession. Targets set for services employment growth, including in the manufacturing heartland, the Pearl River Delta. Experimentation with services export zones eg Shanghai FTZ The services sector has become extremely important in China s outward FDI flows. From 2010 to 2011, China s outward FDI almost doubled. 80% went to services industries-energy, construction, distribution and financial services.
12 Rise of Global Value Chains International trade can no longer be understood in terms of export or import of finished goods or services produced by one firm, at one location, in one country and thereafter delivered to an unrelated party in another country. Production of goods and increasingly of services involves a combination of intermediate inputs including services activities, sourced globally, to make up a finished output for the final consumer market. This fragmentation of production into goods and services tasks has seen the emergence of a system of global supply or global value chains, referred to by the World Economic Forum as the world economy s backbone and central nervous system.
13 Evolution of GVC phenomenon 1960s: trend towards vertically integrated firms and industries 1970s: wave of global dispersion of industrial activity through investment in offshoring by multinational corporations 1980s: the first evidence of both geographic and organizational fragmentation ( de-verticalisation or unbundling ) of the firm by way of both outsourcing and offshoring into international supply chains 1990s: the rise of China and big new global suppliers. 2000s: widespread application of digital technology, beginning of services offshoring, global knowledge and innovation networks..and the rise of India
14 It is now well understood that any business function can become a core competence, or be outsourced (to another separate provider, for which the outsourced task becomes the core competence). Most can also be offshored (i.e. outsourced to an offshore location), leading to new competitive opportunities for both country and firm level specialization. Supply chain activity has been most pronounced in geographically integrated regions, such as the European Union and East Asia. Remarkably, trade in intermediate goods is now twice as large as trade in consumption goods. For India, 50% of imports are intermediate goods, of which 25% are being re-exported to a third country
 World Trade by End Use 1990-2010 Source: Sebastien Miradout, OECD, 2011 (export")
15 B2B trade in intermediates Trade in intermediates is more important than trade in final products (and has been for a long time) World Trade by End Use Source: Sebastien Miradout, OECD, 2011 (export flow)


16 Trade in Tasks The application of enabling services such as telecommunications and IT has driven deeper segmentation of goods supply chains into production units which are dispersed geographically and yet connected


17 There is lively debate on likely future industry trends, but general evidence suggests that industry conenues to internaeonalise, the produceon process conenues to fragment across borders and the GVC phenomenon is here to stay Boeing has transformed itself into a systems integrator and has outsourced an increasing propor9on of its aircra: produc9on 737 Classic at start of produceon 10% outsourced 747 series at start of produceon 787 Dreamliner at start of produceon 20% outsourced 80% outsourced Parts built by Boeing in- house SOURCE: InternaEonal AssociaEon of Machinists and Aerospace Workers; Boeing; Reuters; McKinsey Global InsEtute


18 iphone Toshiba, Murata Texas Instruments, Broadcom Infineon Samsung Quanta Foxconn

19 . Robotic toy

20 Nutella Value Chain


21 Embodied Services Value Nokia N95 Source: ETLA, The Research Institute of the Finnish Economy Final assembly, 11, 2%


22 T-shirt 22 Fabric; $3.40 Quota; $1.40 Duty ; $1.20 Retail mark-up (design, retail services, marketing) $18.40 Importer (services) $4.35

23 Swedish National Board of Trade : servicification The example of Sandvik - Heavy Tools Manufacturer
24 Services Value Chains This is a more recent phenomenon, but globalisation is bringing about a similar transformation in services as took place in manufacturing. Telecommunications reforms and the application of digital technology to a widening range of business services is driving a rapid emergence of supply chains in services. Traditionally, services providers were constrained by their inability to capture, store and possess the value of the intangible. There were few opportunities to create step by step pathways to market as services tend to be delivered and consumed simultaneously. The application of information technology is radically changing this; there is now a constant quest in the services sector to segment out any business function in which knowledge can be commoditised and packaged as a product, and where ownership can be established, production can be scaled up and trade can take place separately from production. The innovative business process transformation is involving SMEs as well as creating globally integrated services firms. Services intermediates (generally known as knowledge-intensive B2B business services) are now the fastest growing component of world trade today

25 services outsourcing trebled in value The fastest growing six sectors averaged annual growth rates ranging from 25-58%. BPO and ITO continue to dominate, although new niche areas, including engineering grew fast, and KPO fastest.

26 Offshoring Services Value Chain 26


27 Example of a Services Supply Chain Back Office Services Dalian, China Accounts Payable Shanghai, China Japan Procurement Operations Shenzhen, China Human Resources Manila, Philippines Accounting Kuala Lumpur, Malaysia Help Desk and Customer Service Brisbane, Australia 27


28 Knowledge- intensity non linear system feedback loops enabling factors Front Office Customised Problem solving Middle Office Innova9on Lab Back office ITO/BPO/KPO Call centres Accounts, HR Middle Office Product Design Front Office Client Rela9onships & Diagnos9cs Tasks along the Pathway to Market What do Services Value Chains look like?
29 Measuring Trade in Value-Added In 2011, the WTO and IDE/JETRO pioneered the way with a ground-breaking study on trade in tasks which showed how the emergence of GVCs radically challenges the concepts behind traditional measurements of trade flows. The study highlighted the fact that as trade in intermediates becomes more important, traditional trade statistics become less meaningful, as they fail to reflect value-added (ie the value of exports minus imported inputs). Understanding current patterns of production and trade, and the economic significance of India s own participation or lack of participation in GVCs, requires analysis using the new WTO/ OECD Trade in Value-Added (TiVA) data released in 2012.
30 OECD/WTO TiVA data 30 TiVA data tracks the source of value that is added by each country/industry in the production of goods or services for export, avoiding double counting and revealing the role of imports in exports TiVA database provides a breakdown of gross exports by industries and source Domestic Value Added Direct (pure services exports e.g. transport services, business services, financial intermediation etc.) Indirect (originating from domestic services intermediates) Re-imported domestic services value added Foreign Value Added by source country The data base covers large aggregated industry groups; in the services sector it covers ISIC 45 (construction), ISIC 50 to 55 (wholesale and retail trade, hotels and restaurants), ISIC 60 to 64 (transport and storage, post and telecommunication), ISIC 65 to 67 (financial intermediation), ISIC 70 to 74 (real estate, renting and business activities) and ISIC 75 to 95 (community, social and personal services). Not all countries have input/output tables on which this data is based. The country coverage is therefore limited.
31 TiVA services categories 1. Direct domestic services VA (e.g. business services, financial intermediation) value added by services exporting industry, as measured also in the BoP. By definition, equals zero for all goods exports. 2. Indirect domestic services VA content of Gross Exports VA by other domestic services companies that provide intermediate inputs to exports of goods/services (e.g. accounting for domestic goods/ services exporting company) 3. Foreign services VA content of Gross Exports always indirect since it is incorporated in exports via intermediate inputs used by goods/services exporting company.
32 Findings: Imports help grow exports in both manufacturing and services Source: Huberth Escaith, WTO 2012 Source: Yose Rizal Damuri, CSIS, 2014

33 Findings: Servicification In 2008, services were nearly half of world trade in value added 33
34 Services Value added Content in Exports TiVA data identifies the services content of gross exports, measuring a composition of both pure services exports (direct value added) as well as indirect domestic and foreign services embodied in goods exports, and reflecting the general level of servicification of a country s exports. Between the share of total services value added in India s exports has grown by 40% to reach 52% of total gross exports value, significantly above the global average of 45%, the OECD average of 48%, the BRICS average of 47% and the ASEAN average of 39%. The only other economies in which this ratio is higher are Singapore, United Kingdom and Hong Kong, SAR.

35 Services Value added Content in Exports by Country
36 India: Services industries exported VA $USm Electricity, gas and water Construction Wholesale and retail trade Transport and storage, Financial intermediation Business services Other services
 (+102%) and Transport equipment (+67%) Business services: +133% growth Combined share of all services industries exports, account for 57% of total exported DVA compared with a 40%")
37 India: Industry Shares of Exported Domestic Value Added 37 Services 57% Significant drops in Agriculture (-54%),Textiles (-67%), Chemicals (- 38%) Growth in Electrical and optical equipment (+137%), Manufacturing (nec) (+102%) and Transport equipment (+67%) Business services: +133% growth Combined share of all services industries exports, account for 57% of total exported DVA compared with a 40% share in 1995.

38 Comparison with other BRICS (services% of exported VA)

39 18% OECD: Sector Shares of Exported Domestic Value Added Average OECD 2009 Average OECD % 14% 12% 10% 8% 6% 4% 2% 0% Total services: 53%


40 India: Share of services value added by source, as % of gross exports Direct domestic services Indirect domestic services Foreign services value added 60% 50% 11% 10% 9% 40% 7% 30% 4% 21% 19% 19% 20% 20% 21% 10% 0% 12% 17% 22% 23% 23%
41 India: Indirect services VA in exports, by sector 30% % 20% 15% 10% 5% 0% Shifts are only slight; but any decline is a potential red alert in terms of climbing the value added ladder


42 OECD average: services inputs vital to goods GVCs Source: OECD Trade and Agriculture Directorate
43 India: Foreign services VA in exports, by sector 20% % 16% 14% 12% 10% 8% 6% 4% 2% 0% For both China and India, the share of foreign services VA has increased sharply (India: 125% growth, China: 175% growth). Need to compare this figure with trends in overall indirect services inputs eg potential red alert re competitiveness on chemicals. Note sharp rise in foreign services content in some of India s fastest growing goods exports: Electrical equipment (+72%), Manufacturing (nec) (+90%) and Transport equipment (+149%). Share of Foreign services VA also growing rapidly in India s services exports as well (+ 785% in Other services, +223% for Business services exports,103% growth for Financial services.


44 Share of service value added by source, as % of gross exports BRICS 44
45 Role of Indian services industries in GVC participation The % of domestic value added (DVA) in gross exports can be understood as a general reflection of the level of integration into GVCs: the lower the share of domestic content, the more integrated into GVCs High % can be expected in large economies which can source inputs domestically High % can also be expected in geographically isolated economies, in countries with high levels of trade barriers, in economies with exports dominated by upstream activities with little local value added such as mining and perhaps in economies with strong services export performance (direct export of services, as distinct from services embodied in goods).
 100 2009 1995 90 80 70 60 50 40 30 20 10 0 Luxembourg Singapore Ireland Chinese Taipei Korea Hungary Czech Republic Philippines Malaysia Malta")
46 Domestic Value Added as % of Gross Exports India s share of domestic content in exports is 78%, having dropped significantly from 90% in 1995, showing increased participation in GVCs. OECD countries average is 70%; China 67% (drop from 88%) Luxembourg Singapore Ireland Chinese Taipei Korea Hungary Czech Republic Philippines Malaysia Malta Viet Nam Iceland Netherlands Thailand Cambodia Finland Sweden Estonia China Portugal Bulgaria Austria Israel Mexico Hong Kong, China Switzerland Germany France India Turkey Spain Italy Canada Chile United Kingdom South Africa Norway Japan Indonesia Rest of the World Australia Argentina Brunei Darussalam United States Brazil Russian Federation Saudi Arabia
")
47 Comparison with other BRICS (DVA as % of GE) 47

48 Domestic Value Added as % of Gross Exports: BRICS, EU27, OECD, Rest of World, ASEAN 8 48

49 Share of Foreign Value Added in gross exports by region, 2010
 and average for all BRICS (60%).")
50 India: Foreign Value Added as % of Gross Exports by Sector Total foreign content is 22%, cf world average 28% and OECD average of 31%. This has more than doubled since India s growth rate in this indicator is the second highest in the database and significantly above average growth of OECD countries (2 %) and average for all BRICS (60%). Agriculture, mining, financial services exports stand out as dragging the overall figure down, with average foreign content of around 5%. In high value added services sectors, which are also liberalised, such as business services, these low figures are good news, signalling a high degree of local competitiveness.
51 India: Foreign Value Added as % of Gross Exports by Sector 51
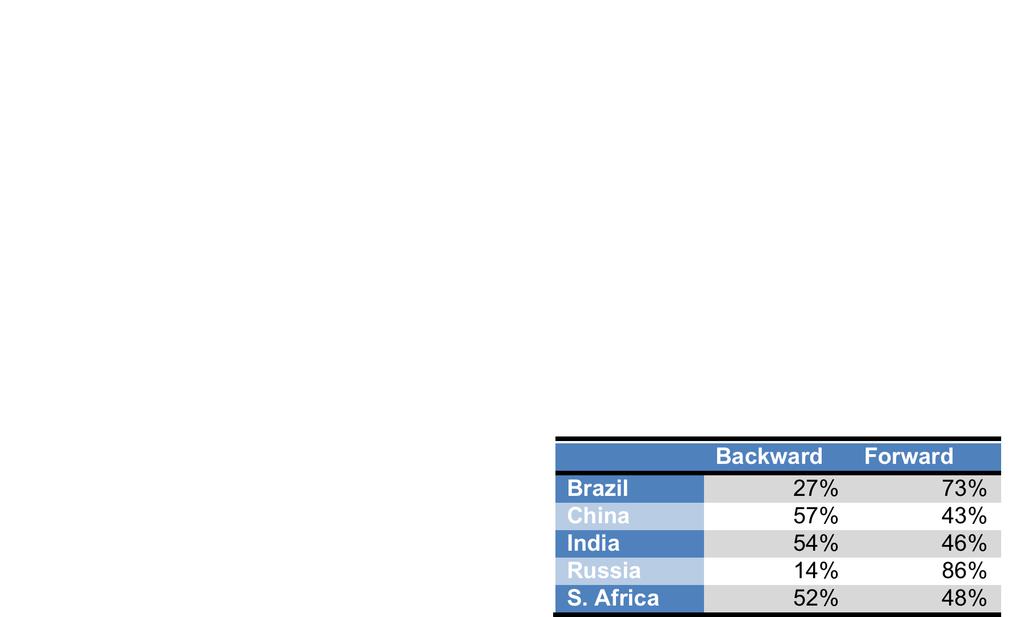
52 GVC Participation Index The OECD also computes an overall GVC Participation Index based on the percentage of a country s exports that form part of GVC activity. The index is broken down into backward participation i.e imported inputs and forward participation i.e exports destined as inputs into other countries exports. In India s case, the GVC participation is at 41%, the bulk of which is due to backward linkages. India s forward linkages are largely as a result of exports of business services. The only other country in the BRICS category that surpasses India in terms of GVC participation is Russia with GVC participation at 50%, largely due to forward linkages of mining and quarrying. Korea, for the purposes of comparison, has a GVC participation rate of over 60%, with the bulk of activity (roughly 2/3) being backward participation.

53 GVC Participation Index: BRICS
54 Policy thoughts Services are so important as intermediate inputs in all other sectors that efficiency in India s domestic services industries is important to India s overall performance in all export sectors. A strategy for growth in Indian industry engagement in increasingly high value-added manufacturing for the global market will requires a focus on developing capacity across all the intermediate services inputs. The services sector is deeply interlinked with the goods sectors; there is no room for an either or industry policy choice India already has first mover advantage in high value-added knowledge-intensive business services But the global competitive challenge is real. The policy challenge is to get the enabling factors right, so that business can move into higher value-added tasks. This requires a dedicated focus on all of the factors being shown in the research literature as driving services trade performance. One of the best conceptual frameworks for understanding this is the Smiley Face, originally drawn by Stan Chih of ACER computers.
55 Drivers of Services Compe99veness 1.Human Capital (talent, educa9on, skills, ideas, culture of customer focus) 2.Investment in Intangible Assets (corporate IP including business methodologies) and suppor9ve environment for Innova9on 3.Enabling Digital and other Infrastructure 4.Quality of Ins9tu9ons & Efficiency of Domes9c Regula9on 5.Connectedness with the Interna9onal Markets (trade & investment reform, standards, mutual recogni9on) 6.Organised Services Business Advocacy and public/private Stakeholder Consulta9on 7.Deliberate Na9onal Policy Focus
 ServicificaCon : Everyone is in services")
56 Value- added Innova9on Hub High Value- Added Goods & Services Centre of Excellence Logis9cs Hub Enabling Factors Standard- isa9on R&D Innova9on Product Design Manufacture & Assembly Transport Logis9cs Distribu9on& Marke9ng Brand Tasks along the Pathway to Market Smiley Face : Role of Services in Goods Value Chains (pre and post manufacture) ServicificaCon : Everyone is in services
APEC Senior Officials Public-Private Dialogue on Services. Clark Freezone, 3 February Jane Drake-Brockman International Trade Centre
 APEC Senior Officials Public-Private Dialogue on Services Clark Freezone, 3 February 2015 Jane Drake-Brockman International Trade Centre Development Trajectory towards Services Source; World Bank (2011)
OECD WORK ON GLOBAL VALUE CHAINS AND TRADE IN VALUE ADDED
 OECD WORK ON GLOBAL VALUE CHAINS AND TRADE IN VALUE ADDED Koen De Backer Workshop on Global Value Chains in Shipbuilding Paris, November 01 The emergence of Global Value Chains Final consumption Final
Measuring Value in Global Value Chains
 GLOBAL COMMODITIES FORUM 7-8 April 2014 Measuring Value in Global Value Chains by Ms. Rashmi Banga UNCTAD The views expressed are those of the author and do not necessarily reflect the views of UNCTAD.
LDC Services: Geneva Practitioners Seminar Series: Making Sense of GATS and Applying Good Practices in Services Negotiations
 LDC Services: Geneva Practitioners Seminar Series: Making Sense of GATS and Applying Good Practices in Services Negotiations Seminar 4: Services in Global Value Chains Session 1: GVC perspective on Global
Evolution of Production Network: Measuring Trade in value-added (TiVA)
") Evolution of Production Network: Measuring Trade in value-added (TiVA) Norihiko YAMANO Directorate for Science Technology and Industry, OECD Working Party on Globalisation of Industry Committee on Industry,
Evolution of Production Network: Measuring Trade in value-added (TiVA) Norihiko YAMANO Directorate for Science Technology and Industry, OECD Working Party on Globalisation of Industry Committee on Industry,
SERVICES IN INDUSTRIAL VALUE CHAINS
 8 SERVICES IN INDUSTRIAL VALUE CHAINS Services value-added, across all world economies, accounted for 29% of global gross exports in 29, according to research by ESCAP (214). In addition, there has been
2014/SOM2/CTI/DIA3/014. Services and GVCs. Submitted by: ICTSD
 2014/SOM2/CTI/DIA3/014 Services and GVCs Submitted by: ICTSD Public-Private Dialogue on Building Asia Pacific Partnership Through Global Value Chains Collaboration Qingdao, China 12 May 2014 Services Network
Linking into Global Value Chains Is Not Sufficient: Do You Export Domestic Value Added Contents?
 Linking into Global Value Chains Is Not Sufficient: Do You Export Domestic Value Added Contents? Journal of Economic Integration Vol.29 No.2, June 2014, 267~297 Linking into Global Value Chains Is Not
Trade in Intermediate Goods, Armington Elasticity and Exchange Rate Pass-through. Fumihide TAKEUCHI Tokai University (Japan)
") Trade in Intermediate Goods, Armington Elasticity and Exchange Rate Pass-through Fumihide TAKEUCHI Tokai University (Japan) 1 What is an exchange rate pass-through (ERPT)? Effect of exchange rate changes
Trade in Intermediate Goods, Armington Elasticity and Exchange Rate Pass-through Fumihide TAKEUCHI Tokai University (Japan) 1 What is an exchange rate pass-through (ERPT)? Effect of exchange rate changes
LDC Services: Geneva Practitioners Seminar Series: Making Sense of GATS and Applying Good Practices in Services Negotiations
 LDC Services: Geneva Practitioners Seminar Series: Making Sense of GATS and Applying Good Practices in Services Negotiations Seminar 4: Drivers of services competitiveness WTO Building, Room B 27 March
OECD INTER-COUNTRY INPUT-OUTPUT DATA AND EMBODIED CO2 EMISSIONS
 OECD INTER-COUNTRY INPUT-OUTPUT DATA AND EMBODIED CO2 EMISSIONS Kirsten Wiebe & Norihiko Yamano OECD Directorate for Science, Technology and Innovation COP21 Le Bourget, France November 30, 2015 OECD Inter-country
Climate Change, trade and production of energy-supply goods: The need for levelling the playing field Veena Jha
 Climate Change, trade and production of energy-supply goods: The need for levelling the playing field Veena Jha Presentation at the WTO workshop on environmental goods and services. This presentation is
Decision taken from September 2010 Four focus areas: megacities, informal sector, global recycling markets & international aid tools Members: Antonis
 ISWA s Task Force on Globalization & Waste Management Decision taken from September 2010 Four focus areas: megacities, informal sector, global recycling markets & international aid tools Members: Antonis
Global Enabling Trade Report 2010
 Global Enabling Trade Report 2010 Margareta Drzeniek Hanouz, Senior Economist World Economic Forum OECD Experts Meeting on Aid for Trade Indicators Paris, 22 October 2010 Outline Objectives and process
THE ECONOMIC IMPACT OF IT, SOFTWARE, AND THE MICROSOFT ECOSYSTEM ON THE GLOBAL ECONOMY
 Addendum THE ECONOMIC IMPACT OF IT, SOFTWARE, AND THE MICROSOFT ECOSYSTEM ON THE GLOBAL ECONOMY METHODOLOGY AND DEFINITIONS Global Headquarters: 5 Speen Street Framingham, MA 01701 USA P.508.872.8200 F.508.935.4015
Working Party of the Trade Committee
 Unclassified TAD/TC/WP(2012)6/FINAL TAD/TC/WP(2012)6/FINAL Unclassified Organisation de Coopération et de Développement Économiques Organisation for Economic Co-operation and Development 19-Dec-2013 English
Strategy and Outlook Annual General Meeting. Hubert Sagnières May 5, 2011
 Strategy and Outlook 2011 Annual General Meeting Hubert Sagnières May 5, 2011 The Optical Market in 2011 A still significantly under-penetrated market A high ramp-up potential A growing, profitable mid-range
Mapping Global Value Chains
 Please cite this paper as: De Backer, K. and S. Miroudot (2013), Mapping Global Value Chains, OECD Trade Policy Papers, No. 159, OECD Publishing. http://dx.doi.org/10.1787/5k3v1trgnbr4-en OECD Trade Policy
Energy Efficiency Indicators: The Electric Power Sector
 Energy Efficiency Indicators: 5 Sectors, 5 Challenges Mexico City, Mexico 14-15 March 2011 Energy Efficiency Indicators: The Electric Power Sector Robert Schnapp Head, Coal, Renewables, Electric and Heat
ISSN X INTERNATIONAL TRADE. Beyond the copper sector. Chile s engagement in international production networks.
 ISSN 1680-872X S E R I E S INTERNATIONAL TRADE Beyond the copper sector Chile s engagement in international production networks Dayna Zaclicever 139 Beyond the copper sector Chile s engagement in international
10 ECB HOW HAVE GLOBAL VALUE CHAINS AFFECTED WORLD TRADE PATTERNS?
 Box 1 HOW HAVE GLOBAL VALUE CHAINS AFFECTED WORLD TRADE PATTERNS? In recent decades, global trade has undergone profound changes. Relative to global output, trade has risen sharply and cross-country linkages
A Ten Year Strategic Outlook for the Global Flexible Plastic Packaging Market. Sample pages. Commodity Inside Ltd
 A Ten Year Strategic Outlook for the Global Flexible Plastic Packaging Market Sample pages Chapter 1- Executive summary 1.1 Changes in the global flexible plastic packaging industry 1.2 Cost effectiveness
OXFORD ECONOMICS. Global Industry Services Overview
 OXFORD ECONOMICS Global Industry Services Overview 2016 ABOUT OXFORD ECONOMICS Oxford Economics is a world leader in global forecasting and quantitative analysis. Our worldwide client base comprises over
The Innovation Union Scoreboard: Monitoring the innovation performance of the 27 EU Member States
 MEMO/12/74 Brussels, 7 February 2012 The Innovation Union Scoreboard: Monitoring the innovation performance of the 27 EU Member States This MEMO provides an overview of the research and innovation performance
Mapping and Measuring Trade in Tasks in Global Supply Chains
 Workshop on Global Supply Chains and Trade in Value Added 13-14 December 2013, Hong-Kong Mapping and Measuring Trade in Tasks in Global Supply Chains Hubert Escaith hubert.escaith@wto.org Outline 1. Motivation
THE 2008 ROUND OF REVISIONS OF THE NON-MANUFACTURING REGULATION (NMR) AND REGULATORY IMPACT (RI) INDICATORS
 AND REGULATORY IMPACT (RI) INDICATORS") THE 2008 ROUND OF REVISIONS OF THE NON-MANUFACTURING REGULATION (NMR) AND REGULATORY IMPACT (RI) INDICATORS The Non-Manufacturing Regulation (NMR) and Regulatory Impact (RI) indicators have been updated,
THE 2008 ROUND OF REVISIONS OF THE NON-MANUFACTURING REGULATION (NMR) AND REGULATORY IMPACT (RI) INDICATORS The Non-Manufacturing Regulation (NMR) and Regulatory Impact (RI) indicators have been updated,
Recent trends in trade
 level 2 Recent trends in trade Marc Bacchetta ERSD - WTO Trends in trade Dramatic increase in both the volumes and values of trade between 1980 and 2011, mostly manufactured goods. World trade grew much
Status Setting on Uses of GVC / Value-Added Trade Statistics
 2014/SOM2/CTI/DIA3/004 Status Setting on Uses of GVC / Value-Added Trade Statistics Submitted by: United States Public-Private Dialogue on Building Asia Pacific Partnership Through Global Value Chains
Gross Domestic Product
 Gross Domestic Product ICT output declined... For the first time in the entire analyzed period (2002-2008), Canada's ICT sector output declined (-0.5%) at the end of 2008. However, this decline was at
Integration in global value chains Share of value added exports in the total exports of the country under review in 2011
 Foreign trade can be analyzed in terms of the domestic value added contained in exchanges. This enables each economy s own contribution to its exports to be pinpointed, excluding those of other countries
International Trade in Value Added: Some Suggestions for Improved and New Indicators
 "Science Stays True Here" Journal of Mathematics and Statistical Science, Volume 2016, 256-263 Science Signpost Publishing International Trade in Value Added: Some Suggestions for Improved and New Indicators
Challenges and Opportunities of Global Value Chains in the Context of SMEs
 Challenges and Opportunities of Global Value Chains in the Context of SMEs National Consultation on SDGs Industrialisation and Employment for Sustainable Growth in India 2-3 rd August 2016, New Delhi Pranav
OTS. FEEL GOODS. COMPANY PROFILE
 OTS. FEEL GOODS. COMPANY PROFILE CONTENTS 4 ABOUT US 6 TRANSPORT 8 MISSION 10 VISION 12 SERVICES 14 SALES AND CUSTOMER SERVICE 16 IMPORT / EXPORT AND CROSSTRADE 18 LOGISTICS 20 CUSTOMS 22 PROJECT DIVISION
Misthinking Globalisation. Richard Baldwin Graduate Institute, Geneva & University of Oxford
 Misthinking Globalisation Richard Baldwin Graduate Institute, Geneva & University of Oxford Conventional view of globalisation Autarky to free trade, slowly. Several waves, but single process. 1870 1990:
Staples & OB10. Conference Presentation. Kevin Bourke & Joachim Eckerle Date: Presented by:
 Staples & OB10 Conference Presentation Presented by: Kevin Bourke & Joachim Eckerle Date: November 2012 Staples Structure $24 Billion USD Global Sales 88,000+ Associates One of the Largest ecommerce Sales
Argus Ethylene Annual 2017
 Argus Ethylene Annual 2017 Market Reporting Petrochemicals illuminating the markets Consulting Events Argus Ethylene Annual 2017 Summary Progress to the next peak of the economic cycle, now expected by
B3. International trade and transport flows
 B3. International trade and transport flows Introduction Over the past two decades the spread of a global supply chain has allowed trade to grow exceptionally fast. Containerisation promotes globalisation
Internationalisation Home versus host compensation approach at Reckitt Benckiser
 Internationalisation Home versus host compensation approach at Reckitt Benckiser Internationalisation Home versus host compensation approach at Reckitt Benckiser With the economic downturn continuing worldwide,
Global value chains (GVCs):
:") Global value chains (GVCs): A dominant feature of today s global economy. Internationally fragmented production, driven by technological progress, cost, access to resources and markets, and trade policy
Global value chains (GVCs): A dominant feature of today s global economy. Internationally fragmented production, driven by technological progress, cost, access to resources and markets, and trade policy
Globalization and urban environmental change in the Asia Pacific Region
 UN DESA International workshop on Global urbanization, internal migration, population distribution and development 21-23 January 2008 Globalization and urban environmental change in the Asia Pacific Region
Cross-border Executive Search to large and small corporations through personalized and flexible services
 Cross-border Executive Search to large and small corporations through personalized and flexible services In-depth local knowledge of each job market as well as reliable information on compensation, industry
Country Trade View: South Korea. Trends in global trade
 Country Trade View: South Korea Trends in global trade General Markets Analysis / September 2016 Summary The Korean economy is heavily reliant on foreign supply of raw materials and fuel imports. Fuels
Misthinking Globalisation
 Misthinking Globalisation Richard Baldwin Graduate Institute, Geneva & University of Oxford Conventional view of globalisation No trade to free trade, slowly. 1870 1990: Globalisation Trade costs 1.8 1.7
OECD WORK ON GLOBAL VALUE CHAINS AND TRADE IN VALUE ADDED. Koen De Backer
 OECD WORK ON GLOBAL VALUE CHAINS AND TRADE IN VALUE ADDED Koen De Backer Bruegel workshop, Brussels, 27 June 2013 Interconnected Economies Benefiting from Global Value Chains oe.cd/gvc 2 What does the
Argus Benzene Annual 2017
 Argus Benzene Annual 2017 Petrochemicals illuminating the markets Market Reporting Consulting Events Argus Benzene Annual 2017 Summary The Argus (formerly DeWitt) Benzene Annual has provided an accurate
OECD Information Technology Outlook 2008 Highlights
 OECD Information Technology Outlook 28 Highlights The ICT industry has slowed with the world economic slowdown but growth continues in some markets and products The outlook for the ICT sector has weakened
WORKFORCE METRICS BENCHMARK REPORT
 WORKFORCE METRICS BENCHMARK REPORT THE MORE YOU KNOW, THE SMARTER YOU WORK As an HR professional, you focus on helping your organization optimize its human capital, but how do you show that achievement?
GLOBAL VIDEO-ON- DEMAND (VOD)
") GLOBAL VIDEO-ON- DEMAND (VOD) HOW WORLDWIDE VIEWING HABITS ARE CHANGING IN THE EVOLVING MEDIA LANDSCAPE MARCH 2016 A CHANGING VIDEO-VIEWING LANDSCAPE Nearly two-thirds of global respondents say they watch
GLOBAL VIDEO-ON- DEMAND (VOD) HOW WORLDWIDE VIEWING HABITS ARE CHANGING IN THE EVOLVING MEDIA LANDSCAPE MARCH 2016 A CHANGING VIDEO-VIEWING LANDSCAPE Nearly two-thirds of global respondents say they watch
The revision of MSITS : Outline
 Statistics on Trade in Services: New Developments. The revised Manual on Statistics of international Trade in services. (MSITS 2010) Bettina.Wistrom@OECD.org OECD Statistics Directorate Main Sources WTO
TRADE STRUCTURE OF INDIA AND CHINA
 CHAPTER - IV TRADE STRUCTURE OF INDIA AND CHINA 4.1 Introduction : As noted in the discussion in chapter-3, highlights the fact that trade liberalization journey has been quite diverse in India and China.
3-2. LNG in the Asia-Pacific
 APERC Workshop at EWG52 Moscow, Russia, 18 October, 2016 3-2. LNG in the Asia-Pacific Favoring trade and rational market development Kirsten Smith Researcher, APERC Report Highlights Report Highlights
Global Value Chains and Development. Roberta Rabellotti University of Pavia & Aalborg University
 Global Value Chains and Development Roberta Rabellotti University of Pavia & Aalborg University roberta.rabellotti@unipv.it MY CV in brief Degree in Economics Università Bocconi in Milan; MSc in Development
Linkages Between US Firms and Global Markets for IT Products
 2 Linkages Between US Firms and Global Markets for IT Products The US market for IT products is by far the largest in the world. However, the demand for these products is expanding rapidly abroad, particularly
DIMERCO EXPRESS GROUP OVERVIEW
 DIMERCO EXPRESS GROUP OVERVIEW 2018/6/19 TAIWAN DIMERCO AT A GLANCE 2 Full-Service Air, Ocean, Customs Brokerage & Logistics Company Near 50 years of Int'l Logistics Services Y2017 USD 576 Million Over
Asia s Fashion Jewellery & Accessories Fair March Exhibitors Survey Report
 Asia s Fashion Jewellery & Accessories Fair March Exhibitors Survey Report 1 Survey Summary Total number of exhibitors 383 Total number of collected onsite survey 254 Overall onsite survey response rate
Global Exhibition Barometer 16 th edition (January 2016)
") Global Exhibition Barometer 16 th edition (January 2016) A UFI report based on the results of a survey conducted in December 2015 Global US Mexico Central & South America Brazil Southern Africa Table of
Global Exhibition Barometer 16 th edition (January 2016) A UFI report based on the results of a survey conducted in December 2015 Global US Mexico Central & South America Brazil Southern Africa Table of
Steel Market Research & Consultancy
 Steel Market Research & Consultancy Flat Products Long Products Medium Term Forecast Long Term Forecast Consultancy GFMS: The Leading Provider p.2 Advantages From GFMS Steel Research p.3 GFMS Steel Research
Estimating the Indirect Economic Benefits from Research
 Estimating the Indirect Economic Benefits from Research Bruce A. Weinberg Ohio State University, IZA, & NBER www.bruceweinberg.net National Academies April 18-19, 2011 Background Governments are major
World Potato Map 2019: Fries Are on the Menu Globally
 March 2019 World Potato Map 2019: Fries Are on the Menu Globally RaboResearch Food & Agribusiness Stefan van Merrienboer Analyst F&A NL +31 6 1162 7255 Only a small share of potatoes is traded internationally.
Global Gas Deregulation Ed
 Global Gas Deregulation Ed 1 2012 What s in this report and analysis? Overview of the state of the gas sector World Survey of Gas Privatisation and Deregulation Coverage of Gas privatisation and deregulation
A world in transition: PwC s 2017 APEC CEO Survey, November APEC CEO Survey. Indonesia findings.
 A world in transition: PwC s 2017 APEC CEO Survey, November 2017 2017 APEC CEO Survey Indonesia findings www.pwc.com/apec Key themes Making of the workforce of the future An operating model for a fluid
International Business Parcels Rate card
 International Business Parcels Rate card Tracked Effective from 3rd July 2017 Standard Tracked Tracked Signed Standard 1 Contents International Business Parcels services... 3 International Tracked... 4
MERCER EXECUTIVE REMUNERATION GUIDE THE KEY TO DESIGNING COMPETITIVE EXECUTIVE REMUNERATION IN THE MIDDLE EAST
 MERCER EXECUTIVE REMUNERATION GUIDE THE KEY TO DESIGNING COMPETITIVE EXECUTIVE REMUNERATION IN THE MIDDLE EAST CONSIDER THESE QUESTIONS Do you have an easy-to-use source for comparing compensation and
Forest Stewardship Council
 Global FSC certified area*: by region Africa CAMEROON CONGO, THE REPUBLIC OF GABON GHANA MOZAMBIQUE NAMIBIA SOUTH AFRICA SWAZILAND TANZANIA, UNITED UGANDA Asia CAMBODIA CHINA INDIA INDONESIA JAPAN KOREA,
COMPENSATION REVIEW AND ANALYSIS SERVICES TAKING THE WORK OUT OF YOUR COMPENSATION REVIEW PROCESS
 COMPENSATION REVIEW AND ANALYSIS SERVICES TAKING THE WORK OUT OF YOUR COMPENSATION REVIEW PROCESS COMPENSATION REVIEW AND ANALYSIS SERVICES WHAT ARE MERCER S COMPENSATION REVIEW AND ANALYSIS SERVICES?...
 www.clicksthrunetwork.com About Clicks Thru Network (CTN) 5,000,000,000+ monthly impressions CTN is a leader in Online (WEB), Email Marketing and Mobile (WAP) advertising platform. CTN founded in 2010
PEFC Global Statistics: SFM & CoC Certification. November 2013
 PEFC Global Statistics: SFM & CoC Certification 1 November 2013 Members; Endorsed Systems; Distribution of Certificates North America 151 million ha 60% TCA 503 CoC Europe 81 million ha 32% TCA 8,389 CoC
Forest Stewardship Council
 Global FSC Certified Businesses: by country PUERTO RICO 4 FINLAND 83 BAHRAIN GUATEMALA 29 MACEDONIA 3 VIETNAM 004 CONGO, THE REPUBLIC OF 5 NEW ZEALAND 287 KOREA, REPUBLIC OF 243 UGANDA 3 MONACO 4 EGYPT
LNG in the Asia Pacific
 2016/EWG52/WKSP1/004 LNG in the Asia Pacific Submitted by: APERC Asia Pacific Energy Research Centre Workshop Moscow, Russia 18 October 2016 APERC Workshop at EWG52 Moscow, Russia, 18 October, 2016 3-2.
Energy Innovation Scoreboard A Pilot Framework with a Focus on Renewables
 Energy Innovation Scoreboard A Pilot Framework with a Focus on Renewables Claudia Kettner, Angela Köppl IEA Workshop on "Modelling and Analyses in R&D Priority-Setting and Innovation" IEA, 24 April 2014
Non-technical Innovations Definition, Measurement & Policy Implications. The new service economy: growth and implications for service innovation
 Karlsruhe, October 2008 Non-technical Innovations Definition, Measurement & Policy Implications The new service economy: growth and implications for service innovation Professor of Economic Policy, University
Supply Demand Talent Shortage Survey Results
 Supply Demand 2010 Talent Shortage Survey Results Global Manpower Inc. (NYSE: MAN) surveyed over 35,000 employers across 36 countries and territories during the first quarter of 2010 to determine the impact
Indonesia Automotive Industries' Situation and Challenges Toward IR 4.0
 Indonesia Automotive Industries' Situation and Challenges Toward IR 4.0 0 Contribution from Automotive Industry Manufacturing is one of the key industries to support Indonesia economy growth, and inside
Energy Efficiency & the Energy Future in ASEAN Amit Bando, Executive Director, IPEEC Bangkok, Thailand 5 June 2013
 Energy Efficiency & the Energy Future in ASEAN Amit Bando, Executive Director, IPEEC Bangkok, Thailand 5 June 2013 1. What is IPEEC? 1 2 3 IPEEC is a high level international forum Provides global leadership
Background of gas data transparency Gas data collection exercise: questionnaire, methodologies and definitions
 Background of gas data transparency Gas data collection exercise: questionnaire, methodologies and definitions Yuichiro Torikata Energy Analyst International Energy Forum What has been done so far Outcome
Siemens Partner Program
 Siemens Partner Program Factory Automation Partner Strategy for Factory Automation End Customer Focus on core competencies Demand on efficient solutions Certified Partner Added value in solutions and services
 http://e-asia.uoregon.edu THE ROLE OF SMALL & MEDIUM-SIZED ENTERPRISES IN EXPORTS TO CHINA: A STATISTICAL PROFILE Results from the 2003 Exporter Data Base International Trade Administration Manufacturing
ASIA RISING: OPPORTUNITIES FOR ONTARIO
 ASIA RISING: OPPORTUNITIES FOR ONTARIO Yuen Pau Woo, President and CEO Asia Pacific Foundation of Canada Presentation to the Asia Pacific Global Export Forum Toronto, Ontario September 23 rd 2013 Canada
FSC Facts & Figures. November 15. FSC F FSC A.C. All rights reserved
 FSC Facts & Figures November FSC F00000 FSC A.C. All rights reserved Global FSC certified forest area North America.u of total FSC certified area / 6.8.89 ha D 6 certificates Europe 8u of total FSC certified
 Knowledge for Africa s Development: Innovation, Education, and Information and Communications Technologies Johannesburg, South Africa, May 8-10, 2006 DEVELOPING AND IMPLEMENTING KNOWLEDGE STRATEGIES EXPERIENCES
Process Maturity Profile
 Carnegie Mellon University Process Maturity Profile Software CMM CBA IPI and SPA Appraisal Results 2002 Year End Update April 2003 We could not produce this report without the support of the organizations
3 Italy Takes Its Innovation Strategy to a New Level with Collaborative Go-to-Market Plan for SMBs
 CUSTOMER CASE STUDY 3 Italy Takes Its Innovation Strategy to a New Level with Collaborative Go-to-Market Plan for SMBs Executive Summary CUSTOMER NAME 3 Italy INDUSTRY Service Provider BUSINESS CHALLENGES
Payroll Across Borders
 Payroll Across Borders 2 Question: Are you planning to expand your Does Global Payroll truly exist? business into new global markets? Question: Based on your experience, do you believe that there is a
Supply Chain Management
 Supply Chain Management Isabelle Stauffer Madrid, January 2017 Agenda 01 02 03 04 RobecoSAM & Corporate Sustainability Assessment (CSA) Supply Chain Management An Overview RobecoSAM s Expectations on Companies
FSC Facts & Figures. December 1, FSC F FSC A.C. All rights reserved
 FSC Facts & Figures December, 0 FSC F00000 FSC A.C. All rights reserved Global FSC certified forest area North America.9v of total FSC certified area m 67::08 ha I 47 certificates Europe 47.v of total
International management system: ISO on environmental management
 International management system: ISO 14000 on environmental management Introduction In response to the growing interest from businesses in environmental standards, the International Standardization Institute,
IFS APPLICATIONS SOLUTIONS FOR AGILE BUSINESS. The short version
 APPLICATIONS SOLUTIONS FOR AGILE BUSINESS The short version 2 ifs Applications SOLUTIONS FOR AGILE BUSINESS OUR SOLUTION S DNA When we first set out to create Applications over 25 years ago, our goal was
GLOBAL VALUE CHAINS INTRODUCTION AND SUMMARY DIRECT AND INDIRECT EXPORTS
 GLOBAL VALUE CHAINS Peter Beck Nellemann and Karoline Garm Nissen, Economics INTRODUCTION AND SUMMARY A final product is created through a chain of activities such as design, production, marketing and
Schedule of Accreditation issued by United Kingdom Accreditation Service 2 Pine Trees, Chertsey Lane, Staines-upon-Thames, TW18 3HR, UK
 2 Pine Trees, Chertsey Lane, Staines-upon-Thames, TW18 3HR, UK Accredited to ISO/IEC ISO 17021-1:2015 to provide quality Stocking Lane High Wycombe Buckinghamshire HP14 4ND Contact: Mr Alan Gower Tel:
Cisco IT Data Center and Operations Control Center Tour
 Cisco IT Data Center and Operations Control Center Tour Page 1 of 7 4 Root Cause Analysis and Change Management Root Cause Analysis Figure 1. Ian Reviewing Updates Ian: The incident management process
FSC Facts & Figures. August 4, FSC F FSC A.C. All rights reserved
 FSC Facts & Figures August 4, 2016 FSC F0001000 FSC A.C. All rights reserved Global FSC-certified forest area North America 35.9% of total FSC-certified area ( 68,725,419 ha ) 249 certificates Europe 47.7%
FSC Facts & Figures. September 12, FSC F FSC A.C. All rights reserved
 FSC Facts & Figures September 12, 2016 FSC F0001000 FSC A.C. All rights reserved Global FSC-certified forest area North America 35.8% of total FSC-certified area ( 68,217,276 ha ) 243 certificates Europe
Climate Change, trade and production of energy supply goods: The need for levelling the playing field -Veena Jha
 Climate Change, trade and production of energy supply goods: The need for levelling the playing field -Veena Jha Presentation at OECD seminar on the 10 th of May, 2009 Introduction Economic crisis implies
MEDIA ADVISORY. Tokyo, January 29, 2007
 Tokyo, January 29, 2007 MEDIA ADVISORY The Waseda University Institute of E-Government has released its 2007 World E-Government Ranking. For three consecutive years, the Institute has ranked the development
THE DEVELOPMENT ASSISTANCE COMMITTEE: ENABLING EFFECTIVE DEVELOPMENT
 THE DEVELOPMENT ASSISTANCE COMMITTEE: ENABLING EFFECTIVE DEVELOPMENT BIODIVERSITY- RELATED OFFICIAL DEVELOPMENT ASSISTANCE 2015 The adoption of the Strategic Plan for Biodiversity 2011-2020 under the Convention
SOUTHEA ST ASIA ENERGY OUTLOOK EXECUTIVE SUMMARY. World Energy Outlook Special Report
 SOUTHEA ST ASIA ENERGY OUTLOOK EXECUTIVE SUMMARY World Energy Outlook Special Report INTERNATIONAL ENERGY AGENCY The International Energy Agency (IEA), an autonomous agency, was established in November
FSC Facts & Figures. January 6, FSC F FSC A.C. All rights reserved
 FSC Facts & Figures January 6, 2017 FSC F000100 0 FSC A.C. All rights reserved Global FSC-certified forest area North America 35.3% of total FSC-certified area ( 69,212,841 ha ) 248 certificates Europe
FSC Facts & Figures. February 1, FSC F FSC A.C. All rights reserved
 FSC Facts & Figures February 1, 2017 FSC F000100 0 FSC A.C. All rights reserved Global FSC-certified forest area North America 35.8% of total FSC-certified area ( 69,590,919 ha ) 249 certificates Europe
FUTURE OF BUSINESS SURVEY
 Future of Business Survey 01 FUTURE OF BUSINESS SURVEY TRADE REPORT JULY 2017 Future of Business Survey 02 INTRODUCTION¹ In January 2017, we published a report² based on findings from the Future of Business
FSC Facts & Figures. March 13, FSC F FSC A.C. All rights reserved
 FSC Facts & Figures March 13, 2017 FSC F000100 0 FSC A.C. All rights reserved Global FSC-certified forest area North America 35.6% of total FSC-certified area ( 69,049,912 ha ) 248 certificates Europe