A subclass of HSP70s regulate development and abiotic stress responses in Arabidopsis thaliana
|
|
|
- Rosamund Davis
- 6 years ago
- Views:
Transcription
1 Journal of Plant Research A subclass of HSP70s regulate development and abiotic stress responses in Arabidopsis thaliana Linna Leng 1 Qianqian Liang 1 Jianjun Jiang 1 Chi Zhang 1 Yuhan Hao 1 Xuelu Wang 2 Wei Su 1,* 1 State Key Laboratory of Genetic Engineering and Institute of Plant Biology, School of Life Sciences, Fudan University, Shanghai , China 2 College of Life Science and Technology, Huazhong Agricultural University, Wuhan , China These authors contributed equally to this work *Correspondence: weisu@fudan.edu.cn Supplementary materials Fig. S1 Fig. S2 Fig. S3 Fig. S4 Fig. S5 Fig. S6 Fig. S7 Table S1 Table S2 Materials and methods Confocal microscopy

#!")
#!")
# \" #")


,")
, Merge (d)")
2 24 Supplementary figures!!"#$%&'&()#!"#$%&*&()#!"#$%&+&()#!"#$%&,&()#!"#$%&-&()# " # $ Fig. S1 Subcellular localizations of HSP70-1 to HSP70-5 in Nicotiana benthamiana pavement leaves. Microscope images of Nicotiana benthamiana leaves transient expressing HSP70-1-GFP to HSP70-5-GFP were stained with DAPI. (a d) The image of DAPI channel (a), GFP channel (b), bright field (c), Merge (d) showed that the HSP70-1 to HSP70-5 proteins were located both in cytosol and nucleus. Bar = 100 µm. 30 2
 and that for TUB2 are 664 bp (741 1,304).")
3 31!"#$%!"#$%&' ()*$%&'+&'%(,-./)&*+(,-./)&'%( Fig. S2 HSP70-5 gene expression in wild type and hsp70-5 mutant. The TUB2 gene was used as the quantitative control. The amplified products of HSP70-5 are 1,941 bp (full length of HSP70-5 CDS) and that for TUB2 are 664 bp (741 1,304). PCR products amplified for 30 cycles were used to detect the expression of HSP70-5, 25 cycles and 30 cycles for TUB
; M, marker.")
4 Fig. S3 Genotype identification of hsp70-1/4 and hsp70-2/4/5 mutants. Genomic DNA was used as a template for genotyping PCR. L, left primer; R, right primer; T, T-DNA primers (LBb1.3 for hsp70-1 to hsp70-4, LB1 for hsp70-5); M, marker. The mutant hsp70-1/4 was hsp70-1 -/- hsp70-3 +/- hsp70-4 -/- and mutant hsp70-2/4/5 was hsp70-2 -/- hsp70-3 +/- hsp70-4 -/- hsp70-5 -/- 44 4
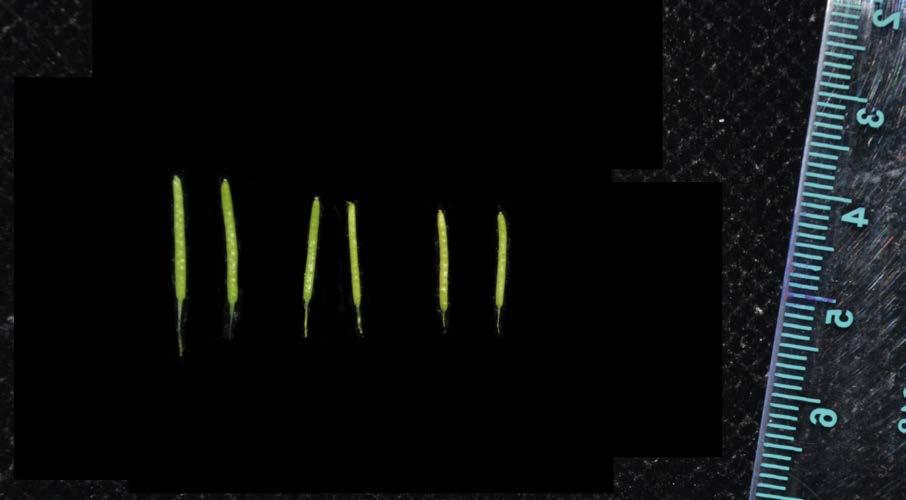
5 45 & &'()*+,-.,/012,.-+,340562,6-,*56*+,)-46758,2608*, $" $! #" #! "! 9-4:! %%%!"#$%&'()* %%%!"#$%&+()(,* " # &'()*+,-.,/012,.-+,340562,6-,*56*+,.4-<*+758,2608*, ;! $! #!! 9-4:!!"#$%&'()* %%% %%%!"#$%&+()(,* &'()*+,-.,/012,.-+,340562,6-,*56*+,)+05=>758,2608*, ;! $! #!! 9-4:!!"#$%&'()! %%% %%%!"#$%&+()(,! $ %?>*,4*586>,-.,6>*,2747@'*2, A=(B #C$!CE!CD!C! 9-4:!!"#$%&'()* %%% %%%!"#$%&+()(,*?>*,<7/6>,-.,6>*,26*(2,A((B #C!!CE!CF!CD!C$!C! 9-4:!!"#$%&'()* %%% %%%!"#$%&+()(,* Fig. S4 Statistical analyses of developmental phenotypes of the hsp70-1/4 double mutant and hsp70-2/4/5 triple mutant. (a c) Both mutants showed developmental phenotypes of accelerating bolting (a), flowering (b) and branching (c). (d) The siliques of both mutants were shorter than Col fully expanded siliques from 6 individual plants (5 siliques from each plant) were measured. (e) The stems were thinner in both mutants than Col-0. Fifteen stem segments (5 cm long) excised from the base of the main stem were measured. Student s t-test was used to determine significance. ***P <

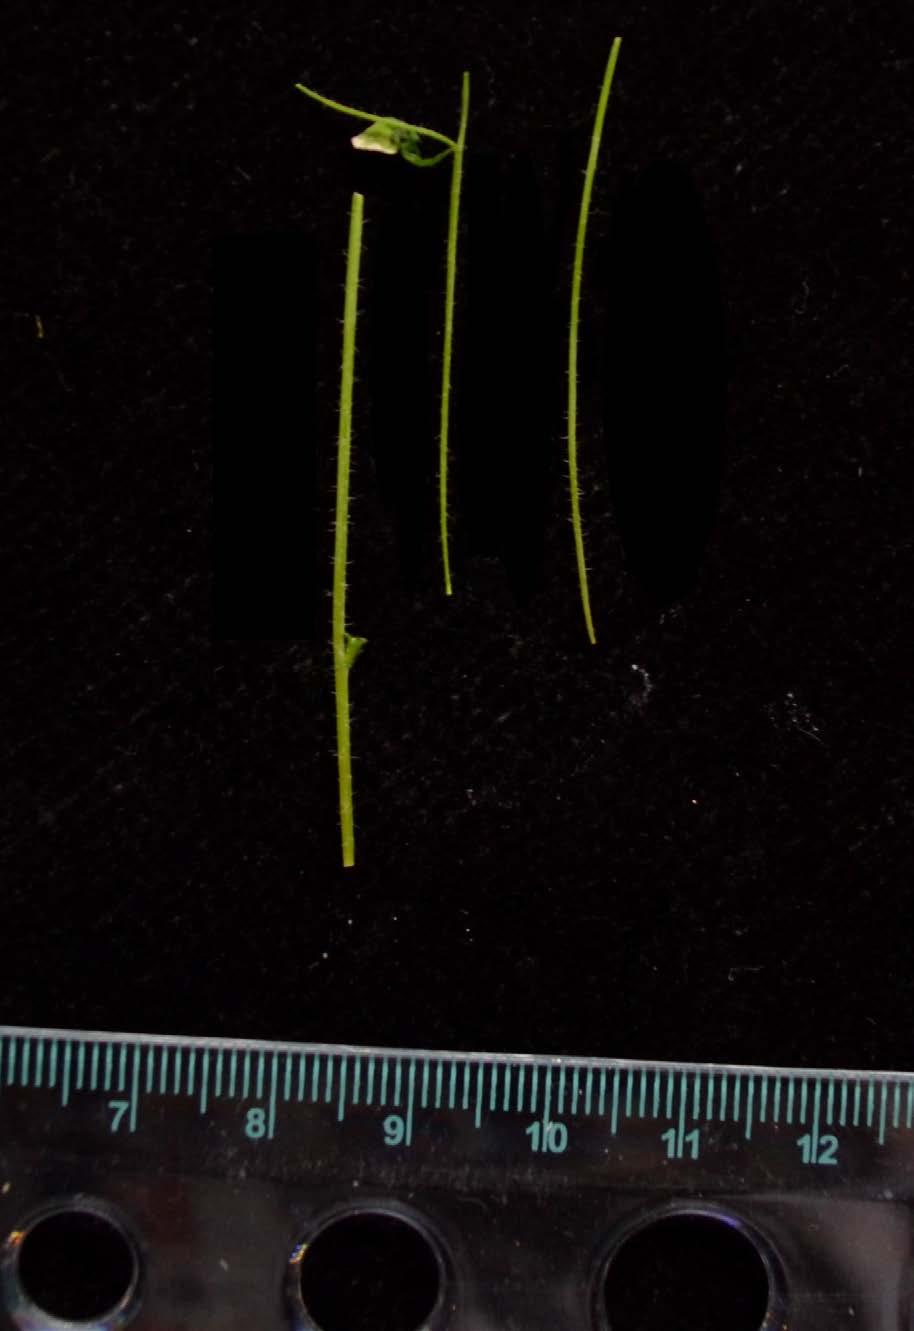
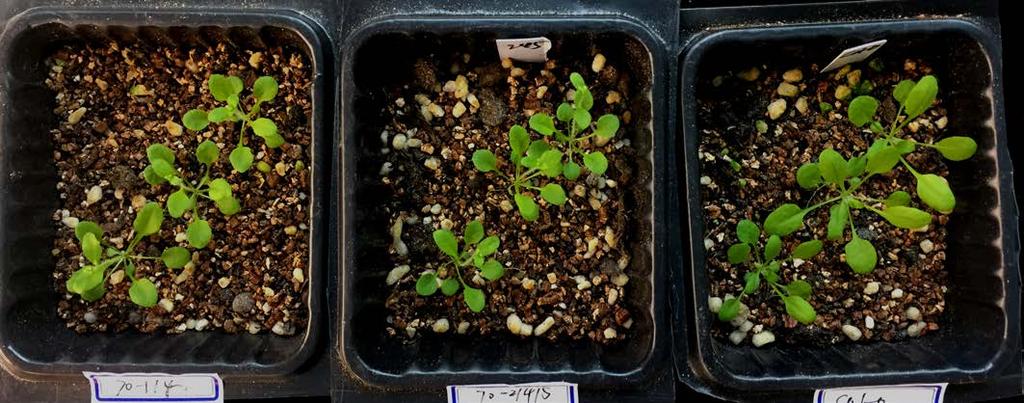
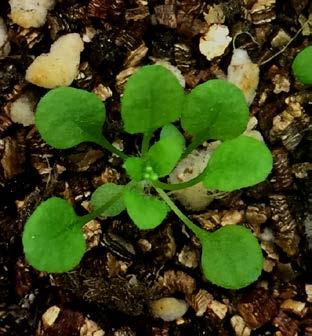
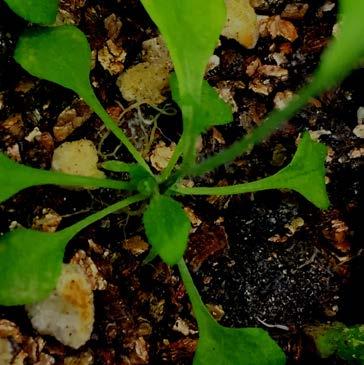
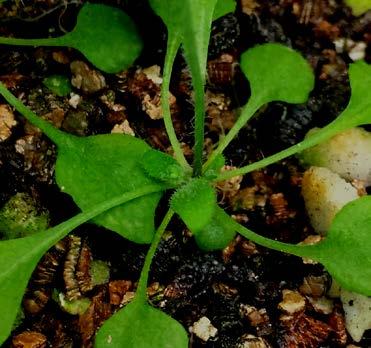
6 54! hsp70-1/4 hsp70-2/4/5 Col-0 " # $ % Col-0 hsp70-1/4 hsp70-2/4/5 & Col-0 hsp70-1/4 hsp70-2/4/5 55 6
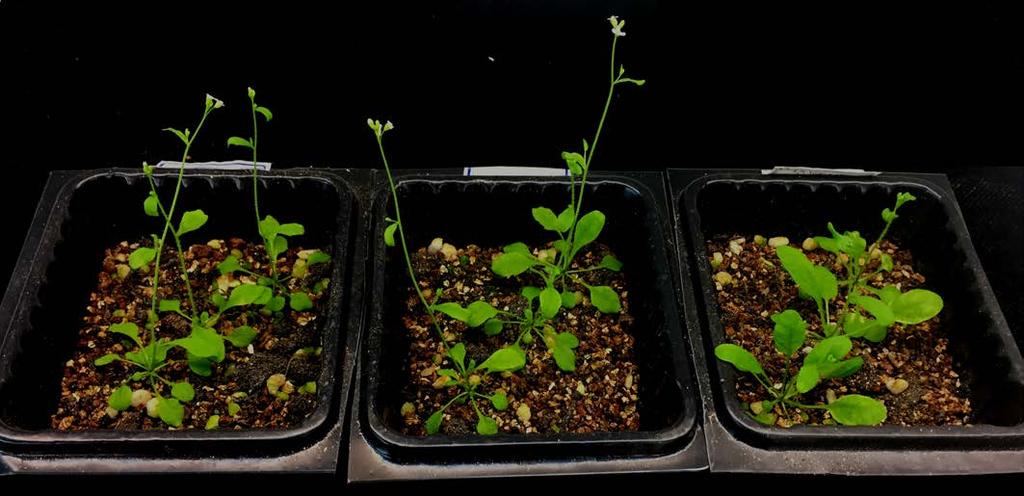
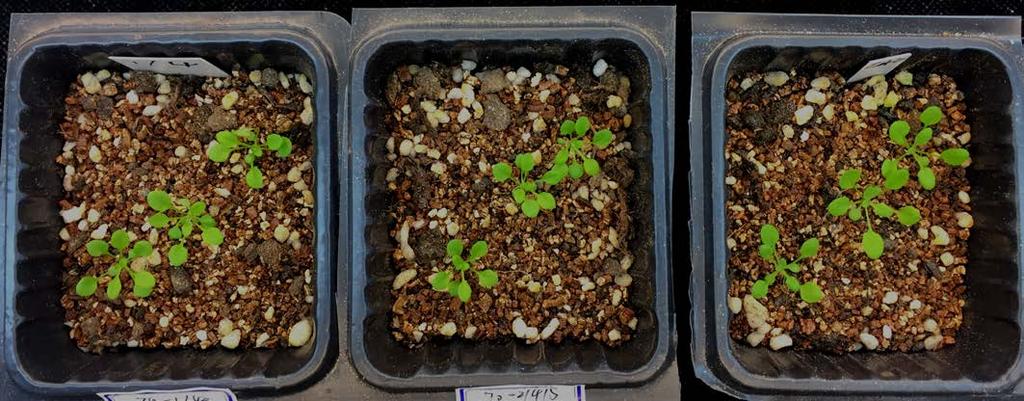
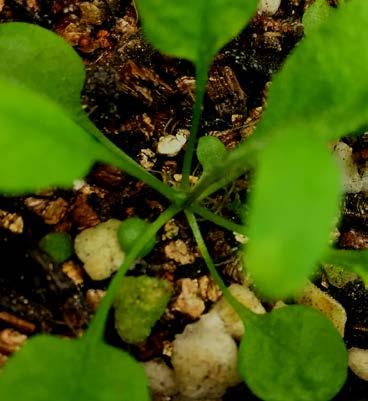
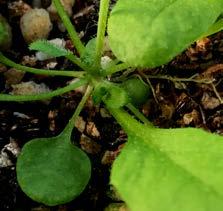
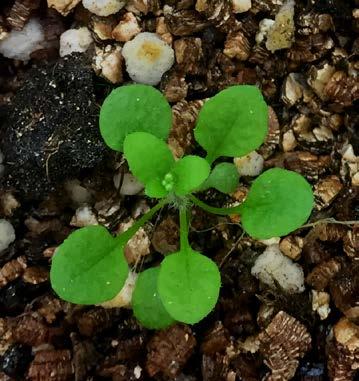
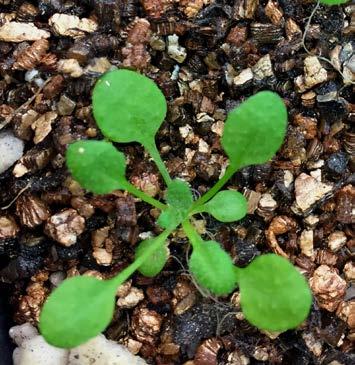
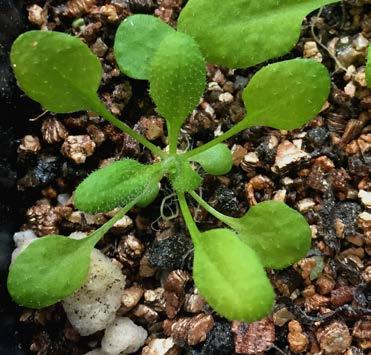
7 Fig. S5 phenotypic images of the hsp70-1/4 double mutant and hsp70-2/4/5 triple mutant. (a) Both mutants began bolting, but the Col-0 did not. (b) The image was captured when the Col-0 began bolting. (c) Both mutants began flowering and branching, but the Col-0 did not. (d) The image was captured when the Col-0 began flowering and branching. The images were taken in (a) 17d, (b) 20 d, (c) 22 d, (d) 25 d of the plants. (e) The siliques were shorter in hsp70-1/4 mutants and hsp70-2/4/5 mutants than Col-0. (f) The stems were thinner in hsp70-1/4 mutants and hsp70-2/4/5 mutants than Col-0. 7
# % &% '% (% )% *%%!\"#$%\"&'\"(()'*+,-).")
#!\"#$%&+&()#!")
#!\"#$%&,&()#!\"#$%&-&()#!\"#$% #,\"9<!\"#$%!\"#$%&'&()#!")
# % *% &% 2% '% =%!\"#$%\"&'\"(()'*+,-).")
# % &% '% (% )%!\"#$%\"&'\"(()'*+,-).")
(*12(,)\"(* *%+>-+ & 62 63")
8 8!!"#$%!"#$%&'&()#!"#$%&*&()#!"#$%&+&()#!"#$%&,&()#!"#$%&-&()# % &% '% (% )% *%%!"#$%"&'"(()'*+,-). /0 $%,,#)(*12(,)"(* *%%+,-+./!# "!"#$%&'&()# 0+-1 *%%+,-+./!# 2%%+,-+,/3345"# 2+6+7#89":;!"#$%&*&()#!"#$%&+&()#!"#$%&,&()#!"#$%&-&()#!"#$%!"#$%&'&()#!"#$%&*&()#!"#$%&+&()#!"#$%&,&()#!"#$%&-&()#!"#$% #,"9<!"#$%!"#$%&'&()#!"#$%&*&()#!"#$%&+&()#!"#$%&,&()#!"#$%&-&()# % *% &% 2% '% =%!"#$%"&'"(()'*+,-). /0 $%,,#)(*12(,)"(* 2%%,-+-/3345"# $!"#$%!"#$%&'&()#!"#$%&*&()#!"#$%&+&()#!"#$%&,&()#!"#$%&-&()# % &% '% (% )%!"#$%"&'"(()'*+,-). /0 $%,,#)(*12(,)"(* 26+7#89":; %!"#$%!"#$%&'&()#!"#$%&*&()#!"#$%&+&()#!"#$%&,&()#!"#$%&-&()# % &% '% (% )% *%%!"#$%"&'"(()'*+,-). /0 $%,,#)(*12(,)"(* *%+>-+ & 62 63
9 Fig. S6 The single HSP70 overexpression lines showed similar sensitivities to salt, osmotic stress, and high glucose stress as well as exogenous ABA treatment as compared with the wide type. (a, b) The images of primary roots of the five HSP70 overexpression lines and the wild type in primary root growth inhibition assays. (c-f) Statistical data for relative primary root lengths showed in (a) and (b). The relative primary root lengths of plants treated with 100 mm NaCl (c), 300 mm mannitol (d), 3 % glucose (e), and 10 µm ABA (f) compared with those of plants grown on normal 1/2 MS plates or mock. Values are means ± SE from three independent experiments (n > 15). Student s t-test was used to determine significance. *P < 0.05; ***P <
10 73 74 Supplementary table Table S1 Sequencing of the qrt-pcr products of 5 individual HSP70s genes Gene Name Locus Sequencing of the q-rt PCR amplified products Alignment site cdna HSP70-1 At5g02500 GACCTCTCTCTTTCTCCTATCTCTATCTCTTTT ACTTGCTTTTTTTTGATCTGTTAAGACTTTTTA TGTTGGGCTTTTTTAAAGAAGCCCATTTTGTG GTGTTTTTTGGTTAGTACTATTTTGAACAATG GTTGGTTCTATACCAGTTTAGCTACGATGACG GATAAAATT HSP70-2 At5g02490 GTGTTCTCTTAGTTATTTTGTCTTTTTATTTGA ACTCTCTCAATTTAGTGTTGGATTTTATGTTCT ACATTTTCTTTGATCTAAGTACTTTCTCTCTAT TGTTTGGTCATTGGTGACCCCTTTCTCTTAAC AATGCTTTAGTGGTCACTTGGTAGAAAGCTTT GTTATGAAAATTTCTTTACATGTCAGATTCAC ATAAG HSP70-3 At3g09440 TAACTTTCTCTCTTACTCTCTTACTCTCAGTCT TTATGTGTTTGTATTTCAACATTTTCCTGTTTT GTCCCCTAGTTTTTTTTTTCTTTTTCTTTCTTGT ATTGACTCTATTTTGAGGGCTCGCTTGTTTCG ATGAGCTCCTTATTTTTTTTAATCTATAACAG GAATGTTTTGA HSP70-4 At3g12580 GAGATTCTAGTTGGTTTCTTGTTCTTAGTTTTA TCTTTCTATGTCACTCTGAAACTGGTGTGTGA TCATTTTGATGCTTTAAGAATTTAGCTTTAC HSP70-5 At1g16030 AGCGTGTTTAGTGTGTTAAGACGAAAGAGTG GCTTTGGACCATTAGCGAGTCTTTTCTTTGTA TTGTGTCAAATAGTGTTGTGTACTCATAGGTG TTTTGCTAGTGAACGATAGTTGTATGCTTTAC ATATTTCAGCTGTTTCAGTTGTT
11 77 Table S2 The sequences of primers used in this study Purpose Name Primer sequence Hsp70-1-GFP Hsp70-1(BamHI)-F CGGGATCCATGTCGGGTAAAGGAGAAGG Hsp70-1(XbaI)-R GCTCTAGAGTCGACCTCCTCGATCTTAGG Hsp70-2-GFP Hsp70-2(KpnI)-F GGGGTACCATGGCTGGTAAAGGAGAAGGTCC Hsp70-2(XbaI)-R GCTCTAGATTAGTCGACTTCCTCGATCTTGGG Hsp70-3-GFP Hsp70-3(BamHI)-F CGGGATCCATGGCTGGTAAAGGAGAAGGTC Hsp70-3(XbaI)-R GCTCTAGAGTCGACTTCCTCAATCTTGGG Hsp70-4-GFP Hsp70-4(KpnI)-F GGGGTACCATGGCGGGTAAAGGTGAAGGT Hsp70-4(XbaI)-R GCTCTAGAATCAACTTCTTCAATCTTTGGGC Hsp70-5-GFP Hsp70-5(KpnI)-F GGGGTACCATGGCGACGAAATCAGAGAAAG Hsp70-5(XbaI)-R GCTCTAGAATCCACCTCTTCGATCTTGGG ProHsp70-1:GUS phsp70-1(psti)-f AACTGCAGAGTTATCGGGTATTTGAGAAAAAA phsp70-1(bamhi)-r CGGGATCCTTTTATCGGAAGATTTGGAAACTA ProHsp70-2:GUS phsp70-2(psti)-f AACTGCAG GCGGTGCTGGACCTAAGATC phsp70-2(bamhi)-r CGGGATCCTATCACACGAAGATAGAAAAAGCTA ProHsp70-3:GUS phsp70-3(psti)-f AACTGCAGGATCAAGATTGTGGTCAGGTAAGA phsp70-3(bamhi)-r CGGGATCCTGTTAACGCTACTCAGGATTAAGC ProHsp70-4:GUS phsp70-4(psti)-f AACTGCAGTACGAAGCCACTTGAGTGATGAT phsp70-4(bamhi)-r CGGGATCCTATTAGAGATCAGAATTGTTCGCC ProHsp70-5:GUS phsp70-5(kpni)-f GGGGTACCCATCTTTTAAGTCATGGACACTG phsp70-5(saci)-r CGCGAGCTTGTTGCTAAAAAAAAGCTTCAG Genotyping Hsp70-1-F AAGGAGAAGGACCAGCTATCG Hsp70-1-R TCTTCGCTCTCTCACAGGAAG Genotyping Hsp70-2-F GGTACGACGTACTCTTGCGTC Hsp70-2-R CTCAATCTCCTGAGGGCTCTC Genotyping Hsp70-3-F GTCCACTTTGCATGCTTCTTC Hsp70-3-R ATCATCGCTATGGATCTACCG Genotyping Hsp70-4-F CCAAATACGAAGCCACTTGAG Hsp70-4-R TACCGAAGACGGTGTTGGTAG Genotyping Hsp70-5-F TCCTAACGAACATGTTCTCCG Hsp70-5-R AGGTCCAGGATCTTCTGCTTC Genotyping SALKLBb1.3 ATTTTGCCGATTTCGGAAC Genotyping SAIL LB1 GCCTTTTCAGAAATGGATAAATAGCCTTGCTTCC qrt-pcr Hsp70-1-F TTGTTGGACATTGACCTCTC Hsp70-1-R GGCAAACTTTTAATTTTATCCG qrt-pcr Hsp70-2-F GTGTTCTCTTAGTTATTTTGTC 11
12 Hsp70-2-R CTTATGTGAATCTGACATGTAA qrt-pcr Hsp70-3-F TAACTTTCTCTCTTACTCTCTT Hsp70-3-R CAAAACATTCCTGTTATAGATTA qrt-pcr Hsp70-4-F GCCTTTTGGCTTTTGTTTACT Hsp70-4-R AACGGTAAAGCTAAATTCTTAAA qrt-pcr Hsp70-5-F AGCGTGTTTAGTGTGTTAAGA Hsp70-5-R AACAACTGAAACAGCTGAAATA qrt-pcr FLC-F CAAATGTCAAAAATGTGAGTATCGAT FLC-R TAAGGTGGCTAATTAAGTAGTGGGAG qrt-pcr FT-F GCTACAACTGGAACAACCTTTGGCAAT FT-R CCTCTGACAATTGTAGAAAACTGCG qrt-pcr SOC1-F GAGAAAAGTGTCAAATGTATTCGAGC SOC1-R ATTTGACCAAACTTCGCTTTCATG qrt-pcr LFY-F CCAAGTATTCAGGTACGCGAAGA LFY-R AAGCCTGACGCCATGAGCCAA qrt-pcr ARR5-F GTTTTGC GTCCCGAGATGT TAGATA ARR5-R AGCTGCGAG TAGATATCA TTAGCTT qrt-pcr ARR6-F CAAATTCCGTGACTGGATCTTAG ARR6-R GGCGAGAATCATCAGTGTAGG qrt-pcr ARR15-F CTGCTTGTAAAGTGACGACTGTTG ARR15-R AGTTCATATCCTGTTAGTCCCGGC qrt-pcr DWF4-F CATTGCTCTCGCTATCTTCTTC DWF4-R GACTCTCCTAGTTCCTTCTTGG qrt-pcr CPD-F TTACCGCAAAGCCATCCAAG CPD-R TCCATCATCCGCCGCAAG qrt-pcr DET2-F ACTACGAAGACGGAAACTGG DET2-R TCCTTGAACTTGGCAATGTA qrt-pcr IAA6-F CCATAAAGTTTGAAAACCGTTGAG IAA6-R ACGACCAGTAAGGAAATACATTTG qrt-pcr GH3-1-F TTTCACTGTGGGATCTCTGTG GH3-1-R GCATTGATTTCCATCAAAGTAGAC qrt-pcr GH3-5-F TCTCCAACCAACTCTCATCAC GH3-5-R TGCAATTTCACGTTGCTTATAC qrt-pcr CBF1-F CTTGAAAAAGAATCTACCTGAAAAGA CBF1-R TCTCCGCCTTGAGGCTCGTAAT qrt-pcr CBF2-F CCTGAATTAGAAAAGAAAGATAGATAGAG CBF2-R TGTAATCACCGCCTGAGGAAA qrt-pcr CBF3-F GAGAGAAACTATTATTTCAGCAAACC 12
13 78 79 CBF3-R CTGCTCGCAAGCGTCGGAATA qrt-pcr RAB18-F TTGTAACGCAGTCGCATT RAB18-R GATGCTCATTACACACTCATG qrt-pcr RD20-F TTTGGACCTTACTCATAAACTTAGC RD20-R TTAGTCTTGTTTGCGAGAATTGGC qrt-pcr RD22-F ACCATTGAGGAGTGTGAAGCCAG RD22-R CTAGTAGCTGAACCACACAACATGAG qrt-pcr RD29B-F AAGAACG TCGTTGCCTCA RT-PCR RD29B-R TUB2-F TUB-R GCCCGTA AGCAGTAACAG CTCTGACCTCCGAAAGCTTGC TCACCTTCTTCATCCGCAGTT 13
14 Material and methods Confocal microscopy To investigate the subcellular localizations of the GFP-tagged HSP70-1, -2, -3, -4, and -5 proteins. Agrobacteria transformed by HSP70s-GFP constructs were injected into the leaves of Nicotiana benthamiana and grown for another 2 3 d. The leaves were incubated in buffer containing 2 g ml -1 DAPI for 30 min at room temperature and were washed 3 times by sterile water containing 0.1 % triton. GFP fluorescent signals (excited at 488 nm) and DAPI signals (excited at 359 nm) were analyzed with a Leica SP8 laser confocal microscope. Images of Nicotiana benthamiana leaves were captured with a 20 objective and zoomed in to show the details. 14
Supplementary Fig 1. The responses of ERF109 to different hormones and stresses. (a to k) The induced expression of ERF109 in 7-day-old Arabidopsis
 The induced expression of ERF109 in 7-day-old Arabidopsis") Supplementary Fig 1. The responses of ERF109 to different hormones and stresses. (a to k) The induced expression of ERF109 in 7-day-old Arabidopsis seedlings expressing ERF109pro-GUS. The GUS staining
Supplementary Fig 1. The responses of ERF109 to different hormones and stresses. (a to k) The induced expression of ERF109 in 7-day-old Arabidopsis seedlings expressing ERF109pro-GUS. The GUS staining
Supplementary Information. c d e
 Supplementary Information a b c d e f Supplementary Figure 1. atabcg30, atabcg31, and atabcg40 mutant seeds germinate faster than the wild type on ½ MS medium supplemented with ABA (a and d-f) Germination
Construction of plant complementation vector and generation of transgenic plants
 MATERIAL S AND METHODS Plant materials and growth conditions Arabidopsis ecotype Columbia (Col0) was used for this study. SALK_072009, SALK_076309, and SALK_027645 were obtained from the Arabidopsis Biological
A Repressor Complex Governs the Integration of
 Developmental Cell 15 Supplemental Data A Repressor Complex Governs the Integration of Flowering Signals in Arabidopsis Dan Li, Chang Liu, Lisha Shen, Yang Wu, Hongyan Chen, Masumi Robertson, Chris A.
Supplemental Data. Cui et al. (2012). Plant Cell /tpc a b c d. Stem UBC32 ACTIN
. Plant Cell /tpc a b c d. Stem UBC32 ACTIN") A Root Stem Leaf Flower Silique Senescence leaf B a b c d UBC32 ACTIN C * Supplemental Figure 1. Expression Pattern and Protein Sequence of UBC32 Homologues in Yeast, Human, and Arabidopsis. (A) Expression
A Root Stem Leaf Flower Silique Senescence leaf B a b c d UBC32 ACTIN C * Supplemental Figure 1. Expression Pattern and Protein Sequence of UBC32 Homologues in Yeast, Human, and Arabidopsis. (A) Expression
Supplemental Data. Wang et al. Plant Cell. (2013) /tpc
 /tpc") SNL1 SNL Supplemental Figure 1. The Expression Patterns of SNL1 and SNL in Different Tissues of Arabidopsis from Genevestigator Web Site (https://www.genevestigator.com/gv/index.jsp). 1 A 1. 1..8.6.4..
SNL1 SNL Supplemental Figure 1. The Expression Patterns of SNL1 and SNL in Different Tissues of Arabidopsis from Genevestigator Web Site (https://www.genevestigator.com/gv/index.jsp). 1 A 1. 1..8.6.4..
Supplementary Materials for
 www.sciencesignaling.org/cgi/content/full/5/244/ra72/dc1 Supplementary Materials for An Interaction Between BZR1 and DELLAs Mediates Direct Signaling Crosstalk Between Brassinosteroids and Gibberellins
Supplemental Data Supplemental Figure 1.
 Supplemental Data Supplemental Figure 1. Silique arrangement in the wild-type, jhs, and complemented lines. Wild-type (WT) (A), the jhs1 mutant (B,C), and the jhs1 mutant complemented with JHS1 (Com) (D)
Supplementary Information
 Supplementary Information MED18 interaction with distinct transcription factors regulates plant immunity, flowering time and responses to hormones Supplementary Figure 1. Diagram showing T-DNA insertion
- 1 - Supplemental Data
 - 1-1 Supplemental Data 2 3 4 5 6 7 8 9 Supplemental Figure S1. Differential expression of AtPIP Genes in DC3000-inoculated plants. Gene expression in leaves was analyzed by real-time RT-PCR and expression
Supplementary Figure 1. jmj30-2 and jmj32-1 produce null mutants. (a) Schematic drawing of JMJ30 and JMJ32 genome structure showing regions amplified
 Schematic drawing of JMJ30 and JMJ32 genome structure showing regions amplified") Supplementary Figure 1. jmj30-2 and jmj32-1 produce null mutants. (a) Schematic drawing of JMJ30 and JMJ32 genome structure showing regions amplified by primers used for mrna expression analysis. Gray
Supplementary Figure 1. jmj30-2 and jmj32-1 produce null mutants. (a) Schematic drawing of JMJ30 and JMJ32 genome structure showing regions amplified by primers used for mrna expression analysis. Gray
Sperm cells are passive cargo of the pollen tube in plant fertilization
 In the format provided by the authors and unedited. SUPPLEMENTARY INFORMATION VOLUME: 3 ARTICLE NUMBER: 17079 Sperm cells are passive cargo of the pollen tube in plant fertilization Jun Zhang 1, Qingpei
Supplemental Data. Steiner et al. Plant Cell. (2012) /tpc
 /tpc") Supplemental Figure 1. SPY does not interact with free GST. Invitro pull-down assay using E. coli-expressed MBP-SPY and GST, GST-TCP14 and GST-TCP15. MBP-SPY was used as bait and incubated with equal amount
Supplemental Figure 1. SPY does not interact with free GST. Invitro pull-down assay using E. coli-expressed MBP-SPY and GST, GST-TCP14 and GST-TCP15. MBP-SPY was used as bait and incubated with equal amount
Supplementary Figures 1-12
 Supplementary Figures 1-12 Supplementary Figure 1. The specificity of anti-abi1 antibody. Total Proteins extracted from the wild type seedlings or abi1-3 null mutant seedlings were used for immunoblotting
Supplemental Data. Guo et al. (2015). Plant Cell /tpc
. Plant Cell /tpc") Supplemental Figure 1. The Mutant exb1-d Displayed Pleiotropic Phenotypes and Produced Branches in the Axils of Cotyledons. (A) Branches were developed in exb1-d but not in wild-type plants. (B) and (C)
Supplemental Figure 1. The Mutant exb1-d Displayed Pleiotropic Phenotypes and Produced Branches in the Axils of Cotyledons. (A) Branches were developed in exb1-d but not in wild-type plants. (B) and (C)
Supplemental Data. Na Xu et al. (2016). Plant Cell /tpc
. Plant Cell /tpc") Supplemental Figure 1. The weak fluorescence phenotype is not caused by the mutation in At3g60240. (A) A mutation mapped to the gene At3g60240. Map-based cloning strategy was used to map the mutated site
Supplemental Figure 1. The weak fluorescence phenotype is not caused by the mutation in At3g60240. (A) A mutation mapped to the gene At3g60240. Map-based cloning strategy was used to map the mutated site
Supplemental Data. Liu et al. (2013). Plant Cell /tpc
. Plant Cell /tpc") Supplemental Figure 1. The GFP Tag Does Not Disturb the Physiological Functions of WDL3. (A) RT-PCR analysis of WDL3 expression in wild-type, WDL3-GFP, and WDL3 (without the GFP tag) transgenic seedlings.
Supplemental Figure 1. The GFP Tag Does Not Disturb the Physiological Functions of WDL3. (A) RT-PCR analysis of WDL3 expression in wild-type, WDL3-GFP, and WDL3 (without the GFP tag) transgenic seedlings.
WiscDsLox485 ATG < > //----- E1 E2 E3 E4 E bp. Col-0 arr7 ARR7 ACTIN7. s of mrna/ng total RNA (x10 3 ) ARR7.
 ARR7.") A WiscDsLox8 ATG < > -9 +0 > ---------//----- E E E E E UTR +9 UTR +0 > 00bp B S D ol-0 arr7 ol-0 arr7 ARR7 ATIN7 D s of mrna/ng total RNA opie 0. ol-0 (x0 ) arr7 ARR7 Supplemental Fig.. Genotyping and
A WiscDsLox8 ATG < > -9 +0 > ---------//----- E E E E E UTR +9 UTR +0 > 00bp B S D ol-0 arr7 ol-0 arr7 ARR7 ATIN7 D s of mrna/ng total RNA opie 0. ol-0 (x0 ) arr7 ARR7 Supplemental Fig.. Genotyping and
Supplemental Data. Lee et al. Plant Cell. (2010) /tpc Supplemental Figure 1. Protein and Gene Structures of DWA1 and DWA2.
 /tpc Supplemental Figure 1. Protein and Gene Structures of DWA1 and DWA2.") Supplemental Figure 1. Protein and Gene Structures of DWA1 and DWA2. (A) Protein structures of DWA1 and DWA2. WD40 region was determined based on the NCBI conserved domain databases (B, C) Schematic representation
Supplemental Figure 1. Protein and Gene Structures of DWA1 and DWA2. (A) Protein structures of DWA1 and DWA2. WD40 region was determined based on the NCBI conserved domain databases (B, C) Schematic representation
Supplemental Data. Benstein et al. (2013). Plant Cell /tpc
. Plant Cell /tpc") Supplemental Figure 1. Purification of the heterologously expressed PGDH1, PGDH2 and PGDH3 enzymes by Ni-NTA affinity chromatography. Protein extracts (2 µl) of different fractions (lane 1 = total extract,
Supplemental Figure 1. Purification of the heterologously expressed PGDH1, PGDH2 and PGDH3 enzymes by Ni-NTA affinity chromatography. Protein extracts (2 µl) of different fractions (lane 1 = total extract,
SUPPLEMENTARY INFORMATION
 SUPPLEMENTARY INFORMATION doi:10.1038/nature10928 Materials and Methods 1. Plant material and growth conditions. All plant lines used were in Col-0 background unless otherwise specified. pif4-101 mutant
Supplemental Data. Borg et al. Plant Cell (2014) /tpc
 /tpc") Supplementary Figure 1 - Alignment of selected angiosperm DAZ1 and DAZ2 homologs Multiple sequence alignment of selected DAZ1 and DAZ2 homologs. A consensus sequence built using default parameters is shown
Supplementary Figure 1 - Alignment of selected angiosperm DAZ1 and DAZ2 homologs Multiple sequence alignment of selected DAZ1 and DAZ2 homologs. A consensus sequence built using default parameters is shown
Nature Genetics: doi: /ng Supplementary Figure 1. ChIP-seq genome browser views of BRM occupancy at previously identified BRM targets.
 Supplementary Figure 1 ChIP-seq genome browser views of BRM occupancy at previously identified BRM targets. Gene structures are shown underneath each panel. Supplementary Figure 2 pref6::ref6-gfp complements
Supplemental Data. Wu et al. (2). Plant Cell..5/tpc RGLG Hormonal treatment H2O B RGLG µm ABA µm ACC µm GA Time (hours) µm µm MJ µm IA
. Plant Cell..5/tpc RGLG Hormonal treatment H2O B RGLG µm ABA µm ACC µm GA Time (hours) µm µm MJ µm IA") Supplemental Data. Wu et al. (2). Plant Cell..5/tpc..4. A B Supplemental Figure. Immunoblot analysis verifies the expression of the AD-PP2C and BD-RGLG proteins in the Y2H assay. Total proteins were extracted
Supplemental Data. Wu et al. (2). Plant Cell..5/tpc..4. A B Supplemental Figure. Immunoblot analysis verifies the expression of the AD-PP2C and BD-RGLG proteins in the Y2H assay. Total proteins were extracted
Supplemental Figure 1. Floral commitment in Arabidopsis WT and mutants.
 Percentage of induction Supplemental Data. Torti et al. (2012). Plant Cell 10.1105/tpc.111.092791 A +0 +0 LD LDs +1 LDs +3 +3 LDs +5 +5 LDs LD 50 μm AP1 B C 140 120 100 80 60 40 20 0-20 -40 wt Col soc1-2
Supplemental Figure 1. Conserved regions of the kinase domain of PEPR1, PEPR2, CLV1 and BRI1.
 Supplemental Figure 1. Conserved regions of the kinase domain of PEPR1, PEPR2, CLV1 and BRI1. The asterisks and colons indicate the important residues for ATP-binding pocket and substrate binding pocket,
SUPPLEMENTARY INFORMATION
 Local auxin metabolism regulates environment-induced hypocotyl elongation Zuyu Zheng 1,2, Yongxia Guo 3, Ondřej Novák 4,5, William Chen 2, Karin Ljung 4, Joseph P. Noel 1,3, *, and Joanne Chory 1,2, *
Supplementary Information
 Supplementary Information ER-localized auxin transporter PIN8 regulates auxin homeostasis and male gametophyte development in Arabidopsis Supplemental Figures a 8 6 4 2 Absolute Expression b Absolute Expression
Supplementary Figure 1. BES1 specifically inhibits ABA responses in early seedling
 Supplementary Figure 1. BES1 specifically inhibits ABA responses in early seedling development. a. Exogenous BR application overcomes the hypersensitivity of bzr1-1d seedlings to ABA. Seed germination
Supplemental Materials
 Supplemental Materials Supplemental Figure S. Phenotypic assessment of alb4 mutant plants under different stress conditions. (A) High-light stress and drought stress. Wild-type (WT) and alb4 mutant plants
Integrated Omics Study Delineates the Dynamics of Lipid Droplets in Rhodococcus Opacus PD630
 School of Natural Sciences and Mathematics 2013-10-22 Integrated Omics Study Delineates the Dynamics of Lipid Droplets in Rhodococcus Opacus PD630 UTD AUTHOR(S): Michael Qiwei Zhang 2013 The Authors This
Gene specific primers. Left border primer (638) ala3-4 (Salk_082157) Gene specific primers. Left border primer (1343)
 ala3-4 (Salk_082157) Gene specific primers. Left border primer (1343)") Supplemental Data. Poulsen et al. (2008) The Arabidopsis P4-ATPase pump ALA3 localizes to the Golgi and requires a β subunit to function in lipid translocation and secretory vesicle formation. A ala3-1
Supplemental Data. Poulsen et al. (2008) The Arabidopsis P4-ATPase pump ALA3 localizes to the Golgi and requires a β subunit to function in lipid translocation and secretory vesicle formation. A ala3-1
SUPPLEMENTARY INFORMATION
 AS-NMD modulates FLM-dependent thermosensory flowering response in Arabidopsis NATURE PLANTS www.nature.com/natureplants 1 Supplementary Figure 1. Genomic sequence of FLM along with the splice sites. Sequencing
Supplemental data. Zhao et al. (2009). The Wuschel-related homeobox gene WOX11 is required to activate shoot-borne crown root development in rice.
. The Wuschel-related homeobox gene WOX11 is required to activate shoot-borne crown root development in rice.") Supplemental data. Zhao et al. (2009). The Wuschel-related homeobox gene WOX11 is required to activate shoot-borne crown root development in rice. A B Supplemental Figure 1. Expression of WOX11p-GUS WOX11-GFP
Supplemental data. Zhao et al. (2009). The Wuschel-related homeobox gene WOX11 is required to activate shoot-borne crown root development in rice. A B Supplemental Figure 1. Expression of WOX11p-GUS WOX11-GFP
PIE1 ARP6 SWC6 KU70 ARP6 PIE1. HSA SNF2_N HELICc SANT. pie1-3 A1,A2 K1,K2 K1,K3 K3,LB2 A3, A4 A3,LB1 A1,A2 K1,K2 K1,K3. swc6-1 A3,A4.
 A B N-terminal SWC2 H2A.Z SWC6 ARP6 PIE1 HSA SNF2_N HELICc SANT C pie1-3 D PIE1 ARP6 5 Kb A1 200 bp A3 A2 LB1 arp6-3 A4 E A1,A2 A3, A4 A3,LB1 K1,K2 K1,K3 K3,LB2 SWC6 swc6-1 A1,A2 A3,A4 K1,K2 K1,K3 100
Supplementary Materials
 Supplementary Materials Table S1. Oligonucleotide sequences and PCR conditions used to amplify the indicated genes. TA = annealing temperature; gdna = genomic DNA; cdna = complementary DNA; c = concentration.
Supplementary Figure 1 qrt-pcr expression analysis of NLP8 with and without KNO 3 during germination.
 Supplementary Figure 1 qrt-pcr expression analysis of NLP8 with and without KNO 3 during germination. Seeds of Col-0 were harvested from plants grown at 16 C, stored for 2 months, imbibed for indicated
S156AT168AY175A (AAA) were purified as GST-fusion proteins and incubated with GSTfused
 were purified as GST-fusion proteins and incubated with GSTfused") 1 2 3 4 5 6 7 8 9 10 11 12 13 14 15 16 17 18 19 20 21 22 23 24 25 26 27 28 Supplemental Materials Supplemental Figure S1 (a) Phenotype of the wild type and grik1-2 grik2-1 plants after 8 days in darkness.
1 2 3 4 5 6 7 8 9 10 11 12 13 14 15 16 17 18 19 20 21 22 23 24 25 26 27 28 Supplemental Materials Supplemental Figure S1 (a) Phenotype of the wild type and grik1-2 grik2-1 plants after 8 days in darkness.
Supplemental Figure 1 HDA18 has an HDAC domain and therefore has concentration dependent and TSA inhibited histone deacetylase activity.
 Supplemental Figure 1 HDA18 has an HDAC domain and therefore has concentration dependent and TSA inhibited histone deacetylase activity. (A) Amino acid alignment of HDA5, HDA15 and HDA18. The blue line
Schematic representation of the endogenous PALB2 locus and gene-disruption constructs
 Supplementary Figures Supplementary Figure 1. Generation of PALB2 -/- and BRCA2 -/- /PALB2 -/- DT40 cells. (A) Schematic representation of the endogenous PALB2 locus and gene-disruption constructs carrying
Supplemental Figure 1. VLN5 retains conserved residues at both type 1 and type 2 Ca 2+ -binding
 Supplemental Figure 1. VLN5 retains conserved residues at both type 1 and type 2 Ca 2+ -binding sites in the G1 domain. Multiple sequence alignment was performed with DNAMAN6.0.40. Secondary structural
Supplemental Figure 1
 Supplemental Figure 1 A LK sls1 lks1-2 F 1 sls1 B LK sls1 lks1-2 F 1 lks1-2 sls1 F 1 lks1-2 sls1 F 2 Col lks1-2 Col+LKS1 Col Col+LKS1 Supplemental Figure 1. Genetic analysis of sls1 mutant. (A) and (B)
Supporting information
 Supporting information Construction of strains and plasmids To create ptc67, a PCR product obtained with primers cc2570-162f (gcatgggcaagcttgaggacggcgtcatgt) and cc2570+512f (gaggccgtggtaccatagaggcgggcg),
Supplemental Information
 Supplemental Information Supplemental Figure 1. The Heterologous Yeast System for Screening of Arabidopsis JA Transporters. (A) Exogenous JA inhibited yeast cell growth. Yeast cells were diluted to various
A Nucleus-Encoded Chloroplast Protein YL1 Is Involved in Chloroplast. Development and Efficient Biogenesis of Chloroplast ATP Synthase in Rice
 A Nucleus-Encoded Chloroplast Protein YL1 Is Involved in Chloroplast Development and Efficient Biogenesis of Chloroplast ATP Synthase in Rice Fei Chen 1,*, Guojun Dong 2,*, Limin Wu 1, Fang Wang 3, Xingzheng
The Arabidopsis Transcription Factor BES1 Is a Direct Substrate of MPK6 and Regulates Immunity
 Supplemental Data The Arabidopsis Transcription Factor BES1 Is a Direct Substrate of MPK6 and Regulates Immunity Authors: Sining Kang, Fan Yang, Lin Li, Huamin Chen, She Chen and Jie Zhang The following
Supplemental Figure 1. Alignment of the NbGAPC amino acid sequences with their Arabidopsis homologues.
 Supplemental Figure 1. Alignment of the NbGAPC amino acid sequences with their Arabidopsis homologues. Homologs from N. benthamiana (NbGAPC1, NbGAPC2, NbGAPC3), Arabidopsis (AtGAPC1, AT3G04120; AtGAPC2,
(phosphatase tensin) domain is shown in dark gray, the FH1 domain in black, and the
 domain is shown in dark gray, the FH1 domain in black, and the") Supplemental Figure 1. Predicted Domain Organization of the AFH14 Protein. (A) Schematic representation of the predicted domain organization of AFH14. The PTEN (phosphatase tensin) domain is shown in dark
Supplemental Figure 1. Predicted Domain Organization of the AFH14 Protein. (A) Schematic representation of the predicted domain organization of AFH14. The PTEN (phosphatase tensin) domain is shown in dark
Supplementary information
 Supplementary information Supplementary figures Figure S1 Level of mycdet1 protein in DET1 OE-1, OE-2 and OE-3 transgenic lines. Total protein extract from wild type Col0, det1-1 mutant and DET1 OE lines
Supplemental Data. Seo et al. (2014). Plant Cell /tpc
. Plant Cell /tpc") Supplemental Figure 1. Protein alignment of ABD1 from other model organisms. The alignment was performed with H. sapiens DCAF8, M. musculus DCAF8 and O. sativa Os10g0544500. The WD40 domains are underlined.
Supplemental Figure 1. Protein alignment of ABD1 from other model organisms. The alignment was performed with H. sapiens DCAF8, M. musculus DCAF8 and O. sativa Os10g0544500. The WD40 domains are underlined.
Supplemental Data. Farmer et al. (2010) Plant Cell /tpc
 Plant Cell /tpc") Supplemental Figure 1. Amino acid sequence comparison of RAD23 proteins. Identical and similar residues are shown in the black and gray boxes, respectively. Dots denote gaps. The sequence of plant Ub is
Supplemental Figure 1. Amino acid sequence comparison of RAD23 proteins. Identical and similar residues are shown in the black and gray boxes, respectively. Dots denote gaps. The sequence of plant Ub is
Supplementary Information
 Supplementary Information Supplementary Fig. 1. Seed dormancy and germination responses of RVE1 and PIF1. (a) Diagram of RVE1 and the T-DNA insertion of the rve1-2 mutant (SAIL_326_A01). Black boxes represent
Supplemental Figure 1. Mutation in NLA Causes Increased Pi Uptake Activity and
 Supplemental Figure 1. Mutation in NLA Causes Increased Pi Uptake Activity and PHT1 Protein Amounts. (A) Shoot morphology of 19-day-old nla mutants under Pi-sufficient conditions. (B) [ 33 P]Pi uptake
Confocal immunofluorescence microscopy
 Confocal immunofluorescence microscopy HL-6 and cells were cultured and cytospun onto glass slides. The cells were double immunofluorescence stained for Mt NPM1 and fibrillarin (nucleolar marker). Briefly,
Supplemental Data. mir156-regulated SPL Transcription. Factors Define an Endogenous Flowering. Pathway in Arabidopsis thaliana
 Cell, Volume 138 Supplemental Data mir156-regulated SPL Transcription Factors Define an Endogenous Flowering Pathway in Arabidopsis thaliana Jia-Wei Wang, Benjamin Czech, and Detlef Weigel Table S1. Interaction
pgbkt7 Anti- Myc AH109 strain (KDa) 50
 50") pgbkt7 (KDa) 50 37 Anti- Myc AH109 strain Supplementary Figure 1. Protein expression of CRN and TDR in yeast. To analyse the protein expression of CRNKD and TDRKD, total proteins extracted from yeast culture
pgbkt7 (KDa) 50 37 Anti- Myc AH109 strain Supplementary Figure 1. Protein expression of CRN and TDR in yeast. To analyse the protein expression of CRNKD and TDRKD, total proteins extracted from yeast culture
Supplemental Data. Zhang et al. Plant Cell (2014) /tpc
 /tpc") Supplemental Data. Zhang et al. Plant Cell (214) 1.115/tpc.114.134163 55 - T C N SDIRIP1-GFP 35-25 - Psb 18 - Histone H3 Supplemental Figure 1. Detection of SDIRIP1-GFP in the nuclear fraction by Western
Supplemental Data. Zhang et al. Plant Cell (214) 1.115/tpc.114.134163 55 - T C N SDIRIP1-GFP 35-25 - Psb 18 - Histone H3 Supplemental Figure 1. Detection of SDIRIP1-GFP in the nuclear fraction by Western
Table S1. List of primers used in this study.
 Gene/Construct/ mutant Primer name Sequence (5 ->3 ) Confimation of T-DNA insertion clh1-1 LBb1 5 GCGTGGACCGCTTGCTGCAACT3 1LP1 5 CCGAAAATGATAAATGCATGG3 1RP1 5 ATGTCCAGCTCGAAAGATTCC3 clh2-1 Lb4 5 CTACAAATTGCCTTTTCTTATCGAC3
Supplemental Data. Osakabe et al. (2013). Plant Cell /tpc
. Plant Cell /tpc") Supplemental Figure 1. Phylogenetic analysis of KUP in various species. The amino acid sequences of KUPs from green algae and land plants were identified with a BLAST search and aligned using ClustalW
Supplemental Figure 1. Phylogenetic analysis of KUP in various species. The amino acid sequences of KUPs from green algae and land plants were identified with a BLAST search and aligned using ClustalW
Supplemental materials
 Supplemental materials Materials and methods for supplemental figures Yeast two-hybrid assays TAP46-PP2Ac interactions I. The TAP46 was used as the bait and the full-length cdnas of the five C subunits
To investigate the heredity of the WFP gene, we selected plants that were homozygous
 Supplementary information Supplementary Note ST-12 WFP allele is semi-dominant To investigate the heredity of the WFP gene, we selected plants that were homozygous for chromosome 1 of Nipponbare and heterozygous
Chemical hijacking of auxin signaling with an engineered auxin-tir1
 1 SUPPLEMENTARY INFORMATION Chemical hijacking of auxin signaling with an engineered auxin-tir1 pair Naoyuki Uchida 1,2*, Koji Takahashi 2*, Rie Iwasaki 1, Ryotaro Yamada 2, Masahiko Yoshimura 2, Takaho
Supplemental Figure 1. Rosette Leaf Morphology of Single, Double and Triple Mutants of eid3, phya-201 and phyb-5. Photographs of Ler wild type,
 Supplemental Figure 1. Rosette Leaf Morphology of Single, Double and Triple Mutants of eid3, phya-201 and phyb-5. Photographs of Ler wild type, phya-201, phyb-5, phya-201 phyb-5, eid3, phya-201 eid3, phyb-5
Nature Biotechnology: doi: /nbt.4166
 Supplementary Figure 1 Validation of correct targeting at targeted locus. (a) by immunofluorescence staining of 2C-HR-CRISPR microinjected embryos cultured to the blastocyst stage. Embryos were stained
Intron distance to transcription start (nt)*
*") Schwab et al. SOM: Enhanced microrna accumulation through stemloop-adjacent introns 1 Supplemental Table 1. Characteristics of introns used in this study Intron name Length intron (nt) Length cloned fragment
Schwab et al. SOM: Enhanced microrna accumulation through stemloop-adjacent introns 1 Supplemental Table 1. Characteristics of introns used in this study Intron name Length intron (nt) Length cloned fragment
Supplemental Data. Zhang et al. (2010). Plant Cell /tpc
. Plant Cell /tpc") Supplemental Figure 1. uvs90 gene cloning The T-DNA insertion in uvs90 was identified using thermal asymmetric interlaced (TAIL)-PCR. Three rounds of amplification were performed; the second (2 nd ) and
Supplemental Figure 1. uvs90 gene cloning The T-DNA insertion in uvs90 was identified using thermal asymmetric interlaced (TAIL)-PCR. Three rounds of amplification were performed; the second (2 nd ) and
Obtaining More Accurate Signals: Spatiotemporal Imaging of Cancer Sites Enabled by a Photoactivatable Aptamer-Based Strategy
 Supporting Information Obtaining More Accurate Signals: Spatiotemporal Imaging of Cancer Sites Enabled by a Photoactivatable Aptamer-Based Strategy Heng Xiao,,, Yuqi Chen,, Erfeng Yuan,, Wei Li, Zhuoran
Supplemental Data. Polycomb Silencing of KNOX Genes Confines. Shoot Stem Cell Niches in Arabidopsis Current Biology, Volume 18
 Supplemental Data Polycomb Silencing of KNOX Genes Confines Shoot Stem Cell Niches in Arabidopsis Lin Xu and Wen-Hui Shen - 1 - Figure S1. Phylogram of RING1, BMI1 and RAD18 homologues in several organisms
Supplementary Information. Supplementary Figure S1. Phenotypic comparison of the wild type and mutants.
 Supplementary Information Supplementary Figure S1. Phenotypic comparison of the wild type and mutants. Supplementary Figure S2. Transverse sections of anthers. Supplementary Figure S3. DAPI staining and
Nature Genetics: doi: /ng.3556 INTEGRATED SUPPLEMENTARY FIGURE TEMPLATE. Supplementary Figure 1
 INTEGRATED SUPPLEMENTARY FIGURE TEMPLATE Supplementary Figure 1 REF6 expression in transgenic lines. (a,b) Expression of REF6 in REF6-HA ref6 and REF6ΔZnF-HA ref6 plants detected by RT qpcr (a) and immunoblot
Temperature modulates tissue-specification program to control fruit dehiscence in Brassicaceae
 Supplemental information Temperature modulates tissue-specification program to control fruit dehiscence in Brassicaceae Xin-Ran Li 1, Joyita Deb 1, S. Vinod Kumar 1* and Lars Østergaard 1* 1 John Innes
Live-cell visualization of excitation energy dynamics in chloroplast thylakoid structures
 Supplementary Information Live-cell visualization of excitation energy dynamics in chloroplast thylakoid structures Masakazu Iwai, Makio Yokono, Kazuo Kurokawa, Akira Ichihara & Akihiko Nakano Supplementary
Supporting Information
 Supporting Information Materials and Methods Plant Materials and Growth Conditions All Arabidopsis thaliana plants used in this study were of the Columbia-0 ecotype. 35S:PIF3-Myc (1), 35S:PIF4-Myc (2),
Figure S1. Figure S2 RT-PCR. qpcr RT-PCR. Northern. IVSwt ΔIVS IVS IVS IVS. NTC mock IVSwt ΔIVS IVS IVS. mock IVSwt ΔIVS
 Figure S1 40 cycles IVS IVS IVS NTC wt Δ Δ mut pri-mirna163 * Fig. S1 Transcripts generated from the MIR163 gene variants in which splice sites have been mutated are not spliced. products were separated
Supplementary Figure 1 Collision-induced dissociation (CID) mass spectra of peptides from PPK1, PPK2, PPK3 and PPK4 respectively.
 mass spectra of peptides from PPK1, PPK2, PPK3 and PPK4 respectively.") Supplementary Figure 1 lision-induced dissociation (CID) mass spectra of peptides from PPK1, PPK, PPK3 and PPK respectively. % of nuclei with signal / field a 5 c ppif3:gus pppk1:gus 0 35 30 5 0 15 10
Supplementary Figure 1 lision-induced dissociation (CID) mass spectra of peptides from PPK1, PPK, PPK3 and PPK respectively. % of nuclei with signal / field a 5 c ppif3:gus pppk1:gus 0 35 30 5 0 15 10
Supplementary Materials: 1. Supplementary Figures S1-S9. 2. Supplementary Tables S1-S2
 Supplementary Materials: 1. Supplementary Figures S1-S9 2. Supplementary Tables S1-S2 S1 1. Supplementary Figures Fig. S1. Genotypes of tcp20 mutants. Fig. S2. Root phenotypes of tcp20 mutants. Fig. S3.
Supplemental Data. Dai et al. (2013). Plant Cell /tpc Absolute FyPP3. Absolute
. Plant Cell /tpc Absolute FyPP3. Absolute") A FyPP1 Absolute B FyPP3 Absolute Dry seeds Imbibed 24 hours Dry seeds Imbibed 24 hours C ABI5 Absolute Dry seeds Imbibed 24 hours Supplemental Figure 1. Expression of FyPP1, FyPP3 and ABI5 during seed
A FyPP1 Absolute B FyPP3 Absolute Dry seeds Imbibed 24 hours Dry seeds Imbibed 24 hours C ABI5 Absolute Dry seeds Imbibed 24 hours Supplemental Figure 1. Expression of FyPP1, FyPP3 and ABI5 during seed
Supplementary information, Figure S1
 Supplementary information, Figure S1 (A) Schematic diagram of the sgrna and hspcas9 expression cassettes in a single binary vector designed for Agrobacterium-mediated stable transformation of Arabidopsis
Supplemental Data. Wu and Xue (2010). Plant Cell /tpc
. Plant Cell /tpc") Supplemental Data. Wu and Xue (21). Plant Cell 1.115/tpc.11.75564 A P1-S P1-A P2-S P2-A P3-S P3-A P4-S P4-A B Relative expression Relative expression C 5. 4.5 4. 3.5 3. 2.5 2. 1.5 1..5 5. 4.5 4. 3.5 3.
Supplemental Data. Wu and Xue (21). Plant Cell 1.115/tpc.11.75564 A P1-S P1-A P2-S P2-A P3-S P3-A P4-S P4-A B Relative expression Relative expression C 5. 4.5 4. 3.5 3. 2.5 2. 1.5 1..5 5. 4.5 4. 3.5 3.
6/256 1/256 0/256 1/256 2/256 7/256 10/256. At3g06290 (SAC3B)
") Chr.III M 5M 1M 15M 2M 23M BAC clones F22F7 F1A16 F24F17 F24P17 T8E24 F17A9 F21O3 F17A17 F18C1 F2O1 F28L1 F5E6 F3E22 T1B9 MLP3 Number of recombinants 6/256 1/256 /256 1/256 2/256 7/256 1/256 At3g629 (SAC3B)
Chr.III M 5M 1M 15M 2M 23M BAC clones F22F7 F1A16 F24F17 F24P17 T8E24 F17A9 F21O3 F17A17 F18C1 F2O1 F28L1 F5E6 F3E22 T1B9 MLP3 Number of recombinants 6/256 1/256 /256 1/256 2/256 7/256 1/256 At3g629 (SAC3B)
Supplemental Materials
 Supplemental Materials Flores-Pérez et al., Supplemental Materials, page 1 of 5 Supplemental Figure S1. Pull-down and BiFC controls, and quantitative analyses associated with the BiFC studies. (A) Controls
Expanded View Figures
 Expanded View Figures Figure EV1. AM3-CLE45 control experiments and bam3 alleles. A Relative primary root length of indicated genotypes at 9 dag, in response to increasing amounts of CLE45 in the media.
Supplementary Figure 1. Isolation of GFPHigh cells.
 Supplementary Figure 1. Isolation of GFP High cells. (A) Schematic diagram of cell isolation based on Wnt signaling activity. Colorectal cancer (CRC) cell lines were stably transduced with lentivirus encoding
Supplemental Data. Li et al. (2015). Plant Cell /tpc
. Plant Cell /tpc") Supplemental Data Supplemental Figure 1: Characterization of asr3 T-DNA knockout lines and complementation transgenic lines. (A) The scheme of At2G33550 (ASR3) with gray boxes indicating exons and dash
Supplemental Data Supplemental Figure 1: Characterization of asr3 T-DNA knockout lines and complementation transgenic lines. (A) The scheme of At2G33550 (ASR3) with gray boxes indicating exons and dash
ABI3 Controls Embryo De-greening Through Mendel's I locus
 Supporting Online Material for ABI3 Controls Embryo De-greening Through Mendel's I locus Frédéric Delmas a,b,c, Subramanian Sankaranarayanan d, Srijani Deb d, Ellen Widdup d, Céline Bournonville b,c,norbert
Supplementary Figure S1. Immunodetection of full-length XA21 and the XA21 C-terminal cleavage product.
 Supplementary Information Supplementary Figure S1. Immunodetection of full-length XA21 and the XA21 C-terminal cleavage product. Total protein extracted from Kitaake wild type and rice plants carrying
Supplemental Figure 1
 Supplemental Figure 1 A gta2-1 gta2-2 1kb AT4G08350 B Col-0 gta2-1 LP+RP+LBb1.3 C Col-0 gta2-2 LP+RP+LB1 D Col-0 gta2-2 gta2-1 GTA2 TUBLIN E Col0 gta2-1 gta2-2 Supplemental Figure 1. Phenotypic analysis
AD BD TOC1. Supplementary Figure 1: Yeast two-hybrid assays showing the interaction between
 AD X BD TOC1 AD BD X PIFΔAD PIF TOC1 TOC1 PIFΔAD PIF N TOC1 TOC1 C1 PIFΔAD PIF C1 TOC1 TOC1 C PIFΔAD PIF C TOC1 Supplementary Figure 1: Yeast two-hybrid assays showing the interaction between PIF and TOC1
Supplementary Information
 Supplementary Information COP1 E3 ligase protects HYL1 to retain microrna biogenesis Seok Keun Cho 1, Samir Ben Chaabane 1, Pratik Shah 1, Christian Peter Poulsen 1, and Seong Wook Yang 1 * 1 Laboratory
SUPPLEMENTARY INFORMATION
 doi:10.1038/nature12119 SUPPLEMENTARY FIGURES AND LEGENDS pre-let-7a- 1 +14U pre-let-7a- 1 Ddx3x Dhx30 Dis3l2 Elavl1 Ggt5 Hnrnph 2 Osbpl5 Puf60 Rnpc3 Rpl7 Sf3b3 Sf3b4 Tia1 Triobp U2af1 U2af2 1 6 2 4 3
Functional analysis reveals that RBM10 mutations. contribute to lung adenocarcinoma pathogenesis by. deregulating splicing
 Supplementary Information Functional analysis reveals that RBM10 mutations contribute to lung adenocarcinoma pathogenesis by deregulating splicing Jiawei Zhao 1,+, Yue Sun 2,3,+, Yin Huang 6, Fan Song
Figure S1. DELLA Proteins Act as Positive Regulators to Mediate GA-Regulated Anthocyanin
 Supplemental Information Figure S1. DELLA Proteins Act as Positive Regulators to Mediate GA-Regulated Anthocyanin Biosynthesis. (A) Effect of GA on anthocyanin content in WT and ga1-3 seedlings. Mock,
Supplemental Data. Hachez et al. Plant Cell (2014) /tpc Suppl. Figure 1A
 /tpc Suppl. Figure 1A") Suppl. Figure 1A Suppl. Figure 1B Supplemental Figure 1: Results of the commercial screening of interactants using split ubiquitin technique. (A) Isolated preys (192) using the bait construct pbt3-n- as
Suppl. Figure 1A Suppl. Figure 1B Supplemental Figure 1: Results of the commercial screening of interactants using split ubiquitin technique. (A) Isolated preys (192) using the bait construct pbt3-n- as
Supplemental Figure legends Figure S1. (A) (B) (C) (D) Figure S2. Figure S3. (A-E) Figure S4. Figure S5. (A, C, E, G, I) (B, D, F, H, Figure S6.
 (B) (C) (D) Figure S2. Figure S3. (A-E) Figure S4. Figure S5. (A, C, E, G, I) (B, D, F, H, Figure S6.") Supplemental Figure legends Figure S1. Map-based cloning and complementation testing for ZOP1. (A) ZOP1 was mapped to a ~273-kb interval on Chromosome 1. In the interval, a single-nucleotide G to A substitution
Supplemental Figure legends Figure S1. Map-based cloning and complementation testing for ZOP1. (A) ZOP1 was mapped to a ~273-kb interval on Chromosome 1. In the interval, a single-nucleotide G to A substitution
(a) Immunoblotting to show the migration position of Flag-tagged MAVS
 Immunoblotting to show the migration position of Flag-tagged MAVS") Supplementary Figure 1 Characterization of six MAVS isoforms. (a) Immunoblotting to show the migration position of Flag-tagged MAVS isoforms. HEK293T Mavs -/- cells were transfected with constructs expressing
Supplementary Figure 1 Characterization of six MAVS isoforms. (a) Immunoblotting to show the migration position of Flag-tagged MAVS isoforms. HEK293T Mavs -/- cells were transfected with constructs expressing
SUPPLEMENTARY INFORMATION
 Materials and Methods Transgenic Plant Materials and DNA Constructs. VEX1::H2B-GFP, ACA3::H2B-GFP, KRP6::H2B-GFP, KRP6::mock21ts-GFP, KRP6::TE21ts- GFP and KRP6::miR161ts-GFP constructs were generated
Supplemental Data. Challa et al. (2016). Plant Cell /tpc
. Plant Cell /tpc") Supplemental Figure 1. DEX-induced TCP4 activity rescues jaw-d phenotypes. (A) and (B) Rosettess of 32-day-old Col-0;ProTCP4:mTCP4:GR plants (A) and jaw-d;protcp4:mtcp4:gr (B) plants grown in mock or in
Supplemental Figure 1. DEX-induced TCP4 activity rescues jaw-d phenotypes. (A) and (B) Rosettess of 32-day-old Col-0;ProTCP4:mTCP4:GR plants (A) and jaw-d;protcp4:mtcp4:gr (B) plants grown in mock or in
Table S1. List of DNA constructs and primers, part 1 Construct
 SUPPLEMENTARY TABLES: Table S1. List of DNA constructs and primers, part 1 Construct Comment (Expressed protein) Vector, PCR primers and template or source of Restriction Sites name Resistance construct
Supplemental Data. Ko et al. (2014). Plant Cell /tpc Supplemental Figure 1. Evidence of T-DNA Insertion in ms142 Mutant.
. Plant Cell /tpc Supplemental Figure 1. Evidence of T-DNA Insertion in ms142 Mutant.") Supplemental Figure 1. Evidence of T-DNA Insertion in ms142 Mutant. (A) DNA gel blotting to hptii probe confirmed single T-DNA insertion (marked with arrow) in ms142 mutant. (B) T-DNA tagged construction
Supplemental Figure 1. Evidence of T-DNA Insertion in ms142 Mutant. (A) DNA gel blotting to hptii probe confirmed single T-DNA insertion (marked with arrow) in ms142 mutant. (B) T-DNA tagged construction
Graphene oxide-enhanced cytoskeleton imaging and mitosis tracking
 Electronic Supplementary Material (ESI) for ChemComm. This journal is The Royal Society of Chemistry 2017 Supplementary information for Graphene oxide-enhanced cytoskeleton imaging and mitosis tracking