Microarray Analysis of Gene Expression in Huntington's Disease Peripheral Blood - a Platform Comparison
|
|
|
- Annabelle Jade Horton
- 6 years ago
- Views:
Transcription
1 Microarray Analysis of Gene Expression in Huntington's Disease Peripheral Blood - a Platform Comparison Thank you for waiting. The presentation will be starting in a few minutes at 9AM Pacific Daylight Time. During this webinar you will be in listen only mode, so if you have a question, please type it into the Question and Answer panel at the end of the presentation. Dr. Olson will try to answer as many questions as possible at the end of the presentation. We will also make the slides and a recording of this presentation available after the webinar. Please contact Dr. Olson at eric@genesifter.net if you would like a copy of the slides.


2 Microarray Analysis of Gene Expression in Huntington's Disease Peripheral Blood - a Platform Comparison N. Eric Olson eric@genesifter.net
3 Microarray Analysis of Gene Expression in Huntington's Disease Peripheral Blood - a Platform Comparison General microarray data analysis workflow From raw data to biological significance Comparison statistics Correction for multiple testing Biological significance Platform comparisons Public microarray databases GeneSifter Overview Microarray analysis of gene expression in HD peripheral blood Identification of biological themes Platform comparison
4 The Microarray Data Analysis Process Experimental Design Number of groups, factors, replicates Data management Data, sample annotation, gene annotation, databases Differential Expression Comparison statistics, Correction for multiple testing, Clustering Biological significance Individual genes, Biological themes Platform Selection One-color, two-color, platform comparisons System access Ease of use, accessibility Making data public and using public data MIAME, Journals, GEO, meta-analysis
5 The Microarray Data Analysis Process Experimental Design Number of groups, factors, replicates Data management Data, sample annotation, gene annotation, databases Differential Expression Comparison statistics, Correction for multiple testing, Clustering Biological significance Individual genes, Biological themes Platform Selection One-color, two-color, platform comparisons System access Ease of use, accessibility Making data public and using public data MIAME, Journals, GEO, meta-analysis
6 Experiment Design Type of experiment Two groups Normal vs. cancer Control vs. treated Three or more groups, single factor Time series Dose response Multiple treatment Four or more groups, multiple factors Time series with control and treated cells The type of experiment and number of groups and factors will determine the statistical methods needed to detect differential expression Replicates The more the better, but at least 3 Biological better than technical Rigorous statistical inferences cannot be made with a sample size of one. The more replicates, the stronger the inference. Pavlidis P, Li Q, Noble WS. The effect of replication on gene expression microarray experiments. Bioinformatics Sep 1;19(13): Experimental Design and Other Issues in Microarray Studies - Kathleen Kerr -
7 Differential Expression The fundamental goal of microarray experiments is to identify genes that are differentially expressed in the conditions being studied. Comparison statistics can be used to help identify differentially expressed genes and cluster analysis can be used to identify patterns of gene expression and to segregate a subset of genes based on these patterns. Statistical Significance Fold change Fold change does not address the reproducibility of the observed difference and cannot be used to determine the statistical significance. Comparison statistics 2 group t-test, Welch s t-test, Wilcoxon Rank Sum, 3 or more groups, single factor One-way ANOVA, Kruskal-Wallis 4 or more groups, multiple factors Two-way ANOVA Comparison tests require replicates and use the variability within the replicates to assign a confidence level as to whether the gene is differentially expressed. Supporting material - Draghici S. (2002) Statistical intelligence: effective analysis of high-density microarray data. Drug Discov Today, 7(11 Suppl).: S55-63.
 df = n 1 + n 2-2 The larger the difference between the groups and the lower the variance the bigger t will be and")
8 t-test for comparison of two groups Calculate t statistic t = difference between groups difference within groups = Mean grp 1 Mean grp 2 ((s 12 /n 1 ) + (s 22 /n 2 )) 1/2 s = variance n = size of sample Determine confidence level for t (probability that t could occur by chance) df = n 1 + n 2-2 The larger the difference between the groups and the lower the variance the bigger t will be and the lower p will be
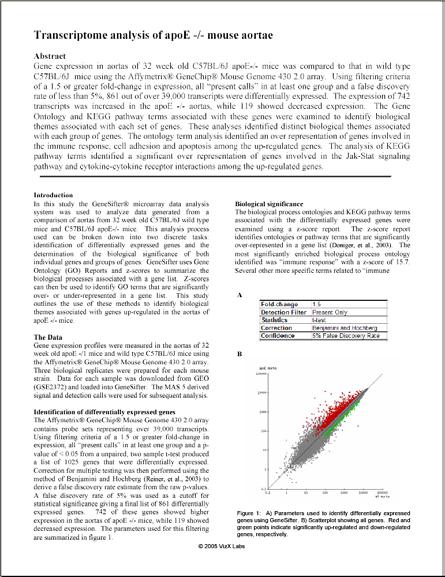
9 Differential Expression 2 groups, 4 replicates each Mean, standard deviation, fold change and p-value calculated 8 Mean Signal Exp Con Gene 1 Fold Change = 5.3 p = 0.19 Mean Signal Exp Con Gene 2 Fold Change = 5.3 p = 0.03 Fold change vs. p value
10 Differential Expression Correction for multiple testing- Methods for adjusting the p-value from a comparison test based on the number of tests performed. These adjustments help to reduce the number of false positives in an experiment. FWER : Family Wise Error Rate (FWER) corrections adjust the p-value so that it reflects the chance of at least 1 false positive being found in the list. Bonferonni, Holm, W & Y MaxT FDR : False Discovery Rate corrections (FDR) adjust the p-value so that it reflects the frequency of false positives in the list. Benjamini and Hochberg, SAM The FWER methods are more conservative, but the FDR methods are usually acceptable for discovery experiments, i.e. where a small number of false positives is acceptable Dudoit, S., et al. (2003) Multiple hypothesis testing in microarray experiments. Statistical Science 18(1): Reiner, A., et al. (2003) Identifying differentially expressed genes using false discovery rate controlling procedures. Bioinformatics 19(3):
11 Multiple Hypothesis Testing in Microarray Experiments Per comparison error rate (PCER) the probability of error for each comparison Family-wise error rate (FWER) the probability of at least one error for all comparisons False discovery rate (FDR) the expected proportion of errors among your results An error means a false positive Example : 1000 genes and 50 differentially expressed using cutoff of 5% PCER - using a 5% PCER means a 5% chance of error for each comparison, so perhaps 50 errors for 1000 comparisons. This is not acceptable, you don t have confidence than any of your results are real (not errors). FWER using 5% FWER means there is a 5% chance that you have at least 1 error. This is very good and would be a very conservative requirement, you are confident that all of your results are real. FDR using 5% FDR you would expect 2.5 errors (5% of 50). This is probably acceptable, you are confident that most of your results are real.
 5% FWER: 19 genes (5% chance of 1 error) 5% FDR: 904 genes (estimate 45")
12 Correction Example CodeLink Ms 10K BioArray Lacrimal + Placebo Lacrimal + Androgen 3 biological replicates 9982 Comparisons t-test 5% PCER : 2458 genes (estimate 499 errors) 5% FWER: 19 genes (5% chance of 1 error) 5% FDR: 904 genes (estimate 45 errors)

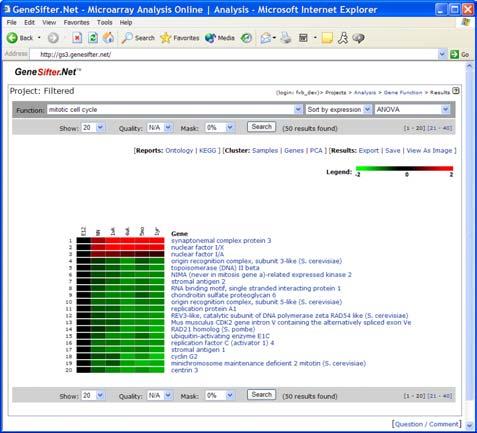
13 Differential Expression - Gene Lists
14 Biological Significance Gene Annotation Sources UniGene - organizes GenBank sequences into a non-redundant set of gene-oriented clusters. Gene titles are assigned to the clusters and these titles are commonly used by researchers to refer to that particular gene. LocusLink (Entrez Gene) - provides a single query interface to curated sequence and descriptive information, including function, about genes. Gene Ontologies The Gene Ontology Consortium provides controlled vocabularies for the description of the molecular function, biological process and cellular component of gene products, that can be used by databases such as Entrez Gene. KEGG - Kyoto Encyclopedia of Genes and Genomes provides information about both regulatory and metabolic pathways for genes. Reference Sequences- The NCBI Reference Sequence project (RefSeq) provides reference sequences for both the mrna and protein products of included genes.
15 Gene annotation for individual genes

16 Ontology reports identify biological themes
17 Ontology Report : z-score R = total number of genes meeting selection criteria N = total number of genes measured r = number of genes meeting selection criteria with the specified GO term n = total number of genes measured with the specific GO term Reference: Scott W Doniger, Nathan Salomonis, Kam D Dahlquist, Karen Vranizan, Steven C Lawlor and Bruce R Conklin; MAPPFinder: usig Gene Ontology and GenMAPP to create a global gene-expression profile from microarray data, Genome Biology 2003, 4:R7
 18 groups,")
 Up regulated Down regulated Gene Lists One-way ANOVA BH (FDR)")

18 Analysis Workflow Examples 2 groups (HD and healthy blood ) 5 groups, single factor (Drosophila Innate Immune Response Time Series) 18 groups, two factors (Gene expression after myocardial infarction in mouse) t-test BH (FDR) Up regulated Down regulated Gene Lists One-way ANOVA BH (FDR) Clustering Gene Lists Two-way ANOVA BH (FDR) Clustering Gene Lists Individual genes of interest Biological themes (Pathways, molecular functions, etc.)
19 The Microarray Data Analysis Process Experimental Design Number of groups, factors, replicates Data management Data, sample annotation, gene annotation, databases Differential Expression Comparison statistics, Correction for multiple testing, Clustering Biological significance Individual genes, Biological themes Platform Selection One-color, two-color, platform comparisons System access Ease of use, accessibility Making data public and using public data MIAME, Journals, GEO, meta-analysis
 Independent samples, Affymetrix, Agilent Convert accession/ref Seq ids to Entrez Gene Ids Genes 55% overlap Identify significant ontologies/pathways Biological themes -")
20 Platform Comparisons Normal Testis vs. Seminoma (GSE3218 & GSE1818) Independent samples, Affymetrix, Agilent Convert accession/ref Seq ids to Entrez Gene Ids Genes 55% overlap Identify significant ontologies/pathways Biological themes - 100% top 10 Additional references: Barnes M, Freudenberg J, Thompson S, Aronow B, Pavlidis P. Experimental comparison and cross-validation of the Affymetrix and Illumina gene expression analysis platforms. Nucleic Acids Res Oct 19;33(18): Print Larkin JE, Frank BC, Gavras H, Sultana R, Quackenbush J. Independence and reproducibility across microarray platforms. Nat Methods May;2(5): Epub 2005 Apr 21. Irizarry et al. Multiple-laboratory comparison of microarray platforms. Nat Methods May;2(5): Jun;2(6):477.

21 The Gene Expression Omnibus (GEO) Gene expression data repository (mostly microarrays) Over 3000 data sets All array platforms represented Searchable by Platform Species Experiment annotation Downloadable data Using the Gene Expression Omnibus (
22 Microarray Analysis of Gene Expression in Huntington's Disease Peripheral Blood - a Platform Comparison General microarray data analysis workflow From raw data to biological significance Comparison statistics Correction for multiple testing Biological significance Platform comparisons Public microarray databases GeneSifter Overview Microarray analysis of gene expression in HD peripheral blood Identification of biological themes Platform comparison
 Multiple upload tools CodeLink Affymetrix Illumina Agilent Custom")


23 GeneSifter Microarray Data Analysis Accessibility Web-based Secure Data management Data Annotation (MIAME) Multiple upload tools CodeLink Affymetrix Illumina Agilent Custom Differential Expression - Powerful, accessible tools for determining Statistical Significance R based statistics Bioconductor Comparison Tests t-test, Welch s t-test, Wilcoxon Rank sum test, one-way ANOVA, two-way ANOVA Correction for Multiple Testing Bonferroni, Holm, Westfall and Young maxt, Benjamini and Hochberg Unsupervised Clustering PAM, CLARA, Hierarchical clustering Silhouettes


24 GeneSifter Microarray Data Analysis Integrated tools for determining Biological Significance One Click Gene Summary Ontology Report Pathway Report Search by ontology terms Search by KEGG terms or Chromosome

25 The GeneSifter Data Center Free resource Training Research Publishing 6 areas Cardiovascular Cancer Endocrinology Neuroscience Immunology Oral Biology Access to : Data Analysis summary Tutorials WebEx


26 The GeneSifter Data Center
27 Microarray Analysis of Gene Expression in Huntington's Disease Peripheral Blood - a Platform Comparison General microarray data analysis workflow From raw data to biological significance Comparison statistics Correction for multiple testing Biological significance Platform comparisons Public microarray databases GeneSifter Overview Microarray analysis of gene expression in HD peripheral blood Identification of biological themes Platform comparison
28 Background - Huntington s Disease Huntington s Disease (HD) Autosomal dominant neurodegenerative disease Motor impairment Cognitive decline Various psychiatric symptoms Onset years Mutant Huntingtin protein (polyglutamine) Effects transcriptional regulation Transcription effects may occur outside of CNS

29 Background - Data Human blood expression for Huntington s disease versus control, CodeLink CodeLink Human 20K Bioarray Borovecki F, Lovrecic L, Zhou J, Jeong H, Then F, Rosas HD, Hersch SM, Hogarth P, Bouzou B, Jensen RV, Krainc D. Genome-wide expression profiling of human blood reveals biomarkers for Huntington's disease. Proc Natl Acad Sci U S A Aug 2;102(31):
30 Background - Data Genome-wide expression profiling of human blood reveals biomarkers for Huntington's disease Borovecki F, Lovrecic L, Zhou J, Jeong H, Then F, Rosas HD, Hersch SM, Hogarth P, Bouzou B, Jensen RV, Krainc D. Proc Natl Acad Sci U S A Aug 2;102(31): Collected peripheral blood samples - 14 Controls 12 Symptomatic HD patients 5 Presymptomatic HD patients Identified 322 most differentially expressed genes (Con. Vs Symptomatic HD) using U133A array. Used CodeLink 20K to confirm genes identifed using Affymetrix platform Focused on 12 genes that showed most significant difference between Control and HD Data available from GEO

31 Pairwise Analysis Select group 1 14 normal Select group 2 12 Huntingtons

32 Pairwise Analysis Already normalized (median) t-test Quality filter 0.75 (filters out genes with signal less than 0.75) Benjamini and Hochberg (FDR) Log transform data

33 Pairwise Analysis Gene List
34 One-Click Gene Summary

35 Ontology Report
36 Z-score Report

37 Z-score Report

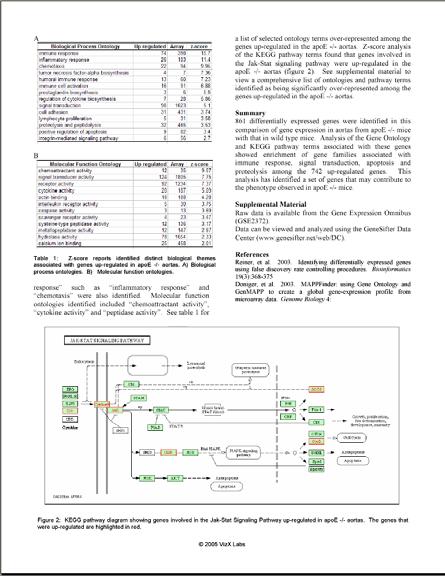
38 KEGG Report
39 Pairwise Analysis - Summary Human blood expression for Huntington s disease versus control, CodeLink 12 HD 14 Control t-test, Benjamini and Hochberg (FDR) Pattern selection 2606 increased In HD Z-scores Biological processes Protein biosynthesis (104) Ubiquitin cycle (123) RNA splicing (53) KEGG Oxidataive phosphorylation (35) Apoptosis (22) ~20,000 genes 5684 genes 3078 decreased In HD Biological processes Neurogenesis (90) Cell adhesion (120) Sodium ion transport (29) G-protein coupled receptor signaling (114) KEGG Neuroactive ligand-receptor interaction (56)

40 Mouse model Huntington s Disease 3 WT untreated 3 WT treated 4 R6/2 untreated 3 R6/2 treated


41 RNA Splicing in mouse model 3 WT untreated, 4 R6/2 untreated t-test 500+ genes two-way ANOVA WT untreated and treated R6/2 untreated and treated Significant interaction 5 RNA splicing genes
42 Microarray Analysis of Gene Expression in Huntington's Disease Peripheral Blood - a Platform Comparison General microarray data analysis workflow From raw data to biological significance Comparison statistics Correction for multiple testing Biological significance Platform comparisons Public microarray databases GeneSifter Overview Microarray analysis of gene expression in HD peripheral blood Identification of biological themes Platform comparison

43 Pairwise Analysis Human blood expression for Huntington s disease versus control, Affymetrix U133A Human Genome Array MAS 5 signal Borovecki F, Lovrecic L, Zhou J, Jeong H, Then F, Rosas HD, Hersch SM, Hogarth P, Bouzou B, Jensen RV, Krainc D. Genome-wide expression profiling of human blood reveals biomarkers for Huntington's disease. Proc Natl Acad Sci U S A Aug 2;102(31):
 Benjamini and Hochberg (FDR) Log transform")
44 Pairwise Analysis - Affymetrix Already normalized (median) t-test Quality filter 50 (filters out genes with signal less than 50) Benjamini and Hochberg (FDR) Log transform data

45 Pairwise Analysis Gene List Human blood expression for Huntington s disease versus control, Affymetrix
46 Gene Lists Common and Unique Genes

47 Platform comparison Biological themes Affymetrix

48 Platform comparison Biological themes CodeLink


 Differential expression Fold")


49 GeneSifter - Analysis Examples 2 groups (Huntingtons Blood vs Healthy Blood) Data Upload CodeLink 3 + groups (Time series, dose response, etc.) Differential expression Fold change Quality t-test False discovery rate Differential expression Fold change Quality ANOVA False discovery rate Visualization Hierarchical clustering PCA Partitioning PAM Silhouettes Biological significance Gene Annotation Ontology report Pathway report
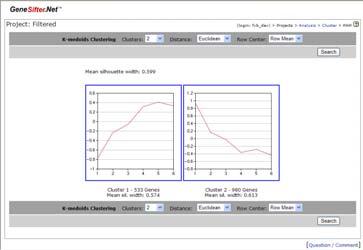
50 Project Analysis - Clustering
51 Cluster by Samples All Genes CodeLink Affymetrix
52 Cluster by Samples All Genes CodeLink Affymetrix
53 Cluster by Samples? CodeLink Affymetrix
54 Cluster by Samples Y Chrom. Genes CodeLink Affymetrix


55 Platform Comparison - Summary CodeLink Affymetrix Transcripts Total Increased in HD Overlap (LL genes) 41% 65% Top BP Ontologies Ubiquitin cycle RNA splicing Regulation of translation Apoptosis Clustering of samples

56 Platform Comparison - Summary CodeLink Affymetrix Increased in HD Decreased in HD Unique ontology Oxidative Phos. IL-6 Biosynthesis


57 Resources Monthly Webinar Series Archived - Using 2-way ANOVA to dissect gene expression following myocardial infarction in mice Archived - Using 2-way ANOVA to dissect the immune response to hookworm infection in mouse lung Archived - The microarray data analysis process - from raw data to biological significance Archived - Microarray analysis of gene expression in androgen-independent prostate cancer Archived - Microarray analysis of gene expression in male germ cell tumors


58 Thank You Trial account, tutorials, sample data and Data Center Eric Olson
Microarray Analysis of Gene Expression in Huntington's Disease Peripheral Blood - a Platform Comparison. CodeLink compatible
 Microarray Analysis of Gene Expression in Huntington's Disease Peripheral Blood - a Platform Comparison CodeLink compatible Microarray Analysis of Gene Expression in Huntington's Disease Peripheral Blood
Using 2-way ANOVA to dissect the immune response to hookworm infection in mouse lung
 Using 2-way ANOVA to dissect the immune response to hookworm infection in mouse lung Using 2-way ANOVA to dissect the immune response to hookworm infection in mouse lung General microarry data analysis
Using 2-way ANOVA to dissect gene expression following myocardial infarction in mice
 Using 2-way ANOVA to dissect gene expression following myocardial infarction in mice Thank you for waiting. The presentation will be starting in a few minutes at 9AM Pacific Daylight Time. During this
Seven Keys to Successful Microarray Data Analysis
 Seven Keys to Successful Microarray Data Analysis Experiment Design Platform Selection Data Management System Access Differential Expression Biological Significance Data Publication Type of experiment
The microarray data analysis process - from raw data to biological significance. N. Eric Olson
 The microarray data analysis process - from raw data to biological significance N. Eric Olson eric@genesifter.net Microarrays 60,000 56,000 Data Points per Experiment 50,000 40,000 30,000 20,000 10,000
The microarray data analysis process - from raw data to biological significance
 The microarray data analysis process - from raw data to biological significance Thank you for waiting. The presentation will be starting in a few minutes at 6AM Pacific Daylight Time. During this webinar
Microarray analysis of gene expression in male germ cell tumors
 Microarray analysis of gene expression in male germ cell tumors Microarray analysis of gene expression in male germ cell tumors General microarry data analysis workflow From raw data to biological significance
Identification of biological themes in microarray data from a mouse heart development time series using GeneSifter
 Identification of biological themes in microarray data from a mouse heart development time series using GeneSifter VizX Labs, LLC Seattle, WA 98119 Abstract Oligonucleotide microarrays were used to study
Introduction to microarray technology and data analysis
 Introduction to microarray technology and data analysis Aron C. Eklund eklund@cbs.dtu.dk Cancer Systems Biology group Center for Biological Sequence Analysis Technical University of Denmark Introduction
Introduction to microarray technology and data analysis
 Introduction to microarray technology and data analysis Aron C. Eklund eklund@cbs.dtu.dk Cancer Systems Biology group Center for Biological Sequence Analysis Technical University of Denmark Introduction
The Microarray Data Analysis Process: From Raw Data to Biological Significance
 NeuroRx : The Journal of the American Society for Experimental NeuroTherapeutics The Microarray Data Analysis Process: From Raw Data to Biological Significance N. Eric Olson VizX Labs, Seattle, Washington
Analysis of Microarray Data
 Analysis of Microarray Data Lecture 3: Visualization and Functional Analysis George Bell, Ph.D. Bioinformatics Scientist Bioinformatics and Research Computing Whitehead Institute Outline Review Visualizing
Analysis of Microarray Data
 Analysis of Microarray Data Lecture 3: Visualization and Functional Analysis George Bell, Ph.D. Senior Bioinformatics Scientist Bioinformatics and Research Computing Whitehead Institute Outline Review
PATHWAY ANALYSIS. Susan LM Coort, PhD Department of Bioinformatics, Maastricht University. PET course: Toxicogenomics
 PATHWAY ANALYSIS Susan LM Coort, PhD Department of Bioinformatics, Maastricht University 1 Data analysis overview Microarray scans Slide based on a slide from J. Pennings, RIVM, NL Image analysis Preprocessing
Microarray Informatics
 Microarray Informatics Donald Dunbar MSc Seminar 4 th February 2009 Aims To give a biologistʼs view of microarray experiments To explain the technologies involved To describe typical microarray experiments
Gene Expression Data Analysis
 Gene Expression Data Analysis Bing Zhang Department of Biomedical Informatics Vanderbilt University bing.zhang@vanderbilt.edu BMIF 310, Fall 2009 Gene expression technologies (summary) Hybridization-based
Microarray Informatics
 Microarray Informatics Donald Dunbar MSc Seminar 31 st January 2007 Aims To give a biologist s view of microarray experiments To explain the technologies involved To describe typical microarray experiments
Introduction to Microarray Technique, Data Analysis, Databases Maryam Abedi PhD student of Medical Genetics
 Introduction to Microarray Technique, Data Analysis, Databases Maryam Abedi PhD student of Medical Genetics abedi777@ymail.com Outlines Technology Basic concepts Data analysis Printed Microarrays In Situ-Synthesized
CodeLink Human Whole Genome Bioarray
 CodeLink Human Whole Genome Bioarray 55,000 human gene targets on a single bioarray The CodeLink Human Whole Genome Bioarray comprises one of the most comprehensive coverages of the human genome, as it
Annotation. (Chapter 8)
") Annotation (Chapter 8) Genome annotation Genome annotation is the process of attaching biological information to sequences: identify elements on the genome attach biological information to elements store
Annotation (Chapter 8) Genome annotation Genome annotation is the process of attaching biological information to sequences: identify elements on the genome attach biological information to elements store
Bioconductor. Course in Practical Microarray Analysis Berlin Slides 2002 Sandrine Dudoit, Robert Gentleman. Adapted by Wolfgang Huber.
 Bioconductor Course in Practical Microarray Analysis Berlin 27.-30.1.2003 Slides 2002 Sandrine Dudoit, Robert Gentleman. Adapted by Wolfgang Huber. Statistical computing Applications statistical design
Standard Data Analysis Report Agilent Gene Expression Service
 Standard Data Analysis Report Agilent Gene Expression Service Experiment: S534662 Date: 2011-01-01 Prepared for: Dr. Researcher Genomic Sciences Lab Prepared by S534662 Standard Data Analysis Report 2011-01-01
Analyzing Gene Set Enrichment
 Analyzing Gene Set Enrichment BaRC Hot Topics June 20, 2016 Yanmei Huang Bioinformatics and Research Computing Whitehead Institute http://barc.wi.mit.edu/hot_topics/ Purpose of Gene Set Enrichment Analysis
Deakin Research Online
 Deakin Research Online This is the published version: Church, Philip, Goscinski, Andrzej, Wong, Adam and Lefevre, Christophe 2011, Simplifying gene expression microarray comparative analysis., in BIOCOM
Agilent GeneSpring GX 10: Beyond. Pam Tangvoranuntakul Product Manager, GeneSpring October 1, 2008
 Agilent GeneSpring GX 10: Gene Expression and Beyond Pam Tangvoranuntakul Product Manager, GeneSpring October 1, 2008 GeneSpring GX 10 in the News Our Goals for GeneSpring GX 10 Goal 1: Bring back GeneSpring
Understanding protein lists from proteomics studies. Bing Zhang Department of Biomedical Informatics Vanderbilt University
 Understanding protein lists from proteomics studies Bing Zhang Department of Biomedical Informatics Vanderbilt University bing.zhang@vanderbilt.edu A typical comparative shotgun proteomics study IPI00375843
AGILENT S BIOINFORMATICS ANALYSIS SOFTWARE
 ACCELERATING PROGRESS IS IN OUR GENES AGILENT S BIOINFORMATICS ANALYSIS SOFTWARE GENESPRING GENE EXPRESSION (GX) MASS PROFILER PROFESSIONAL (MPP) PATHWAY ARCHITECT (PA) See Deeper. Reach Further. BIOINFORMATICS
Gene expression analysis: Introduction to microarrays
 Gene expression analysis: Introduction to microarrays Adam Ameur The Linnaeus Centre for Bioinformatics, Uppsala University February 15, 2006 Overview Introduction Part I: How a microarray experiment is
GS Analysis of Microarray Data
 GS01 0163 Analysis of Microarray Data Keith Baggerly and Brad Broom Department of Bioinformatics and Computational Biology UT M. D. Anderson Cancer Center kabagg@mdanderson.org bmbroom@mdanderson.org 7
Lecture #1. Introduction to microarray technology
 Lecture #1 Introduction to microarray technology Outline General purpose Microarray assay concept Basic microarray experimental process cdna/two channel arrays Oligonucleotide arrays Exon arrays Comparing
Integrative Genomics 1a. Introduction
 2016 Course Outline Integrative Genomics 1a. Introduction ggibson.gt@gmail.com http://www.cig.gatech.edu 1a. Experimental Design and Hypothesis Testing (GG) 1b. Normalization (GG) 2a. RNASeq (MI) 2b. Clustering
Microarray Data Analysis Workshop. Preprocessing and normalization A trailer show of the rest of the microarray world.
 Microarray Data Analysis Workshop MedVetNet Workshop, DTU 2008 Preprocessing and normalization A trailer show of the rest of the microarray world Carsten Friis Media glna tnra GlnA TnrA C2 glnr C3 C5 C6
Exploration and Analysis of DNA Microarray Data
 Exploration and Analysis of DNA Microarray Data Dhammika Amaratunga Senior Research Fellow in Nonclinical Biostatistics Johnson & Johnson Pharmaceutical Research & Development Javier Cabrera Associate
Measuring and Understanding Gene Expression
 Measuring and Understanding Gene Expression Dr. Lars Eijssen Dept. Of Bioinformatics BiGCaT Sciences programme 2014 Why are genes interesting? TRANSCRIPTION Genome Genomics Transcriptome Transcriptomics
Microarray Data Analysis in GeneSpring GX 11. Month ##, 200X
 Microarray Data Analysis in GeneSpring GX 11 Month ##, 200X Agenda Genome Browser GO GSEA Pathway Analysis Network building Find significant pathways Extract relations via NLP Data Visualization Options
How to deal with the microarray results.
 How to deal with the microarray results. Britt Gabrielsson PhD RCEM, Div of metabolism and cardiovascular research Department of Medicine The Sahlgrenska Academy at Göteborg University and then we will
GS Analysis of Microarray Data
 GS01 0163 Analysis of Microarray Data Keith Baggerly and Brad Broom Department of Bioinformatics and Computational Biology UT M. D. Anderson Cancer Center kabagg@mdanderson.org bmbroom@mdanderson.org 8
Research Powered by Agilent s GeneSpring
 Research Powered by Agilent s GeneSpring Agilent Technologies, Inc. Carolina Livi, Bioinformatics Segment Manager Research Powered by GeneSpring Topics GeneSpring (GS) platform New features in GS 13 What
Bioconductor. Course in Practical Microarray Analysis Heidelberg
 Bioconductor Course in Practical Microarray Analysis Heidelberg 23.-27.9.2002 Slides 2002 Sandrine Dudoit, Robert Gentleman. Adapted by Wolfgang Huber. Statistical computing Everywhere for statistical
Gene expression analysis. Biosciences 741: Genomics Fall, 2013 Week 5. Gene expression analysis
 Gene expression analysis Biosciences 741: Genomics Fall, 2013 Week 5 Gene expression analysis From EST clusters to spotted cdna microarrays Long vs. short oligonucleotide microarrays vs. RT-PCR Methods
Web-based tools for Bioinformatics; A (free) introduction to (freely available) NCBI, MUSC and World-wide.
 introduction to (freely available) NCBI, MUSC and World-wide.") Page 1 of 24 Web-based tools for Bioinformatics; A (free) introduction to (freely available) NCBI, MUSC and World-wide. When and Where---Wednesdays at 1pm-2pmRoom 438 Library Admin Building Beginning September
Page 1 of 24 Web-based tools for Bioinformatics; A (free) introduction to (freely available) NCBI, MUSC and World-wide. When and Where---Wednesdays at 1pm-2pmRoom 438 Library Admin Building Beginning September
Gene-centered resources at NCBI
 COURSE OF BIOINFORMATICS a.a. 2014-2015 Gene-centered resources at NCBI We searched Accession Number: M60495 AT NCBI Nucleotide Gene has been implemented at NCBI to organize information about genes, serving
IPA Advanced Training Course
 IPA Advanced Training Course Academia Sinica 2015 Oct Gene( 陳冠文 ) Supervisor and IPA certified analyst 1 Review for Introductory Training course Searching Building a Pathway Editing a Pathway for Publication
Basic aspects of Microarray Data Analysis
 Hospital Universitari Vall d Hebron Institut de Recerca - VHIR Institut d Investigació Sanitària de l Instituto de Salud Carlos III (ISCIII) Basic aspects of Microarray Data Analysis Expression Data Analysis
Next-Generation Sequencing Gene Expression Analysis Using Agilent GeneSpring GX
 Next-Generation Sequencing Gene Expression Analysis Using Agilent GeneSpring GX Technical Overview Introduction RNA Sequencing (RNA-Seq) is one of the most commonly used next-generation sequencing (NGS)
GS Analysis of Microarray Data
 GS01 0163 Analysis of Microarray Data Keith Baggerly and Kevin Coombes Department of Bioinformatics and Computational Biology UT M. D. Anderson Cancer Center kabagg@mdanderson.org kcoombes@mdanderson.org
Gene expression: Microarray data analysis. Copyright notice. Outline: microarray data analysis. Schedule
 Gene expression: Microarray data analysis Copyright notice Many of the images in this powerpoint presentation are from Bioinformatics and Functional Genomics by Jonathan Pevsner (ISBN -47-4-8). Copyright
Outline. Analysis of Microarray Data. Most important design question. General experimental issues
 Outline Analysis of Microarray Data Lecture 1: Experimental Design and Data Normalization Introduction to microarrays Experimental design Data normalization Other data transformation Exercises George Bell,
GeneQuery: A phenotype search tool based on gene co-expression clustering. Alexander Predeus 21-oct-2015
 GeneQuery: A phenotype search tool based on gene co-expression clustering Alexander Predeus 21-oct-2015 About myself Graduated from Moscow state University (1998-2003) PhD: Michigan State University (2003-2009):
Gene-Level Analysis of Exon Array Data using Partek Genomics Suite 6.6
 Gene-Level Analysis of Exon Array Data using Partek Genomics Suite 6.6 Overview This tutorial will demonstrate how to: Summarize core exon-level data to produce gene-level data Perform exploratory analysis
David M. Rocke Division of Biostatistics and Department of Biomedical Engineering University of California, Davis
 David M. Rocke Division of Biostatistics and Department of Biomedical Engineering University of California, Davis Outline RNA-Seq for differential expression analysis Statistical methods for RNA-Seq: Structure
Gene Expression Data Analysis (I)
") Gene Expression Data Analysis (I) Bing Zhang Department of Biomedical Informatics Vanderbilt University bing.zhang@vanderbilt.edu Bioinformatics tasks Biological question Experiment design Microarray experiment
Gene Expression Data Analysis (I) Bing Zhang Department of Biomedical Informatics Vanderbilt University bing.zhang@vanderbilt.edu Bioinformatics tasks Biological question Experiment design Microarray experiment
A WEB-BASED TOOL FOR GENOMIC FUNCTIONAL ANNOTATION, STATISTICAL ANALYSIS AND DATA MINING
 A WEB-BASED TOOL FOR GENOMIC FUNCTIONAL ANNOTATION, STATISTICAL ANALYSIS AND DATA MINING D. Martucci a, F. Pinciroli a,b, M. Masseroli a a Dipartimento di Bioingegneria, Politecnico di Milano, Milano,
Introduction to Bioinformatics and Gene Expression Technology
 Vocabulary Introduction to Bioinformatics and Gene Expression Technology Utah State University Spring 2014 STAT 5570: Statistical Bioinformatics Notes 1.1 Gene: Genetics: Genome: Genomics: hereditary DNA
MulCom: a Multiple Comparison statistical test for microarray data in Bioconductor.
 MulCom: a Multiple Comparison statistical test for microarray data in Bioconductor. Claudio Isella, Tommaso Renzulli, Davide Corà and Enzo Medico May 3, 2016 Abstract Many microarray experiments compare
Optimal Calculation of RNA-Seq Fold-Change Values
 International Journal of Computational Bioinformatics and In Silico Modeling Vol. 2, No. 6 (2013): 285-292 Research Article Open Access ISSN: 2320-0634 Optimal Calculation of RNA-Seq Fold-Change Values
Introduction to Bioinformatics and Gene Expression Technologies
 Introduction to Bioinformatics and Gene Expression Technologies Utah State University Fall 2017 Statistical Bioinformatics (Biomedical Big Data) Notes 1 1 Vocabulary Gene: hereditary DNA sequence at a
Introduction to Bioinformatics and Gene Expression Technologies
 Vocabulary Introduction to Bioinformatics and Gene Expression Technologies Utah State University Fall 2017 Statistical Bioinformatics (Biomedical Big Data) Notes 1 Gene: Genetics: Genome: Genomics: hereditary
The essentials of microarray data analysis
 The essentials of microarray data analysis (from a complete novice) Thanks to Rafael Irizarry for the slides! Outline Experimental design Take logs! Pre-processing: affy chips and 2-color arrays Clustering
Final exam: Introduction to Bioinformatics and Genomics DUE: Friday June 29 th at 4:00 pm
 Final exam: Introduction to Bioinformatics and Genomics DUE: Friday June 29 th at 4:00 pm Exam description: The purpose of this exam is for you to demonstrate your ability to use the different biomolecular
April transmart v1.2 Case Study for PredicTox
 April 2015 transmart v1.2 Case Study for PredicTox Agenda Agenda! What is PredicTox?! Brief transmart overview! Answering scientific questions with transmart s help: A case study maximizing data value!
Exercise1 ArrayExpress Archive - High-throughput sequencing example
 ArrayExpress and Atlas practical: querying and exporting gene expression data at the EBI Gabriella Rustici gabry@ebi.ac.uk This practical will introduce you to the data content and query functionality
Mouse expression data were normalized using the robust multiarray algorithm (1) using
 using") Supplementary Information Bioinformatics statistical analysis of microarray data Mouse expression data were normalized using the robust multiarray algorithm (1) using a custom probe set definition that
Supplementary Information Bioinformatics statistical analysis of microarray data Mouse expression data were normalized using the robust multiarray algorithm (1) using a custom probe set definition that
Transcriptome Assembly, Functional Annotation (and a few other related thoughts)
") Transcriptome Assembly, Functional Annotation (and a few other related thoughts) Monica Britton, Ph.D. Sr. Bioinformatics Analyst June 23, 2017 Differential Gene Expression Generalized Workflow File Types
Transcriptome Assembly, Functional Annotation (and a few other related thoughts) Monica Britton, Ph.D. Sr. Bioinformatics Analyst June 23, 2017 Differential Gene Expression Generalized Workflow File Types
Supplementary Methods
 Supplementary Methods Microarray Data Analysis Gene expression data were obtained by hybridising a total of 24 samples from 6 experimental groups (n=4 per group) to Illumina HumanHT-12 Expression BeadChips.
Ingenuity Pathway Analysis (IPA )
") Ingenuity Pathway Analysis (IPA ) For the analysis and interpretation of omics data IPA is a web-based software application for the analysis, integration, and interpretation of data derived from omics
Ingenuity Pathway Analysis (IPA ) For the analysis and interpretation of omics data IPA is a web-based software application for the analysis, integration, and interpretation of data derived from omics
11/22/13. Proteomics, functional genomics, and systems biology. Biosciences 741: Genomics Fall, 2013 Week 11
 Proteomics, functional genomics, and systems biology Biosciences 741: Genomics Fall, 2013 Week 11 1 Figure 6.1 The future of genomics Functional Genomics The field of functional genomics represents the
Annotation and Function of Switch-like Genes in Health and Disease. A Thesis. Submitted to the Faculty. Drexel University. Adam M.
 Annotation and Function of Switch-like Genes in Health and Disease A Thesis Submitted to the Faculty of Drexel University by Adam M. Ertel in partial fulfillment of the requirements for the degree of Doctor
Some Principles for the Design and Analysis of Experiments using Gene Expression Arrays and Other High-Throughput Assay Methods
 Some Principles for the Design and Analysis of Experiments using Gene Expression Arrays and Other High-Throughput Assay Methods BST 226 Statistical Methods for Bioinformatics January 8, 2014 1 The -Omics
Array Quality Metrics. Audrey Kauffmann
 Array Quality Metrics Audrey Kauffmann Introduction Microarrays are widely/routinely used Technology and protocol improvements trustworthy Variance and noise Technical causes: Platform Lab, experimentalist
BIOINF/BENG/BIMM/CHEM/CSE 184: Computational Molecular Biology. Lecture 2: Microarray analysis
 BIOINF/BENG/BIMM/CHEM/CSE 184: Computational Molecular Biology Lecture 2: Microarray analysis Genome wide measurement of gene transcription using DNA microarray Bruce Alberts, et al., Molecular Biology
RNA-Seq Analysis. August Strand Genomics, Inc All rights reserved.
 RNA-Seq Analysis August 2014 Strand Genomics, Inc. 2014. All rights reserved. Contents Introduction... 3 Sample import... 3 Quantification... 4 Novel exon... 5 Differential expression... 12 Differential
ChIP-seq data analysis with Chipster. Eija Korpelainen CSC IT Center for Science, Finland
 ChIP-seq data analysis with Chipster Eija Korpelainen CSC IT Center for Science, Finland chipster@csc.fi What will I learn? Short introduction to ChIP-seq Analyzing ChIP-seq data Central concepts Analysis
Introduction to RNA-Seq in GeneSpring NGS Software
 Introduction to RNA-Seq in GeneSpring NGS Software Dipa Roy Choudhury, Ph.D. Strand Scientific Intelligence and Agilent Technologies Learn more at www.genespring.com Introduction to RNA-Seq In a few years,
Pathway Analysis. Min Kim Bioinformatics Core Facility 2/28/2018
 Pathway Analysis Min Kim Bioinformatics Core Facility 2/28/2018 Outline 1. Background 2. Databases: KEGG, Reactome, Biocarta, Gene Ontology, MSigDB, MetaCyc, SMPDB, IPA. 3. Statistical Methods: Overlap
Figure S1. TT and MZ-CRC-1 cell viability and proliferation after Palbociclib treatment. Cell viability assays (A) and cell counting assays (B) were
 and cell counting assays (B) were") Figure S1. TT and MZ-CRC-1 cell viability and proliferation after Palbociclib treatment. Cell viability assays (A) and cell counting assays (B) were performed with TT and MZ-CRC-1 cells treated with Palbociclib
Figure S1. TT and MZ-CRC-1 cell viability and proliferation after Palbociclib treatment. Cell viability assays (A) and cell counting assays (B) were performed with TT and MZ-CRC-1 cells treated with Palbociclib
1. Introduction Gene regulation Genomics and genome analyses
 1. Introduction Gene regulation Genomics and genome analyses 2. Gene regulation tools and methods Regulatory sequences and motif discovery TF binding sites Databases 3. Technologies Microarrays Deep sequencing
Generating quality metrics reports for microarray data sets. Audrey Kauffmann
 Generating quality metrics reports for microarray data sets Audrey Kauffmann Introduction Microarrays are widely/routinely used Technology and protocol improvements trustworthy Variance and noise Technical
Designing a Complex-Omics Experiments. Xiangqin Cui. Section on Statistical Genetics Department of Biostatistics University of Alabama at Birmingham
 Designing a Complex-Omics Experiments Xiangqin Cui Section on Statistical Genetics Department of Biostatistics University of Alabama at Birmingham 1/7/2015 Some slides are from previous lectures of Grier
Stefano Monti. Workshop Format
 Gad Getz Stefano Monti Michael Reich {gadgetz,smonti,mreich}@broad.mit.edu http://www.broad.mit.edu/~smonti/aws Broad Institute of MIT & Harvard October 18-20, 2006 Cambridge, MA Workshop Format Morning
advanced analysis of gene expression microarray data aidong zhang World Scientific State University of New York at Buffalo, USA
 advanced analysis of gene expression microarray data aidong zhang State University of New York at Buffalo, USA World Scientific NEW JERSEY LONDON SINGAPORE BEIJING SHANGHAI HONG KONG TAIPEI CHENNAI Contents
Bioinformatics for Biologists
 Bioinformatics for Biologists Microarray Data Analysis. Lecture 1. Fran Lewitter, Ph.D. Director Bioinformatics and Research Computing Whitehead Institute Outline Introduction Working with microarray data
Materials and Methods
 Materials and Methods 1. Probe design In a previous study, 36mer oligo arrays were shown to yield both high signal intensity and high sequence specificity when tested with a set of 96 Drosophila genes
Gene Regulation Solutions. Microarrays and Next-Generation Sequencing
 Gene Regulation Solutions Microarrays and Next-Generation Sequencing Gene Regulation Solutions The Microarrays Advantage Microarrays Lead the Industry in: Comprehensive Content SurePrint G3 Human Gene
Bioinformatics : Gene Expression Data Analysis
 05.12.03 Bioinformatics : Gene Expression Data Analysis Aidong Zhang Professor Computer Science and Engineering What is Bioinformatics Broad Definition The study of how information technologies are used
less sensitive than RNA-seq but more robust analysis pipelines expensive but quantitiatve standard but typically not high throughput
 Chapter 11: Gene Expression The availability of an annotated genome sequence enables massively parallel analysis of gene expression. The expression of all genes in an organism can be measured in one experiment.
Biological Interpretation of Metabolomics Data. Martina Kutmon Maastricht University
 Biological Interpretation of Metabolomics Data Martina Kutmon Maastricht University Contents Background on pathway analysis WikiPathways Building Research Communities on Biological Pathways Data Analysis
Optimal alpha reduces error rates in gene expression studies: a meta-analysis approach
 Mudge et al. BMC Bioinformatics (2017) 18:312 DOI 10.1186/s12859-017-1728-3 METHODOLOGY ARTICLE Open Access Optimal alpha reduces error rates in gene expression studies: a meta-analysis approach J. F.
Whole Transcriptome Analysis of Illumina RNA- Seq Data. Ryan Peters Field Application Specialist
 Whole Transcriptome Analysis of Illumina RNA- Seq Data Ryan Peters Field Application Specialist Partek GS in your NGS Pipeline Your Start-to-Finish Solution for Analysis of Next Generation Sequencing Data
Total RNA was isolated using the TRIZOL reagent according to the manufacturer s
 RNA extraction Total RNA was isolated using the TRIZOL reagent according to the manufacturer s instructions (Invitrogen, Carlsbad, CA). RNA integrity for each sample was confirmed with the Agilent 2100
Designing Complex Omics Experiments
 Designing Complex Omics Experiments Xiangqin Cui Section on Statistical Genetics Department of Biostatistics University of Alabama at Birmingham 6/15/2015 Some slides are from previous lectures given by
Some Principles for the Design and Analysis of Experiments using Gene Expression Arrays and Other High-Throughput Assay Methods
 Some Principles for the Design and Analysis of Experiments using Gene Expression Arrays and Other High-Throughput Assay Methods SPH 247 Statistical Analysis of Laboratory Data April 21, 2015 1 The -Omics
Transcriptome analysis
 Statistical Bioinformatics: Transcriptome analysis Stefan Seemann seemann@rth.dk University of Copenhagen April 11th 2018 Outline: a) How to assess the quality of sequencing reads? b) How to normalize
org.ag.eg.db October 2, 2015 org.ag.egaccnum is an R object that contains mappings between Entrez Gene identifiers and GenBank accession numbers.
 org.ag.eg.db October 2, 2015 org.ag.egaccnum Map Entrez Gene identifiers to GenBank Accession Numbers org.ag.egaccnum is an R object that contains mappings between Entrez Gene identifiers and GenBank accession
Microarray Experiment Design
 Microarray Experiment Design Samples used, extract preparation and labelling: AML blasts were isolated from bone marrow by centrifugation on a Ficoll- Hypaque gradient. Total RNA was extracted using TRIzol
Non-conserved intronic motifs in human and mouse are associated with a conserved set of functions
 Non-conserved intronic motifs in human and mouse are associated with a conserved set of functions Aristotelis Tsirigos Bioinformatics & Pattern Discovery Group IBM Research Outline. Discovery of DNA motifs
Genome Informatics. Systems Biology and the Omics Cascade (Course 2143) Day 3, June 11 th, Kiyoko F. Aoki-Kinoshita
 Day 3, June 11 th, Kiyoko F. Aoki-Kinoshita") Genome Informatics Systems Biology and the Omics Cascade (Course 2143) Day 3, June 11 th, 2008 Kiyoko F. Aoki-Kinoshita Introduction Genome informatics covers the computer- based modeling and data processing
Genome Informatics Systems Biology and the Omics Cascade (Course 2143) Day 3, June 11 th, 2008 Kiyoko F. Aoki-Kinoshita Introduction Genome informatics covers the computer- based modeling and data processing
Ganatum: a graphical single-cell RNA-seq analysis pipeline
 Ganatum: a graphical single-cell RNA-seq analysis pipeline User Manual February 28, 2017 University of Hawaii 2017 Contents 1. Introduction... 1 2. Upload... 1 3. Batch-effect removal... 4 4. Outlier removal...
Knowledge-Guided Analysis with KnowEnG Lab
 Han Sinha Song Weinshilboum Knowledge-Guided Analysis with KnowEnG Lab KnowEnG Center Powerpoint by Charles Blatti Knowledge-Guided Analysis KnowEnG Center 2017 1 Exercise In this exercise we will be doing
Annotation and the analysis of annotation terms. Brian J. Knaus USDA Forest Service Pacific Northwest Research Station
 Annotation and the analysis of annotation terms. Brian J. Knaus USDA Forest Service Pacific Northwest Research Station 1 Library preparation Sequencing Hypothesis testing Bioinformatics 2 Why annotate?