LELY AREA STORMWATER IMPROVEMENT PROGRAM (LASIP) STAGE AND FLOW SUMMARY
|
|
|
- Sharlene Hawkins
- 6 years ago
- Views:
Transcription
 434-0333 E B 642 FTMS01\Proj-fmw\20087326-011\Reports\2009 Reports\2009 Summary Report.")
1 LELY AREA STORMWATER IMPROVEMENT PROGRAM (LASIP) STAGE AND FLOW SUMMARY 2010 Activity Report Prepared for: Collier County Growth Management Division Prepared by: Johnson Engineering, Inc Stanford Court Naples, FL (239) E B 642 FTMS01\Proj-fmw\ \Reports\2009 Reports\2009 Summary Report.doc April 2010
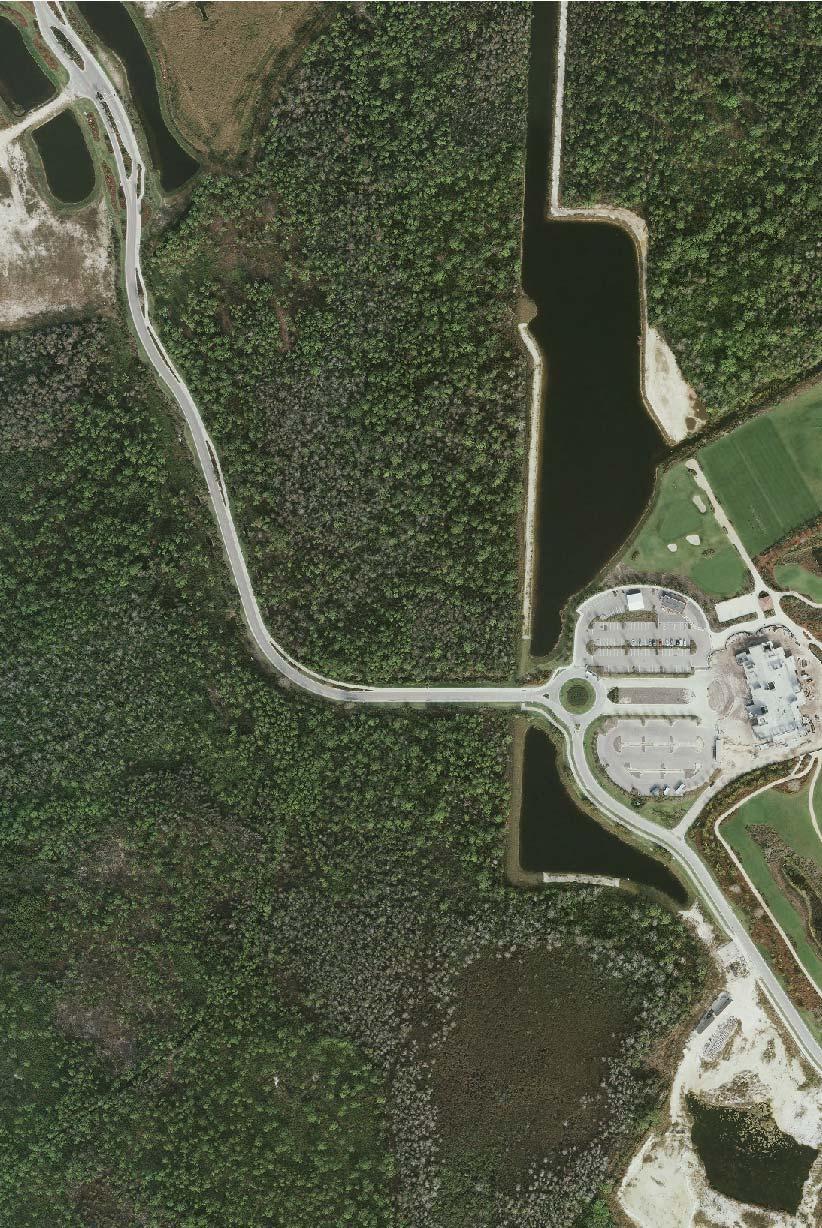
2 EXECUTIVE SUMMARY South Florida Water Management District permit conditions for the Lely Area Stormwater Improvement Project (LASIP) require Collier County to demonstrate the performance of the spreader swales located at the south end of the Lely Main Canal and at the south end of the Lely Manor Canal in Treviso Bay. Collier County is currently performing water quality testing at a group of locations in the system. The stage and flow work currently underway will generate water levels and discharge information to assist in estimating total outflow volumes from those two canals produced by overflow of the control berms. Towards this end, Johnson Engineering has installed a series of staff gages and electronic water level recorders in piezometers for a group of locations downstream of the Lely area for work relating to the Lely Area Stormwater Improvement Program (LASIP). The equipment was installed in March of 2009 and includes 9 electronic water level gages in piezometers with a staff gage at each location. Data collection began immediately, recording water levels at each location at hourly intervals. Two additional gages were installed in January 2011 for the new spreader swale on Lely Manor West Canal. Piezometers were downloaded at approximately quarterly intervals and results plotted on standard time versus water level charts presented inside this report. In addition to monitoring water levels, Johnson Engineering field staff was tasked to perform a series of stream flow measurements at 8 locations with the objective being to develop measurements and data to support the creation of flow measurement rating curves. Due to lack of rainfall throughout the year, only one set of flow measurements was made, that occurring September 15, 2009 with discharge values ranging from 8 cubic feet per second (CFS) to 115 CFS. In 2010, flow measurements were made at six locations on August 25, 2010 and one location on October 12, Values ranges from no flow to 96 CFS, Flow measurement data collected to date are insufficient to develop reliable rating curves. Once rating curves are developed and verified, this information can be used to estimate approximate discharge volumes leaving the Lely system via surface water overflowing several bermed earthen control structures. -i-
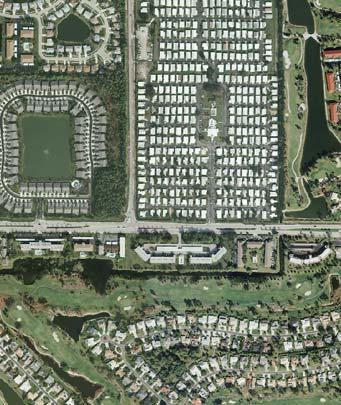
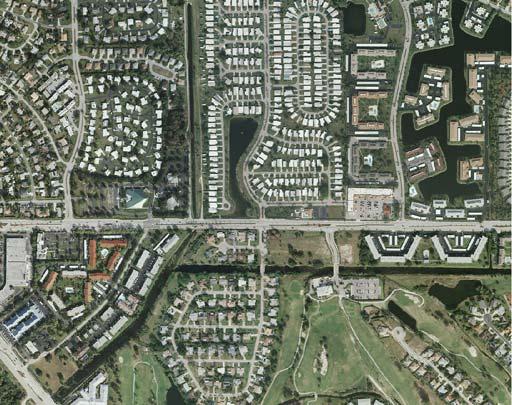
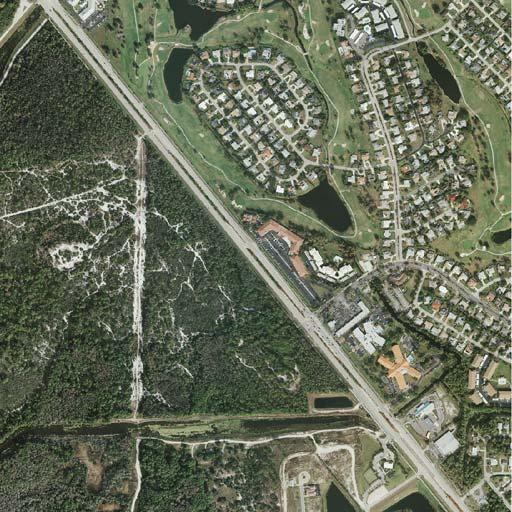
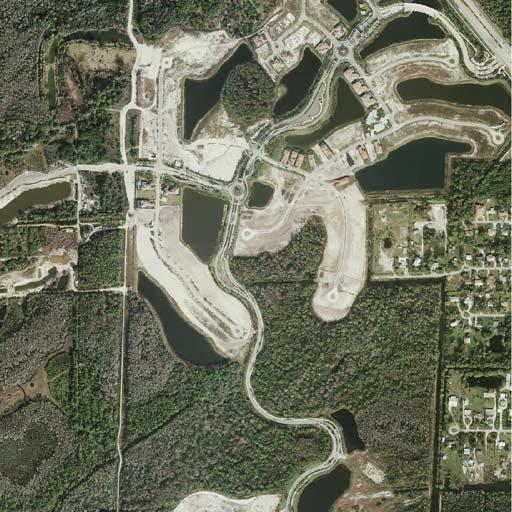
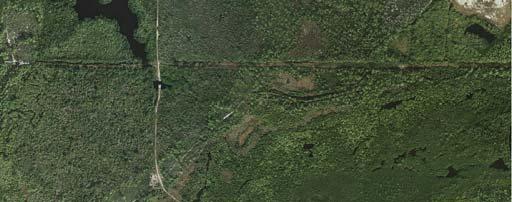
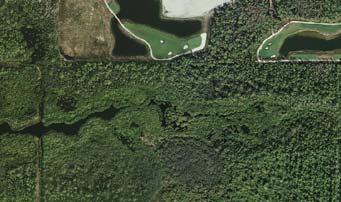
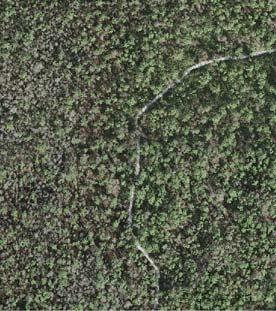
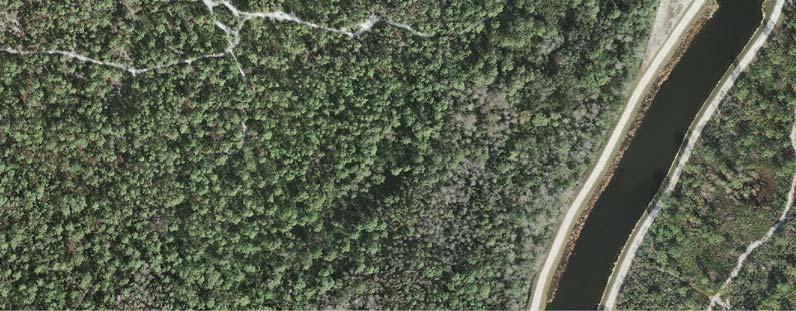
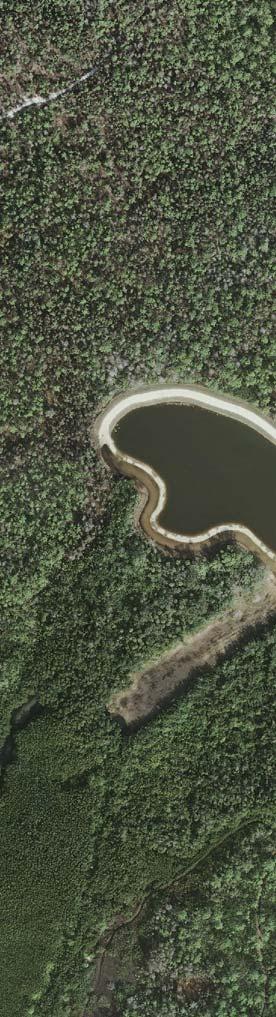
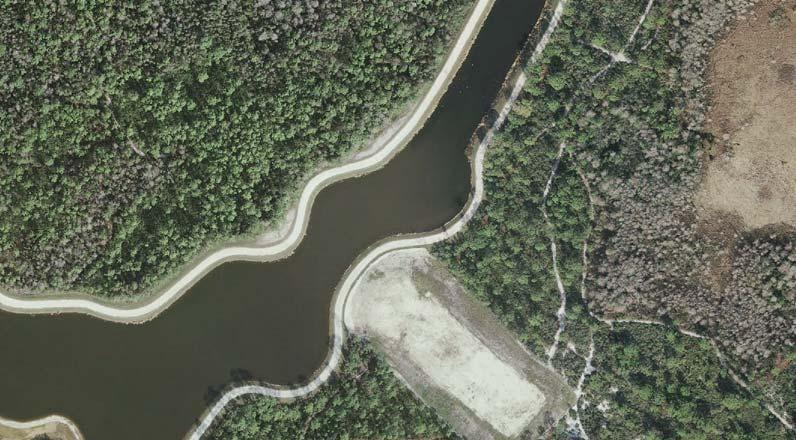
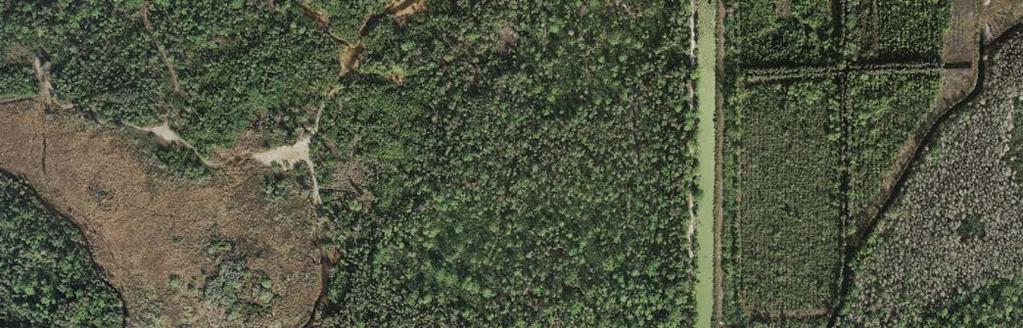
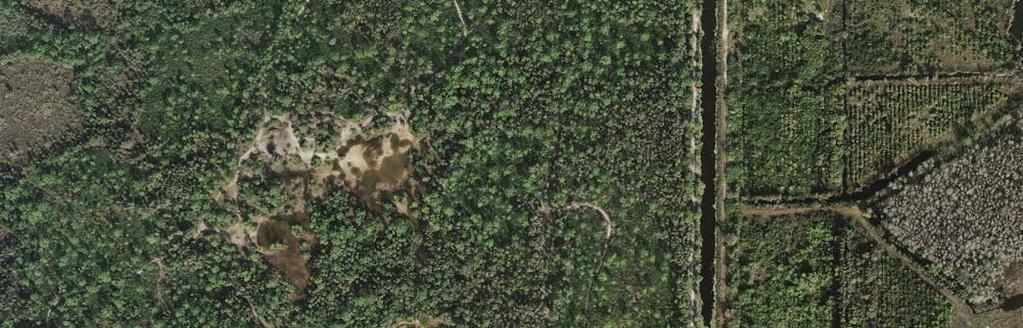
3 The primary outflow points are at the downstream ends of spreader swales constructed as a part of the Treviso Bay water management system and by the County at the downstream end of the Lely Main Canal. An additional outfall and spreader swale was completed during It is known as the Lely Manor West Canal located west of the Treviso Bay development. In early January 2011, two additional water level recorders were installed at the new outfall spreader swale, one upstream of the 1,055 LF overflow berm, and one downstream. A staff gage was also set near the new upstream recorder location. These locations are shown on Exhibit A and the new Lely Manor West Canal outfall is shown in more detail on Exhibit E. Current plans are to continue stage monitoring and to collect additional flow measurements at all locations during the 2011 calendar year. This will include downloading of the 11 water level recorders at approximately quarterly intervals and reading the staff gages at the same times. Rainfall data will continue to be acquired from SFWMD gage at Rookery Bay, as well as water levels at US 41 bridge at Lely Main Canal, also from SFWMD data files. Flow measurements are also anticipated should sufficient rainfall occur in the wet season. Flow measurements are not part of the current scope of work and will need a separate contract at that time. -ii-
4 TABLE OF CONTENTS Page EXECUTIVE SUMMARY... i 1.0 WATER LEVEL READINGS Instrumentation Recording Intervals Data Downloading Methodology STAFF GAGE READINGS Methodology FLOW MEASUREMENTS Methodology Results RECOMMENDATIONS iii-
5 LIST OF TABLES Number 1 Typical Piezometer Raw Data LASIP Staff Gages LASIP Flow Summary LIST OF FIGURES Number 1 In-Situ Piezometer Installation Sketches (1-11) Figures Level Troll LIST OF MAP EXHIBITS Exhibit A. Stage and Flow Project Location Map B. Stage and Flow Locations Lely Main Canal Spreader Swale C. Stage and Flow Locations Lely Manor Canal Spreader Swale D. Stage and Flow Locations Lely Manor Canal at LMB01 E. Stage and Flow Locations Lely Manor West Canal LMBOOSLU LIST OF CHARTS Number 1 Rainfall Chart Rookery Bay 2 US 41 at Lely Main Canal Stages Lely Main Canal Spreader Swale 4 Lely Manor Canal Spreader Swale South Outfall 5 Lely Manor Canal Spreader Swale North Outfall 6 Lely Manor Canal West Outfall at US 41 7 Lely Manor Canal at LMB01 APPENDICES Appendix A Site Photographs -iv-
6 Collier County (LASIP Hydrological Monitoring) June 20th, 2010 Steve Preston, Collier County Stormwater Management 1.0 WATER LEVEL READINGS 1.1 Instrumentation Water levels are recorded using stainless steel/titanium pressure transducer style dataloggers manufactured by In-Situ Inc., model Level Troll 500, with varying cable lengths according to the specific application and sensors operating in the 0 to 5 psig range. This sensor provides the maximum sensitivity needed to detect small differences in water depths and can read a maximum depth of 11.5 feet. The sensors are installed in a standard type piezometer in this case being a 2-inch PVC pipe to provide a stilling effect and for protection of the electronics from the elements. PVC pipes are slotted below the water surface to allow the sensor to be exposed to the entire head pressure of the surrounding water surface. Accuracy of the Level Troll gages are reported by the manufacturer to be 0.05% of the full scale (FS) range. This equates to an error of about feet of water based on a water depth of 11.5 feet. Typically, water depths are reported only to the nearest hundredth of a foot (0.01 ). Pressure sensors for the Level Troll 500 are of the silicon strain gage type with titanium sensor baffles. In addition to recording pressure, the Level Trolls also record temperature in either Celsius or Fahrenheit at an accuracy of 0.1º C and a resolution of 0.01º C. The Level Trolls are equipped with internal 3.6 volt lithium batters with an expected life of 5 years. The units can store a maximum of 50,000 records. At hourly intervals, this would equate to a time period of over 5 years. Typical raw data from the Level Trolls are by overflowing of the several bermed earthen control structures in the following form and easily converted to a standard comma delimited (CSV) or MS Excel (XLS) format for archiving and charting purposes. 1
7 Collier County (LASIP Hydrological Monitoring) June 20th, 2010 Steve Preston, Collier County Stormwater Management Table 1. Typical Raw Data From Level Troll 500 Sensor: Pres(G) 11.5ft Sensor: Pres(G) 11.5ft Sensor: Pres(G) 11.5ft Elapsed Time SN#: SN#: SN#: Date and Time Milliseconds Pressure (PSI) Temperature (F) Level Surface Elevation ( 3/19/ : /19/ : /19/ : /19/ : Typical installation schematics and photo for the Level Trolls are shown in the Figures section. 1.2 Recording Intervals The Level Trolls are programmed to record water levels at hourly increments. These are stored on the unit and downloaded to a handheld device or laptop computer at quarterly intervals. The hourly recording interval is an acceptable compromise between being overly sensitive and overly coarse. This study involves measuring water levels in water bodies subject to relatively rapid changes in water levels from rainfall or tidal influences. It is expected that hourly reading will provide sufficient resolution for future uses including flow calculations. Readings are not intended to be used for rainfall intensity analysis. 1.3 Data Downloading The Level Trolls are downloaded to a handheld device or laptop computer at quarterly intervals. This requires a field technician to visit the gage site and connect to the Level Troll utilizing a 9 pin serial style connector on a Rugged Reader handheld computer running Win-Situ software. The log file is copied to 2
8 Collier County (LASIP Hydrological Monitoring) June 20th, 2010 Steve Preston, Collier County Stormwater Management the Rugged Reader and returned to the office to be transferred to the in-house computer network system. Experience has shown that leaving data on the field units for extended periods of time results in data problems in several ways. For example, if a technician does not visit a site for an entire year, the gage may have failed or been vandalized shortly after the previous visit. This would result in the loss of an entire year s worth of data. 1.4 Methodology Once the Level Trolls are installed and properly secured and braced, they are programmed with a site name and recording interval. The gages have the ability to calculate, from the pressure sensor readings, either a water depth in decimal feet, or an actual water surface elevation to be included with the raw data in the log files. The latter option minimizes post download calculations. Benchmarks were run from nearby recognized survey points to the installation sites in order to carry actual water level information in with the pressure sensor readings to further facilitate the use of the data. Water levels are reported in this study in the vertical datum known as North American Vertical Datum of 1988 (NAVD 88). These water levels referenced to NAVD 1988 show directly when connected to the sensor allowing easy checks to be made with nearby staff gages. When downloads are made, the field technician also inspects the gage for visible damage, checks the time function of the gage against local watch time and performs a calibration verification check. This is accomplished by measuring down from the reference mark (RM) on the gage set by a previous survey benchmark run to the water surface. Subtracting this number from the RM elevation gives the water surface elevation (WSEL)in feet NAVD This is compared to the gage reading to assure that the gage is functioning properly. 3
9 Collier County (LASIP Hydrological Monitoring) June 20th, 2010 Steve Preston, Collier County Stormwater Management 2.0 STAFF GAGE READINGS 2.1 Methodology Water levels are manually read from staff gages during flow measurements or during data downloading. Additionally, Collier County personnel read and maintain water levels from staff gages taken during water quality sampling operations. Staff gages are made of a hard, durable plastic graduated in decimal feet capable of reading to the nearest hundredth of a foot (0.01 ). Staff gages are either mounted directly to the face of a structure, as in the case of the example photograph in the photograph appendix on page 4 under Piezometer JE 1531, or mounted to a pressure treated 4x4 post sunk into the canal bank slope and braced for stability. All staff gages were leveled to NAVD 1988 vertical datum and adjusted so that the water level read in the field represents the NAVD 88 elevation directly without a conversion. Readings are taken to the nearest hundredth of a foot, although during periods of high winds, turbulence, or waves, readings to the nearest hundredth of a foot are less reliable. To minimize cost and redundant readings, staff gage readings were limited to times when Johnson Engineering staff was downloading water level piezometer data. Water levels from other times can be taken directly from the piezometer data. Collier County staff also reads and records staff gage readings during water quality sampling events. That data is not a part of this report. The attached Table 2 shows staff gage readings taken during The period of record for staff gage readings is from March 2009 through December See Charts 3 through 7 for continuous water level elevations during this period. 4
10 Collier County (LASIP Hydrological Monitoring) June 20th, 2010 Steve Preston, Collier County Stormwater Management Table 2 - LASIP Staff Gages 2010 Gage Location Date Staff (feet) JE Gage ID Description NAVD 88) LELYSLU Main Lely Canal Outfall - Upstream 1/15/ JE 1529 LELYSLD Main Lely Canal Outfall - Downstream (Tidal) 1/15/ JE 1530 LMB00U US 41 Lely Manor West Canal - Upstream 1/15/ JE 1531 LMB00D US 41 Lely Manor West Canal - Downstream 1/15/ JE 1532 LMB01 Lely Major East Outfall 1/15/ JE 1533 LMB01ASLU South Spreader North Outfall - Upstream 1/15/ JE 1534 LMB01ASLD South Spreader North Outfall - Downstream 1/15/ JE 1535 LMB01SLU South Spreader South Outfall - Upstream 1/15/ JE 1536 LMB01SLD South Spreader South Outfall - Downstream 1/15/2010 Dry JE 1537 LELYSLU Main Lely Canal Outfall - Upstream 5/21/ JE 1529 LELYSLD Main Lely Canal Outfall - Downstream (Tidal) 5/21/ JE 1530 LMB00U US 41 Lely Manor West Canal - Upstream 5/21/ JE 1531 LMB00D US 41 Lely Manor West Canal - Downstream 5/21/ JE 1532 LMB01 Lely Major East Outfall 5/21/ JE 1533 LMB01ASLU South Spreader North Outfall - Upstream 5/21/ JE 1534 LMB01ASLD South Spreader North Outfall - Downstream 5/21/ JE 1535 LMB01SLU South Spreader South Outfall - Upstream 5/21/ JE 1536 LMB01SLD South Spreader South Outfall - Downstream 5/21/2010 Dry JE 1537 LELYSLU Main Lely Canal Outfall - Upstream 7/27/ JE 1529 LELYSLD Main Lely Canal Outfall - Downstream (Tidal) 7/27/ JE 1530 LMB00U US 41 Lely Manor West Canal - Upstream 7/27/ JE 1531 LMB00D US 41 Lely Manor West Canal - Downstream 7/27/ JE 1532 LMB01 Lely Major Easst Outfall 7/27/ JE 1533 LMB01ASLU South Spreader North Outfall - Upstream 7/27/ JE 1534 LMB01ASLD South Spreader North Outfall - Downstream 7/27/ JE 1535 LMB01SLU South Spreader South Outfall - Upstream 7/27/ JE 1536 LMB01SLD South Spreader South Outfall - Downstream 7/27/ JE 1537 LELYSLU Main Lely Canal Outfall - Upstream 10/12/ JE 1529 LELYSLD Main Lely Canal Outfall - Downstream (Tidal) 10/12/ JE 1530 LMB00U US 41 Lely Manor West Canal - Upstream 10/12/2010 WR JE 1531 LMB00D US 41 Lely Manor West Canal - Downstream 10/12/2010 WR JE 1532 LMB01 Lely Manor East Outfall 10/12/ JE 1533 LMB01ASLU South Spreader North Outfall - Upstream 10/12/ JE 1534 LMB01ASLD South Spreader North Outfall - Downstream 10/12/ JE 1535 LMB01SLU South Spreader South Outfall - Upstream 10/12/ JE 1536 LMB01SLD South Spreader South Outfall - Downstream 10/12/ JE 1537 LELYSLU Main Lely Canal Outfall - Upstream 11/12/ JE 1529 LELYSLD Main Lely Canal Outfall - Downstream (Tidal) 11/12/ JE 1530 LMB00U US 41 Lely Manor West Canal - Upstream 11/12/ JE 1531 LMB00D US 41 Lely Manor West Canal - Downstream 11/12/ JE
11 Collier County (LASIP Hydrological Monitoring) June 20th, 2010 Steve Preston, Collier County Stormwater Management LMB01 Lely Manor East Outfall 11/12/ JE 1533 LMB01ASLU South Spreader North Outfall - Upstream 11/12/ JE 1534 LMB01ASLD South Spreader North Outfall - Downstream 11/12/ JE 1535 LMB01SLU South Spreader South Outfall - Upstream 11/12/ JE 1536 LMB01SLD South Spreader South Outfall - Downstream 11/12/ JE 1537 Notes: 1. Locations are as shown on the aerial location map. 2. Readings are NAVD 1988 datum. 3. Refer to continuous water level charts for additional data. 6
12 Collier County (LASIP Hydrological Monitoring) June 20th, 2010 Steve Preston, Collier County Stormwater Management 3. FLOW MEASUREMENTS 3.1 Methodology Due to abnormally low rainfall during the season, the number of flow measurements was lower than expected. As shown in the attached Chart #1 for Rainfall at Rookery Bay, total rainfall received for the year was inches and some of the higher rainfalls were during the early season in June when the ground typically has more ability to absorb runoff. The net result was only one flow measuring event occurring on September 15, 2009, during which flows were measured at six different locations. See the attached Table 3 Flow Summary LASIP. Flow measurement field techniques are based on standard United States Geologic Survey (USGS) accepted procedures with modifications as needed to accommodate special local conditions such as very low velocities. Flow measurement types are either stream measurements, culvert measurements or weir (overflow berm) measurements. Stream discharge measurements are made by first determining the total flowing area at the flow station location. This is accomplished by stretching a rope from bank to bank, measuring off 10-foot increments and determining depth at each 10-foot interval. Velocities are also obtained at each 10-foot interval at two locations in the vertical profile: 20% of depth and 80% of depth. The sectional discharges are calculated according to USGS publication Discharge Measurements at Gaging Locations Chapter A8. Sectional discharges are summed to produce a total discharge in cubic feet per second (CFS). Velocities are determined by using a Price Open Cup meter connected to a calibrated digital readout device or by counting cup revolutions during a known time period. 7
13 Collier County (LASIP Hydrological Monitoring) June 20th, 2010 Steve Preston, Collier County Stormwater Management For shallow depths or very low velocities, the procedure is modified to use fluorescent dye moving a specified distance in the flow stream and using a stopwatch to time the distance traveled. The several overflow berms in the project present special and challenging conditions. One being the depth of flow can be very small, less than 0.1-feet deep. Another challenge is the construction of the long overflow berms, which by virtue of the construction techniques results in top elevations that can vary by several tenths of a foot over the length of the berm. So while a berm elevation may be listed on the permit as 1.78-feet NAVD, when water is actually at this elevation, there are likely to be some combination of flowing and non flowing areas of the overflow berm due to slight variations in top of berm elevations. Until water levels are significantly above the top of berm, 0.5-feet or more for example, calculations of discharge based on one upstream water depth are likely to yield inaccurate results. In the case of the measurements made on the September 15, 2009 date, the individual flowing areas were measured and separate depths determined, then the individual discharges were summed together to arrive at a total discharge. This will be normal behavior for the long overflow weir structures found at the south end of the Lely Main Canal, and the two overflow berms at the south end of the Lely Manor Canal. The Lely Main Canal outfall berm also has its own special conditions which complicate accurate discharge measurements. In addition to the varying top elevations described above, this berm is located in a tidal area and examination of the water level charts for this location will show occasional periods where periodic high tides produce downstream water levels that are higher than the berm elevation. This can results in reverse flow into the system, which has been observed, or reduced discharge due to downstream submergence. As the tide goes out, this effect is diminished and eliminated when the downstream elevation drops below the berm elevation. This will be an additional challenge when attempting to 8
14 Collier County (LASIP Hydrological Monitoring) June 20th, 2010 Steve Preston, Collier County Stormwater Management use water level gage information alone to calculate discharge from the system. During the test period, this has been mitigated by choosing a location upstream of the spreader swale in the main canal to determine velocities and calculate discharge. Culvert discharge measurements are accomplished by using the standard Price Open Cup meter at multiple locations normally at the upstream face of the flowing culvert. Velocities are obtained either by connection to a calibrated digital readout, or by manually counting revolutions during a specified time period and consulting the calibration chart provided by the manufacturer. The total flowing area at the culvert is determined by on site physical measurements including depth of mud at the culvert, if applicable. During periods of very low flows, the stream velocity may be insufficient to turn the cups of the meter. In this case, fluorescent dye is used and the time for the dye to travel a known distance is determined multiple times and averaged to produce a velocity. By this technique, flow measurements can be made with reasonable, but less, accuracy as the standard Price Open Cup method, but at far lower velocities. It is not unusual to have velocities below that required to turn the cups of the meter, but over a total flowing area large enough to produce significant and visually obvious flowing water. Other methodologies exist and can be used to determine very low stream velocities, such as particle velocities determined by doppler effect. 3.2 Results Data collected was insufficient to produce desired flow rating curves for each of the locations. Nonetheless, discharges in CFS were calculated for all locations on September 15, 2009 ranging from 8 CFS at the south Treviso Bay Spreader Swale to 114 CFS at the Lely Main Canal upstream of the spreader swale. See attached Table 3. 9
15 Collier County (LASIP Hydrological Monitoring) June 20th, 2010 Steve Preston, Collier County Stormwater Management Table 3. Flow Measurements through October 2010 FLOW SUMMARY LASIP Date ID Structure WSEL Flow Location NAVD88 CFS 9/15/2009 LELYSLU Open Channel Upstream of Lely Main canal Spreader Swale 9/15/2009 LELY Bridge Bridge at US 41 Lely Main Canal 9/15/2009 LMB00U Box Culvert Culvert Under US 41 North side Treviso Bay 9/15/2009 LMB01 Open Channel Lely Manor West Canal 9/15/2009 LMB01SLU Overflow Berm Treviso Bay Spreader Swale North Overflow 9/15/2009 LMB01ASLU Overflow Berm Treviso Bay Spreader Swale South Overflow 8/25/2010 LELYSLU Open Channel Upstream of Lely Main canal Spreader Swale 10/12/2010 LELYSLU Open Channel Upstream of Lely Main canal Spreader Swale 8/25/2010 LELY Bridge Bridge at US 41 Lely Main Canal 8/25/2010 LMB00U Box Culvert Culvert Under US 41 North side Treviso Bay 8/25/2010 LMB01 Open Channel Lely Manor West Canal 8/25/2010 LMB01SLU Overflow Berm Treviso Bay Spreader Swale North Overflow 8/25/2010 LMB01ASLU Overflow Berm Treviso Bay Spreader Swale South Overflow Notes: 1. Locations are as shown on the aerial location map. 2. Readings are NAVD 1988 datum. 10
16 Collier County (LASIP Hydrological Monitoring) June 20th, 2010 Steve Preston, Collier County Stormwater Management 4.0 RECOMMENDATIONS 1. Continue data collection for the remainder of the 2011 calendar year. Hourly stage readings, as currently being obtained, are sufficient resolution at all locations. 2. Obtain as many flow measurements as practical at all 8 locations during the remainder of 2011 to produce additional data points for a potential rating curve. Best results will be obtained when data points represent the full range of expected flow rates from low to high. 3. Staff gage face plates have developed a hard water scale that is making gage readings more difficult. We will attempt to scrape these off, but often this removes some of the gradations. Depending on how long these will need read, replacement of the plate sections in contact with the water should be considered. 11
17 FIGURES
18
19
20
21
22
23
24
25
26
27

28

29
30 MAP EXHIBITS


31

32

33


34
35
36 CHARTS
37 1-Jan Jan Jan Feb Feb Mar Mar-10 9-Apr Apr-10 7-May May-10 4-Jun Jun-10 2-Jul Jul Jul Aug Aug Sep Sep-10 8-Oct Oct-10 5-Nov Nov-10 3-Dec Dec Dec Rookery Bay SFWMD Rain Gage 2010 Max Rainfall 3.52" Occurred DATE RAINFALL TOTAL JAN 01, 2009 TO DEC 31, 2009 = 51.74" Chart 1 DAILY RAINFALL (inches)
38 1/20/1995 7/20/1995 1/20/1996 7/20/1996 1/20/1997 7/20/1997 1/20/1998 7/20/1998 1/20/1999 7/20/1999 1/20/2000 7/20/2000 1/20/2001 7/20/2001 1/20/2002 7/20/2002 1/20/2003 7/20/2003 1/20/2004 7/20/2004 1/20/2005 7/20/2005 1/20/2006 7/20/2006 1/20/2007 7/20/2007 1/20/2008 7/20/2008 1/20/2009 7/20/2009 1/20/2010 7/20/ Water level data from SFWMD DBHydro database Station:LELYUS41 Water Levels at LELY US41 Main Lely Canal Approximate roadway elevation at US 41 bridge Date Water Level Road Elv Berm Overflow Construction activities in progress Complete fall 2010 Approx Berm Elevation at Spreader Swale Chart 2 Stage Feet NAVD 1988
39 Lely Area Stormwater Improvement Plan 2010 Water Levels Lely Main Canal Spreader Swale 1-Jan Jan Jan Feb Feb Mar Mar-10 9-Apr Apr-10 7-May May-10 4-Jun Jun-10 2-Jul Jul Jul Aug Aug Sep Sep-10 8-Oct Oct-10 5-Nov Nov-10 3-Dec Dec Dec-10 LELYSLU and LELYSLD operational March 19, 2009 LELYSLD is under tidal influence Crest (Berm) Elev +/- 1.2 DATE LELYSLD - JE 1530 EG=-0.68 LELYSLU - JE 1529 EG=-2.5 Crest WSEL - NAVD 1988
40 Lely Area Stormwater Improvement Plan 2010 Water Levels Lely Manor Canal Spreader Swale South Outfall 1-Jan Jan Jan Feb Feb Mar Mar-10 9-Apr Apr-10 7-May May-10 4-Jun Jun-10 2-Jul Jul Jul Aug Aug Sep Sep-10 8-Oct Oct-10 5-Nov Nov-10 3-Dec Dec Dec-10 LMBLMB01A SLU and LMB01A SLD operational March 17, 2008 DATE Overflow Elev LMB01ASLU - JE 1536 EG=-2.7 LMB01ASLD - JE 1537 NG=+1.0 Overflow Elevation 1.78' WSEL - NAVD 1988
41 Lely Area Stormwater Improvement Plan 2010 Water Levels Lely Manor Canal Spreader Swale North Outfall 1-Jan Jan Jan Feb Feb Mar Mar-10 9-Apr Apr-10 7-May May-10 4-Jun Jun-10 2-Jul Jul Jul Aug Aug Sep Sep-10 8-Oct Oct-10 5-Nov Nov-10 3-Dec Dec Dec-10 LMBLMB01 SLU and LMB01 SLD operational March 17, 2008 Overflow Elev 1.74 DATE Overflow Elev LMB01SLU - JE 1534 EG=-1.8 LMB01SLD - JE 1535 NG=+1.0 WSEL - NAVD 1988
42 LMB00U and LMB00D operational March 18, 2008 Canal west of US 41 blocked for excavation after mid January. Some backpumping likley occurred during summer rains Lely Area Stormwater Improvement Plan 2010 Water Levels Lely Manor Canal West Outfall - US 41 LMB00U - JE 1531 EG=-0.90' LMB00D - JE 1532 EG=-0.68' Invert Elev Mud Elev Ceiling Elev Box Culvert Ceiling Elevation 2.00 WSEL - NAVD JE1532 out of service due to construction Canal Blocked west of US 41 Canal reopened Box Culvert Mud Elevation Box Culvert Invert Elevation Jan Jan Jan Feb Feb Mar Mar-10 9-Apr Apr-10 7-May May-10 4-Jun Jun-10 2-Jul Jul Jul Aug Aug Sep Sep-10 8-Oct Oct-10 5-Nov Nov-10 3-Dec Dec Dec-10 DATE
43 Lely Area Stormwater Improvement Plan 2010 Water Levels Lely Manor Canal LMB01 1-Jan Jan Jan Feb Feb Mar Mar-10 9-Apr Apr-10 7-May May-10 4-Jun Jun-10 2-Jul Jul Jul Aug Aug Sep Sep-10 8-Oct Oct-10 5-Nov Nov-10 3-Dec Dec Dec-10 LMB01 operational March 18, 2008 Upstream Pump Station in operation DATE LMB01 - JE 1533 EG=-1.65' WSEL - NAVD 1988
44 APPENDIX A SITE PHOTOGRAPHS
45 APPENDIX A Site Photographs A: LELY MAIN CANAL B: LELY MANOR CANAL WEST OUTFALL C: LELY MANOR CANAL C: LELY WEST CANAL D: FLOW PHOTOGRAPHS


46 Piezometer JE 1529 LELYSLU Photo #1 Looking southeast at piezometer location Photo #2 Close-up of piezometer and staff gage. 2


47 Piezometer JE 1530 LELYSLD Photo #1 Looking northwest at piezometer location Photo #2 Close-up of piezometer location. 3


48 Piezometer JE 1531 LMB00U Photo #1 Looking southerly at piezometer and staff gage location at US 41 Photo #2 Close-up of staff gage mounted on US 41 box culvert upstream side. 4


49 Piezometer JE 1532 LMB00D Photo #1 Looking east at piezometer location US 41 downstream Photo #2 Looking northeast at piezometer and staff gage location US 41 downstream 5


50 Piezometer JE 1533 LMB01 Photo #1 Looking east at piezometer and staff gage location Photo #2 Close-up of piezometer and staff gage location. 6


51 Piezometer JE 1534 LMB01SLU Photo #1 Looking north at piezometer and staff gage location Photo #2 Close-up of piezometer and staff gage. 7


52 Piezometer JE 1535 LMB01SLD Photo #1 Looking west at piezometer and staff gage location Photo #2 Close-up of piezometer and staff gage. 8


53 Piezometer JE 1536 LMB01ASLU Photo #1 Looking north at piezometer location Photo #2 Close-up of ppiezometer location. 9


54 Piezometer JE 1537 LMB01ASLD Photo #1 Looking east at piezometer and staff gage location Photo #2 Close-up of piezometer and staff gage. 10


55 Piezometer LMBOOSLU Photo #1 Looking north at piezometer and staff gage location Photo #2 Close-up of piezometer and staff gage. 11

56 Piezometer LMBOOSLD Photo #1 Looking south at piezometer and staff gage location 12


57 Flow measuring equipment in Lely Main Canal near JE 1529 on 9/15/09 Measuring flow at Lely Main Canal near JE 1529 on 9/15/09 Flow measurement station Lely Main Canal near JE


58 Flow across spreader lake outfall berm in Lely Main Canal 9/15/09 near JE Flow is from left to right (NE to SW) Flow across spreader lake outfall berm in Lely Manor Canal 9/15/09 near JE Flow is from right to left (N to S) 14


59 Flow across spreader lake outfall berm in Lely Manor Canal 9/15/09 near JE Flow is from right to left (E to W) Depth of flow on outfall berm in Lely Manor Canal 9/15/09 near JE Flow is from right to left (E to W) 15
.")

60 Flow across spreader lake outfall berm in Lely Main Canal 9/15/09 near JE Flow is from right to left (NE to SW). Note the uneven flow pattern that occurs when the water level is very close to the crest elvation. Pygmy style Price Open Cup Flowmeter with output display meter 16
LELY AREA STORMWATER IMPROVEMENT PROGRAM (LASIP) STAGE AND FLOW SUMMARY
 STAGE AND FLOW SUMMARY") LELY AREA STORMWATER IMPROVEMENT PROGRAM (LASIP) STAGE AND FLOW SUMMARY 2009 Activity Report Prepared for: Collier County Stormwater Management Department Prepared by: Johnson Engineering, Inc. 2350 Stanford
LELY AREA STORMWATER IMPROVEMENT PROGRAM (LASIP) STAGE AND FLOW SUMMARY 2009 Activity Report Prepared for: Collier County Stormwater Management Department Prepared by: Johnson Engineering, Inc. 2350 Stanford
Cokato Lake (86-263) Wright County. Hydrologic Investigation
 Wright County. Hydrologic Investigation") Cokato Lake (86-263) Wright County Hydrologic Investigation April 14, 2005 Cokato Lake (86-263) Wright County Hydrologic Investigation April 14, 2005 Problem Statement In recent years, heavy rainfall has
Cokato Lake (86-263) Wright County Hydrologic Investigation April 14, 2005 Cokato Lake (86-263) Wright County Hydrologic Investigation April 14, 2005 Problem Statement In recent years, heavy rainfall has
Exhibit A. Scope of Services for Flow Monitoring Program 2015 Flow Monitoring City of Lawrence, Kansas
 Exhibit A Scope of Services for Flow Monitoring Program 2015 Flow Monitoring City of Lawrence, Kansas Intent and Purpose The City of Lawrence has begun a Rapid Inflow and Infiltration (I/I) Reduction Program.
PEACE RIVER MANASOTA REGIONAL WATER SUPPLY AUTHORITY BOARD OF DIRECTORS MEETING December 5, 2018 ROUTINE STATUS REPORTS ITEM 1
 PEACE RIVER MANASOTA REGIONAL WATER SUPPLY AUTHORITY BOARD OF DIRECTORS MEETING December 5, 218 ROUTINE STATUS REPORTS ITEM 1 Hydrologic Conditions Report MEMORANDUM Project: Hydrologic Conditions Report
IMPROVED WATER RESOURCE MANAGEMENT USING AN ACOUSTIC PULSED DOPPLER SENSOR IN A SHALLOW OPEN CHANNEL
 IMPROVED WATER RESOURCE MANAGEMENT USING AN ACOUSTIC PULSED DOPPLER SENSOR IN A SHALLOW OPEN CHANNEL Mike Cook 1, PhD Craig Huhta 1 SonTek/YSI Inc., San Diego, California, USA Abstract. Over the years
This is a digital document from the collections of the Wyoming Water Resources Data System (WRDS) Library.
 Library.") This is a digital document from the collections of the Wyoming Water Resources Data System (WRDS) Library. For additional information about this document and the document conversion process, please contact
This is a digital document from the collections of the Wyoming Water Resources Data System (WRDS) Library. For additional information about this document and the document conversion process, please contact
Draft Application for New License for Major Water Power Project Existing Dam
 Draft Application for New License for Major Water Power Project Existing Dam Northfield Project Northfield Mountain Pumped Storage Project (FERC Project Number 2485) Turners Falls Hydroelectric Project
San Antonio Water System Mitchell Lake Constructed Wetlands Below the Dam Preliminary Hydrologic Analysis
 San Antonio Water System enhancement. This recommendation was based on limited water quality data provided by SAWS and using a free-water surface constructed wetland with approximately 112 acres of wetted
Calibration of Hydrologic Design Inputs for a Small Urban Watershed
 Research Project Proposal for Johnson County Stormwater Management Program and City of Overland Park, Kansas Calibration of Hydrologic Design Inputs for a Small Urban Watershed Bruce M. McEnroe & C. Bryan
NEW CASTLE CONSERVATION DISTRICT. through. (Name of Municipality) PLAN REVIEW APPLICATION DRAINAGE, STORMWATER MANAGEMENT, EROSION & SEDIMENT CONTROL
 PLAN REVIEW APPLICATION DRAINAGE, STORMWATER MANAGEMENT, EROSION & SEDIMENT CONTROL") NEW CASTLE CONSERVATION DISTRICT through (Name of Municipality) PLAN REVIEW APPLICATION DRAINAGE, STORMWATER MANAGEMENT, EROSION & SEDIMENT CONTROL Office use only: Received by Municipality: Received by
NEW CASTLE CONSERVATION DISTRICT through (Name of Municipality) PLAN REVIEW APPLICATION DRAINAGE, STORMWATER MANAGEMENT, EROSION & SEDIMENT CONTROL Office use only: Received by Municipality: Received by
Basic Design of Replogle Flumes
 ITRC Report No. R 02-010 IRRIGATION TRAINING AND RESEARCH CENTER California Polytechnic State University San Luis Obispo, California 93407 www.itrc.org Basic Design of Replogle Flumes Replogle flumes are
Song Lake Water Budget
 Song Lake Water Budget Song Lake is located in northern Cortland County. It is a relatively small lake, with a surface area of about 115 acres, and an average depth of about 14 feet. Its maximum depth
LOXAHATCHEE RIVER WATER QUALITY EVENT SAMPLING TASK 2: FINAL REPORT ASSESSMENT OF LOXAHATCHEE RIVER WATER QUALITY
 LOXAHATCHEE RIVER WATER QUALITY EVENT SAMPLING TASK 2: FINAL REPORT ASSESSMENT OF 2007-2008 LOXAHATCHEE RIVER WATER QUALITY In Partial Fulfillment of Agreement No. 4600001281 For the Period October 2007
Development of Stage-Discharge Ratings for Site 2240 Bear Creek at Cold Spring
 Development of Stage-Discharge Ratings for Site 2240 Bear Creek at Cold Spring Prepared for: Urban Drainage and Flood Control District 2480 W. 26 th Avenue Suite 156-B Denver, CO 80211 May 19, 2006 (Rev
Technical Memorandum
 Tucson Office 3031 West Ina Road Tucson, AZ 85741 Tel 520.297.7723 Fax 520.297.7724 www.tetratech.com Technical Memorandum To: Kathy Arnold From: Greg Hemmen, P.E. Company: Rosemont Copper Company Date:
Settlement Agreement Report
 Settlement Agreement Report Fourth Quarter October December 2010 Prepared for the Technical Oversight Committee February 15, 2011 Prepared by: Cheol Mo, Violeta Ciuca, and Stuart Van Horn Restoration Sciences
PEARCE CREEK CONFINED DISPOSAL AREA MODIFICATION
 US Army Corps of Engineers Philadelphia District PEARCE CREEK CONFINED DISPOSAL AREA MODIFICATION CECIL COUNTY MARYLAND STORMWATER MANAGEMENT PLAN NARRATIVE INITIAL SUBMISSION JUNE 2014 1 PEARCE CREEK
Flow Measurement Structure Assessment
 Flow Measurement Structure Assessment Report prepared for the Richmond Irrigation District by Eric Leigh, Milton Henry, and Guy Fipps 1 June 2, 2003 Summary Extension Agricultural Engineering investigated
Water Measurement Options in Low-Head Canals and Ditches
 Water Measurement Options in Low-Head Canals and Ditches by F. Jeffrey Peterson, P.E. Water Conservation Center Pacific Northwest Region Bureau of Reclamation Boise, Idaho September 2003 Measuring water
ANNUAL PLATTE RIVER SURFACE WATER FLOW SUMMARY
 ANNUAL PLATTE RIVER SURFACE WATER FLOW SUMMARY 4/3/213 Platte River Recovery Implementation Program 213 ANNUAL SURFACE WATER FLOW SUMMARY DRAFT Prepared by staff of the Platte River Recovery Implementation
Introduction to Storm Sewer Design
 A SunCam online continuing education course Introduction to Storm Sewer Design by David F. Carter Introduction Storm sewer systems are vital in collection and conveyance of stormwater from the upstream
November 28, Dear Mr. Bechtold:
 4000 Hollywood Boulevard Seventh Floor, North Tower Hollywood, Florida 33021 (954) 987-0066 Fax: (954) 987-2949 November 28, 2012 Wastewater Compliance and Enforcement Section FLORIDA DEPARTMENT OF ENVIRONMENTAL
Reservoir on the Rio Boba
 Reservoir on the Rio Boba Michael J. Burns II Guillermo Bustamante J. James Peterson Executive Summary The National Institute of Water Resources in the Dominican Republic (INDRHI) plans to construct a
DRAFT MEMORANDUM DATE:
 DRAFT MEMORANDUM DATE: June 30, 2014 TO: Mariel Platt, City of Hailey FROM: Scott King, P.E., Cathy Cooper, P.E. CC: Cole Balis, Brandon Lynch, Roxanne Brown, Eric Landsberg, P.E. RE: City of Hailey, Indian
2003 Water Quality Monitoring Report
 23 Water Quality Monitoring Report Prepared for Clearwater River Watershed District January 24 23 Water Quality Monitoring Report File #2-58 Prepared for: CLEARWATER RIVER WATERSHED DISTRICT Box 276 Annandale,
LOWER SWEETWATER CREEK
 LOWER SWEETWATER CREEK STORMWATER MANAGEMENT MASTER PLAN Prepared for the Hillsborough County Board of County Commissioners By Public Works Department/Engineering Division Stormwater Management Section
HYDROMETRIC DATA SUMMARY UPPER CHASE CREEK AND CHARCOAL CREEK Annual Report
 HYDROMETRIC DATA SUMMARY For UPPER CHASE CREEK AND CHARCOAL CREEK 2004 Annual Report Prepared for RIVERSIDE FOREST PRODUCTS LIMITED by DOBSON ENGINEERING LTD. #4, 1960 Springfield Road Kelowna, BC V1Y
Prepared for: City of Jeffersonville. November Prepared by
 JEFFERSONVILLE STORMWATER MASTER PLAN HYDRAULICS APPENDIX JEFFERSONVILLE, INDIANA Prepared for: City of Jeffersonville November 2011 Prepared by Christopher B. Burke Engineering, Ltd. 115 W. Washington
Common Pitfalls in BMP Selection and Implementation. 19 th Annual Southeastern Lakes Management Conference Winston-Salem, NC
 Common Pitfalls in BMP Selection and Implementation 19 th Annual Southeastern Lakes Management Conference Winston-Salem, NC Harvey H. Harper, Ph.D., P.E. Environmental Research & Design, Inc. Introduction
Detention Pond Design Considering Varying Design Storms. Receiving Water Effects of Water Pollutant Discharges
 Detention Pond Design Considering Varying Design Storms Land Development Results in Increased Peak Flow Rates and Runoff Volumes Developed area Robert Pitt Department of Civil, Construction and Environmental
DRAFT. Technical Memorandum. Whitney Road Drainage & Safety Enhancements Phase III Hydraulic Update. Prepared For:
 DRAFT Technical Memorandum Whitney Road Drainage & Safety Enhancements Phase III Hydraulic Update Prepared For: Pinellas County Department of Environment and Infrastructure Division of Engineering and
Seepage Losses for the Rio Grande Project (Franklin Canal Case Study)
") Seepage Losses for the Rio Grande Project (Franklin Canal Case Study) Zhuping Sheng, Ph.D., P.E. Yaqi Wanyan, M.S., EIT Luis S. Aristizabal Kadambari Reddy, M.S., EIT TAMU, Agricultural Research and Extension
Seepage Losses for the Rio Grande Project (Franklin Canal Case Study) Zhuping Sheng, Ph.D., P.E. Yaqi Wanyan, M.S., EIT Luis S. Aristizabal Kadambari Reddy, M.S., EIT TAMU, Agricultural Research and Extension
Appendix C Data Collection Protocols
 INTEGRATED REGIONAL GROUNDWATER MANAGEMENT PLAN Appendix C Data Collection Protocols STANISLAUS & TUOLUMNE RIVERS GROUNDWATER BASIN ASSOCIATION GROUNDWATER MONITORING PROTOCOL FOR MEASURING STATIC GROUNDWATER
BAKER RIVER PROJECT DRAFT WATER QUALITY MONITORING PLAN
 BAKER RIVER PROJECT DRAFT WATER QUALITY MONITORING PLAN Prepared by Puget Sound Energy P.O. Box 97034 Bellevue, WA 98009-9734 March 10, 2009 TABLE OF CONTENTS Page 1.0 INTRODUCTION... 1 1.1 Background...
Camp Far West Hydroelectric Project Relicensing
 Camp Far West Hydroelectric Project Relicensing Water Operations Model FERC Project No. 2997 July 16, 2018 Overview Project and South Sutter Water District overview Operations model Overview Model Updates
Conservation through calibration and communication
 Water Resources Management V 65 Conservation through calibration and communication B. P. Tullis & S. L. Barfuss Utah State University, USA Abstract To effectively manage a water resource, one must be able
2002 Water Quality Monitoring Report
 22 Water Quality Monitoring Report Wenck File #2-49 Prepared for: CLEARWATER RIVER WATERSHED DISTRICT Box 276 Annandale, MN 55389 Prepared by: WENCK ASSOCIATES, INC. 18 Pioneer Creek Center P.O. Box 249
Little Cypress Bayou Special Study - Subwatershed 1.10
 - Subwatershed 1.1 Sabine River Authority of Texas August 31, 21 Prepared in Cooperation with the Texas Natural Resource Conservation Commission Under the Authorization of the Texas Clean Rivers Act Table
Warm Springs Hydro LLC 5203 South 11 th East Idaho Falls, ID
 Warm Springs Hydro LLC 5203 South 11 th East Idaho Falls, ID 83404 208-522-8069 ted@tsorenson.net September 26, 2013 Elizabeth A.O. Moats Oregon Department of Fish and Wildlife 107 20 th Street La Grande,
Flow Measurement for Structure Assessment in Richmond Irrigation District
 COLLEGE OF AGRICULTURE AND LIFE SCIENCES TR-379 2011 Flow Measurement for Structure Assessment in Richmond Irrigation District By: Eric Leigh, Extension Associate; Milton Henry, Graduate Assistant; and
Embedded Energy in Water Studies Study 1: Statewide and Regional Water-Energy Relationship
 Embedded Energy in Water Studies Study 1: Statewide and Regional Water-Energy Relationship Prepared by GEI Consultants/Navigant Consulting, Inc. Prepared for the California Public Utilities Commission
U. S. FOREST SERVICE RESEARCH NOTE NE-29
 U. S. FOREST SERVICE RESEARCH NOTE NE-29 1965 ACCURACY IN STREAMFLOW MEASUREMENTS ON THE FERNOW EXPERIMENTAL FOREST Measurement of streamflow from small watersheds on the Fernow Experimental Forest at
Outline. Regional Overview Mine Study Area. Transportation Corridor Study Area. Streamflow Low Flow Peak Flow Snow Small Pools.
 Environmental Baseline Document Surface Water Hydrology Agency Meetings, January 31 to February 3, 2012 Anchorage, Alaska Jaime Cathcart, P.Eng., Ph.D. Outline 2 Regional Overview Mine Study Area Streamflow
Solutions Manual Water Supply and Pollution Control Eighth Edition
 Water Supply and Pollution Control Eighth Edition Warren Viessman, Jr., P.E. University of Florida Mark J. Hammer, Emeritus Engineer Lincoln, Nebraska Elizabeth M. Perez, P.E. Palm Beach Gardens, Florida
INITIAL RUN-ON AND RUN-OFF CONTROL PLAN 40 C.F.R. PART 257
 INITIAL RUN-ON AND RUN-OFF CONTROL PLAN 40 C.F.R. PART 257.81 HUFFAKER ROAD (PLANT HAMMOND) PRIVATE INDUSTRIAL LANDFILL (HUFFAKER ROAD LANDFILL) GEORGIA POWER COMPANY EPA s Disposal of Coal Combustion
San Mateo Plain Groundwater Basin Assessment Stakeholder Workshop #7 9 NOVEMBER 2017
 San Mateo Plain Groundwater Basin Assessment Stakeholder Workshop #7 9 NOVEMBER 2017 PRESENTATION OVERVIEW Introductions Project Overview Stakeholder Outreach Summary Phase 2 Updates Modeling Activities
Exploring the Possibilities At Prado Dam
 Exploring the Possibilities At Prado Dam Greg Woodside, P.G., C.HG. Executive Director of Planning & Natural Resources December 5, 2017 The Orange County groundwater basin lies at the base of the Santa
Assessing Real Time - Drainage Water Management
 Assessing Real Time - Drainage Water Management Jim Klang, PE Kieser & Associates, LLC 536 East Michigan Ave / Suite 300, Kalamazoo, MI 49007 (269) 344-7117 Photo Credit: Purdue Engineering Today s Talk
List of Appendices APPENDIX A: WY 2000 LAKE MICHIGAN DIVERSION ACCOUNTING REPORT APPENDIX B: WY 2001 LAKE MICHIGAN DIVERSION ACCOUNTING REPORT
 EXECUTIVE SUMMARY This document is the Water Year (WY) 2000 Annual Report of the Chicago District, U. S. Army Corps of Engineers activities in the monitoring and review of the accounting of Lake Michigan
APPENDIX G HYDRAULIC GRADE LINE
 Storm Drainage 13-G-1 APPENDIX G HYDRAULIC GRADE LINE 1.0 Introduction The hydraulic grade line is used to aid the designer in determining the acceptability of a proposed or evaluation of an existing storm
Water Measurement. Presentation by. L. Niel Allen Extension Irrigation Specialist Utah State University
 Water Measurement Presentation by L. Niel Allen Extension Irrigation Specialist Utah State University to Utah State Engineer s Office Division of Water Rights Salt Lake City, Utah December 11, 2013 Introduction
Monitoring Networks for Assessing Small Stream Hydropower Potential, Cosmos Hills, Alaska
 Monitoring Networks for Assessing Small Stream Hydropower Potential, Cosmos Hills, Alaska Michael Lilly, Jeffrey Derry, Austin McHugh, Jeff Murray Geo-Watersheds Scientific David Brailey Brailey Hydrologic
Development of a Stage-Discharge Rating for Site Van Bibber Creek at Route 93
 Development of a Stage-Discharge Rating for Site 330 - Van Bibber Creek at Route 93 Prepared for: Urban Drainage and Flood Control District 2480 W. 26 th Avenue Suite 156-B Denver, CO 80211 May 19, 2006
To: From: Date: Subject: Sherwood Lakes Drainage Alternatives Analysis 1
 To: From: The City of Virginia Beach Lewis White and Rachael Johnson on behalf of WSP Date: June 6, 2017 Subject: s Drainage Alternatives Analysis This memorandum represents the summary of findings from
EFFECT OF RAINGAGE DENSITY ON RUNOFF SIMULATION MODELING by ABSTRACT
 EFFECT OF RAINGAGE DENSITY ON RUNOFF SIMULATION MODELING by Ben Urbonas, P.E., D.WRE 1, Michael Paul Jansekok 2, James C.Y. Guo, PhD, P.E. 3 ABSTRACT Rainfall and runoff data for a 3.08 square mile urban
Annex 5 - Hydropower Model Vakhsh
 Annex 5 - Hydropower Model Vakhsh 1. The Vakhsh Cascade The construction of dams on the Vakhsh River started in the late 1950s with the construction of the Perepadnaya diversion and power station. Until
Relicensing Study 3.8.1
 Relicensing Study 3.8.1 Evaluate the Impact of Current and Potential Future Modes of Operation on Flow, Water Elevation and Hydropower Generation Study Report Northfield Mountain Pumped Storage Project
City of Moss Landing, CA Sanitary Sewer Flow Monitoring SFE File #C Installation Report. Submitted To:
 City of Moss Landing, CA Sanitary Sewer Flow Monitoring SFE File #C91-01 Installation Report Submitted To: MBARI Attention: Mr. Keith Raybould 7700 Sandholdt Rd Moss Landing, CA 95039-9644 Submitted By:
Surface Water Supplies
 Status Report: Salinas Valley Ground Water and SVWP UCCE Irrigation and Nutrient Management Meeting February 24, 2009 Presentation Salinas Valley Ground Water Where does ground water come from? Ground-water
Peace Country Technical Services Ltd.
 Peace Country Technical Services Ltd. 948 100 th Avenue Dawson Creek, BC V1G 1W3 Phone: 250-782-6463 Fax: 250-782-6466 E-mail: bjortman@telus.net January 8, 2015 City of Dawson Creek Box 150 Dawson Creek,
FISHER RIVER INTEGRATED WATERSHED MANAGEMENT PLAN STATE OF THE WATERSHED REPORT CONTRIBUTION SURFACE WATER HYDROLOGY REPORT
 FISHER RIVER INTEGRATED WATERSHED MANAGEMENT PLAN STATE OF THE WATERSHED REPORT CONTRIBUTION SURFACE WATER HYDROLOGY REPORT Disclaimer: The hydrologic conditions presented in this report are estimates
Jacobi, Toombs, and Lanz, Inc.
 Area 5: Blackiston Mill Road at Dead Man's Hollow Flooding Assessment Jacobi, Toombs, and Lanz, Inc. This document summarizes an assessment of drainage and flooding concerns and provides recommendations
Wastewater Flow Monitoring Services
 Wastewater Flow Monitoring Services For San Gabriel, CA July 13, 2015 through July 21, 2015 Revised October 9, 2015 Leaders in Sewer Flow Monitoring Services 601 N. Parkcenter Dr., Suite 209 Santa Ana,
APPENDIX A. Hydraulic Investigations: Cascade Mall at Burlington
 APPENDIX A m SUMMARY REPORT FOR E.I.S. Hydraulic Investigations: Cascade Mall at Burlington July 12, 1982 John E. Norman, P.E. 14779 Northeast 32nd, #A201 Bellevue, WA 98007 (206) 882-1767 92 General A
Instrumentation and Process Control
 Instrumentation and Process Control Topics Covered Critical Monitoring Leachate collection system performance Moisture measurement In-place specific weight Critical Monitoring - Gas Production Rate Gas
Modified Water Deliveries G-3273/S-356 Increment 2 Field Test
 Modified Water Deliveries G-3273/S-356 Increment 2 Field Test Kick Off Meeting Teleconference/WebMeeting Jacksonville District, Everglades National Park South Florida Water Management District June 21,
HYDROLOGIC MONITORING OF THE SEATTLE ULTRA-URBAN STORMWATER MANAGEMENT PROJECTS
 Department of Civil and Environmental Engineering University of Washington Seattle, Washington 98195 HYDROLOGIC MONITORING OF THE SEATTLE ULTRA-URBAN STORMWATER MANAGEMENT PROJECTS by Richard R. Horner
Salinity TMDL Development and Modeling in the Otter Creek Watershed. Erik Makus DEQ Hydrologist June 6, 2013
 Salinity TMDL Development and Modeling in the Otter Creek Watershed 1 Erik Makus DEQ Hydrologist June 6, 2013 Outline for Today: Otter Creek and the Tongue River Previous salinity modeling efforts Existing
Texas Watch Volunteer Water Quality Monitoring Program 2006 Mary s Creek Data Summary
 Texas Watch Volunteer Water Quality Monitoring Program 26 Mary s Creek Data Summary Narrative Summary of Mary s Creek Mary s Creek is an unclassified, perennial stream flowing 6 miles southwest from Pearland,
INFLOW DESIGN FLOOD CONTROL SYSTEM PLAN PLANT GASTON GYPSUM POND ALABAMA POWER COMPANY
 INFLOW DESIGN FLOOD CONTROL SYSTEM PLAN PLANT GASTON GYPSUM POND ALABAMA POWER COMPANY Section 257.82 of EPA s regulations requires the owner or operator of an existing or new CCR surface impoundment or
TOTAL SUSPENDED SOLIDS REMOVAL TEST OF A HIGH DENSITY POLYETHYLENE WATER QUALITY UNIT. By James T. Mailloux Dean K. White
 TOTAL SUSPENDED SOLIDS REMOVAL TEST OF A HIGH DENSITY POLYETHYLENE WATER QUALITY UNIT By James T. Mailloux Dean K. White Submitted to ADVANCED DRAINAGE SYSTEMS 250-04/H1098F September 2004 TOTAL SUSPENDED
Submittal Requirements. Post Construction Verification Document Plan Requirements
 Submittal Requirements Post Construction Verification Document survey plan in accordance with the items of this Checklist Supporting calculations in accordance with the items of this Checklist A copy of
Irrigation modeling in Prairie Ronde Township, Kalamazoo County. SW Michigan Water Resources Council meeting May 15, 2012
 Irrigation modeling in Prairie Ronde Township, Kalamazoo County SW Michigan Water Resources Council meeting May 15, 2012 Development of a Groundwater Flow Model INFLOWS Areal recharge from precipitation
Portland Water System & PUMA. Lorna Stickel & David Evonuk Resource Protection & Engineering Work Groups
 Portland Water System & PUMA Lorna Stickel & David Evonuk Resource Protection & Engineering Work Groups Presentation Overview 1. Background on Portland System 2. Hydrologic tools used to model our water
Considerations In Estimating Tailwater Elevations
 Considerations In Estimating Tailwater Elevations by Alphonse (Al) J. Stewart, P.E., President www.suncam.com Page 1 of 39 ************************************************************************ This
This is a digital document from the collections of the Wyoming Water Resources Data System (WRDS) Library.
 Library.") This is a digital document from the collections of the Wyoming Water Resources Data System (WRDS) Library. For additional information about this document and the document conversion process, please contact
This is a digital document from the collections of the Wyoming Water Resources Data System (WRDS) Library. For additional information about this document and the document conversion process, please contact
Stormwater Erosion Control & Post-Construction Plans (Stormwater Quality Plans)
") Stormwater Erosion Control & Post-Construction Plans (Stormwater Quality Plans) Allen County Stormwater Plan Submittal Checklist The following items must be provided when applying for an Allen County Stormwater
Stormwater Erosion Control & Post-Construction Plans (Stormwater Quality Plans) Allen County Stormwater Plan Submittal Checklist The following items must be provided when applying for an Allen County Stormwater
An Investigation into the 2012 drought on Apalachicola River. Steve Leitman, Bill Pine and Greg Kiker
 An Investigation into the 2012 drought on Apalachicola River Steve Leitman, Bill Pine and Greg Kiker Apalachicola-Chattahoochee-Flint (ACF) River basin 20,400 sq. mi. One of the most actively disputed
REFINING FLOW RESTORATION TO WORK WITH THE LANDSCAPE
 REFINING FLOW RESTORATION TO WORK WITH THE LANDSCAPE Walter Wilcox, Fahmida Khatun, Wasantha Lal, M. Clay Brown and Colin Saunders Greater Everglades Ecosystem Restoration Conference April 18-20, 2017
Lake Okeechobee Operations and Blue-Green Algae Update
 Lake Okeechobee Operations and Blue-Green Algae Update Lawrence Glenn Section Administrator, Lakes and River Section South Florida Water Management District Palm Beach County WRTF Meeting October 20, 2016
Appendix F: Additional Atrazine Analyses
 Appendix F: Additional Atrazine Analyses Final Report Contents F-1 Atrazine Maximum Daily Limit Calculation... F-2 F-2 Atrazine and Gage Discharge... F-3 F-2.1 Spring and Summer 2004... F-5 F-2.2 Spring
Technical Memorandum. Hydraulic Analysis Smith House Flood Stages. 1.0 Introduction
 Technical Memorandum Hydraulic Analysis Smith House Flood Stages 1.0 Introduction Pacific International Engineering (PIE) performed a hydraulic analysis to estimate the water surface elevations of the
Chapter 3 Stream Discharge
 Chapter 3 Stream Discharge - Introductory Level Volunteer Water Quality Monitoring Training Notebook - What is Discharge (Flow)? Discharge, also called flow, is the amount of water that flows past a given
AGENDA DATE: November 14, 2018
 ALAMEDA COUNTY FLOOD CONTROL AND WATER CONSERVATION DISTRICT, ZONE 7 100 NORTH CANYONS PARKWAY, LIVERMORE, CA 94551 PHONE (925) 454-5000 FAX (925) 454-5727 ORIGINATING SECTION: INTEGRATED PLANNING CONTACT:
Electric Forward Market Report
 Mar-01 Mar-02 Jun-02 Sep-02 Dec-02 Mar-03 Jun-03 Sep-03 Dec-03 Mar-04 Jun-04 Sep-04 Dec-04 Mar-05 May-05 Aug-05 Nov-05 Feb-06 Jun-06 Sep-06 Dec-06 Mar-07 Jun-07 Sep-07 Dec-07 Apr-08 Jun-08 Sep-08 Dec-08
Sustainable Stormwater Management: Validating Water Quality and Quantity
 Sustainable Stormwater Management: Validating Water Quality and Quantity Progress Report from University of Virginia November 12, 2008 UVA Undergraduate Student Participants Andrew T. Smith Civil & Environmental
CLARIFICATIONS TO TECHNICAL SPECIFICATIONS SECTIONS
 C-44 Reservoir/STA System Discharge Project RFB: 6000000620 Addendum No. 1 March 2014 CLARIFICATIONS TO TECHNICAL SPECIFICATIONS SECTIONS HDR Engineering, Inc. SECTION 02401 DEWATERING, COFFERDAM AND BYPASS
Administration Division Public Works Department Anchorage: Performance. Value. Results.
 Administration Division Anchorage: Performance. Value. Results. Mission Provide administrative, budgetary, fiscal, and personnel support to ensure departmental compliance with Municipal policies and procedures,
CCR Rule Annual Inspection Report 2
 Inspection Description An ARCADIS team performed the Trimble County Gypsum Storage Pond (GSP) 2015 annual inspection by a qualified professional engineer. The overall goal of the inspection was to ensure
Report for 2001SD1941B: Alternative Conservation Practices to Improve Soil and Water Quality
 Report for 2001SD1941B: Alternative Conservation Practices to Improve Soil and Water Quality Other Publications: Kathol, John. 2002. Using a Precipitation-Runoff Model to Predict Runoff for Frequency Based
Domestic Self-Supply and Private Landscape Irrigation Wells
 Domestic Self-Supply and Private Landscape Irrigation Wells Richard L Marella and Darbi R Berry U.S. Geological Survey Florida Water Science Center & Stacie Greco Alachua County Environmental Protection
Gain-Loss Study of Lower San Pedro Creek and the San Antonio River, San Antonio, Texas, May October 1999
 In cooperation with the U.S. Air Force, Air Logistics Center, Kelly Air Force Base, Environmental Management Office Gain-Loss Study of Lower San Pedro Creek and the San Antonio River, San Antonio, Texas,
Chapter 5 Hydraulic Structures
 Chapter 5 Hydraulic Structures 5.1 Flow Splitter Designs 5.1.1 General Design Criteria A flow splitter must be designed to deliver the WQ design flow rate specified in this volume to the WQ treatment facility.
Regional Hydraulic Model Plan
 APPENDIX 3 Regional Hydraulic Model Plan November 17, 2008 Contents Section 1 Introduction Section 2 Model Objectives and Capabilities 2.1 Model Software Capabilities... 2-1 Section 3 Model Development
Illinois in Drought. June 19, 2012, Updated June 21, 2012
 June 19,, Updated June 21, Illinois in Drought The ISWS now considers central and southern Illinois to be fully in drought based on several impacts including the early season onset of reservoir drawdown
John H. Kerr Dam and Reservoir Virginia and North Carolina (Section 216)
") John H. Kerr Dam and Reservoir Virginia and North Carolina (Section 216) Wilmington District, Corps of Engineers Stakeholder Update Presentation January 24, 2014 Authorized under Section 216 of Public
John H. Kerr Dam and Reservoir Virginia and North Carolina (Section 216) Wilmington District, Corps of Engineers Stakeholder Update Presentation January 24, 2014 Authorized under Section 216 of Public
Technical Study #2: Evaluation of North Delta Migration Corridors: Yolo Bypass
 Draft Technical Memorandum Technical Study #2: Evaluation of North Delta Migration Corridors: Yolo Bypass Prepared for Bay Delta Conservation Plan Integration Team Updated April 29 SDO/TS#2 NORTH DELTA
Application for a Dam Permit Ash Basin No. 1
 Application for a Dam Permit Ash Basin No. 1 for the Sunbury Generating Station Shamokin Dam, Pennsylvania submitted to Commonwealth of Pennsylvania Department of Environmental Protection Bureau of Waterways
Stormwater Local Design Manual For Houston County, Georgia
 Stormwater Local Design Manual For Houston County, Georgia Adopted November 15, 2005 TABLE OF CONTENTS 1. FORWARD... 1 2. GENERAL LEVEL OF SERVICE STANDARDS... 2 2.1. DETENTION REQUIREMENTS... 2 2.1.1.
To: Rishi Adhikari and Roger Skirrow From: Nerissa Dharma, Leslie Cho, and Junwen Yang Alberta Transportation File: Date: June 11, 2018
 To: Rishi Adhikari and Roger Skirrow From: Nerissa Dharma, Leslie Cho, and Junwen Yang Stantec File: Date: June, Reference: North Central Region Edson Site NC HWY :, Deer Lodge Spring Task C: Instrumentation