Regulation of Synaptic Structure and Function by FMRP- Associated MicroRNAs mir-125b and mir-132
|
|
|
- Baldric Oscar Mathews
- 6 years ago
- Views:
Transcription
1 Neuron, Volume 65 Regulation of Synaptic Structure and Function by FMRP- Associated MicroRNAs mir-125b and mir-132 Dieter Edbauer, Joel R. Neilson, Kelly A. Foster, Chi-Fong Wang, Daniel P. Seeburg, Matthew N. Batterton, Tomoko Tada, Bridget M. Dolan, Phillip A. Sharp, and Morgan Sheng Legends for the Supplemental Figures Supplemental Figure S1 (related to Figures 2 and 4): Validation of mirna overexpression and knockdown in neurons. (A) β-actin promoter-driven mirna expression constructs suppress EGFP-based mirna sensors containing artificial mirna targets sites in their 3 UTR. Hippocampal neurons were cotransfected with mirna expression constructs and EGFP-based sensors at DIV4. Three days later, neurons were fixed, immunostained for EGFP and imaged by confocal microscopy. Co-expressed morange was used to pick neurons randomly for analysis (regardless of their EGFP-expression). mirna-expressing constructs downregulated only their specific mirna sensor but not unrelated sensors. One-way ANOVA with Dunnett s post test: p < 1. n = 15 to 55 neurons. Error bars denote SEM. (B) Design of mirna sponges. Diagram shows hybridization of mir-125b with the mir-125b sponge containing a central mismatch/bulge that prevents mrna cleavage by AGO2. In mirna sponge constructs, several such seed matches (yellow) were placed in the 3 UTR of mcherry. (C) mirna sponges specifically increase mirna-sensor expression in hippocampal neurons. mirna sponges were cotransfected with FF-luc-based mirna sensors (DIV4+3). Relative expression of FF-luc sensors was used to measure (residual) mirna activity in neurons. Note that a mir-125a-directed sponge also upregulated a
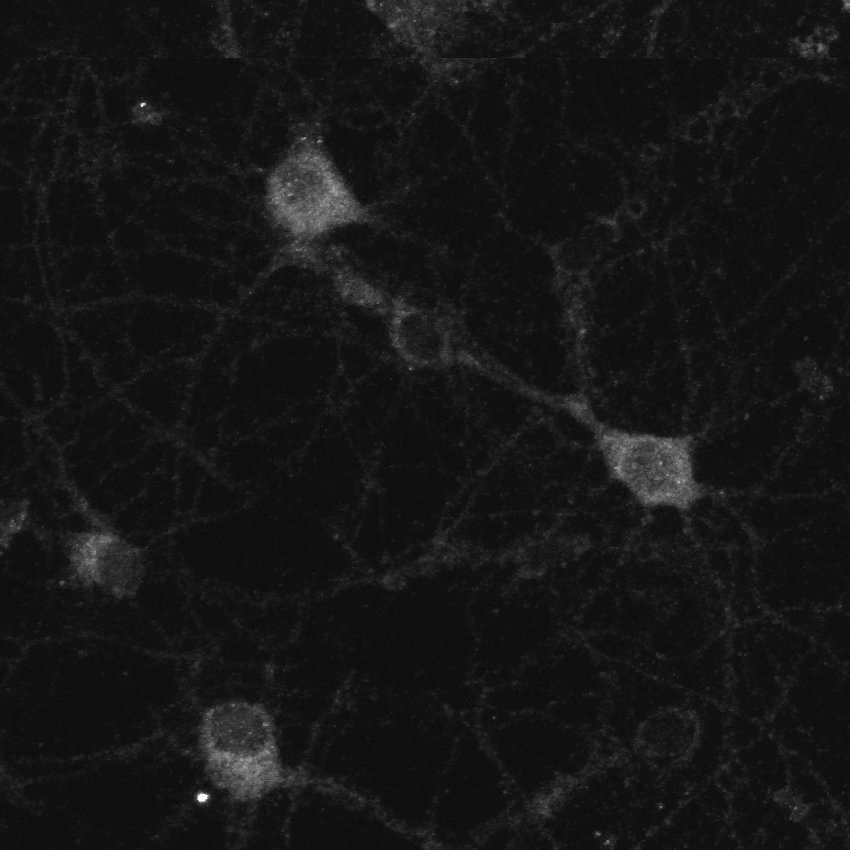
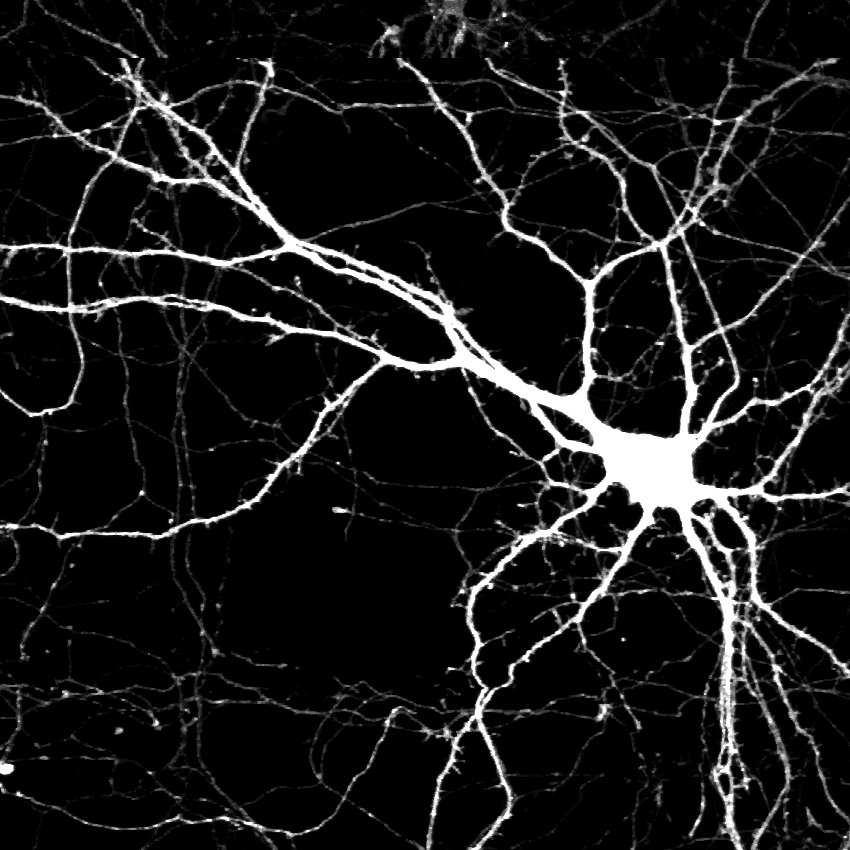
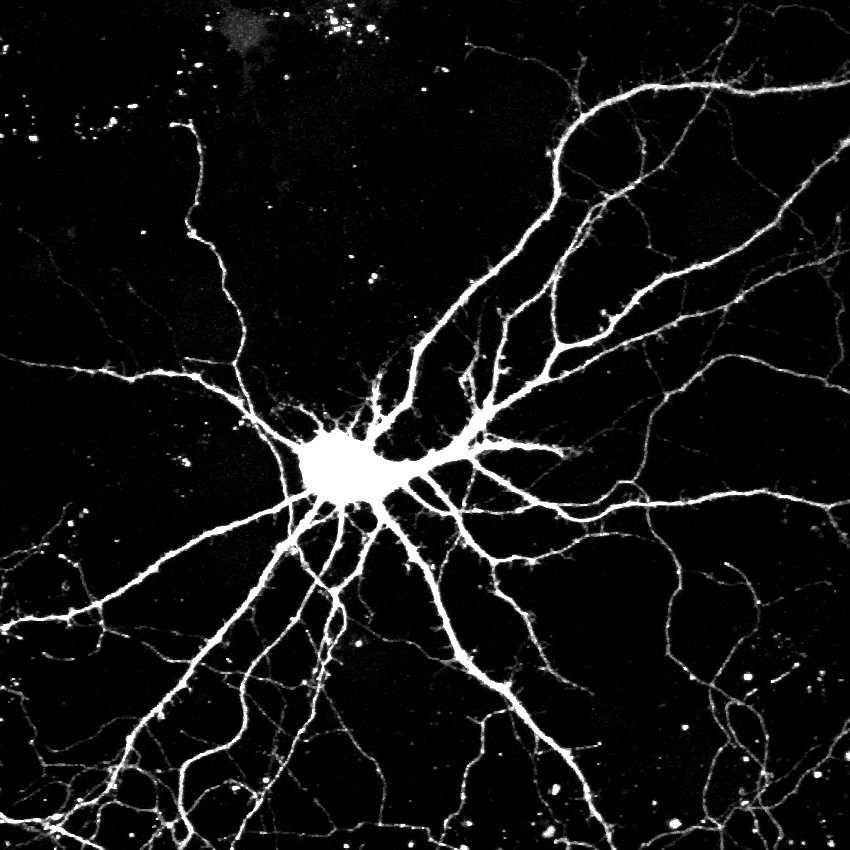
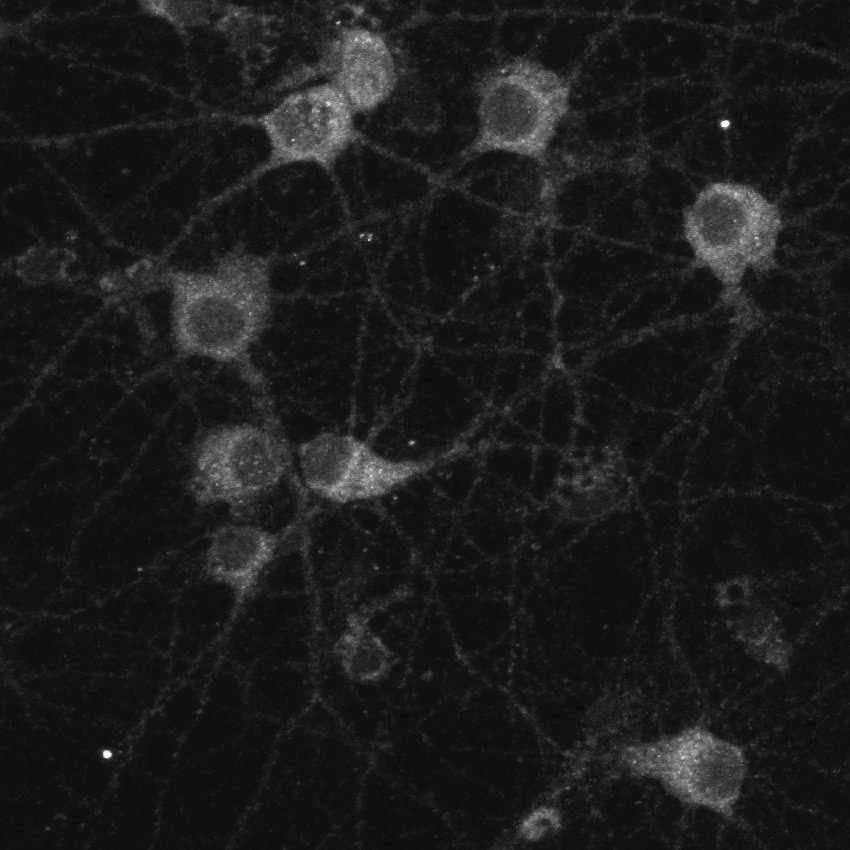
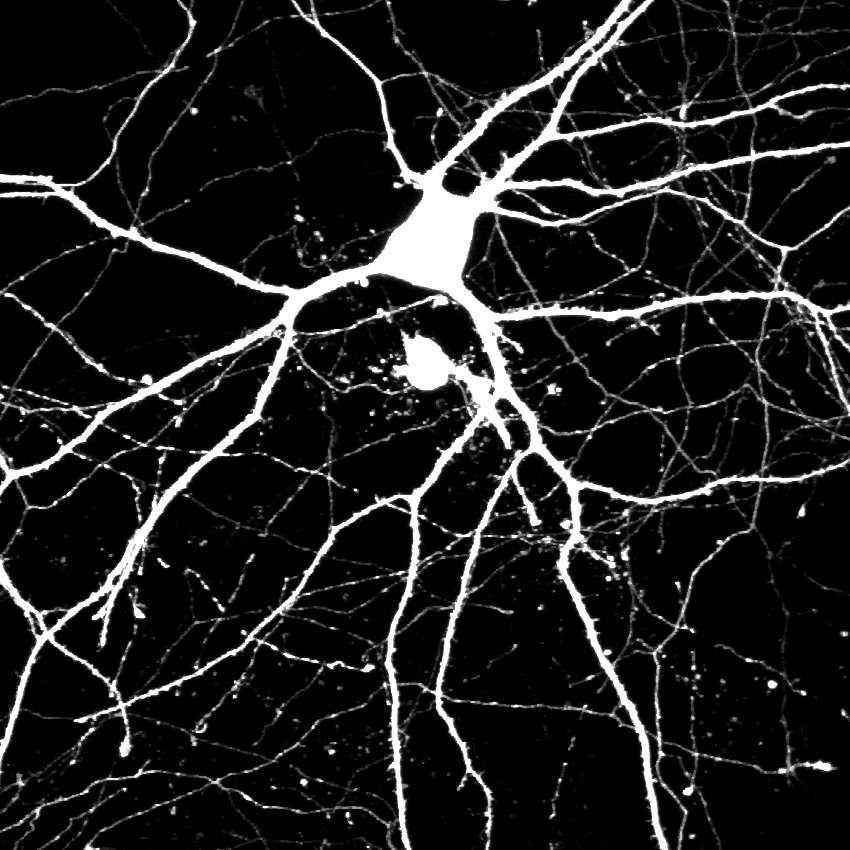
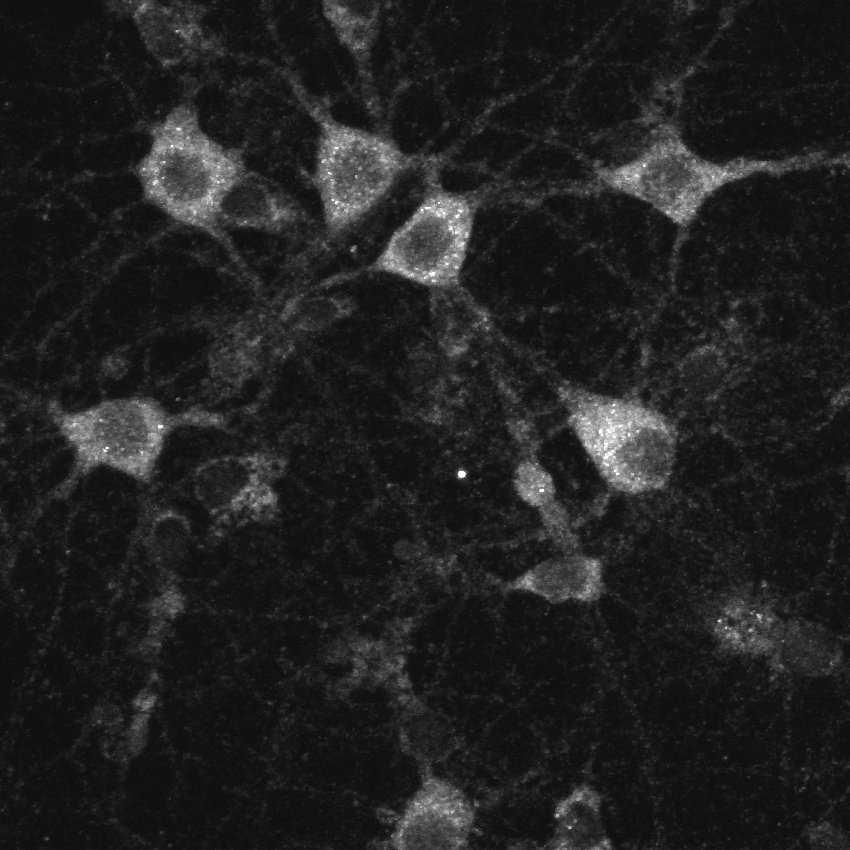
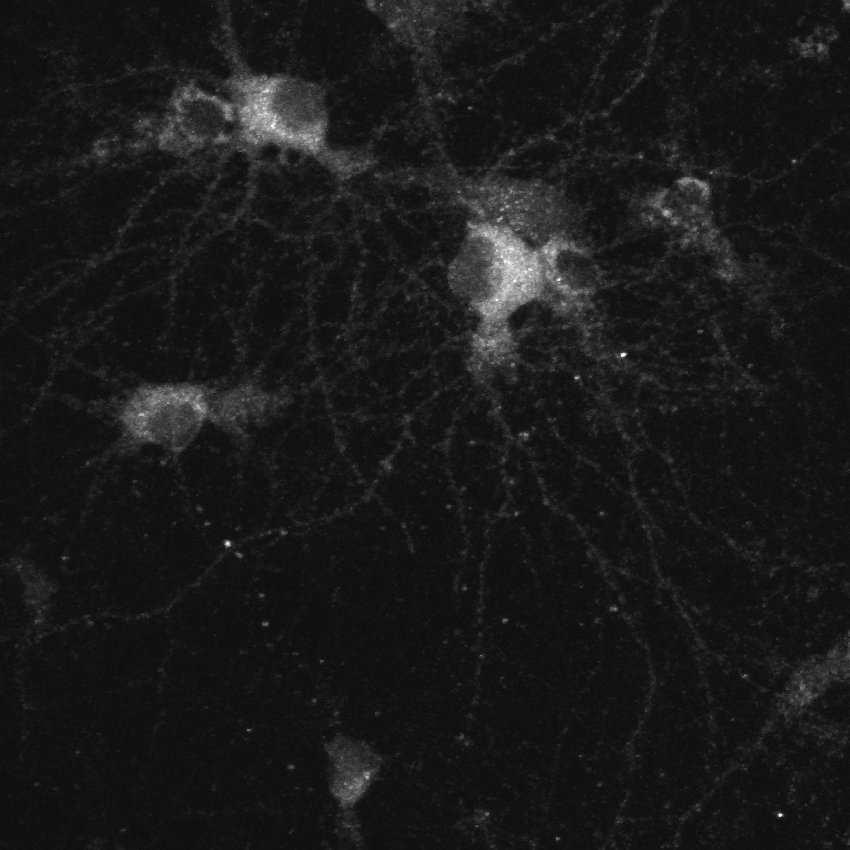
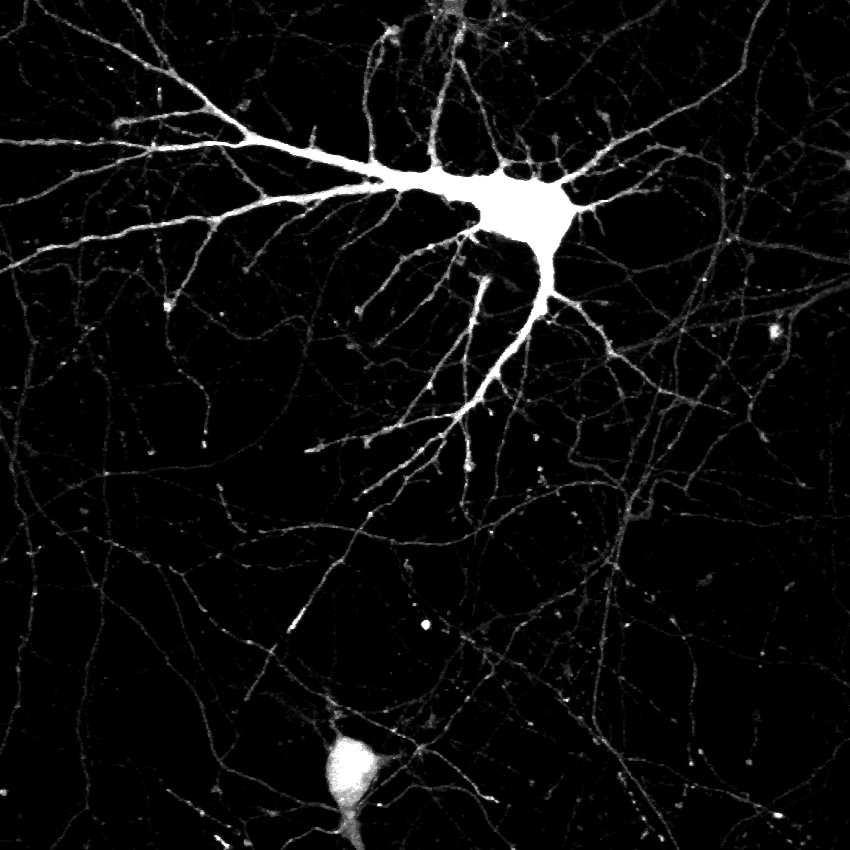
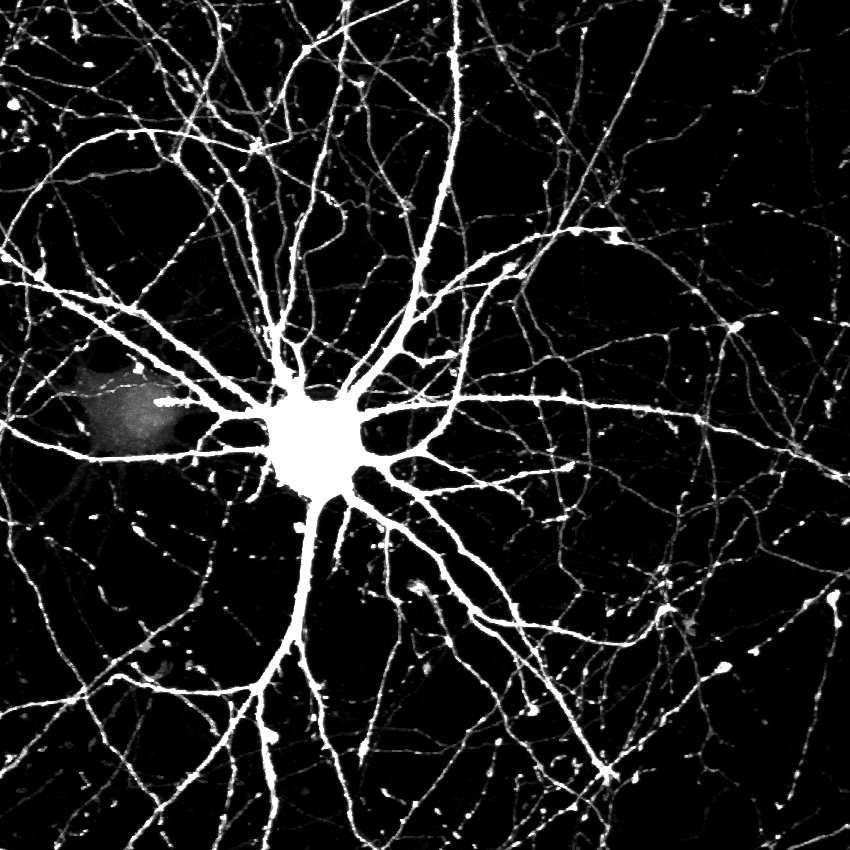
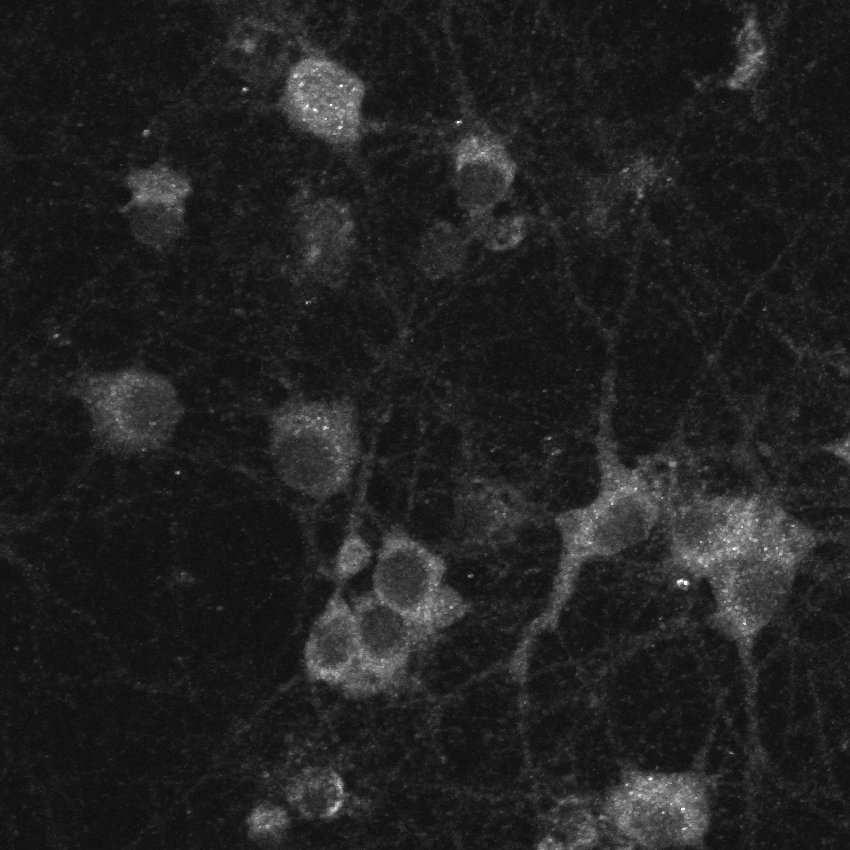
2 mir-125b sensor, presumably through cross-capture of mir-125b. Combining mir-125a and 125b sponges (125a+b) did not improve loss-of-function efficacy (as measured using the mir-125b sensor). One-way ANOVA with Dunnett s post test: * p < 5, p < 1. n = 12 to 24. Error bars denote SEM. Supplemental Figure S2 (related to Figure 2): Effects of overexpression of specific mirnas on dendrite branching. Sholl analysis of hippocampal neurons cotransfected with β-actin promoter-driven mirna expressing constructs and EGFP (DIV14+3). The number of dendrites crossing a series of concentric circles spaced 15 µm apart and centered upon the cell body of each neuron was manually counted. Gray corridor represents neurons transfected with empty vector (mean +/- SEM). mirna-expressing neurons were not significantly different from control using two-way ANOVA. n = 27 to 46 neurons each group. Error bars denote SEM. Supplemental Figure S3 (related to Figures 3 and 8): Validation of FMRP shrna constructs. (A) Validation of shrna constructs in HEK293 cells. Immunoblot showing shrnamediated specific knockdown of EGFP-FMRP in HEK293 cells cotransfected with the indicated psuper-based shrna constructs, and EGFP-FMRP and myc-psd-95 expressing constructs. (B) Cultured hippocampal neurons (DIV4+3) were cotransfected with psuper-based shrna constructs targeting zinc transporter 3 (ZnT3), EGFP or FMRP (two target sites) and mcherry. Neurons were immunostained for FMRP. Arrows mark cell body of transfected neurons. Scale bar represents 50 μm. (C) FMRP
3 immunostaining intensity was quantified in the soma of transfected relative to untransfected neurons in the same visual field. One-way ANOVA with Dunnett s post test compared to psuper: p < 1. n = 20 to 25 neurons. Error bars denote SEM. Supplemental Figure S4 (related to Figure 6): Validation of mirna expression constructs in HEK293 cells. FF-luc constructs containing perfect match mirna target sites in their 3 UTRs were cotransfected with synapsin promoter-driven mirna overexpression constructs and RRluc. Relative expression was determined by normalizing the ratio of FF-luc and RR-luc activity to the effect of each mirna on a control FF-luc sensor (and let-7c). Arrows indicate cognate sensor/mirna pairs. Note that let-7c, mir-22, mir-124 and mir-125b show no or low endogenous expression in HEK293 cells (Landgraf et al., 2007). One-way ANOVA with Dunnett s post test compared to let-7c overexpression: p < 1. n = 6 to 12. Error bars denote SEM. Supplemental Figure S5 (related to Figure 6): mirna target screening in HEK293 cells. Dual luciferase assays to screen 3 UTR reporter constructs from additional predicted mirna targets: Eph receptor A4 (EphA4), AMPA glutamate receptor 2 (GluR2), Arf guanine nucleotide exchange factor KIAA0522 (IQSEC2/BRAG1), N-cadherin, the protein phosphatase 1 and 2 catalytic subunits (PPP1CA and PPP2CA) and Profilin 2. For comparison data for NR2A is reproduced from Figure 5B. FF-luc reporter constructs containing the 3 UTR from the above genes were cotransfected with mirna overexpressing constructs (as indicated) and RR-luc. Relative expression was determined
4 by normalizing the ratio of FF-luc and RR-luc activity to the effect of each mirna on a control FF-luc sensor and, depending on the absence of predicted target sites, to let-7c (GluR2, N-cadherin, NR2A, PPP1CA, PPP2CA, Profilin 2) or mir-124 (IQSEC2, EphA4). Arrows indicate possible interaction between mirna and 3 UTR predicted by TargetScan or PicTar (Krek et al., 2005; Lewis et al., 2005). One-way ANOVA with Dunnett s post test: * p < 5, p < 1. n = 6 to 30. Error bars denote SEM. Supplemental Figure S6 (related to Figure 8): Developmental profile of mirnas and NR2 mrnas. Quantitative PCR analysis of NR2A, NR2B mrna (A) and mir-125b (B) from rat hippocampal neurons over the course of development in culture. Mature mir-125b levels were quantified by TaqMan assay. NR2A and NR2B mrna levels were quantified using SYBR green RT-qPCR. Expression levels are normalized to ζ (YWHAZ), which showed the most consistent expression pattern during development among the housekeeping genes tested (GAPDH, PGK1, YWHAZ). n = 3 7. Error bars denote SEM. Supplemental Figure S7 (related to Figure 8): Species-tagging of FMRP-associated mrnas. Single clone analysis to compare the ratio of rat and mouse cdna cloned from FMRPimmunoprecipitation and the input material (lysates of mixed WT rat and FMR1 KO mouse brain). (A) Colony PCR reaction of cdnas digested with rat-specific (left lane of each doublet) and mouse-specific (right lane of each doublet) restriction enzymes. NR1 was digested with BanII (for rat) and PflFI (for mouse); NR2A was digested with MboI (for rat) and BsrBI (for mouse). Clones were marked with R (rat cdna), M (mouse
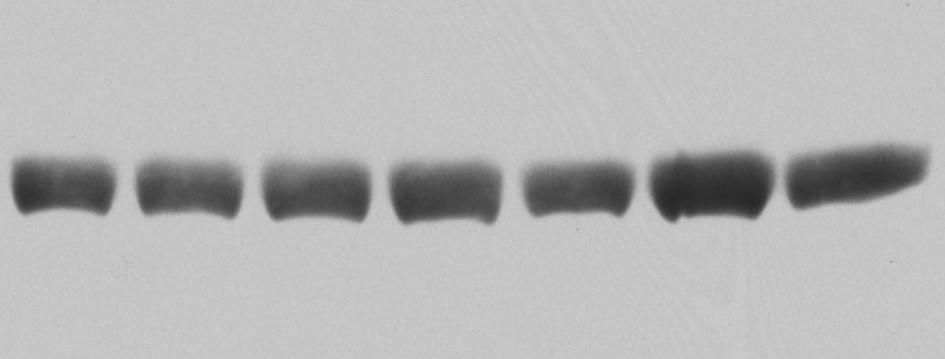
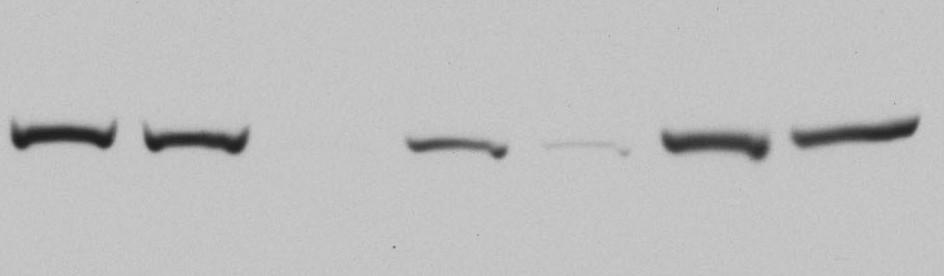
5 cdna), x (cloning or colony PCR failed). Note that the size of the restriction fragments varies slightly depending on the orientation of the cdna insert in the cloning vector. (B) Clone counts for the indicated genes used for statistical analysis in Figure 8B. Supplemental Figure S8 (related to Figure 8): NMDA receptor subunit expression in FMR1 KO mice. Immunoblot analysis of hippocampus from FMR1 KO and wild-type mice for the indicated proteins at 7 days (A) or 14 days (B) of age. Immunoblots of homogenates were quantified by densitometry and normalized to total proteins levels (assayed with SYPRO Ruby) and wild-type mice. No significant changes were detected. (A) n = 5 mice each. (B) n = 14 wild-type and 12 KO mice. For each mouse the FMR1 genotype was confirmed by FMRP immunoblot. Error bars denote SEM.
6 A relative expression B mir-22 sensor 1.4 vector 9 22 mirna expression construct mcherry Ω relative expression Ω mir-125b sensor Ω vector b mirna expression construct CCA mir-125b 3 -AGUGUUCAAUC GAGUCCCU-5 sponge UCACAAGUUAG CUCAGGGA...-3 AA mirna Ω Ω_ C mir-124 sensor mir-125b sensor relative expression mirna sponge relative expression * a 125b125a+b mirna sponge Edbauer et al, Supplemental Figure S1
7 # of crossings distance from soma [µm] vector let-7c mir-22 mir-124 mir-132 mir-125b mir-143 Edbauer et al, Supplemental Figure S2
8 A myc-psd-95 B psuper ZnT3 FMRP #1 FMRP #2 EGFP C FMRP #2 EGFP Luc shrna EGFP-FMRP mcherry FMRP psuper ZnT3 FMRP #1 AGO1 psuper ZnT3 FMRP #1 FMRP #2 EGFP FMRP immunofluorescence Edbauer et al, Supplemental Figure S3
9 relative expression 1.4 control sensor mir-22 sensor mir-124 sensor mir-125b sensor let-7c mir-22 mir-124 mir-125b mirna overexpression Edbauer et al, Supplemental Figure S4
10 PPP2CA Profilin 2 NR2A PPP1CA 1.4 * relative expression EphA4 GluR2 let-7c mir-22 mir-124 mir-125b IQSEC2 N-cadherin Edbauer et al, Supplemental Figure S5
11 A 5 NR2A NR2B B relative expression days in vitro relative expression mir-125b days in vitro Edbauer et al, Supplemental Figure S6


12 A NR1: not significant R M M M M M M x M R M M x NR2A: p<01 R x R R R R M R R M R B input FMRP-IP M M M M M M M M x M M M R R R R R M R R M R x x mrna mouse rat mouse rat input FMRP-IP M M M M M x M M M x M R M M x x M M M x M M M M x M x M R M M R M M M M M M M M M R R M M M M M x M M M M M M M M M R R M M R M M M M M M M R M R R R R R R R R M R R M M R R R R R R M R x R R x M M x M M M M M R M R R M M M M M M M M M M M M M M M M x M M x R R R R R M M M x x M M M R x GAPDH MAP1B NR NR2A NR2B p Note: In the original publication, as a result of an error in the making of Figure S7, one of the gel panels was mistakenly duplicated and the correct panel omitted. The corrected version of the figure is shown here. The correction does not affect in any way the statistical analysis or conclusions of that experiment or the rest of the paper. The authors apologize for any confusion caused by this error. See the Erratum published in Neuron 68(1). Edbauer et al, Supplemental Figure S7
13 A B homogenate levels/protein homogenate levels/protein 2.0 WT 1.8 KO NR1 NR1 NR2A NR2A NR2B NR2B p250gap p250gap EphA4 PSD-95 MAP1B CaMK2a GluR1 b3-tubulin WT KO Edbauer et al, Supplemental Figure S8
14 Supplemental Table S1: DNA oligonucleotides. let- 7c mir- 22 mir- 124 mir- 125b mir- 132 mir- 143 mirna expression (first generation) s: GATCGTCGACCACTGGAAGCTGTGTGCATCCGGGTTGAGGTAGTAGGTTGTATGGTTTAGAGTTACACCCTGGG a: GATCGCGGCCGCCGATGGCTCAAGTGTGCTCCAAGGAAAGCTAGAAGGTTGTACAGTTAACTCCCAGGGTGTAACTCTAAACC s: GATCGTCGACCCACACGCTCACCTGGCTGAGCCGCAGTAGTTCTTCAGTGGCAAGCTTTATGTCCTGACCCAGCTAAAGC a: GATCGCGGCCGCCCTCCTCGAAGCCAGTGGCAGAGGGCAACAGTTCTTCAACTGGCAGCTTTAGCTGGGTCAGGACATAAAGC s: GATCGTCGACCTCAGGAGAAAGGCCTCTCTCTCCGTGTTCACAGCGGACCTTGATTTAAATGTCCATACAATTAAGGC a: GATCGCGGCCGCAGGTGCTCAGACAGCCCCATTCTTGGCATTCACCGCGTGCCTTAATTGTATGGACATTTAAATCAAG s: GATCGTCGACAGAATTGTGTTGCGCTCCCCTCAGTCCCTGAGACCCTAACTTGTGATGTTTACCGTTTAAATCCACG a: GATCGCGGCCGCCGATGCAAAGGCACGACTCGCAGCTCCCAAGAGCCTAACCCGTGGATTTAAACGGTAAACATCACAAG s: GATCGTCGACCCTGAAAGCCCCGCCCCCGCGTCTCCAGGGCAACCGTGGCTTTCGATTGTTACTGTGGGAACCGGAGGTAAC a: GATCGCGGCCGCGAGTGGTGGGGAGCGTGGGCGTGCTGCGGGGCGACCATGGCTGTAGACTGTTACCTCCGGTTCCCACAG s: GATCGTCGACTGGCCTGAGCGCGGAGCGCCTGTCTCCCAGCCTGAGGTGCAGTGCTGCATCTCTGGTCAGTTGGGAGTCTGAG a: GATCGCGGCCGCCCCGGCGACGGCTGCAGAACATCTTCTCCCTTCCTGAGCTACAGTGCTTCATCTCAGACTCCCAACTGACCAGAG mirna expression (second generation) let-7c s: GATGCTAGCCAGGTTAGGGTAGTCCTGTAAGCTAC a: CATGGCGCGCCAGGTCTGGGATGATCAGGTAAATGC mir-22 s: GATGCTAGCGAACCTGTGCCTCCCACACGCTC a: CATGGCGCGCCTTCCAGATGATAGGCAAAGAAGCTGC mir-124 s: GATGCTAGCCAACACTGCCAGCTTAGCGCGGAGCC a: CATGGCGCGCCGCATTGTTCGCCGGATTTGTCCGC mir-125b1 s: GATGCTAGCTTTACTCCTGTGTCCGCAACCGAG a: CATGGCGCGCCTCCTTCCTTCCTTAAAAGACAAAAAGTTCC mir-125b2 s: GATGCTAGCGCATGTCTGCTTTGTTTCCATAGCCC a: CATGGCGCGCCGAGGAAACACAAGCACTATTTCAGTACC mir-143 s: GATGCTAGCGGGTAGGGTCCATCTCAAGAAAGC a: CATGGCGCGCCAGCCCTGGTACAGCCTGAGTCAAGG Mature mir-125b of identical sequence is expressed from two genomic loci mir-125b1 and mir-125b2. We found that the mir-125b1-derived vector allows stronger lentiviral mir-125b expression (Figure 7A), while the mir-125b2 derivative allows stronger expression in HEK293 cells (Figure 6B and Supplemental Figures S4 and S5). mirna sponge cloning (p denotes 5 phosphorylation, bold indicates mismatch with the corresponding mirna) 5 -linker s: AGTCACTAGTCTTGATGCGGCCGCTc a: ccgggagcggccgcatcaagactagtgact 3 -linker s: p-ccggcgtcgactcggcagctctagacgc a: GCGTCTAGAGCTGCCGAGTCGACg let-7c s: p-ccggcaaccatacaacagctacctcac a: ccgggtgaggtagctgttgtatggttg mir-22 s: p-ccggcacagttcttcagaggcagcttc a: ccgggaagctgcctctgaagaactgtg mir-124 s: p-ccggctggcattcacaagtgccttaac a: ccgggttaaggcacttgtgaatgccag mir-125a s: p-ccggccacaggttaaagaactcagggac a: ccgggtccctgagttctttaacctgtgg mir-125b s: p-ccggctcacaagttagaactcagggac a: ccgggtccctgagttctaacttgtgag
15 mir-132 mir-143 s: p-ccggccgaccatggctaggactgttaac a: ccgggttaacagtcctagccatggtcgg s: p-ccggctgagctacagtagtcatctcac a: ccgggtgagatgactactgtagctcag Primer pairs for qpcr (bispecifc for mouse and rat) p250gap s: TGTGGGGCAGGTACAAGAAGCACC a: TGAAAAAGGAACGCCAGCTGCCAAC NR1 s: TCTGGCCAGGAGGAGAGACAGAG a: TGTCATTAGGCCCCGTACAGATCACC NR2A s: GGGCTGCTCTTCTCCATCAGC a: CCCTTGTCTGAAACCATGTCCAC NR2B s: GGAAGCTCTCTGGCTCACTGGC a: TCATCACGGATTGGCGCTCCTC YWHAZ s: TGAGCAGAAGACGGAAGGTGCTG a: TCTGATGGGGTGTGTCGGCTGC MAP1B s: TCCGATCGTGGGACACAAACCTG a: AGCACCAGCAGTTTATGGCGGG PGK1 s: GAAGGGGAAGCGGGTCGTGATG a: GCAGCAACTGGCTCTAAGGAGTACTTG GAPDH s: CCGCATCTTCTTGTGCAGTGCC a: AGACTCCACGACATACTCAGCACC 3 UTR cloning for FF-luc reporter constructs N-cad- s: ATCTCTAGAACGGCAGGACGGACTTGGCTTTTGG herin a: CATGAATTCCAAAATTAGCTTTTTATTCAGAACGCTGGG EphA4 s: ATGGGCGCGCCAGTACCGAACAGACTCAAAACTCTCG a: TTGGAATTCGTATGAAACAAGAGATGTCCGGCTAACTTC GluR2 s: GATGCTAGCTTAGGGGATGACCTTGAGTGATGTCATGAGG a: TAAGAATTCTGGCTGAAAGAAAAGCCTTCAAGATATCGG IQSEC2 s: GCGTCTAGACAGTCCACGCCCTCACCAGAGGATGC a: CATGAATTCCTGTCTGGACTTTGATCAGGATAAGAAC NR1 s: GATGCTAGCGTCATAGGGAGAGCTGAGACGCCC a: ATGGAATTCCATAGGCCCCCACTGTAGCTTGG NR2A s: ATGTCTAGACGAGTGTACAAGAAAATGCCTAGTATCG a: CATGAATTCATATGCACAGGCTCAGTGGGCC NR2B s: GATGCTAGCTAGTATTGAGTCTGATGTCTGAGTGAGGG a: GATGAATTCAGTGAAAGCCTCTTCTCTCTTATG Profilin s: GATTCTAGAGCTAGGCAGACTGTTAAGTATTAGGGG 2 a: ATTGAATTCATCTGTCTGTAAACAAGGTGTTTAATAGTTATGG PPP1CA s: GCGTCTAGACCTCCATGTGCTGCCCTCTGCC a: CATGAATTCAAGAGACCAGATGGGTTGCCCCAGG PPP2CA s: GATTCTAGACACATGTCACTCGTCGTACCCC a: CCTGGAATTCTACAAATTCTGAAATTGATC
Cell proliferation was measured with Cell Counting Kit-8 (Dojindo Laboratories, Kumamoto, Japan).
.") 1 2 3 4 5 6 7 8 Supplemental Materials and Methods Cell proliferation assay Cell proliferation was measured with Cell Counting Kit-8 (Dojindo Laboratories, Kumamoto, Japan). GCs were plated at 96-well
1 2 3 4 5 6 7 8 Supplemental Materials and Methods Cell proliferation assay Cell proliferation was measured with Cell Counting Kit-8 (Dojindo Laboratories, Kumamoto, Japan). GCs were plated at 96-well
MeCP2. MeCP2/α-tubulin. GFP mir1-1 mir132
 Conservation Figure S1. Schematic showing 3 UTR (top; thick black line), mir132 MRE (arrow) and nucleotide sequence conservation (vertical black lines; http://genome.ucsc.edu). a GFP mir1-1 mir132 b GFP
Regulation of Synaptic Structure and Function by FMRP- Associated MicroRNAs mir-125b and mir-132
 Regulation of Synaptic Structure and Function by FMRP- ssociated MicroRNs mir- and mir- The MIT Faculty has made this article openly available. Please share how this access benefits you. Your story matters.
SUPPLEMENTARY INFORMATION
 doi:.38/nature899 Supplementary Figure Suzuki et al. a c p7 -/- / WT ratio (+)/(-) p7 -/- / WT ratio Log X 3. Fold change by treatment ( (+)/(-)) Log X.5 3-3. -. b Fold change by treatment ( (+)/(-)) 8
Supplemental Figure 1 Human REEP family of proteins can be divided into two distinct subfamilies. Residues (single letter amino acid code) identical
 identical") Supplemental Figure Human REEP family of proteins can be divided into two distinct subfamilies. Residues (single letter amino acid code) identical in all six REEPs are highlighted in green. Additional
Supplemental Figure Human REEP family of proteins can be divided into two distinct subfamilies. Residues (single letter amino acid code) identical in all six REEPs are highlighted in green. Additional
Fig. S1. eif6 expression in HEK293 transfected with shrna against eif6 or pcmv-eif6 vector.
 Fig. S1. eif6 expression in HEK293 transfected with shrna against eif6 or pcmv-eif6 vector. (a) Western blotting analysis and (b) qpcr analysis of eif6 expression in HEK293 T cells transfected with either
T H E J O U R N A L O F C E L L B I O L O G Y
 Supplemental material Moutin et al., http://www.jcb.org/cgi/content/full/jcb.201110101/dc1 T H E J O U R N A L O F C E L L B I O L O G Y Figure S1. Tagged Homer1a and Homer are functional and display different
Fig. S1. Effect of p120-catenin overexpression on the interaction of SCUBE2 with E-cadherin. The expression plasmid encoding FLAG.
 Fig. S1. Effect of p120-catenin overexpression on the interaction of SCUBE2 with E-cadherin. The expression plasmid encoding FLAG.SCUBE2, E-cadherin.Myc, or HA.p120-catenin was transfected in a combination
1. Primers for PCR to amplify hairpin stem-loop precursor mir-145 plus different flanking sequence from human genomic DNA.
 Supplemental data: 1. Primers for PCR to amplify hairpin stem-loop precursor mir-145 plus different flanking sequence from human genomic DNA. Strategy#1: 20nt at both sides: #1_BglII-Fd primer : 5 -gga
Supplementary Information Cyclin Y inhibits plasticity-induced AMPA receptor exocytosis and LTP
 Supplementary Information Cyclin Y inhibits plasticity-induced AMPA receptor exocytosis and LTP Eunsil Cho, Dong-Hyun Kim, Young-Na Hur, Daniel J. Whitcomb, Philip Regan, Jung-Hwa Hong, Hanna Kim, Young
Supplementary Materials for
 www.sciencesignaling.org/cgi/content/full/10/496/eaam6291/dc1 Supplementary Materials for Regulation of autophagy, NF-κB signaling, and cell viability by mir-124 in KRAS mutant mesenchymal-like NSCLC cells
transcription and the promoter occupancy of Smad proteins. (A) HepG2 cells were co-transfected with the wwp-luc reporter, and FLAG-tagged FHL1,
 HepG2 cells were co-transfected with the wwp-luc reporter, and FLAG-tagged FHL1,") Supplementary Data Supplementary Figure Legends Supplementary Figure 1 FHL-mediated TGFβ-responsive reporter transcription and the promoter occupancy of Smad proteins. (A) HepG2 cells were co-transfected
Supplementary Data Supplementary Figure Legends Supplementary Figure 1 FHL-mediated TGFβ-responsive reporter transcription and the promoter occupancy of Smad proteins. (A) HepG2 cells were co-transfected
Supplementary Figure 1 Phosphorylated tau accumulates in Nrf2 (-/-) mice. Hippocampal tissues obtained from Nrf2 (-/-) (10 months old, 4 male; 2
 mice. Hippocampal tissues obtained from Nrf2 (-/-) (10 months old, 4 male; 2") Supplementary Figure 1 Phosphorylated tau accumulates in Nrf2 (-/-) mice. Hippocampal tissues obtained from Nrf2 (-/-) (10 months old, 4 male; 2 female) or wild-type (5 months old, 1 male; 11 months old,
Supplementary Figure 1 Phosphorylated tau accumulates in Nrf2 (-/-) mice. Hippocampal tissues obtained from Nrf2 (-/-) (10 months old, 4 male; 2 female) or wild-type (5 months old, 1 male; 11 months old,
Nature Biotechnology: doi: /nbt Supplementary Figure 1
 Supplementary Figure 1 Schematic and results of screening the combinatorial antibody library for Sox2 replacement activity. A single batch of MEFs were plated and transduced with doxycycline inducible
Supplementary Figure 1 A
 Supplementary Figure A B M. mullata p53, 3 UTR Luciferase activity (%) mir-5b 8 Le et al. Supplementary Information NC-DP - + - - - - - NC-DP - - + - - - - NC-DP3 - - - + - - - 5b-DP - - - - + + + NC-AS
Cytotoxicity of Botulinum Neurotoxins Reveals a Direct Role of
 Supplementary Information Cytotoxicity of Botulinum Neurotoxins Reveals a Direct Role of Syntaxin 1 and SNAP-25 in Neuron Survival Lisheng Peng, Huisheng Liu, Hongyu Ruan, William H. Tepp, William H. Stoothoff,
Nature Biotechnology: doi: /nbt Supplementary Figure 1. In vitro validation of OTC sgrnas and donor template.
 Supplementary Figure 1 In vitro validation of OTC sgrnas and donor template. (a) In vitro validation of sgrnas targeted to OTC in the MC57G mouse cell line by transient transfection followed by 4-day puromycin
supplementary information
 Figure S1 ZEB1 full length mrna. (a) Analysis of the ZEB1 mrna using the UCSC genome browser (http://genome.ucsc.edu) revealed truncation of the annotated Refseq sequence (NM_030751). The probable terminus
Sarker et al. Supplementary Material. Subcellular Fractionation
 Supplementary Material Subcellular Fractionation Transfected 293T cells were harvested with phosphate buffered saline (PBS) and centrifuged at 2000 rpm (500g) for 3 min. The pellet was washed, re-centrifuged
i-stop codon positions in the mcherry gene
 Supplementary Figure 1 i-stop codon positions in the mcherry gene The grnas (green) that can potentially generate stop codons from Trp (63 th and 98 th aa, upper panel) and Gln (47 th and 114 th aa, bottom
DCLK-immunopositive. Bars, 100 µm for B, 50 µm for C.
 Supplementary Figure S1. Characterization of rabbit polyclonal anti-dclk antibody. (A) Immunoblotting of COS7 cells transfected with DCLK1-GFP and DCLK2-GFP expression plasmids probed with anti-dclk antibody
Table 1. Primers, annealing temperatures, and product sizes for PCR amplification.
 Table 1. Primers, annealing temperatures, and product sizes for PCR amplification. Gene Direction Primer sequence (5 3 ) Annealing Temperature Size (bp) BRCA1 Forward TTGCGGGAGGAAAATGGGTAGTTA 50 o C 292
Supplementary Figure 1. APP cleavage assay. HEK293 cells were transfected with various
 Supplementary Figure 1. APP cleavage assay. HEK293 cells were transfected with various GST-tagged N-terminal truncated APP fragments including GST-APP full-length (FL), APP (123-695), APP (189-695), or
Stargazin regulates AMPA receptor trafficking through adaptor protein. complexes during long term depression
 Supplementary Information Stargazin regulates AMPA receptor trafficking through adaptor protein complexes during long term depression Shinji Matsuda, Wataru Kakegawa, Timotheus Budisantoso, Toshihiro Nomura,
Supplemental Table S1. RT-PCR primers used in this study
 Supplemental Table S1. RT-PCR primers used in this study -----------------------------------------------------------------------------------------------------------------------------------------------
Supporting Online Material for
 www.sciencemag.org/cgi/content/full/1154040/dc1 Supporting Online Material for Selective Blockade of MicroRNA Processing by Lin-28 Srinivas R. Viswanathan, George Q. Daley,* Richard I. Gregory* *To whom
Supplementary Figure 1, related to Figure 1. GAS5 is highly expressed in the cytoplasm of hescs, and positively correlates with pluripotency.
 Supplementary Figure 1, related to Figure 1. GAS5 is highly expressed in the cytoplasm of hescs, and positively correlates with pluripotency. (a) Transfection of different concentration of GAS5-overexpressing
Supplemental Data. Cui et al. (2012). Plant Cell /tpc a b c d. Stem UBC32 ACTIN
. Plant Cell /tpc a b c d. Stem UBC32 ACTIN") A Root Stem Leaf Flower Silique Senescence leaf B a b c d UBC32 ACTIN C * Supplemental Figure 1. Expression Pattern and Protein Sequence of UBC32 Homologues in Yeast, Human, and Arabidopsis. (A) Expression
A Root Stem Leaf Flower Silique Senescence leaf B a b c d UBC32 ACTIN C * Supplemental Figure 1. Expression Pattern and Protein Sequence of UBC32 Homologues in Yeast, Human, and Arabidopsis. (A) Expression
T H E J O U R N A L O F C E L L B I O L O G Y
 T H E J O U R N A L O F C E L L B I O L O G Y Supplemental material Kawai and Amano, http://www.jcb.org/cgi/content/full/jcb.201110008/dc1 Figure S1. Regulation of mirna expression by BRCA1. (A) Confirmation
Supplementary Fig. 1 Expression levels of 5 mirnas cycling in PDF cells under LD conditions.
 Supplementary Fig. 1 Expression levels of 5 mirnas cycling in PDF cells under LD conditions. RT-qPCR quantification of mirna levels in PDF cells entrained under LD cycles in WT flies (PDF-GAL4;UAS-mCD8::GFP).
SUPPLEMENTARY INFORMATION
 DOI: 10.1038/ncb3240 Supplementary Figure 1 GBM cell lines display similar levels of p100 to p52 processing but respond differentially to TWEAK-induced TERT expression according to TERT promoter mutation
Supplemental figures (1-9) Gu et al. ADF/Cofilin-Mediated Actin Dynamics Regulate AMPA Receptor Trafficking during Synaptic Plasticity
 Gu et al. ADF/Cofilin-Mediated Actin Dynamics Regulate AMPA Receptor Trafficking during Synaptic Plasticity") Supplemental figures (1-9) Gu et al. ADF/Cofilin-Mediated Actin Dynamics Regulate AMPA Receptor Trafficking during Synaptic Plasticity Supplemental figure 1. The quantification method to determine the
Supplemental figures (1-9) Gu et al. ADF/Cofilin-Mediated Actin Dynamics Regulate AMPA Receptor Trafficking during Synaptic Plasticity Supplemental figure 1. The quantification method to determine the
RNA oligonucleotides and 2 -O-methylated oligonucleotides were synthesized by. 5 AGACACAAACACCAUUGUCACACUCCACAGC; Rand-2 OMe,
 Materials and methods Oligonucleotides and DNA constructs RNA oligonucleotides and 2 -O-methylated oligonucleotides were synthesized by Dharmacon Inc. (Lafayette, CO). The sequences were: 122-2 OMe, 5
Supplemental materials
 Supplemental materials Materials and methods for supplemental figures Yeast two-hybrid assays TAP46-PP2Ac interactions I. The TAP46 was used as the bait and the full-length cdnas of the five C subunits
SUPPLEMENTARY INFORMATION
 DOI:.38/ncb327 a b Sequence coverage (%) 4 3 2 IP: -GFP isoform IP: GFP IP: -GFP IP: GFP Sequence coverage (%) 4 3 2 IP: -GFP IP: GFP 33 52 58 isoform 2 33 49 47 IP: Control IP: Peptide Sequence Start
SUPPLEMENTARY INFORMATION
 doi:10.1038/nature12119 SUPPLEMENTARY FIGURES AND LEGENDS pre-let-7a- 1 +14U pre-let-7a- 1 Ddx3x Dhx30 Dis3l2 Elavl1 Ggt5 Hnrnph 2 Osbpl5 Puf60 Rnpc3 Rpl7 Sf3b3 Sf3b4 Tia1 Triobp U2af1 U2af2 1 6 2 4 3
QPCR ASSAYS FOR MIRNA EXPRESSION PROFILING
 TECH NOTE 4320 Forest Park Ave Suite 303 Saint Louis, MO 63108 +1 (314) 833-9764 mirna qpcr ASSAYS - powered by NAWGEN Our mirna qpcr Assays were developed by mirna experts at Nawgen to improve upon previously
Supplementary information
 Supplementary information Supplementary Figure 1 (a) EM image of the pyramidal layer of wt mice. CA3 pyramidal neurons were selected according to their typical alignment, size and shape for subsequent
Dendritic targeting of mrna
 Dendritic targeting of mrna FMRP-dependent mglur-induced dendritic targeting of MAP1b and CaMKII mrna IMP-dependent NMDAR-induced dendritic targeting of β-action mrna Discussion (12/15) RNA and protein
Supplementary Information
 Supplementary Information Selective control of inhibitory synapse development by Slitrk3-PTPδ trans-synaptic interaction Hideto Takahashi 1, Kei-ichi Katayama 2, Kazuhiro Sohya 3,4, Hiroyuki Miyamoto 4,5,
Figure S1. Figure S2. Figure S3 HB Anti-FSP27 (COOH-terminal peptide) Ab. Anti-GST-FSP27(45-127) Ab.
 Ab. Anti-GST-FSP27(45-127) Ab.") / 36B4 mrna ratio Figure S1 * 2. 1.6 1.2.8 *.4 control TNFα BRL49653 Figure S2 Su bw AT p iw Anti- (COOH-terminal peptide) Ab Blot : Anti-GST-(45-127) Ab β-actin Figure S3 HB2 HW AT BA T Figure S4 A TAG
/ 36B4 mrna ratio Figure S1 * 2. 1.6 1.2.8 *.4 control TNFα BRL49653 Figure S2 Su bw AT p iw Anti- (COOH-terminal peptide) Ab Blot : Anti-GST-(45-127) Ab β-actin Figure S3 HB2 HW AT BA T Figure S4 A TAG
Supplemental Material Igreja and Izaurralde 1. CUP promotes deadenylation and inhibits decapping of mrna targets. Catia Igreja and Elisa Izaurralde
 Supplemental Material Igreja and Izaurralde 1 CUP promotes deadenylation and inhibits decapping of mrna targets Catia Igreja and Elisa Izaurralde Supplemental Materials and methods Functional assays and
8Br-cAMP was purchased from Sigma (St. Louis, MO). Silencer Negative Control sirna #1 and
. Silencer Negative Control sirna #1 and") 1 Supplemental information 2 3 Materials and Methods 4 Reagents and animals 5 8Br-cAMP was purchased from Sigma (St. Louis, MO). Silencer Negative Control sirna #1 and 6 Silencer Select Pre-designed sirna
1 Supplemental information 2 3 Materials and Methods 4 Reagents and animals 5 8Br-cAMP was purchased from Sigma (St. Louis, MO). Silencer Negative Control sirna #1 and 6 Silencer Select Pre-designed sirna
Cleavage of tau by asparagine endopeptidase mediates the neurofibrillary pathology in
 Supplementary information Cleavage of tau by asparagine endopeptidase mediates the neurofibrillary pathology in Alzheimer s disease Zhentao Zhang, Mingke Song, Xia Liu, Seong Su Kang, Il-Sun Kwon, Duc
Supplementary Figure 1 Validate the expression of mir-302b after bacterial infection by northern
 Supplementary Figure 1 Validate the expression of mir-302b after bacterial infection by northern blot. Northern blot analysis of mir-302b expression following infection with PAO1, PAK and Kp in (A) lung
Supplementary Figure 1. Localization of MST1 in RPE cells. Proliferating or ciliated HA- MST1 expressing RPE cells (see Fig. 5b for establishment of
 Supplementary Figure 1. Localization of MST1 in RPE cells. Proliferating or ciliated HA- MST1 expressing RPE cells (see Fig. 5b for establishment of the cell line) were immunostained for HA, acetylated
TRIM31 is recruited to mitochondria after infection with SeV.
 Supplementary Figure 1 TRIM31 is recruited to mitochondria after infection with SeV. (a) Confocal microscopy of TRIM31-GFP transfected into HEK293T cells for 24 h followed with SeV infection for 6 h. MitoTracker
- 1 - Supplemental Data
 - 1-1 Supplemental Data 2 3 4 5 6 7 8 9 Supplemental Figure S1. Differential expression of AtPIP Genes in DC3000-inoculated plants. Gene expression in leaves was analyzed by real-time RT-PCR and expression
OmicsLink shrna Clones guaranteed knockdown even in difficult-to-transfect cells
 OmicsLink shrna Clones guaranteed knockdown even in difficult-to-transfect cells OmicsLink shrna clone collections consist of lentiviral, and other mammalian expression vector based small hairpin RNA (shrna)
Supplementary Figure 1. α-synuclein is truncated in PD and LBD brains. Nature Structural & Molecular Biology: doi: /nsmb.
 Supplementary Figure 1 α-synuclein is truncated in PD and LBD brains. (a) Specificity of anti-n103 antibody. Anti-N103 antibody was coated on an ELISA plate and different concentrations of full-length
SUPPLEMENTARY INFORMATION
 doi:10.1038/nature10810 Supplementary Fig. 1: Mutation of the loqs gene leads to shortened lifespan and adult-onset brain degeneration. a. Northern blot of control and loqs f00791 mutant flies. loqs f00791
Supplementary data. sienigma. F-Enigma F-EnigmaSM. a-p53
 Supplementary data Supplemental Figure 1 A sienigma #2 sienigma sicontrol a-enigma - + ++ - - - - - - + ++ - - - - - - ++ B sienigma F-Enigma F-EnigmaSM a-flag HLK3 cells - - - + ++ + ++ - + - + + - -
Supplemental Information
 Supplemental Information Itemized List Materials and Methods, Related to Supplemental Figures S5A-C and S6. Supplemental Figure S1, Related to Figures 1 and 2. Supplemental Figure S2, Related to Figure
HCT116 SW48 Nutlin: p53
 Figure S HCT6 SW8 Nutlin: - + - + p GAPDH Figure S. Nutlin- treatment induces p protein. HCT6 and SW8 cells were left untreated or treated for 8 hr with Nutlin- ( µm) to up-regulate p. Whole cell lysates
High-resolution Identification and Separation of Living Cell Types by Multiple microrna-responsive Synthetic mrnas
 Supplementary information High-resolution Identification and Separation of Living Cell Types by Multiple microrna-responsive Synthetic mrnas Kei Endo *, Karin Hayashi, Hirohide Saito * Contents: 1. Supplementary
Regulation of axonal and dendritic growth by the extracellular calcium-sensing
 Regulation of axonal and dendritic growth by the extracellular calcium-sensing receptor (CaSR). Thomas N. Vizard, Gerard W. O Keeffe, Humberto Gutierrez, Claudine H. Kos, Daniela Riccardi, Alun M. Davies
Regulation of transcription by the MLL2 complex and MLL complex-associated AKAP95
 Supplementary Information Regulation of transcription by the complex and MLL complex-associated Hao Jiang, Xiangdong Lu, Miho Shimada, Yali Dou, Zhanyun Tang, and Robert G. Roeder Input HeLa NE IP lot:
3 UTR (untranslated region) Reporter Clone and its vector, pmirtarget. Application Guide. OriGene Technologies, Inc
 Reporter Clone and its vector, pmirtarget. Application Guide. OriGene Technologies, Inc") 3 UTR (untranslated region) Reporter Clone and its vector, pmirtarget Application Guide OriGene Technologies, Inc Package Contents and Storage Conditions 3 UTR reporter clone as 10ug lyophilized plasmid
3 UTR (untranslated region) Reporter Clone and its vector, pmirtarget Application Guide OriGene Technologies, Inc Package Contents and Storage Conditions 3 UTR reporter clone as 10ug lyophilized plasmid
Document S1. Supplemental Experimental Procedures and Three Figures (see next page)
") Supplemental Data Document S1. Supplemental Experimental Procedures and Three Figures (see next page) Table S1. List of Candidate Genes Identified from the Screen. Candidate genes, corresponding dsrnas
Supplemental Data Document S1. Supplemental Experimental Procedures and Three Figures (see next page) Table S1. List of Candidate Genes Identified from the Screen. Candidate genes, corresponding dsrnas
Genomic DNA fragments identified by ChIP-chip assay for MR [28] corresponding to two
![Genomic DNA fragments identified by ChIP-chip assay for MR [28] corresponding to two](/thumbs/89/98549522.jpg "Genomic DNA fragments identified by ChIP-chip assay for MR [28] corresponding to two") Supplemental Materials and Methods Genomic DNA fragments identified by ChIP-chip assay for MR [28] corresponding to two upstream regions of the human Klf9 gene (-5139 to -5771 bp and -3875 to -4211 bp)
Supplemental Materials and Methods Genomic DNA fragments identified by ChIP-chip assay for MR [28] corresponding to two upstream regions of the human Klf9 gene (-5139 to -5771 bp and -3875 to -4211 bp)
Legend for Supplemental Figures and Tables
 Legend for Supplemental Figures and Tables Supplemental Fig. 1. Negative regulation of the CYP27B1 promoter in a ligand-dependent manner (A) OK-P cells were transfected with pcdna-trα, pcdna-trβ1 or pcdna3
Supplementary Materials for
 www.sciencesignaling.org/cgi/content/full/10/483/eaak9557/dc1 Supplementary Materials for The lncrna H19 mediates breast cancer cell plasticity during EMT and MET plasticity by differentially sponging
Supplementary Figure1: ClustalW comparison between Tll, Dsf and NR2E1.
 P-Box Dsf -----------------MG-TAG--DRLLD-IPCKVCGDRSSGKHYGIYSCDGCSGFFKR 39 NR2E1 -----------------MSKPAGSTSRILD-IPCKVCGDRSSGKHYGVYACDGCSGFFKR 42 Tll MQSSEGSPDMMDQKYNSVRLSPAASSRILYHVPCKVCRDHSSGKHYGIYACDGCAGFFKR
Grb2-Mediated Alteration in the Trafficking of AβPP: Insights from Grb2-AICD Interaction
 Journal of Alzheimer s Disease 20 (2010) 1 9 1 IOS Press Supplementary Material Grb2-Mediated Alteration in the Trafficking of AβPP: Insights from Grb2-AICD Interaction Mithu Raychaudhuri and Debashis
Supplementary Table 1. Sequences for BTG2 and BRCA1 sirnas.
 Supplementary Table 1. Sequences for BTG2 and BRCA1 sirnas. Target Gene Non-target / Control BTG2 BRCA1 NFE2L2 Target Sequence ON-TARGET plus Non-targeting sirna # 1 (Cat# D-001810-01-05) sirna1: GAACCGACAUGCUCCCGGA
Summary MicroRNAs (mirnas) are genomically encoded small RNAs used by organisms to regulate the expression of proteins generated from messenger RNA
 are genomically encoded small RNAs used by organisms to regulate the expression of proteins generated from messenger RNA") Summary MicroRNAs (mirnas) are genomically encoded small RNAs used by organisms to regulate the expression of proteins generated from messenger RNA transcripts. The in vivo requirement of specific mirnas
Summary MicroRNAs (mirnas) are genomically encoded small RNAs used by organisms to regulate the expression of proteins generated from messenger RNA transcripts. The in vivo requirement of specific mirnas
Chapter 20 Recombinant DNA Technology. Copyright 2009 Pearson Education, Inc.
 Chapter 20 Recombinant DNA Technology Copyright 2009 Pearson Education, Inc. 20.1 Recombinant DNA Technology Began with Two Key Tools: Restriction Enzymes and DNA Cloning Vectors Recombinant DNA refers
(a) Immunoblotting to show the migration position of Flag-tagged MAVS
 Immunoblotting to show the migration position of Flag-tagged MAVS") Supplementary Figure 1 Characterization of six MAVS isoforms. (a) Immunoblotting to show the migration position of Flag-tagged MAVS isoforms. HEK293T Mavs -/- cells were transfected with constructs expressing
Supplementary Figure 1 Characterization of six MAVS isoforms. (a) Immunoblotting to show the migration position of Flag-tagged MAVS isoforms. HEK293T Mavs -/- cells were transfected with constructs expressing
Supplementary Figure 1. Expressions of stem cell markers decreased in TRCs on 2D plastic. TRCs were cultured on plastic for 1, 3, 5, or 7 days,
 Supplementary Figure 1. Expressions of stem cell markers decreased in TRCs on 2D plastic. TRCs were cultured on plastic for 1, 3, 5, or 7 days, respectively, and their mrnas were quantified by real time
Supplementary Figure 1 a. d 0.8 CON LPS PAN. 2nd ab nephrin podocin CON LPS PAN. upar. -tubulin. upar. upar / -tubulin CON LPS PAN
 Supplementary Figure 1 a Efferent arteriole Podocytes Afferent arteriole FP Endothelium GBM Glomerular filtration barrier b 188kD HEK + GFP HEK + GFP-Nphs1 Differentiated Podocytes HEK + GFP HEK + GFP-Nphs2
Estradiol-Estrogen Receptor α Mediates the Expression of the CXXC5 Gene through the Estrogen Response Element-Dependent Signaling Pathway
 Estradiol-Estrogen Receptor α Mediates the Expression of the CXXC5 Gene through the Estrogen Response Element-Dependent Signaling Pathway Pelin Yaşar, Gamze Ayaz and Mesut Muyan SUPPLEMENTARY INFORMATION
Supplemental Data. Li et al. (2015). Plant Cell /tpc
. Plant Cell /tpc") Supplemental Data Supplemental Figure 1: Characterization of asr3 T-DNA knockout lines and complementation transgenic lines. (A) The scheme of At2G33550 (ASR3) with gray boxes indicating exons and dash
Supplemental Data Supplemental Figure 1: Characterization of asr3 T-DNA knockout lines and complementation transgenic lines. (A) The scheme of At2G33550 (ASR3) with gray boxes indicating exons and dash
T H E J O U R N A L O F C E L L B I O L O G Y
 T H E J O U R N A L O F C E L L B I O L O G Y Supplemental material Nakajima and Tanoue, http://www.jcb.org/cgi/content/full/jcb.201104118/dc1 Figure S1. DLD-1 cells exhibit the characteristic morphology
JCB. Supplemental material THE JOURNAL OF CELL BIOLOGY. Kimura et al.,
 Supplemental material JCB Kimura et al., http://www.jcb.org/cgi/content/full/jcb.201503023/dc1 THE JOURNAL OF CELL BIOLOGY Figure S1. TRIMs regulate IFN-γ induced autophagy. (A and B) HC image analysis
Revision Checklist for Science Signaling Research Manuscripts: Data Requirements and Style Guidelines
 Revision Checklist for Science Signaling Research Manuscripts: Data Requirements and Style Guidelines Further information can be found at: http://stke.sciencemag.org/sites/default/files/researcharticlerevmsinstructions_0.pdf.
B. Transgenic plants with strong phenotype (%)
") A. TCTAGTTGTTGTTGTTATGGTCTAGTTGTTGTTGTTATGGTCTAATTT AAATATGGTCTAAAGAAGAAGAATATGGTCTAAAGAAGAAGAATATGG 2XP35S STTM165 5 GGGGGATGAAGctaCCTGGTCCGA3 3 CCCCCUACUUC---GGACCAGGCU5 mir165 HindIII mir165 96 nt GTTGTTGTTGTTATGGTCTAGTTGTTGTTGTTATGGTCTAATTT
A. TCTAGTTGTTGTTGTTATGGTCTAGTTGTTGTTGTTATGGTCTAATTT AAATATGGTCTAAAGAAGAAGAATATGGTCTAAAGAAGAAGAATATGG 2XP35S STTM165 5 GGGGGATGAAGctaCCTGGTCCGA3 3 CCCCCUACUUC---GGACCAGGCU5 mir165 HindIII mir165 96 nt GTTGTTGTTGTTATGGTCTAGTTGTTGTTGTTATGGTCTAATTT
Table S1. Primers used in the study
 Table S1. Primers used in the study Primer name Application Sequence I1F16 Genotyping GGCAAGTGAGTGAGTGCCTA I1R11 Genotyping CCCACTCGTATTGACGCTCT V19 Genotyping GGGTCTCAAAGTCAGGGTCA D18Mit184-F Genotyping
Supplemental Information. Loss of MicroRNA-7 Regulation Leads. to a-synuclein Accumulation and. Dopaminergic Neuronal Loss In Vivo
 YMTHE, Volume 25 Supplemental Information Loss of MicroRNA-7 Regulation Leads to a-synuclein Accumulation and Dopaminergic Neuronal Loss In Vivo Kirsty J. McMillan, Tracey K. Murray, Nora Bengoa-Vergniory,
Supporting Online Material for
 www.sciencemag.org/cgi/content/full/1137999/dc1 Supporting Online Material for Disrupting the Pairing Between let-7 and Enhances Oncogenic Transformation Christine Mayr, Michael T. Hemann, David P. Bartel*
Supplementary Figure 1. Homozygous rag2 E450fs mutants are healthy and viable similar to wild-type and heterozygous siblings.
 Supplementary Figure 1 Homozygous rag2 E450fs mutants are healthy and viable similar to wild-type and heterozygous siblings. (left) Representative bright-field images of wild type (wt), heterozygous (het)
Supplementary Figure 1. Confirmation of sirna in PC3 and H1299 cells PC3 (a) and H1299 (b) cells were transfected with sirna oligonucleotides
 and H1299 (b) cells were transfected with sirna oligonucleotides") Supplementary Figure 1. Confirmation of sirna in PC3 and H1299 cells PC3 (a) and H1299 (b) cells were transfected with sirna oligonucleotides targeting RCP (SMARTPool (RCP) or two individual oligos (RCP#1
Supplementary Figure 1. Confirmation of sirna in PC3 and H1299 cells PC3 (a) and H1299 (b) cells were transfected with sirna oligonucleotides targeting RCP (SMARTPool (RCP) or two individual oligos (RCP#1
Supplemental Table/Figure Legends
 MiR-26a is required for skeletal muscle differentiation and regeneration in mice Bijan K. Dey, Jeffrey Gagan, Zhen Yan #, Anindya Dutta Supplemental Table/Figure Legends Suppl. Table 1: Effect of overexpression
Supplementary Figure 1. ips_3y+mir-302b. ips_3y+mir-372. ips_3y+mir-302b + mir-372. ips_4y. ips_4y+mir-302b. ips_4y + mir-372
 Supplementary Figure 1 ips_3y+mir-32b ips_3y+ ips_3y+mir-32b + ips_4y ips_4y+mir-32b ips_4y + Nature Biotechnology: doi:1.138/nb.t.1862 TRA-1-6 DAPI Oct3/4 Supplementary Figure 1: ips cells derived from
SUPPLEMENTARY INFORMATION
 SUPPLEMENTARY INFORMATION Supplementary figure 1: List of primers/oligonucleotides used in this study. 1 Supplementary figure 2: Sequences and mirna-targets of i) mcherry expresses in transgenic fish used
Supplementary Figure 1: Expression of RNF8, HERC2 and NEURL4 in the cerebellum and knockdown of RNF8 by RNAi (a) Lysates of the cerebellum from rat
 Lysates of the cerebellum from rat") Supplementary Figure 1: Expression of RNF8, HERC2 and NEURL4 in the cerebellum and knockdown of RNF8 by RNAi (a) Lysates of the cerebellum from rat pups at P6, P14, P22, P30 and adult (A) rats were subjected
Supplementary Figure 1: Expression of RNF8, HERC2 and NEURL4 in the cerebellum and knockdown of RNF8 by RNAi (a) Lysates of the cerebellum from rat pups at P6, P14, P22, P30 and adult (A) rats were subjected
Table I. Primers used in quantitative real-time PCR for detecting gene expressions in mouse liver tissues
 Table I. Primers used in quantitative real-time PCR for detecting gene expressions in mouse liver tissues Gene name Forward primer 5' to 3' Gene name Reverse primer 5' to 3' CC_F TGCCCTGTTGGGGTTG CC_R
Disrupted-in-Schizophrenia-1 (DISC1) regulates spines of the glutamate synapse via Rac1
 regulates spines of the glutamate synapse via Rac1") Disrupted-in-Schizophrenia-1 () regulates spines of the glutamate synapse via Rac1 By Akiko Hayashi-Takagi, Manabu Takaki, Nick Graziane, Saurav Seshadri, Hannah Murdoch, Allan J Dunlop, Yuichi Makino,
Disrupted-in-Schizophrenia-1 () regulates spines of the glutamate synapse via Rac1 By Akiko Hayashi-Takagi, Manabu Takaki, Nick Graziane, Saurav Seshadri, Hannah Murdoch, Allan J Dunlop, Yuichi Makino,
Supplementary information to accompany: A novel role for the DNA repair gene Rad51 in Netrin-1 signalling
 Supplementary information to accompany: A novel role for the DNA repair gene Rad51 in Netrin-1 signalling Glendining KA 1, Markie D 2, Gardner RJM 4, Franz EA 3, Robertson SP 4, Jasoni CL 1 Supplementary
Supporting Information
 Supporting Information SI Materials and Methods RT-qPCR The 25 µl qrt-pcr reaction mixture included 1 µl of cdna or DNA, 12.5 µl of 2X SYBER Green Master Mix (Applied Biosystems ), 5 µm of primers and
Online Supplementary Information
 Online Supplementary Information NLRP4 negatively regulates type I interferon signaling by targeting TBK1 for degradation via E3 ubiquitin ligase DTX4 Jun Cui 1,4,6,7, Yinyin Li 1,5,6,7, Liang Zhu 1, Dan
A Repressor Complex Governs the Integration of
 Developmental Cell 15 Supplemental Data A Repressor Complex Governs the Integration of Flowering Signals in Arabidopsis Dan Li, Chang Liu, Lisha Shen, Yang Wu, Hongyan Chen, Masumi Robertson, Chris A.
Galina Gabriely, Ph.D. BWH/HMS
 Galina Gabriely, Ph.D. BWH/HMS Email: ggabriely@rics.bwh.harvard.edu Outline: microrna overview microrna expression analysis microrna functional analysis microrna (mirna) Characteristics mirnas discovered
Revised: RG-RV2 by Fukuhara et al.
 Supplemental Figure 1 The generation of Spns2 conditional knockout mice. (A) Schematic representation of the wild type Spns2 locus (Spns2 + ), the targeted allele, the floxed allele (Spns2 f ) and the
ASPP1 Fw GGTTGGGAATCCACGTGTTG ASPP1 Rv GCCATATCTTGGAGCTCTGAGAG
 Supplemental Materials and Methods Plasmids: the following plasmids were used in the supplementary data: pwzl-myc- Lats2 (Aylon et al, 2006), pretrosuper-vector and pretrosuper-shp53 (generous gift of
Supplementary Fig. 1 Proteomic analysis of ATR-interacting proteins. ATR, ARID1A and
 Supplementary Figure Legend: Supplementary Fig. 1 Proteomic analysis of ATR-interacting proteins. ATR, ARID1A and ATRIP protein peptides identified from our mass spectrum analysis were shown. Supplementary
USP19 modulates autophagy and antiviral immune responses by. deubiquitinating Beclin-1
 USP19 modulates autophagy and antiviral immune responses by deubiquitinating Beclin-1 Shouheng Jin 1,2,, Shuo Tian 1,, Yamei Chen 1,, Chuanxia Zhang 1,2, Weihong Xie, 1 Xiaojun Xia 3,4, Jun Cui 1,3* &
Nature Genetics: doi: /ng Supplementary Figure 1. ChIP-seq genome browser views of BRM occupancy at previously identified BRM targets.
 Supplementary Figure 1 ChIP-seq genome browser views of BRM occupancy at previously identified BRM targets. Gene structures are shown underneath each panel. Supplementary Figure 2 pref6::ref6-gfp complements
Cell line CDH1 mrna AS-paRNA S-paRNA
 a b Cell line mrna AS-paRNA S-paRNA HCT116 P53 +/+ 39.47 + + HCT116 P53 -/- 35.36 + + LNCAP 1562.4 + - MCF7 C1 1864.76 + - MCF7 C2 1812.81 + - Supplementary Figure 1. Promoter-associated transcripts at
To generate the luciferase fusion to the human 3 UTRs, we sub-cloned the 3 UTR
 Plasmids To generate the luciferase fusion to the human 3 UTRs, we sub-cloned the 3 UTR fragments downstream of firefly luciferase (luc) in pgl3 control (Promega). pgl3- CDK6 was made by amplifying a 2,886
Generation of App knock-in mice reveals deletion mutations protective against Alzheimer s. disease-like pathology. Nagata et al.
 Generation of App knock-in mice reveals deletion mutations protective against Alzheimer s disease-like pathology Nagata et al. Supplementary Fig 1. Previous App knock-in model did not show Aβ accumulation