SUPPLEMENTARY INFORMATION
|
|
|
- Alaina Perry
- 5 years ago
- Views:
Transcription

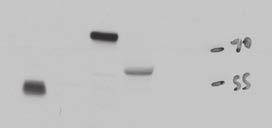
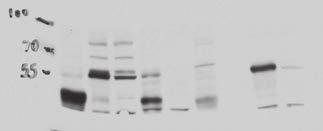
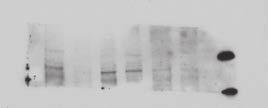
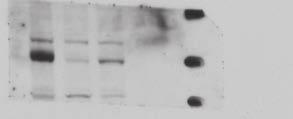
1 DOI:.38/ncb327 a b Sequence coverage (%) IP: -GFP isoform IP: GFP IP: -GFP IP: GFP Sequence coverage (%) IP: -GFP IP: GFP isoform IP: Control IP: Peptide Sequence Start End K.GVVEEWLSEFK.T 7 7 K.TLPETSLPNYATNLK.D 8 32 K.SSLVSSLYK.V 43 K.PSVYHEPSSIGSMALTESALSQHGLSK.V K.ALDDIIYR.A R.AQLELYPEPLLVANAIK.A R.CIQVEITPTSSR.I 3 3 K.RHEQPDNNNDATELGILVIPEISVTNVAGER.T R.TLGEIDAQHIQGVQETATDPR.T K.MMEDGINSPGR.V c WT KO d Human Macaque brain brain G W G W Human fibro. C P IB: Supplementary Figure /B are identified as interaction partners of /B, and is expressed as two splice forms, with the 58 splice form the major form in mammalian brain. (a) HeLa cells stably expressing -GFP, -GFP, or GFP only were subjected to GFP immunoprecipitation. The purified proteome was digested and analyzed by LC-MS/MS, and peptide and protein identities were determined using MaxQuant. Shown is the sequence coverage of (left) and (right) from two separate experiments: -GFP vs. GFP IP (black bars) and -GFP vs. GFP IP (white bars). (b) Top, Domain cartoon of the two splice forms of (isoform, 58 corresponding to NCBI NP_59.2; isoform 2, 47, corresponding to NCBI XP_ ), with regions common to both splice isoforms in cyan and regions unique to each splice isoform in yellow (isoform ) and magenta (isoform 2). Bottom, Confirmation of the identity of the 47 splice form. Immunoprecipitations using an anti- antibody raised against residues 2-38 of human or a negative control (rabbit IgG) were performed from lysates of primary human skin fibroblasts and analyzed by SDS-PAGE followed by staining. The band at ~47 in the anti- sample was excised and analyzed by mass spectrometry. Shown is the list of identified peptides; those colored in magenta are unique to isoform 2 (XP_ ). (c) Immunoblot analysis of from lysates from lung of wild-type (WT) and knockout (KO) mice. (d) Immunoblot analysis of in lysates from gray matter (G) and adjacent white matter (W) samples from human or macaque brain (parietal cortex) and control (C) or patient-derived, -deficient (P) primary human skin fibroblasts, demonstrating that isoform is the major form in brain, and isoform 2 is the major form in skin fibroblasts. Arrowheads denote background bands at ~43 in mouse lung (c) and ~57 in fibroblasts (d). Shown are representative immunoblots from three independent experiments.


 either")
.")

2 a b GFP--N mcherry GFP--N mcherry GFP--N PM-mCherry GFP--N PM-mCherry -GFP mcherry -GFP mcherry -GFP PM-mCherry -GFP PM-mCherry + and Supplementary Figure 2 is a soluble, cytosolic protein that is recruited to the plasma membrane by and. COS-7 cells were transfected with the indicated combinations of the following plasmids: GFP--N, -GFP, soluble mcherry (mcherry), a plasma membrane-targeted mcherry containing the first residues of Lyn kinase (PM-mCherry) either alone (a) or in combination with -HA and -mtagbfp (b). The cells were imaged live by confocal microscopy; shown are single z-plane images. Scale bars, 2 µm. 2

 were purified by anti-flag affinity chromatography and analyzed by SDS- PAGE, staining with blue.")
 Top, Experimental electron density map, contoured at.σ, into which the initial model was built.")
.")
3 a : KD WT : + + -N: + b c -N C57R L53P Supplementary Figure 3 Purification of PI4KIIIa complexes for in vitro kinase assay and representative electron density maps for the -N/ crystal structure. (a) 3xFLAG-tagged PI4KIIIa (wild-type or a kinase-dead point mutant) were expressed in Expi293 cells alone or co-expressed with or both and -N. The kinases (or kinase complexes) were purified by anti-flag affinity chromatography and analyzed by SDS- PAGE, staining with blue. Arrowhead indicates Hsp, which partially co-purified with all samples (and whose identity was verified by mass spectrometry). (b) Top, Experimental electron density map, contoured at.σ, into which the initial model was built. The map was calculated with phases from a SAD experiment after density modification and sharpened using B-factors (-3Å 2 ). The initial model before refinement is shown in green. Bottom, 2Fo-Fc map of the same region, contoured at.σ, with B-factor sharpening (-3Å 2 ). The refined model is shown in green. (c) Point mutations in that underlie HCC are indicated in the /-N structure. Most of the disease-causing mutations in result in premature termination; two known disease-causing missense mutations (L53P and C57R), indicated here, likely cause misfolding. 3
 Control Patient 2 µm e Oligo Neu WT KO WT KO Oligo Neu CNPase NeuN -5-4 -3-2 log 2 (KO/WT) Supplementary Figure 4 Biochemical evidence for defects in")
.")
4 a log 2 (Patient/Control) log 2 (Oligodendrocyte/Neuron) 5 b -GFP: + Control Patient log 2 (KO/WT Brain) log 2 (KO/WT Optic Nerve) c 4 d 2 Relative expression α-pi4p (Plasma membrane) Control Patient 2 µm e Oligo Neu WT KO WT KO Oligo Neu CNPase NeuN log 2 (KO/WT) Supplementary Figure 4 Biochemical evidence for defects in PI4KIIIa function in HCC fibroblasts and KO mice. (a) Quantification of changes in protein levels shown in Fig. 5. Shown are the ratios of protein levels between the two indicated samples from immunoblots in Fig. 5, quantified using densitometry. Top left, HCC patient and control fibroblasts (Fig. 5a)., PI4KIIIa, p =.49;, p =.26;, p =.8;, p =.3;, p =.9;, p =.; n = 3 independent experiments (with 3 total technical replicates for all, except 4 for PI4KIIIa). Top right, Primary cultured oligodendrocytes and cortical neurons (Fig. 5d)., PI4KIIIa, p =.9;, p =.43;, p =.48;, p =.27; n = 2 independent experiments (with 2 total technical replicates for all, except 5 for PI4KIIIa and 4 for ). Bottom left, KO and WT mouse brain (Fig. 5e).,, p =.2;, p =.3;, p =.24; n = 3 independent experiments (with 3 total technical replicates for all, except 4 for PI4KIIIa and 5 for ). Bottom right, KO and WT mouse optic nerve (Fig. 5f).,, p =.8;, p =.;, p =.56; n = 2 independent experiments (with 2 total technical replicates for all, except 3 for,, and ). Significance was calculated using either an unpaired two-tailed Student s t-test with equal variance (top left) or a two-tailed, paired ratio t-test (all others). Error bars represent standard deviation. (b) Rescue of PI4KIIIa complex levels in HCC patient fibroblasts by expression of -GFP. Immunoblot (IB) analysis of PI4KIIIa complex components in lysates from control fibroblasts or HCC patient fibroblasts transduced with either a control lentivirus ( ) or lentivirus containing a C-terminally tagged construct corresponding to isoform 2, the major form in fibroblasts (see Supplementary Fig. d). Shown are representative immunoblots from three independent experiments. (c) mrna is more abundant than mrna in human fibroblasts. cdna from human fibroblasts was analyzed by qrt-pcr using primers specific to and. Shown are relative amounts of to, with value normalized to (two-tailed, Student s t-test, unequal variance, p =.4; n = 3 independent experiments). Error bars represent standard deviation. (d) Plasma membrane PI4P levels are reduced in HCC fibroblasts. Immunofluorescence analysis of the plasma membrane pool of PI4P, using an anti-pi4p antibody, in control and HCC patient fibroblasts. Shown are representative average intensity projection images of a confocal z-stack. Quantification and statistical information is provided in Fig. 5c. (e) KO results in a more severe impact on PI4KIIIa complex levels in oligodendrocytes compared to neuronal cells. Left, Immunoblot analysis of PI4KIIIa complex components in cells of the oligodendrocyte (Oligo) and neuronal (Neu) lineage that were immunoisolated from wildtype and KO mice at postnatal day 8. Right, Quantification of these immunoblots, showing the relative amount of each PI4KIIIa complex component in the corresponding cell type in KO compared to in wild-type. Black bars, oligodendrocytes; gray bars, neuronal cells. Two-tailed Student s t-test, unequal variance,, PI4KIIIa: p =.68. : p =.5. : p =.457. : p =.4. : p =.62. : p =.6; n = 3 biological replicates (3 total technical replicates for all, except 4 for PI4KIIIa). Error bars represent standard deviation. 4
, optic nerve, and sagittal sections of two regions of the central area")
5 Supplementary Figure 5 Morphological analysis of myelination in KO and control mice. Light and transmission electron micrographs of myelin in transverse sections of spinal cord (ventral funiculus cervical region), optic nerve, and sagittal sections of two regions of the central area of corpus callosum from WT and KO male mice at age P5. No substantial differences in extent of myelination between the two genotypes can be observed. (a) Representative light microscopy images of semithin ( µm) sections, stained with toluidine blue. (b) Representative transmission electron microscopy images of ultrathin sections (6 nm) contrasted with osmium tetroxide and uranyl acetate. Shown are representative images (n = 3 KO mice; n = 2 WT littermate control mice). Scale bars: 2 µm (a); 2 µm (b). 5
 Fig.")
 75 5 37 Fig.")


6 Fig. b (top) Fig. b (bottom) Fig. d 5 GFP () FLAG () MYC () HA () Fig. 3a 5 Fig. 3b Fig. 5d Fig. 5a Fig. 5e Fig. 5f MBP SYP MBP 5 5 Supplementary Figure 6 Original scans of immunoblots and -stained gels included in Figures, 3, and 5 and Supplementary Figures, 3, and


7 Supplementary Fig. b Supplementary Fig. 4b Supplementary Fig. c Supplementary Fig. 4e Supplementary Fig. d CNPase NeuN Supplementary Fig. 3 Supplementary Figure 6 continued 7
8 Supplementary Table Legends Supplementary Table Mass spectrometry data for -GFP and -GFP immunoprecipitation. Shown are the average peptide intensities (LFQ) for each protein detected in the different replicates (-GFP vs. GFP or -GFP vs. GFP), the number of total peptides, unique peptides, statistical p value (two-tailed Student s t-test, unequal variance), and the log 2 of the abundance ration. n = 3 independent experiments. Supplementary Table 2 Data collection and refinement statistics. Shown are the data collection and refinement statistics for the -N/ crystal structure. Numbers in parentheses represent values in the highest resolution shell. 8
Supplementary Figure 1. α-synuclein is truncated in PD and LBD brains. Nature Structural & Molecular Biology: doi: /nsmb.
 Supplementary Figure 1 α-synuclein is truncated in PD and LBD brains. (a) Specificity of anti-n103 antibody. Anti-N103 antibody was coated on an ELISA plate and different concentrations of full-length
GFP CCD2 GFP IP:GFP
 D1 D2 1 75 95 148 178 492 GFP CCD1 CCD2 CCD2 GFP D1 D2 GFP D1 D2 Beclin 1 IB:GFP IP:GFP Supplementary Figure 1: Mapping domains required for binding to HEK293T cells are transfected with EGFP-tagged mutant
Supplementary Figure 1. APP cleavage assay. HEK293 cells were transfected with various
 Supplementary Figure 1. APP cleavage assay. HEK293 cells were transfected with various GST-tagged N-terminal truncated APP fragments including GST-APP full-length (FL), APP (123-695), APP (189-695), or
Supplemental Information. Pacer Mediates the Function of Class III PI3K. and HOPS Complexes in Autophagosome. Maturation by Engaging Stx17
 Molecular Cell, Volume 65 Supplemental Information Pacer Mediates the Function of Class III PI3K and HOPS Complexes in Autophagosome Maturation by Engaging Stx17 Xiawei Cheng, Xiuling Ma, Xianming Ding,
Supplementary Table 1. The Q-PCR primer sequence is summarized in the following table.
 Supplementary Table 1. The Q-PCR primer sequence is summarized in the following table. Name Sequence (5-3 ) Application Flag-u ggactacaaggacgacgatgac Shared upstream primer for all the amplifications of
Supplementary Figure S1. N-terminal fragments of LRRK1 bind to Grb2.
 Myc- HA-Grb2 Mr(K) 105 IP HA 75 25 105 1-1163 1-595 - + - + - + 1164-1989 Blot Myc HA total lysate 75 25 Myc HA Supplementary Figure S1. N-terminal fragments of bind to Grb2. COS7 cells were cotransfected
Sarker et al. Supplementary Material. Subcellular Fractionation
 Supplementary Material Subcellular Fractionation Transfected 293T cells were harvested with phosphate buffered saline (PBS) and centrifuged at 2000 rpm (500g) for 3 min. The pellet was washed, re-centrifuged
supplementary information
 DOI: 10.1038/ncb2116 Figure S1 CDK phosphorylation of EZH2 in cells. (a) Comparison of candidate CDK phosphorylation sites on EZH2 with known CDK substrates by multiple sequence alignments. (b) CDK1 and
SUPPLEMENTARY INFORMATION
 DOI: 10.1038/ncb3363 Supplementary Figure 1 Several WNTs bind to the extracellular domains of PKD1. (a) HEK293T cells were co-transfected with indicated plasmids. Flag-tagged proteins were immunoprecipiated
Figure 1: TDP-43 is subject to lysine acetylation within the RNA-binding domain a) QBI-293 cells were transfected with TDP-43 in the presence or
 QBI-293 cells were transfected with TDP-43 in the presence or") Figure 1: TDP-43 is subject to lysine acetylation within the RNA-binding domain a) QBI-293 cells were transfected with TDP-43 in the presence or absence of the acetyltransferase CBP and acetylated TDP-43
Figure 1: TDP-43 is subject to lysine acetylation within the RNA-binding domain a) QBI-293 cells were transfected with TDP-43 in the presence or absence of the acetyltransferase CBP and acetylated TDP-43
Supplementary Fig. 1 Identification of Nedd4 as an IRS-2-associated protein in camp-treated FRTL-5 cells.
 Supplementary Fig. 1 Supplementary Fig. 1 Identification of Nedd4 as an IRS-2-associated protein in camp-treated FRTL-5 cells. (a) FRTL-5 cells were treated with 1 mm dibutyryl camp for 24 h, and the lysates
T H E J O U R N A L O F C E L L B I O L O G Y
 T H E J O U R N A L O F C E L L B I O L O G Y Supplemental material Han et al., http://www.jcb.org/cgi/content/full/jcb.201311007/dc1 Figure S1. SIVA1 interacts with PCNA. (A) HEK293T cells were transiently
At E17.5, the embryos were rinsed in phosphate-buffered saline (PBS) and immersed in
 and immersed in") Supplementary Materials and Methods Barrier function assays At E17.5, the embryos were rinsed in phosphate-buffered saline (PBS) and immersed in acidic X-gal mix (100 mm phosphate buffer at ph4.3, 3 mm
Supplementary Materials and Methods Barrier function assays At E17.5, the embryos were rinsed in phosphate-buffered saline (PBS) and immersed in acidic X-gal mix (100 mm phosphate buffer at ph4.3, 3 mm
T H E J O U R N A L O F C E L L B I O L O G Y
 T H E J O U R N A L O F C E L L B I O L O G Y Supplemental material Kanaani et al., http://www.jcb.org/cgi/content/full/jcb.200912101/dc1 Figure S1. The K2 rabbit polyclonal antibody is specific for GAD67,
Xu et al., Supplementary Figures 1-7
 Xu et al., Supplementary Figures 1-7 Supplementary Figure 1. PIPKI is required for ciliogenesis. (a) PIPKI localizes at the basal body of primary cilium. RPE-1 cells treated with two sirnas targeting to
Supplementary Figure 1 Phosphorylated tau accumulates in Nrf2 (-/-) mice. Hippocampal tissues obtained from Nrf2 (-/-) (10 months old, 4 male; 2
 mice. Hippocampal tissues obtained from Nrf2 (-/-) (10 months old, 4 male; 2") Supplementary Figure 1 Phosphorylated tau accumulates in Nrf2 (-/-) mice. Hippocampal tissues obtained from Nrf2 (-/-) (10 months old, 4 male; 2 female) or wild-type (5 months old, 1 male; 11 months old,
Supplementary Figure 1 Phosphorylated tau accumulates in Nrf2 (-/-) mice. Hippocampal tissues obtained from Nrf2 (-/-) (10 months old, 4 male; 2 female) or wild-type (5 months old, 1 male; 11 months old,
T H E J O U R N A L O F C E L L B I O L O G Y
 T H E J O U R N A L O F C E L L B I O L O G Y Supplemental material Nakajima and Tanoue, http://www.jcb.org/cgi/content/full/jcb.201104118/dc1 Figure S1. DLD-1 cells exhibit the characteristic morphology
SUPPLEMENTARY INFORMATION
 doi:10.1038/nature09732 Supplementary Figure 1: Depletion of Fbw7 results in elevated Mcl-1 abundance. a, Total thymocytes from 8-wk-old Lck-Cre/Fbw7 +/fl (Control) or Lck-Cre/Fbw7 fl/fl (Fbw7 KO) mice
SUPPLEMENTARY INFORMATION
 DOI: 10.1038/ncb2271 Supplementary Figure a! WM266.4 mock WM266.4 #7 sirna WM266.4 #10 sirna SKMEL28 mock SKMEL28 #7 sirna SKMEL28 #10 sirna WM1361 mock WM1361 #7 sirna WM1361 #10 sirna 9 WM266. WM136
Supplemental Figure 1 Human REEP family of proteins can be divided into two distinct subfamilies. Residues (single letter amino acid code) identical
 identical") Supplemental Figure Human REEP family of proteins can be divided into two distinct subfamilies. Residues (single letter amino acid code) identical in all six REEPs are highlighted in green. Additional
Supplemental Figure Human REEP family of proteins can be divided into two distinct subfamilies. Residues (single letter amino acid code) identical in all six REEPs are highlighted in green. Additional
SUPPLEMENTARY INFORMATION
 DOI: 10.1038/ncb2386 Figure 1 Src-containing puncta are not focal adhesions, podosomes or endosomes. (a) FAK-/- were stained with anti-py416 Src (green) and either (in red) the focal adhesion protein paxillin,
Parthanatos mediates AIMP2-activated age-dependent dopaminergic neuronal loss
 SUPPLEMENTARY INFORMATION Parthanatos mediates AIMP2-activated age-dependent dopaminergic neuronal loss Yunjong Lee, Senthilkumar S. Karuppagounder, Joo-Ho Shin, Yun-Il Lee, Han Seok Ko, Debbie Swing,
Figure S1. Sequence alignments of ATRIP and ATR TopBP1 interacting regions.
 A H. sapiens 204 TKLQTS--ERANKLAAPSVSH VSPRKNPSVVIKPEACS-PQFGKTSFPTKESFSANMS LP 259 B. taurus 201 TKLQSS--ERANKLAVPTVSH VSPRKSPSVVIKPEACS-PQFGKPSFPTKESFSANKS LP 257 M. musculus 204 TKSQSN--GRTNKPAAPSVSH
Supplementary Figure 1: Expression of RNF8, HERC2 and NEURL4 in the cerebellum and knockdown of RNF8 by RNAi (a) Lysates of the cerebellum from rat
 Lysates of the cerebellum from rat") Supplementary Figure 1: Expression of RNF8, HERC2 and NEURL4 in the cerebellum and knockdown of RNF8 by RNAi (a) Lysates of the cerebellum from rat pups at P6, P14, P22, P30 and adult (A) rats were subjected
Supplementary Figure 1: Expression of RNF8, HERC2 and NEURL4 in the cerebellum and knockdown of RNF8 by RNAi (a) Lysates of the cerebellum from rat pups at P6, P14, P22, P30 and adult (A) rats were subjected
Supplemental Figure S1. PGRN Binding to Sortilin.
 1 Neuron, volume 68 Supplemental Data Sortilin-Mediated Endocytosis Determines Levels of the Frontotemporal Dementia Protein, Progranulin Fenghua Hu, Thihan Padukkavidana, Christian B. Vægter, Owen A.
This is the author's accepted version of the manuscript.
 This is the author's accepted version of the manuscript. The definitive version is published in Nature Communications Online Edition: 2015/4/16 (Japan time), doi:10.1038/ncomms7780. The final version published
Supplementary Figure 1. Espn-1 knockout characterization. (a) The predicted recombinant Espn-1 -/- allele was detected by PCR of the left (5 )
 The predicted recombinant Espn-1 -/- allele was detected by PCR of the left (5 )") Supplementary Figure 1. Espn-1 knockout characterization. (a) The predicted recombinant Espn-1 -/- allele was detected by PCR of the left (5 ) homologous recombination arm (left) and of the right (3 )
Supplementary Figure 1. Espn-1 knockout characterization. (a) The predicted recombinant Espn-1 -/- allele was detected by PCR of the left (5 ) homologous recombination arm (left) and of the right (3 )
Revision Checklist for Science Signaling Research Manuscripts: Data Requirements and Style Guidelines
 Revision Checklist for Science Signaling Research Manuscripts: Data Requirements and Style Guidelines Further information can be found at: http://stke.sciencemag.org/sites/default/files/researcharticlerevmsinstructions_0.pdf.
Supplementary Figure 1 Collision-induced dissociation (CID) mass spectra of peptides from PPK1, PPK2, PPK3 and PPK4 respectively.
 mass spectra of peptides from PPK1, PPK2, PPK3 and PPK4 respectively.") Supplementary Figure 1 lision-induced dissociation (CID) mass spectra of peptides from PPK1, PPK, PPK3 and PPK respectively. % of nuclei with signal / field a 5 c ppif3:gus pppk1:gus 0 35 30 5 0 15 10
Supplementary Figure 1 lision-induced dissociation (CID) mass spectra of peptides from PPK1, PPK, PPK3 and PPK respectively. % of nuclei with signal / field a 5 c ppif3:gus pppk1:gus 0 35 30 5 0 15 10
SUPPLEMENTARY INFORMATION
 doi: 10.1038/nature06147 SUPPLEMENTARY INFORMATION Figure S1 The genomic and domain structure of Dscam. The Dscam gene comprises 24 exons, encoding a signal peptide (SP), 10 IgSF domains, 6 fibronectin
Figure S1. Verification of ihog Mutation by Protein Immunoblotting Figure S2. Verification of ihog and boi
 Figure S1. Verification of ihog Mutation by Protein Immunoblotting Extracts from S2R+ cells, embryos, and adults were analyzed by immunoprecipitation and immunoblotting with anti-ihog antibody. The Ihog
Engineering splicing factors with designed specificities
 nature methods Engineering splicing factors with designed specificities Yang Wang, Cheom-Gil Cheong, Traci M Tanaka Hall & Zefeng Wang Supplementary figures and text: Supplementary Figure 1 Supplementary
SUPPLEMENTARY INFORMATION
 SUPPLEMENTARY INFORMATION Dynamic Phosphorylation of HP1 Regulates Mitotic Progression in Human Cells Supplementary Figures Supplementary Figure 1. NDR1 interacts with HP1. (a) Immunoprecipitation using
Growth factor, augmenter of liver regeneration
 Supplemental Table 1: Human and mouse PC1 sequence equivalencies Human Mouse Domain Clinical significance; Score* PolyPhen prediction; PSIC score difference C210G C210G WSC Highly likely pathogenic; 15
Supplementary Material for Yang et al., Generation of oligodendroglial cells by direct lineage conversion
 Supplementary Material for Yang et al., Generation of oligodendroglial cells by direct lineage conversion Supplementary Figure 1. The presence of Plp::EGFP + /O4 + cells 21 days after transgene induction.
SUPPLEMENTARY INFORMATION
 DOI: 10.1038/ncb3240 Supplementary Figure 1 GBM cell lines display similar levels of p100 to p52 processing but respond differentially to TWEAK-induced TERT expression according to TERT promoter mutation
TRIM31 is recruited to mitochondria after infection with SeV.
 Supplementary Figure 1 TRIM31 is recruited to mitochondria after infection with SeV. (a) Confocal microscopy of TRIM31-GFP transfected into HEK293T cells for 24 h followed with SeV infection for 6 h. MitoTracker
DRG Pituitary Cerebral Cortex
 Liver Spinal cord Pons Atg5 -/- Atg5 +/+ DRG Pituitary Cerebral Cortex WT KO Supplementary Figure S1 Ubiquitin-positive IBs accumulate in Atg5 -/- tissues. Atg5 -/- neonatal tissues were fixed and decalcified.
SUPPLEMENTARY INFORMATION
 DOI: 10.1038/ncb3209 Supplementary Figure 1 IR induces the association of FH with chromatin. a, U2OS cells synchronized by thymidine double block (2 mm) underwent no release (G1 phase) or release for 2
Supplementary Figure 1 PARP1 is involved in regulating the stability of mrnas from pro-inflammatory cytokine/chemokine mediators.
 Supplementary Figure 1 PARP1 is involved in regulating the stability of mrnas from pro-inflammatory cytokine/chemokine mediators. (a) A graphic depiction of the approach to determining the stability of
Stargazin regulates AMPA receptor trafficking through adaptor protein. complexes during long term depression
 Supplementary Information Stargazin regulates AMPA receptor trafficking through adaptor protein complexes during long term depression Shinji Matsuda, Wataru Kakegawa, Timotheus Budisantoso, Toshihiro Nomura,
Supplementary Materials for
 www.sciencesignaling.org/cgi/content/full/3/146/ra80/dc1 Supplementary Materials for DNMT1 Stability Is Regulated by Proteins Coordinating Deubiquitination and Acetylation-Driven Ubiquitination Zhanwen
Supplementary Table 1. Primers used to construct full-length or various truncated mutants of ISG12b2.
 Supplementary Table 1. Primers used to construct full-length or various truncated mutants of ISG12b2. Construct name ISG12b2 (No tag) HA-ISG12b2 (N-HA) ISG12b2-HA (C-HA; FL-HA) 94-283-HA (FL-GFP) 93-GFP
(a) Scheme depicting the strategy used to generate the ko and conditional alleles. (b) RT-PCR for
 Scheme depicting the strategy used to generate the ko and conditional alleles. (b) RT-PCR for") Supplementary Figure 1 Generation of Diaph3 ko mice. (a) Scheme depicting the strategy used to generate the ko and conditional alleles. (b) RT-PCR for different regions of Diaph3 mrna from WT, heterozygote
Supplementary Figure 1 Generation of Diaph3 ko mice. (a) Scheme depicting the strategy used to generate the ko and conditional alleles. (b) RT-PCR for different regions of Diaph3 mrna from WT, heterozygote
Supplementary Fig. S1. SAMHD1c has a more potent dntpase activity than. SAMHD1c. Purified recombinant SAMHD1c and SAMHD1c proteins (with
 Supplementary Fig. S1. SAMHD1c has a more potent dntpase activity than SAMHD1c. Purified recombinant SAMHD1c and SAMHD1c proteins (with concentration of 800nM) were incubated with 1mM dgtp for the indicated
Rer1 and calnexin regulate endoplasmic reticulum retention of a peripheral myelin protein 22 mutant that causes type 1A Charcot-Marie-Tooth disease
 Rer1 and calnexin regulate endoplasmic reticulum retention of a peripheral myelin protein mutant that causes type 1A Charcot-Marie-Tooth disease Taichi Hara, Yukiko Hashimoto, Tomoko Akuzawa, Rika Hirai,
SUPPLEMENTARY INFORMATION
 DOI: 1.1/ncb2918 Supplementary Figure 1 (a) Biotin-dUTP labelling does not affect S phase progression. Cells synchronized in mid-s phase were labelled with biotindutp during a 5 min hypotonic shift (red)
Table S1. Primers used in the study
 Table S1. Primers used in the study Primer name Application Sequence I1F16 Genotyping GGCAAGTGAGTGAGTGCCTA I1R11 Genotyping CCCACTCGTATTGACGCTCT V19 Genotyping GGGTCTCAAAGTCAGGGTCA D18Mit184-F Genotyping
Supplementary Figure 1. Confirmation of sirna in PC3 and H1299 cells PC3 (a) and H1299 (b) cells were transfected with sirna oligonucleotides
 and H1299 (b) cells were transfected with sirna oligonucleotides") Supplementary Figure 1. Confirmation of sirna in PC3 and H1299 cells PC3 (a) and H1299 (b) cells were transfected with sirna oligonucleotides targeting RCP (SMARTPool (RCP) or two individual oligos (RCP#1
Supplementary Figure 1. Confirmation of sirna in PC3 and H1299 cells PC3 (a) and H1299 (b) cells were transfected with sirna oligonucleotides targeting RCP (SMARTPool (RCP) or two individual oligos (RCP#1
Regulation of axonal and dendritic growth by the extracellular calcium-sensing
 Regulation of axonal and dendritic growth by the extracellular calcium-sensing receptor (CaSR). Thomas N. Vizard, Gerard W. O Keeffe, Humberto Gutierrez, Claudine H. Kos, Daniela Riccardi, Alun M. Davies
SUPPLEMENTAL MATERIAL. Supplemental Methods:
 SUPPLEMENTAL MATERIAL Supplemental Methods: Immunoprecipitation- As we described but with some modifications [22]. As part of another ongoing project, lysate from human umbilical vein endothelial cells
Supplementary Figure 1 Pfn1, but not other Pfn isoforms are expressed in
 Supplementary Figure 1 Pfn1, but not other Pfn isoforms are expressed in platelets. (a) RT-PCR of Pfn isoforms in control mouse platelets, Pfn1 -/- platelets and control heart. Expected band size for Pfn1
T H E J O U R N A L O F C E L L B I O L O G Y
 T H E J O U R N A L O F C E L L B I O L O G Y Supplemental material Rainero et al., http://www.jcb.org/cgi/content/full/jcb.201109112/dc1 Figure S1. The expression of DGK- is reduced upon transfection
transcription and the promoter occupancy of Smad proteins. (A) HepG2 cells were co-transfected with the wwp-luc reporter, and FLAG-tagged FHL1,
 HepG2 cells were co-transfected with the wwp-luc reporter, and FLAG-tagged FHL1,") Supplementary Data Supplementary Figure Legends Supplementary Figure 1 FHL-mediated TGFβ-responsive reporter transcription and the promoter occupancy of Smad proteins. (A) HepG2 cells were co-transfected
Supplementary Data Supplementary Figure Legends Supplementary Figure 1 FHL-mediated TGFβ-responsive reporter transcription and the promoter occupancy of Smad proteins. (A) HepG2 cells were co-transfected
Supplementary Materials
 Supplementary Materials Supplementary Figure 1. PKM2 interacts with MLC2 in cytokinesis. a, U87, U87/EGFRvIII, and HeLa cells in cytokinesis were immunostained with DAPI and an anti-pkm2 antibody. Thirty
Supplementary Figure 1. Nature Structural & Molecular Biology: doi: /nsmb.3494
 Supplementary Figure 1 Pol structure-function analysis (a) Inactivating polymerase and helicase mutations do not alter the stability of Pol. Flag epitopes were introduced using CRISPR/Cas9 gene targeting
monoclonal antibody. (a) The specificity of the anti-rhbdd1 monoclonal antibody was examined in
 The specificity of the anti-rhbdd1 monoclonal antibody was examined in") Supplementary information Supplementary figures Supplementary Figure 1 Determination of the s pecificity of in-house anti-rhbdd1 mouse monoclonal antibody. (a) The specificity of the anti-rhbdd1 monoclonal
Supplementary information Supplementary figures Supplementary Figure 1 Determination of the s pecificity of in-house anti-rhbdd1 mouse monoclonal antibody. (a) The specificity of the anti-rhbdd1 monoclonal
Supplementary Figure 1. TSA (10 nmol/l), non-class-selective HDAC inhibitor, potentiates
, non-class-selective HDAC inhibitor, potentiates") Supplementary Figure 1. TSA (10 nmol/l), non-class-selective HDAC inhibitor, potentiates vascular calcification (VC). (a) Von Kossa staining shows that TSA potentiated the Pi-induced VC. Scale bar, 100
Supplementary Figure 1. TSA (10 nmol/l), non-class-selective HDAC inhibitor, potentiates vascular calcification (VC). (a) Von Kossa staining shows that TSA potentiated the Pi-induced VC. Scale bar, 100
Supplementary Fig. 1 Proteomic analysis of ATR-interacting proteins. ATR, ARID1A and
 Supplementary Figure Legend: Supplementary Fig. 1 Proteomic analysis of ATR-interacting proteins. ATR, ARID1A and ATRIP protein peptides identified from our mass spectrum analysis were shown. Supplementary
SUPPLEMENTARY INFORMATION
 SUPPLEMENTARY INFORMATION Supplementary figures Supplementary Figure 1: Suv39h1, but not Suv39h2, promotes HP1α sumoylation in vivo. In vivo HP1α sumoylation assay. Top: experimental scheme. Middle: we
Supplementary Figure S1 Purification of deubiquitinases HEK293 cells were transfected with the indicated DUB-expressing plasmids.
 Supplementary Figure S1 Purification of deubiquitinases HEK293 cells were transfected with the indicated DUB-expressing plasmids. The cells were harvested 72 h after transfection. FLAG-tagged deubiquitinases
Supplementary Materials for
 www.sciencesignaling.org/cgi/content/full/8/404/ra120/dc1 Supplementary Materials for The subcellular localization and activity of cortactin is regulated by acetylation and interaction with Keap1 Akihiro
Expanded View Figures
 Expanded View Figures Figure EV1. AM3-CLE45 control experiments and bam3 alleles. A Relative primary root length of indicated genotypes at 9 dag, in response to increasing amounts of CLE45 in the media.
Supplementary Figure S1. Immunodetection of full-length XA21 and the XA21 C-terminal cleavage product.
 Supplementary Information Supplementary Figure S1. Immunodetection of full-length XA21 and the XA21 C-terminal cleavage product. Total protein extracted from Kitaake wild type and rice plants carrying
T H E J O U R N A L O F C E L L B I O L O G Y
 T H E J O U R N A L O F C E L L B I O L O G Y Supplemental material Feng et al., http://www.jcb.org/cgi/content/full/jcb.201408079/dc1 Figure S1. A modest elevation of disulfide-bonded K14 in primary mouse
SUPPLEMENTARY INFORMATION
 DOI: 10.1038/ncb2743 Figure S1 stabilizes cellular protein level, post-transcriptionally. (a, b) and DDR1 were RNAi-depleted from HEK.293.-CBG cells. Western blots with indicated antibodies (a). RT-PCRs
SUPPLEMENTAL FIGURES AND TABLES
 SUPPLEMENTAL FIGURES AND TABLES A B Flag-ALDH1A1 IP: α-ac HEK293T WT 91R 128R 252Q 367R 41/ 419R 435R 495R 412R C Flag-ALDH1A1 NAM IP: HEK293T + + - + D NAM - + + E Relative ALDH1A1 activity 1..8.6.4.2
Supplemental Data. Farmer et al. (2010) Plant Cell /tpc
 Plant Cell /tpc") Supplemental Figure 1. Amino acid sequence comparison of RAD23 proteins. Identical and similar residues are shown in the black and gray boxes, respectively. Dots denote gaps. The sequence of plant Ub is
Supplemental Figure 1. Amino acid sequence comparison of RAD23 proteins. Identical and similar residues are shown in the black and gray boxes, respectively. Dots denote gaps. The sequence of plant Ub is
Supplementary Information
 Supplementary Information Supplementary Figure 1: Over-expression of CD300f in NIH3T3 cells enhances their capacity to phagocytize AC. (a) NIH3T3 cells were stably transduced by EV, CD300f WT or CD300f
Supplementary Fig. 1
 a FL (1-2266) NL (1-1190) CL (1191-2266) HA-ICE1: - HA-ICE1: - - - FLAG-ICE2: + + + + FLAG-ELL: + + + + + + IP: anti-ha FLAG-ICE2 HA-ICE1-FL HA-ICE1-NL HA-ICE1-CL FLAG-ICE2 b IP: anti-ha FL (1-2266) NL
Supplementary Figure1: ClustalW comparison between Tll, Dsf and NR2E1.
 P-Box Dsf -----------------MG-TAG--DRLLD-IPCKVCGDRSSGKHYGIYSCDGCSGFFKR 39 NR2E1 -----------------MSKPAGSTSRILD-IPCKVCGDRSSGKHYGVYACDGCSGFFKR 42 Tll MQSSEGSPDMMDQKYNSVRLSPAASSRILYHVPCKVCRDHSSGKHYGIYACDGCAGFFKR
Figure S1. USP-46 is expressed in several tissues including the nervous system
 Supplemental Figure legends Figure S1. USP-46 is expressed in several tissues including the nervous system Transgenic animals expressing a transcriptional reporter (P::GFP) were imaged using epifluorescence
Supplemental Data. Sethi et al. (2014). Plant Cell /tpc
. Plant Cell /tpc") Supplemental Data Supplemental Figure 1. MYC2 Binds to the E-box but not the E1-box of the MPK6 Promoter. (A) E1-box and E-box (wild type) containing MPK6 promoter fragment. The region shown in red denotes
Supplemental Data Supplemental Figure 1. MYC2 Binds to the E-box but not the E1-box of the MPK6 Promoter. (A) E1-box and E-box (wild type) containing MPK6 promoter fragment. The region shown in red denotes
indicated numbers of pups at day of life (DOL) 10, or embryonic day (ED) B. Male mice of
 10, or embryonic day (ED) B. Male mice of") SUPPLEMENTRY FIGURE LEGENDS Figure S1. USP44 loss leads to chromosome missegregation.. Genotypes obtained from the indicated numbers of pups at day of life (DOL) 10, or embryonic day (ED) 13.5.. Male mice
SUPPLEMENTRY FIGURE LEGENDS Figure S1. USP44 loss leads to chromosome missegregation.. Genotypes obtained from the indicated numbers of pups at day of life (DOL) 10, or embryonic day (ED) 13.5.. Male mice
Hoffmann et al., http ://www.jcb.org /cgi /content /full /jcb /DC1
 Supplemental material JCB Hoffmann et al., http ://www.jcb.org /cgi /content /full /jcb.201506071 /DC1 THE JOU RNAL OF CELL BIO LOGY Figure S1. TRA IP harbors a PCNA-binding PIP box required for its recruitment
Nature Structural & Molecular Biology: doi: /nsmb.3308
 Supplementary Figure 1 Analysis of CED-3 autoactivation and CED-4-induced CED-3 activation. (a) Repeat experiments of Fig. 1a. (b) Repeat experiments of Fig. 1b. (c) Quantitative analysis of three independent
Mannen et al., http :// /cgi /content /full /jcb /DC1
 Supplemental material JCB Mannen et al., http ://www.jcb.org /cgi /content /full /jcb.201601024 /DC1 THE JOURNAL OF CELL BIOLOGY Figure S1. Characterization of SNB components. (A) SNB localization of Venus-tagged
SUPPLEMENTARY INFORMATION
 SUPPLEMENTRY INFORMTION DOI:.38/ncb Kdmb locus kb Long isoform Short isoform Long isoform Jmj XX PHD F-box LRR Short isoform XX PHD F-box LRR Target Vector 3xFlag Left H Neo Right H TK LoxP LoxP Kdmb Locus
Nature Structural & Molecular Biology: doi: /nsmb Supplementary Figure 1
 Supplementary Figure 1 Endogenous gene tagging to study subcellular localization and chromatin binding. a, b, Schematic of experimental set-up to endogenously tag RNAi factors using the CRISPR Cas9 technology,
supplementary information
 DOI: 10.1038/ncb2172 Figure S1 p53 regulates cellular NADPH and lipid levels via inhibition of G6PD. (a) U2OS cells stably expressing p53 shrna or a control shrna were transfected with control sirna or
Supplementary Materials for
 www.sciencesignaling.org/cgi/content/full/4/167/ra20/dc1 Supplementary Materials for Poly(ADP-Ribose) (PAR) Binding to Apoptosis-Inducing Factor Is Critical for PAR Polymerase-1 Dependent Cell Death (Parthanatos)
 DOI: 10.1038/ncb3259 A Ismail et al. Supplementary Figure 1 B 60000 45000 SSC 30000 15000 Live cells 0 0 15000 30000 45000 60000 FSC- PARR 60000 45000 PARR Width 30000 FSC- 15000 Single cells 0 0 15000
supplementary information
 DOI: 10.1038/ncb2156 Figure S1 Depletion of p114rhogef with different sirnas. Caco-2 (a) and HCE (b) cells were transfected with individual sirnas, pools of the two sirnas or the On Target (OnT) sirna
Hyper sensitive protein detection by Tandem-HTRF reveals Cyclin D1
 Hyper sensitive protein detection by Tandem-HTRF reveals Cyclin D1 dynamics in adult mouse Alexandre Zampieri, Julien Champagne, Baptiste Auzemery, Ivanna Fuentes, Benjamin Maurel and Frédéric Bienvenu
Supplementary information to accompany: A novel role for the DNA repair gene Rad51 in Netrin-1 signalling
 Supplementary information to accompany: A novel role for the DNA repair gene Rad51 in Netrin-1 signalling Glendining KA 1, Markie D 2, Gardner RJM 4, Franz EA 3, Robertson SP 4, Jasoni CL 1 Supplementary
Supplementary Figure 1. Processing and quality control for recombinant proteins.
 Supplementary Figure 1 Processing and quality control for recombinant proteins. (a) Schematic representation of processing of a recombinant protein library. Recombinant proteins were generated individually.
Supplemental Data. Furlan et al. Plant Cell (2017) /tpc
 /tpc") Supplemental Data. Furlan et al. Plant Cell (0) 0.0/tpc..00. Supplemental Data. Furlan et al. Plant Cell (0) 0.0/tpc..00. Supplemental Data. Furlan et al. Plant Cell (0) 0.0/tpc..00. Supplemental Figure.
Supplemental Data. Furlan et al. Plant Cell (0) 0.0/tpc..00. Supplemental Data. Furlan et al. Plant Cell (0) 0.0/tpc..00. Supplemental Data. Furlan et al. Plant Cell (0) 0.0/tpc..00. Supplemental Figure.
SUPPLEMENTARY INFORMATION
 SUPPLEMENTARY INFORMATION Supplementary Figure 1 Effect of ROCK inhibition on lumen abnormality in MDCK cysts. (A) MDCK cells as indicated cultured in Matrigel were treated with and without Y27632 (10
SUPPLEMENTAL FIGURE LEGENDS. Figure S1: Homology alignment of DDR2 amino acid sequence. Shown are
 SUPPLEMENTAL FIGURE LEGENDS Figure S1: Homology alignment of DDR2 amino acid sequence. Shown are the amino acid sequences of human DDR2, mouse DDR2 and the closest homologs in zebrafish and C. Elegans.
SUPPLEMENTARY INFORMATION
 doi:10.1038/nature12119 SUPPLEMENTARY FIGURES AND LEGENDS pre-let-7a- 1 +14U pre-let-7a- 1 Ddx3x Dhx30 Dis3l2 Elavl1 Ggt5 Hnrnph 2 Osbpl5 Puf60 Rnpc3 Rpl7 Sf3b3 Sf3b4 Tia1 Triobp U2af1 U2af2 1 6 2 4 3
T H E J O U R N A L O F C E L L B I O L O G Y
 Supplemental material Thompson et al., http://www.jcb.org/cgi/content/full/jcb.200909067/dc1 T H E J O U R N A L O F C E L L B I O L O G Y Figure S1. Modification-specific antibodies do not detect unmodified
Supplementary Figure 1. Drawing of spinal cord open-book preparations and DiI tracing. Nature Neuroscience: doi: /nn.3893
 Supplementary Figure 1 Drawing of spinal cord open-book preparations and DiI tracing. Supplementary Figure 2 In ovo electroporation of dominant-negative PlexinA1 in commissural neurons induces midline
JCB. Supplemental material THE JOURNAL OF CELL BIOLOGY. Hong et al.,
 Supplemental material JCB Hong et al., http://www.jcb.org/cgi/content/full/jcb.201412127/dc1 THE JOURNAL OF CELL BIOLOGY Figure S1. Analysis of purified proteins by SDS-PAGE and pull-down assays. (A) Coomassie-stained
SUPPLEMENTARY INFORMATION
 DOI: 10.1038/ncb3562 In the format provided by the authors and unedited. Supplementary Figure 1 Glucose deficiency induced FH-ATF2 interaction. In b-m, immunoblotting or immunoprecipitation analyses were
Xiaoqing Zhang, Guo Zhang, Hai Zhang, Michael Karin, Hua Bai, and Dongsheng Cai
 Cell, Volume 135 Supplemental Data Hypothalamic IKKβ/NF-κB and ER Stress Link Overnutrition to Energy Imbalance and Obesity Xiaoqing Zhang, Guo Zhang, Hai Zhang, Michael Karin, Hua Bai, and Dongsheng Cai
Supplementary Materials for
 advances.sciencemag.org/cgi/content/full/4/9/eaat5401/dc1 Supplementary Materials for GLK-IKKβ signaling induces dimerization and translocation of the AhR-RORγt complex in IL-17A induction and autoimmune
Nature Biotechnology: doi: /nbt Supplementary Figure 1
 Supplementary Figure 1 Schematic and results of screening the combinatorial antibody library for Sox2 replacement activity. A single batch of MEFs were plated and transduced with doxycycline inducible
Supplemental Data. Li et al. (2015). Plant Cell /tpc
. Plant Cell /tpc") Supplemental Data Supplemental Figure 1: Characterization of asr3 T-DNA knockout lines and complementation transgenic lines. (A) The scheme of At2G33550 (ASR3) with gray boxes indicating exons and dash
Supplemental Data Supplemental Figure 1: Characterization of asr3 T-DNA knockout lines and complementation transgenic lines. (A) The scheme of At2G33550 (ASR3) with gray boxes indicating exons and dash
Nature Immunology: doi: /ni Supplementary Figure 1
 Supplementary Figure 1 Sox2 localizes in neutrophils of mouse spleen. (a) Microscopy analysis of Sox2 and MPO in wild-type mouse spleen. Nucl, nucleus. (b) Immunohistochemistry staining of Sox2 and MPO
A RRM1 H2AX DAPI. RRM1 H2AX DAPI Merge. Cont. sirna RRM1
 A H2AX DAPI H2AX DAPI Merge Cont sirna Figure S1: Accumulation of RRM1 at DNA damage sites (A) HeLa cells were subjected to in situ detergent extraction without IR irradiation, and immunostained with the