Watershed Modeling and Biomonitoring to Determine Optimal Restoration Strategies for Intermitted Transboundary Streams between Palestine and Israel
|
|
|
- Victor Rich
- 5 years ago
- Views:
Transcription
1 Watershed Modeling and Biomonitoring to Determine Optimal Restoration Strategies for Intermitted Transboundary Streams between Palestine and Israel Prepared by Dr. Amjad Aliewi Eng. Muath Abu Sadah Eng. Amjad Assi House of Water and Environment
2 Stage One : Selection the Monitored Streams The Palestinian-Israeli research teams selected sites and streams. They drew up an inventory of wastewater treatment facilities discharging into the transboundary streams, finalized monitoring protocols and a timetable. The selected streams in the two catchments are:- Alexander Catchment: (Wadi Alexander Wadi Zeimar and Wadi Al Teen) in the North of the West Bank. Besor Catchment: (Wadi Hebron) in the South of the West Bank. It has been decided that we are going to model Wadi Zeimar and Wadi W Al Teen in Alexander Catchment.
3 Three main sub basins (Zeimar, Wadi Teen and Alexander) were defined to be modeled.
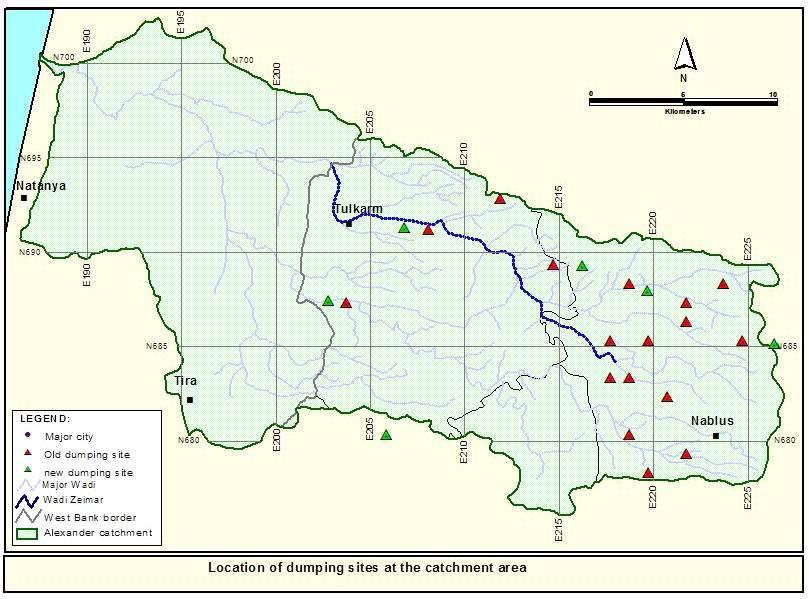
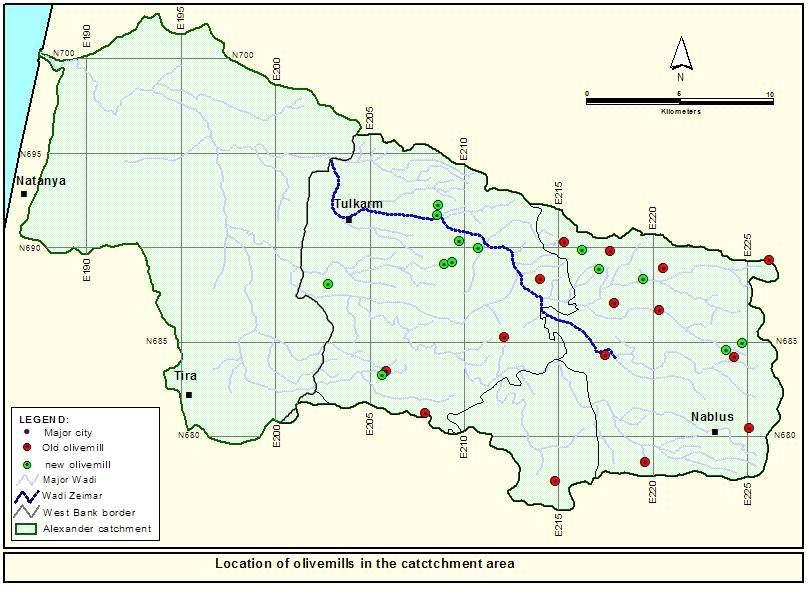
4 Stage Two : Collection and Inventory of all Available Monitoring Data The main flow of Wadi Zeimar is wastewater discharged from the localities l along the wadi mainly from Nablus City (in winter, the wastewater r mixes with rainfall runoff), so the following data were collected: Wastewater generation from the Palestinian localities and Israeli Settlements. Their water quality. There are many point sources of pollution in Alexander Catchment that are highly polluting the water, these: Stone cutting. Dumping Sites (mainly Tulkarem Dumping Site). Olive mills. Gas Stations. Cesspits. The coordinates of most of these point sources of pollution were determined by using MAGELLAN /explorist 100 GPS, with accuracy ranges between 3-20 meters.

5 Tulkarem Dumping Site

6 The Effect of Stone Cutting
7 Wastewater Wadis as Hotspots Wastewater Wadis Versus wells Effect of Zeimar on GW in the WAB Wadis affect wells of Eastern Basin (AL FAR A)

8 Discharge Points of Cesspits Intensive, could affect water quality specially for shallow aquifers such as Pleistocene in Jericho, Eocene in Jenin and Quaternary in Qalqilya and Tulkarem

9 Location of the Dumping Sites Characterized by diversity of pollutants from the solid wastes

10 Location of the WW Networks There are just some points of sewer discharge points from networks, But with relatively high discharge since they are connected to the main cities.
11 Pollution inputs in relation to Abstractions Hazard hot spots occur where pollution sources are in sensitive areas in proximity to abstractions

12 Locations of Gas stations, quarries, dumping sites and olive mills in the WB

13
14
15

16

17 Stage Three : Preparing Data-base Framework The collected data are to be organized in a dada-base framework as shown below

18 Table 1 (WatershedDB): Watershed database, Contains information of all sub-watersheds within the main watershed.
 database")
19 Table 2 (ReachDB): Reach (river segment) database
 within the main")
20 Table 3 (RchGeometryDB): Geometrical description of Reachs (river segments) within the main watershed

21 Table 4 (StructDB): Structural database: Locations and Description of all structures within all reaches. ALX024 ALX02402


22 Table 5 (PointPolDB): point source of pollution database: Locations and pollution loads of all point sources of pollutions within watershed.


23 Table 6 (NONPointPolDB): non-point source of pollution database: Locations and pollution load rates of all non-point source of pollutions within watershed.


24 Table 7 (UrbanDB): Urban areas database: Locations of urban areas within watershed.


25 Table 8 (LanduseDB): Landuse database

:")
26 Table 9 (MntrStationsDB): Location of Monitoring stations Table 10 (SamplingBial): Biological Sampling
:")

27 Table 11 (SamplingChem): Chemical sampling Table 12 (SamplingFlow): Flow measurements
28 Stage Four : Monitoring for HSPF Parameters Commences Three monitoring stations were installed in the Alexander Catchment - Palestinian side, two of them were at Wadi Zeimar, and the other r was at Wadi Al Teen. Some preparations were made for the three sites before installing g the devices as shown in the following pictures. The installed device is Sigma 900 MAX Portable Sampler Three sensors were installed in the wadis: Submerged Pressure Sensor to measure height of water in the wadis. Electric Conductance (EC) probe. Strainer (for the pump to take samples from the wadi in fluid time) The device has a modem so that we can get the data by connecting the modem by telephone.
 Monitoring Stations at Alexander")
29 Wadi Zeimar (Shwaki Station) Wadi Teen Station Wadi Zeimar (Deir Sharaf Station) Monitoring Stations at Alexander Catchment


30 Wadi Zeimar (Shwaki Station) - Preparation of the Site Situation before and after installing the devices in the Wadi before after
")

31 Wadi Zeimar (Shwaki Station) Installation and Calibration of the Device


32 Wadi Zeimar (Deir Sharaf Station) -Preparation of the Site Situation before and after installing the devices in the Wadi before after
")

33 Wadi Zeimar (Deir Sharaf Station) Installation and Calibration of the Device

34 Wadi Teen Station - Preparation of the Site
35 Gathering the Data from the Devices We use Insight Suite, V5.6.5 program which was published by HACH Company to connect with the modems of the installed Sigma 900 MAX Portable Samplers in the Wadis. The following slides show how this software works. After installing the data from the Samplers, we prepare Excel sheets to calculate the discharges in the wadis during rainfall storms. So as to understand the response of the wadis to rainfall.

36 Insight Suite, V5.6.5

37 Collected Data

38 Graph of H & EC Values (Obtained from Wadi Al Teen Station)
")
39 Calculating Discharge of Wadi Zeimar (Deir( Sharaf Station)

40 Calculating Discharge of Wadi Zeimar (Shwaki Station)

41 Calculating Discharge of Wadi Al Teen

42 Quality of Water in Wadi Zeimar
43 Stage Five : Building HSPF Model HSPF has many parameters to prepare data for; The following analysis were prepared: DEM Analyses Divide the Alexander basin in sub-watersheds. Divide the Alexander watersheds into drainage segments. Estimating LSUR and SLSUR and other basin parameters Metrological Analysis LSUR : Length of assumed d overland flow plane SLSUR: Average slope assumed sumed overland flow plane Building a Watershed Data Management (WDM) file.

44 From DEM and the digitized stream and using the Arc Hydro software, very detailed streams network have been obtained. (Next Slide)

45 This detailed stream network will be useful in estimating the LSUR parameter for the HSPF model.
46 Three main sub basins (Nablus, Wadi Teen and Alexander) were defined to be modeled.

47 Wadi At Teen Case: simple delineation has been developed using (DEM,( Detailed digitized stream network)
48 Wadi At Teen Sub Basin Land Use Estimating the LSUR and SLSUR parameters: using the Draft land use u map, the generated Slope map and the generated detailed stream network.
49 Wadi At Teen Sub Basin Slope Estimating the LSUR and SLSUR parameters: using the Draft land use u map, the generated Slope map and the generated detailed stream network.

50 Wadi At Teen Sub Basin Main Streams, gullies, ditches, swales, etc Estimating the LSUR and SLSUR parameters: using the Draft land use u map, the generated Slope map and the generated detailed stream network.
51 LSUR LSUR: length of assumed overland flow plane (ft), the LSUR approximates the average length of travel for water to reach the stream reach. Typical values range from 200ft to 500ft for slopes ranging from 15% to 1% LSUR is inversely proportional to slope LSUR i = 2 ( Watershed Area) i ( length of all small streams in the watershed area) i Where: i = Landuse type i


52 Weighted Average slope=14.7% Wadi At Teen case: note that the slopes for different landuse types are almost within the accepted range (5.2-18%)
53 Main streams length = m = ft All types of streams = m = ft Net length of all small streams = = ft Area = m 2 = ft 2 LSUR= /(2* ) = ft (Average Slope =14.7%)

54 Estimated LSUR and SLSUR Values for different land use types.

55 Preparing the WDM File Row data: 8-15/2/2006, 8 5 minutes intervals
56 Preparing the WDM File Data Preparation for WDM file 5 minutes Temperature, maximum and minimum temperatures, dew temperature, wind speed and precipitation Hourly Temp, Max & Min Temps, Dew Temp, WS and Pecip. Daily Max & Min Temps

57 WDM file: Preparing the WDM File PREC: measured Hourly precipitation ATEM: measured Hourly temperature WIND: measured Hourly wind speed DEWP: measured Hourly dew temperature

58 WDM file: Preparing the WDM File TMAX: measured Daily maximum temperature. TMIN: measured Daily minimum temperature. DEVT: computed Daily potential evapotranspiration. PEVT: computed Hourly potential evapotranspiration.
 Monthly Coefficient?")
59 Preparing the WDM File Estimating Daily potential evapotranspiration using Hamon Method by using: TMAX: measured Daily maximum temperature. TMIN: measured Daily minimum temperature. Latitude of the metrological station (32:22:7.15) Monthly Coefficient????

60 Preparing the WDM File Disaggregate the estimated the Daily Potential Evapotranspiration using: DEVT: computed Daily Potential Evapotranspiration Latitude of the metrological station (32:22:7.15)
SENSITIVITY OF HSPF- ESTIMATED FLOWRATE TO TOPOGRAPHICAL PARAMETER VALUES FOR A COASTAL WATERSHED IN MISSISSIPPI
 SENSITIVITY OF HSPF- ESTIMATED FLOWRATE TO TOPOGRAPHICAL PARAMETER VALUES FOR A COASTAL WATERSHED IN MISSISSIPPI Vladimir J. Alarcon* Chuck O Hara* William McAnally** James Martin** Jairo Diaz** Zhiyong
Aashka Patel*, Daniel Tufford, Gregory Carbone, Peng Gao, Lauren Felker
 Aashka Patel*, Daniel Tufford, Gregory Carbone, Peng Gao, Lauren Felker Resource Management Concerns Water supply Ecological Resources SCDNR Water quality Assessing impacts of climate change on water resources
Stream hydrographs. Stream hydrographs. Baseflow. Graphs of river stage or discharge at a single location as a function of time
 Stream hydrographs Graphs of river stage or discharge at a single location as a function of time Hydrologic og budget Discharge: units? How is it measured? Show fluctuating water levels in response to
Israeli Violations against the Palestinian Environment
 Israeli Violations against the Palestinian Environment By: Jad Isaac The numerous Israeli violations against the Palestinian environment begin with the land confiscation policy and its illegal use of the
The Islamic University of Gaza- Civil Engineering Department Sanitary Engineering- ECIV 4325 L5. Storm water Management
 The Islamic University of Gaza- Civil Engineering Department Sanitary Engineering- ECIV 4325 L5. Storm water Management Husam Al-Najar Storm water management : Collection System Design principles The Objectives
Presentation Outline
 Approximation of Discharge Volumes During Precipitation Events for a Portland, Oregon Stormwater System Class Project Presentation Van McKay, James Manzione PSU Geography 592 March 16, 2009 Presentation
Ag Drainage Design Protocols and Current Technology
 Department of Agricultural and Biosystems Engineering Ag Drainage Design Protocols and Current Technology Matthew Helmers Dean s Professor, College of Ag. & Life Sciences Associate Professor, Dept. of
Amanda Howell Water Protection Division Region 4 EPA Atlanta, GA
 Amanda Howell Water Protection Division Region 4 EPA Atlanta, GA What is a Model? A model is a set of mathematical equations that describe our understanding of a natural phenomenon Image by pxhere.com
ENGN.4010 ENGINEERING CAPSTONE DESIGN Watershed Analysis. CiA
 RATIONAL METHOD Q CiA Where: Q = Maximum Rate of Runoff (cfs) C = Runoff Coefficient i = Average Rainfall Intensity (in/hr) A = Drainage Area (in acres) RATIONAL METHOD Assumptions and Limitations: Watershed
Analyzing the Changes to the Hydrologic Cycle. with the Implementation of LID Techniques in Korea
 Analyzing the Changes to the Hydrologic Cycle with the Implementation of LID Techniques in Korea Jung Min Lee Contents 1 Introduction 2 Change of New City Paradigm on Korea 3 Case Study 4 The Effects of
GEOGRAPHIC INFORMATION SYSTEMS AND WATER RESOURCES IV AWRA SPRING SPECIALTY CONFERENCE Houston, Texas
 GEOGRAPHIC INFORMATION SYSTEMS AND WATER RESOURCES IV AWRA SPRING SPECIALTY CONFERENCE Houston, Texas May 8-, 6 Copyright 6, AWRA SENSITIVITY OF HSPF-ESTIMATED FLOW-RATE TO TOPOGRAPHICAL PARAMETER VALUES
Models Overview: Purposes and Limitations
 Models Overview: Purposes and Limitations Pollutant load originates from: Point-source discharges (NPDES facilities) Info is available on the discharges (DMRs, etc.) Some are steady-flow, others are precip-driven
Unit 2: Geomorphologic and Hydrologic Characteristics of Watersheds. ENVS 435: Watershed Management INSTR.: Dr. R.M. Bajracharya
 Unit 2: Geomorphologic and Hydrologic Characteristics of Watersheds ENVS 435: Watershed Management INSTR.: Dr. R.M. Bajracharya Watersheds are hydro-geologic units Water flow and cycling are basic and
Simulation of Seawater Intrusion Due to Climate Change Impacts in North Gaza Aquifer Using SEAWAT
 Simulation of Seawater Intrusion Due to Climate Change Impacts in North Gaza Aquifer Using SEAWAT Reem Fathi Sarsak, MSc UNRWA- Environment Health Department Nablus-Palestine E-mail: reem2525@yahoo.com
Radar-based flood forecasting: Quantifying hydrologic prediction uncertainty
 Severe Storms Prediction and Global Climate Impact on the Gulf Coast, Rice University, October 29 31, 2008 Radar-based flood forecasting: Quantifying hydrologic prediction uncertainty Baxter E. Vieux,
Restoration of the Besor-Hebron-Be'er Sheva Stream A Transboundary Project Supported by the JNF Parsons Water Fund
 Restoration of the Besor-Hebron-Be'er Sheva Stream A Transboundary Project Supported by the JNF Parsons Water Fund JNF CEO, Russell Robinson, explaining Blueprint: Negev to a group of Arizona water managers
Introduction, HYDROGRAPHS
 HYDROGRAPHS Sequence of lecture Introduction Types of Hydrograph Components of Hydrograph Effective Rainfall Basin Lag or Time Lag Parts of Hydrograph Hydrograph Analysis Factors Affecting Hydrograph Shape
Comparison and Assessment of Success of Models in Watershed Simulation and Management
 Journal of Water Resource and Protection, 2014, 6, 599-608 Published Online April 2014 in SciRes. http://www.scirp.org/journal/jwarp http://dx.doi.org/10.4236/jwarp.2014.66058 Comparison and Assessment
CHAPTER FIVE Runoff. Engineering Hydrology (ECIV 4323) Instructors: Dr. Yunes Mogheir Dr. Ramadan Al Khatib. Overland flow interflow
 Instructors: Dr. Yunes Mogheir Dr. Ramadan Al Khatib. Overland flow interflow") Engineering Hydrology (ECIV 4323) CHAPTER FIVE Runoff Instructors: Dr. Yunes Mogheir Dr. Ramadan Al Khatib Overland flow interflow Base flow Saturated overland flow ١ ٢ 5.1 Introduction To Runoff Runoff
Engineering Hydrology (ECIV 4323) CHAPTER FIVE Runoff Instructors: Dr. Yunes Mogheir Dr. Ramadan Al Khatib Overland flow interflow Base flow Saturated overland flow ١ ٢ 5.1 Introduction To Runoff Runoff
MODELING SEDIMENT AND PHOSPHORUS YIELDS USING THE HSPF MODEL IN THE DEEP HOLLOW WATERSHED, MISSISSIPPI
 MODELING SEDIMENT AND PHOSPHORUS YIELDS USING THE HSPF MODEL IN THE DEEP HOLLOW WATERSHED, MISSISSIPPI Jairo Diaz-Ramirez, James Martin, William McAnally, and Richard A. Rebich Outline Background Objectives
Water Resources Status in Danube River Basin. SWAT Conference_ Spain, Toledo June 2011
 Water Resources Status in Danube River Basin SWAT Conference_ Spain, Toledo June 2011 Objectives Objectives Building and calibratîng a hydrologic model of Danube Basin Using SWAT and SWAT CUP Quantifying
Evaluation of Swat for Modelling the Water Balance and Water Yield in Yerrakalva River Basin, A.P. National Institute of Hydrology, Roorkee
 Evaluation of Swat for Modelling the Water Balance and Water Yield in Yerrakalva River Basin, A.P. By Dr. J.V. Tyagi Dr. Y.R.S. Rao National Institute of Hydrology, Roorkee INTRODUCTION Knowledge of water
Pre-Event Activities. Blue River. Pre Field Trip Suggestions
 Blue River Have you heard we all live in a watershed? Well, it is true! This total body activity will allow students to demonstrate how water flows in a watershed while exploring how seasonal variations
Study of Hydrology based on Climate Changes Simulation Using SWAT Model At Jatiluhur Reservoir Catchment Area
 Study of Hydrology based on Climate Changes Simulation Using SWAT Model At Jatiluhur Reservoir Catchment Area Budi Darmawan Supatmanto 1, Sri Malahayati Yusuf 2, Florentinus Heru Widodo 1, Tri Handoko
Palestinian National Authority Palestinian Water Authority
 Palestinian National Authority Palestinian Water Authority السلطة الوطنية الفلسطينية سلطة المياه الفلسطينية Evaluation of Socio-Economic Sustainability Indicators for Water Resources Management Options
INFLOW DESIGN FLOOD CONTROL SYSTEM PLAN PLANT GASTON GYPSUM POND ALABAMA POWER COMPANY
 INFLOW DESIGN FLOOD CONTROL SYSTEM PLAN PLANT GASTON GYPSUM POND ALABAMA POWER COMPANY Section 257.82 of EPA s regulations requires the owner or operator of an existing or new CCR surface impoundment or
Using AnnAGNPS to Evaluate On-Farm Water Storage Systems (OFWS) as a BMP for Nutrient Loading Control in a Small Watershed in East Mississippi
 as a BMP for Nutrient Loading Control in a Small Watershed in East Mississippi") Using AnnAGNPS to Evaluate On-Farm Water Storage Systems (OFWS) as a BMP for Nutrient Loading Control in a Small Watershed in East Mississippi Ritesh Karki Graduate Student, Mississippi State University
Using AnnAGNPS to Evaluate On-Farm Water Storage Systems (OFWS) as a BMP for Nutrient Loading Control in a Small Watershed in East Mississippi Ritesh Karki Graduate Student, Mississippi State University
Issue paper: Aquifer Water Balance
 Issue paper: Aquifer Water Balance 1. Introduction And Background 1.1. Purpose and Scope The population in Kitsap County has grown rapidly in recent years and is expected to increase substantially in the
CHAPTER 7 GROUNDWATER FLOW MODELING
 148 CHAPTER 7 GROUNDWATER FLOW MODELING 7.1 GENERAL In reality, it is not possible to see into the sub-surface and observe the geological structure and the groundwater flow processes. It is for this reason
CONTINUOUS RAINFALL-RUN OFF SIMULATION USING SMA ALGORITHM
 CONTINUOUS RAINFALL-RUN OFF SIMULATION USING SMA ALGORITHM INTRODUCTION Dr. R N Sankhua Director, NWA, CWC, Pune In this continuous rainfall-runoff simulation, we will perform a continuous or long-term
APPENDIX IV. APPROVED METHODS FOR QUANTIFYING HYDROLOGIC CONDITIONS OF CONCERN (NORTH ORANGE COUNTY)
") APPENDIX IV. APPROVED METHODS FOR QUANTIFYING HYDROLOGIC CONDITIONS OF CONCERN (NORTH ORANGE COUNTY) Hydromodification design criteria for the North Orange County permit area are based on the 2- yr, 24-hr
APPENDIX IV. APPROVED METHODS FOR QUANTIFYING HYDROLOGIC CONDITIONS OF CONCERN (NORTH ORANGE COUNTY) Hydromodification design criteria for the North Orange County permit area are based on the 2- yr, 24-hr
Hydrological And Water Quality Modeling For Alternative Scenarios In A Semi-arid Catchment
 Hydrological And Water Quality Modeling For Alternative Scenarios In A Semi-arid Catchment AZIZ ABOUABDILLAH, ANTONIO LO PORTO METIER Final Conference: Brussels, Belgium-4-6 November 2009 Outline Problem
2
 1 2 3 4 5 6 The program is designed for surface water hydrology simulation. It includes components for representing precipitation, evaporation, and snowmelt; the atmospheric conditions over a watershed.
October 29, Monitoring Data Analysis for September 20 October 21, Gills Creek Monitoring Sites
 October 9, Monitoring Data Analysis for September October, Gills Creek Monitoring Sites Over the course of the monitoring period (September through October, ), an overall decrease in water temperature
DRAFT KERN GROUNDWATER AUTHORITY COORDINATION AGREEMENT COMPONENTS WHITE PAPER SERIES. Item D Total Water Use
 KERN GROUNDWATER AUTHORITY COORDINATION AGREEMENT COMPONENTS WHITE PAPER SERIES Item D Total Water Use Introduction There are seven components to Groundwater Sustainability Plan (GSP) coordination agreements.
Presented by: Peter Spal, IBI Group. OECS Regional Engineering Workshop October 1, 2014
 Presented by: Peter Spal, IBI Group OECS Regional Engineering Workshop October 1, 2014 Presentation Topics Principles of Hydrology rational formula, unit hydrograph Modeling Methods SWMMHYMO Synthetic
Wetland Sensitivity to Potential Reductions in Surface Water Flow in the St. Johns River
 Wetland Sensitivity to Potential Reductions in Surface Water Flow in the St. Johns River Palmer Kinser Sandra Fox Environmental Assessment Section St. Johns River Water Management District Outline: Background
Sustainable Management of the West Bank and Gaza Aquifers
 Sustainable Management of the West Bank and Gaza Aquifers Summary Report Palestinian National Authority Palestinian Water Authority i Contributors and acknowledgements The SUSMAQ project has involved a
SAN BERNARD RIVER WATER QUALITY MODEL UPDATE. August 18, 2011
 SAN BERNARD RIVER WATER QUALITY MODEL UPDATE August 18, 2011 Agenda Model Set-up Watershed model Watershed delineations Generate model input files & establish coefficients Receiving Water model Establish
Chapter 6. Hydrology. 6.0 Introduction. 6.1 Design Rainfall
 6.0 Introduction This chapter summarizes methodology for determining rainfall and runoff information for the design of stormwater management facilities in the City. The methodology is based on the procedures
CONSISTENCY BETWEEN CUHP AND RATIONAL METHODS James C.Y. Guo, PhD, P.E., and Ben Urbonas, P.E., D.WRD 08/04/2008
 CONSISTENCY BETWEEN CUHP AND RATIONAL METHODS James C.Y. Guo, PhD, P.E., and Ben Urbonas, P.E., D.WRD 08/04/2008 When estimating runoff for a storm event it is assumed that the storm runoff occurs from
Construction. Analysis. Hydrographs
 Construction And Analysis Of Hydrographs Hydrographs Special graphs that show a changes in a river s discharge over a period of time, usually in relation to a rainfall event. River Discharge Is the amount
MULTI-LAYER MESH APPROXIMATION OF INTEGRATED HYDROLOGICAL MODELING FOR WATERSHEDS: THE CASE OF THE YASU RIVER BASIN
 MULTI-LAYER MESH APPROXIMATION OF INTEGRATED HYDROLOGICAL MODELING FOR WATERSHEDS: THE CASE OF THE YASU RIVER BASIN Toshiharu KOJIRI and Amin NAWAHDA 1 ABSTRACT A method for applying the multi-layer mesh
CHAPTER 4 DISCUSSION. Total Flow. For the study watershed, the water budget equation is defined as inflow equals
 CHAPTER 4 DISCUSSION Total Flow For the study watershed, the water budget equation is defined as inflow equals outflow minus any losses. Inflow consists of precipitation. Outflow consists of stream flow
AnnAGNPS. Annualized AGricultural Non-Point Source Pollurant Loading Model. Annualized Agricultural Non-Point Source Pollutant Loading Model
 AnnAGNPS Annualized AGricultural Non-Point Source Pollurant Loading Model 1 Erosion Erosion can be expresed as: E=f(C, S, T, SS, M) E = erosion C = climate S = soil properties T = topography SS = soil
Flood Modelling and Water Harvesting Plan for Paravanar Basin
 International Journal of ChemTech Research CODEN (USA): IJCRGG, ISSN: 0974-4290, ISSN(Online):2455-9555 Vol.10 No.14, pp 01-08, 2017 Flood Modelling and Water Harvesting Plan for Paravanar Basin Dhinesh
Training Course Brochure Building Capacity in Rural & Urban Water Management
 Training Course Brochure 2015 Building Capacity in Rural & Urban Water Management Introduction The WastePro Academy seeks to encourage the use of desktop software applications in the water and environmental
CHAPTER ONE : INTRODUCTION
 CHAPTER ONE : INTRODUCTION WHAT IS THE HYDROLOGY? The Hydrology means the science of water. It is the science that deals with the occurrence, circulation and distribution of water of the earth and earth
Design Specifications & Requirements Manual
 9 GRADING 9.1 GRADING REQUIREMENTS FOR VARIOUS SITUATIONS... 1 9.1.1 Subdivisions... 1 9.1.2 Site Plans... 1 9.1.3. Severances, Lifting of Part Lot Control & Infill Lots... 1 9.1.4 Blocks... 1 9.1.5 Capital
FAST WATER / SLOW WATER AN EVALUATION OF ESTIMATING TIME FOR STORMWATER RUNOFF
 FAST WATER / SLOW WATER AN EVALUATION OF ESTIMATING TIME FOR STORMWATER RUNOFF Factors Affecting Stormwater Runoff: Rainfall intensity % Impervious surfaces Watershed size Slope Soil type, soil compaction
GreenPlan Modeling Tool User Guidance
 GreenPlan Modeling Tool User Guidance Prepared by SAN FRANCISCO ESTUARY INSTITUTE 4911 Central Avenue, Richmond, CA 94804 Phone: 510-746-7334 (SFEI) Fax: 510-746-7300 www.sfei.org Table of Contents 1.
Chapter 1 Introduction
 Engineering Hydrology Chapter 1 Introduction 2016-2017 Hydrologic Cycle Hydrologic Cycle Processes Processes Precipitation Atmospheric water Evaporation Infiltration Surface Runoff Land Surface Soil water
Impact Study of a check dam on Ground Water Recharge
 Impact Study of a check dam on Ground Water Recharge 1 P.Arun Raja, C. Dinesh, B.Jagadeesan 1,, UG Student, Department of Civil Engineering, Mamallan Institute of Technology, Kanchipuram, INDIA Abstract:
M.L. Kavvas, Z. Q. Chen, M. Anderson, L. Liang, N. Ohara Hydrologic Research Laboratory, Civil and Environmental Engineering, UC Davis
 Assessment of the Restoration Activities on Water Balance and Water Quality at Last Chance Creek Watershed Using Watershed Environmental Hydrology (WEHY) Model M.L. Kavvas, Z. Q. Chen, M. Anderson, L.
1 n. Flow direction Raster DEM. Spatial analyst slope DEM (%) slope DEM / 100 (actual slope) Flow accumulation
 slope DEM / 100 (actual slope) Flow accumulation") 1 v= R S n 2/3 1/2 DEM Flow direction Raster Spatial analyst slope DEM (%) Flow accumulation slope DEM / 100 (actual slope) 0 = no cell contributing 215 = 215 cell contributing towards that cell sqrt (actual
1 v= R S n 2/3 1/2 DEM Flow direction Raster Spatial analyst slope DEM (%) Flow accumulation slope DEM / 100 (actual slope) 0 = no cell contributing 215 = 215 cell contributing towards that cell sqrt (actual
SECTION IV WATERSHED TECHNICAL ANALYSIS
 A. Watershed Modeling SECTION IV WATERSHED TECHNICAL ANALYSIS An initial step in the preparation of this stormwater management plan was the selection of a stormwater simulation model to be utilized. It
Generalization of parameters in the storage discharge relation for a low flow based on the hydrological analysis of sensitivity
 Proc. IAHS, 371, 69 73, 2015 doi:10.5194/piahs-371-69-2015 Author(s) 2015. CC Attribution 3.0 License. Generalization of parameters in the storage discharge relation for a low flow based on the hydrological
Topography and the Spatial Distribution of Groundwater Recharge and Evapotranspiration:
 Topography and the Spatial Distribution of Groundwater Recharge and Evapotranspiration: A Need to Revisit Distributed Water Budget Analysis when Assessing Impacts to Ecological Systems. By M.A. Marchildon,
FORT COLLINS STORMWATER CRITERIA MANUAL Hydrology Standards (Ch. 5) 1.0 Overview
 1.0 Overview") Chapter 5: Hydrology Standards Contents 1.0 Overview... 1 1.1 Storm Runoff Determination... 1 1.2 Design Storm Frequencies... 1 1.3 Water Quality Storm Provisions... 2 1.4 Design Storm Return Periods...
Chapter 5: Hydrology Standards Contents 1.0 Overview... 1 1.1 Storm Runoff Determination... 1 1.2 Design Storm Frequencies... 1 1.3 Water Quality Storm Provisions... 2 1.4 Design Storm Return Periods...
Modeling the Impact of Land-Use Change on Water Budget of Gaza Strip
 Journal of Water Resource and Protection, 2012, 4, 325-333 http://dx.doi.org/10.4236/jwarp.2012.46036 Published Online June 2012 (http://www.scirp.org/journal/jwarp) Modeling the Impact of Land-Use Change
Planning Considerations for Stormwater Management in Alberta. R. D. (Rick) Carnduff, M. Eng., P. Eng. February 20, 2013.
 Carnduff, M. Eng., P. Eng. February 20, 2013.") Planning Considerations for Stormwater Management in Alberta R. D. (Rick) Carnduff, M. Eng., P. Eng. February 20, 2013 Photo Optional Purpose The purpose of urban stormwater management is to provide solutions
Planning Considerations for Stormwater Management in Alberta R. D. (Rick) Carnduff, M. Eng., P. Eng. February 20, 2013 Photo Optional Purpose The purpose of urban stormwater management is to provide solutions
Learning objectives. Upon successful completion of this lecture, the participants will be able to describe:
 Solomon Seyoum Learning objectives Upon successful completion of this lecture, the participants will be able to describe: The different approaches for estimating peak runoff for urban drainage network
Kinley Creek Monitoring Sites Monitoring Data Summary for August 19 th, 2017 September 18 th, 2017
 Kinley Creek Monitoring Sites Monitoring Data Summary for August 19 th, 217 September 18 th, 217 Data Gaps The KINA station experienced submergence issues that affected specific conductivity from the date
The Drainage Basin System
 The Drainage Basin System These icons indicate that teacher s notes or useful web addresses are available in the Notes Page. This icon indicates that the slide contains activities created in Flash. These
Yoshinaga Ikuo *, Y. W. Feng**, H. Hasebe*** and E. Shiratani****
 NITROGEN REMOVAL FUNCTION OF PADDY FIELD IN A CIRCULAR IRRIGATION SYSTEM Yoshinaga Ikuo *, Y. W. Feng**, H. Hasebe*** and E. Shiratani**** * National Institute for Rural Engineering, Tsukuba Science City
Appendix F. Flow Duration Basin Design Guidance
 Appendix F Flow Duration Basin Design Guidance Appendix F FINAL REPORT F:\SC46\SC46.31\HMP Mar 05\Appendices\Appendix F FLY_HMP.doc MARCH 2005 Appendix F Flow Duration Basin Design Guidance Prepared by
Measuring discharge. Climatological and hydrological field work
 Measuring discharge Climatological and hydrological field work 1. Background Discharge (or surface runoff Q s) refers to the horizontal water flow occurring at the surface in rivers and streams. It does
The environmental objectives and Programme of Measures of the River Basin Management Plan. The case of Cyprus. Iacovos Papaiacovou
 The environmental objectives and Programme of Measures of the River Basin Management Plan The case of Cyprus Iacovos Papaiacovou General Manager Sewerage Board of Limassol Amathus www.sbla.com.cy The island
MODULE 1 RUNOFF HYDROGRAPHS WORKSHEET 1. Precipitation
 Watershed MODULE 1 RUNOFF HYDROGRAPHS WORKSHEET 1 A watershed is an area of land thaaptures rainfall and other precipitation and funnels it to a lake or stream or wetland. The area within the watershed
Retrospective analysis of hydrologic impacts in the Chesapeake Bay watershed
 Retrospective analysis of hydrologic impacts in the Chesapeake Bay watershed Harsh Beria1,3, Rob Burgholzer2, Venkat Sridhar3 Indian Institute of Technology Kharagpur, India & Summer intern Virginia Department
Design Specifications & Requirements Manual
 9 GRADING 9.1 GRADING REQUIREMENTS FOR VARIOUS SITUATIONS... 1 9.1.1 Subdivisions... 1 9.1.2 Site Plans... 1 9.1.3. Severances, Lifting of Part Lot Control & Infill Lots... 1 9.1.4 Blocks... 1 9.1.5 Capital
CEE3430 Engineering Hydrology
 CEE3430 Engineering Hydrology Practice Exam (There are multiple practice questions here A 110 min test will likely not have more than four questions) 1. Water Balance Write the water balance as Δ Where
The Texas A&M University and U.S. Bureau of Reclamation Hydrologic Modeling Inventory (HMI) Questionnaire
 Questionnaire") The Texas A&M University and U.S. Bureau of Reclamation Hydrologic Modeling Inventory (HMI) Questionnaire May 4, 2010 Name of Model, Date, Version Number Dynamic Watershed Simulation Model (DWSM) 2002
The Texas A&M University and U.S. Bureau of Reclamation Hydrologic Modeling Inventory (HMI) Questionnaire May 4, 2010 Name of Model, Date, Version Number Dynamic Watershed Simulation Model (DWSM) 2002
Watersheds and the Hydrologic Cycle
 Watersheds and the Hydrologic Cycle The Global Hydrologic Cycle Water Cycle in Florida Florida Water Facts Surface Area = 170,452 km 2 Average Rainfall = 140 cm (55 ) Total Annual Rain = 238 billion m
Mean Monthly and Low Flow Estimates in NHDPlus Version 2
 Mean Monthly and Low Flow Estimates in NHDPlus Version 2 Tim Bondelid - NHDPlus Team Consulting Engineer 2014 AWRA Spring Conference on GIS and Water Resources VIII May 12 to May 14, 2014 Snowbird, Utah
Part III: USERS GUIDE
 FIPR Hydrologic Model Part III: USERS GUIDE Prepared for: Florida Institute of Phosphate Research Bartow, Florida and Southwest Florida Water Management District Brooksville, Florida Prepared by: Mark
Hydrologic Model of the Vermilion River Watershed for Streamflow Simulations
 This project was funded through the Illinois Department of Natural Resources and the Illinois State Geological Survey. Illinois State Water Survey Contract Report 2004-0. Hydrologic Model of the Vermilion
Native Perennial Plants Intercrops as means for Soil Conservation. Dr. Ayman Salah Al-Quds University
 Native Perennial Plants Intercrops as means for Soil Conservation Dr. Ayman Salah Al-Quds University Background The Palestinian lands suffer from desertification. Indicators of desertification appear in
Lecture 9A: Drainage Basins
 GEOG415 Lecture 9A: Drainage Basins 9-1 Drainage basin (watershed, catchment) -Drains surfacewater to a common outlet Drainage divide - how is it defined? Scale effects? - Represents a hydrologic cycle
SPATIAL-TEMPORAL ADJUSTMENTS OF TIME OF CONCENTRATION
 JOURNAL O LOOD ENGINEERING J E 1(1) January June 2009; pp. 21 28 SPATIAL-TEMPORAL ADJUSTMENTS OF TIME OF CONCENTRATION Kristin L. Gilroy & Richard H. McCuen Dept. of Civil and Environmental Engineering,
What is runoff? Runoff. Runoff is often defined as the portion of rainfall, that runs over and under the soil surface toward the stream
 What is runoff? Runoff Runoff is often defined as the portion of rainfall, that runs over and under the soil surface toward the stream 1 COMPONENTS OF Runoff or STREAM FLOW 2 Cont. The types of runoff
Modelling of the Hydrology, Soil Erosion and Sediment transport processes in the Lake Tana Catchments of Blue Nile River Basin, Ethiopia
 Modelling of the Hydrology, Soil Erosion and Sediment transport processes in the Lake Tana Catchments of Blue Nile River Basin, Ethiopia Combining Field Data, Mathematical Models and Geographic Information
1. Introduction. Keywords Groundwater, Vulbnerability, Aquifer, Aquitard, Vadose zone. Alsharifa Hind Mohammad
 World Environment 2014, 4(1): 22-32 DOI: 10.5923/j.env.20140401.03 New Groundwater Vulnerability Index for the Main Aquifers in Central Catchment Area in Jordan and Validation of the Results Using NO 3
USING ARCSWAT TO EVALUATE EFFECTS OF LAND USE CHANGE ON WATER QUALITY. Adam Gold Geog 591
 USING ARCSWAT TO EVALUATE EFFECTS OF LAND USE CHANGE ON WATER QUALITY Adam Gold Geog 591 Introduction The Soil and Water Assessment Tool (SWAT) is a hydrologic transport model with an objective to predict
2. DEFINITIONS. American Association of State Highway and Transportation Officials.
 2. DEFINITIONS 2.010 Definitions [See Amendment 2] In addition to words and terms that may be defined elsewhere in this manual, the following words and terms shall have the meanings defined below: AASHTO:
soil losses in a small rainfed catchment with Mediterranean
 Using SWAT to predict climate change effects on runoff and soil losses in a small rainfed catchment with Mediterranean climate of NE Spain Ramos MC, Martínez-Casasnovas JA Department of Environment and
GIS Framework to Evaluate Impact of Climate Change on Water Resources
 GIS Framework to Evaluate Impact of Climate Change on Water Resources Dr. Nagraj S. Patil A. K. Gosain, Professor Civil Engineering Department I. I. T. Delhi Objectives of the Study To Develop portal to
RIVER DISCHARGE PROJECTION IN INDOCHINA PENINSULA UNDER A CHANGING CLIMATE USING THE MRI-AGCM3.2S DATASET
 RIVER DISCHARGE PROJECTION IN INDOCHINA PENINSULA UNDER A CHANGING CLIMATE USING THE MRI-AGCM3.2S DATASET Duc Toan DUONG 1, Yasuto TACHIKAWA 2, Michiharu SHIIBA 3, Kazuaki YOROZU 4 1 Student Member of
APPLICATION OF THE SWAT (SOIL AND WATER ASSESSMENT TOOL) MODEL IN THE RONNEA CATCHMENT OF SWEDEN
 MODEL IN THE RONNEA CATCHMENT OF SWEDEN") Global NEST Journal, Vol 7, No 3, pp 5-57, 5 Copyright 5 Global NEST Printed in Greece. All rights reserved APPLICATION OF THE SWAT (SOIL AND WATER ASSESSMENT TOOL) MODEL IN THE RONNEA CATCHMENT OF SWEDEN
Global NEST Journal, Vol 7, No 3, pp 5-57, 5 Copyright 5 Global NEST Printed in Greece. All rights reserved APPLICATION OF THE SWAT (SOIL AND WATER ASSESSMENT TOOL) MODEL IN THE RONNEA CATCHMENT OF SWEDEN
River Channel Characteristics
 River Channel Characteristics Storages and Transfers in Drainage Basins Precipitation Evapotranspiration SURFACE STORAGE INTERCEPTION STORAGE CHANNEL STORAGE Soil Moisture Storage Aeration Zone Storage
Mud Lake Lakeshed Assessment
 Mud Lake Lakeshed Assessment The lakeshed vitals table identifies where to focus organizational and management efforts for each lake. Criteria were developed using limnological concepts to determine the
Feasibility Study of Artificial Aquifer Recharge in the Walla Walla Basin. Presenter: Arístides Petrides
 Feasibility Study of Artificial Aquifer Recharge in the Walla Walla Basin Presenter: Arístides Petrides Overview of Presentation Background Walla Walla River Basin Previous Modeling Effort with IWFM New
 11th International Conference on Urban Drainage, Edinburgh, Scotland, UK, 2008 RESULTS AND DISCUSSION Census Dataset Analysis. The last census in Brazil, run by IBGE (Brazilian Institute for Statistics
Parlee Beach Water Quality Summary
 Parlee Beach Water Quality Summary Introduction This document presents a summary of the report of the Steering Committee for the Parlee Beach Water Quality project. The Committee was comprised of representatives
Analysis of Runoff Reduction and Hydrologic Cycle Utilizing LID Concepts
 Maine Stormwater Conference (Portland, ME, 2015) Analysis of Runoff Reduction and Hydrologic Cycle Utilizing LID Concepts Park Jongpyo, Lee Kyoungdo: HECOREA. INC Shin Hyunsuk: Busan National University
The Palestinian Farmer: Production Analysis & Challenges Study Summary
 The Palestinian Farmer: Production Analysis & Challenges Study Summary 1. Introduction The agricultural sector is an important driver in the Palestinian economy since it creates job opportunities in the
Evaluating the Reduction Effect of Nonpoint Source Pollution Loads from Upland Crop Areas by Rice Straw Covering Using SWAT
 SESSION J2 : Water Resources Applications - I New Delhi, India 2012 International SWAT Conference Evaluating the Reduction Effect of Nonpoint Source Pollution Loads from Upland Crop Areas by Rice Straw
Prairie Hydrological Model Study Progress Report, April 2008
 Prairie Hydrological Model Study Progress Report, April 2008 Centre for Hydrology Report No. 3. J. Pomeroy, C. Westbrook, X. Fang, A. Minke, X. Guo, Centre for Hydrology University of Saskatchewan 117
2. Potential Extreme Peak Discharge in Texas
 2. Potential Extreme Peak Discharge in Texas This part of the work is focused on using GIS to apply the latest USGS peak discharge equations to create a 500m grid that stores the potential peak discharge