Poultry s Phosphorus Problem. Phosphorus and Algae in Eastern Shore Waterways: High Concentrations, No Improvement in Past Decade
|
|
|
- Nickolas Watkins
- 6 years ago
- Views:
Transcription


1 Poultry s Phosphorus Problem Phosphorus and Algae in Eastern Shore Waterways: High Concentrations, No Improvement in Past Decade July 14,
2 About the Environmental Integrity Project The Environmental Integrity Project (EIP) is a nonpartisan, nonprofit organization dedicated to the enforcement of the nation s anti-pollution laws and to the prevention of political interference with those laws. EIP provides objective analysis of how the failure to enforce or implement environmental laws increases pollution and harms public health, and helps local communities obtain the protection of environmental laws. Cover photograph credits Poultry houses on the Chester River, west of Crumpton, July 2, Author: Jane Thomas, Integration and Application Network, University of Maryland Center for Environmental Science (ian.umces.edu/imagelibrary/). Questions and comments can be directed to Eric Schaeffer at eschaeffer@environmentalintegrity.org Environmental Integrity Project DC Office 1000 Vermont Avenue NW, Suite 1100 Washington, DC Phone (202)
3 We believe that the current nutrient management plan more than adequately addresses agriculture nutrient issues. - Maryland Farm Bureau, December, 2013 Introduction The Chesapeake Bay is overloaded with phosphorus and nitrogen, nutrients that trigger algae blooms that block sunlight and rob Bay waters of the oxygen needed to sustain a healthy ecosystem. EPA and states that share the Bay watershed have agreed to restrict discharges from agricultural, industrial and urban sources to help meet Bay water quality goals by The U.S. Environmental Protection Agency s Chesapeake Bay Program estimates that agricultural sources accounted for 57% of the phosphorus and 42% of the nitrogen discharged to Bay waters in 2013, more than any other sector. 1 Not surprisingly, farm runoff contributes the largest share of nutrients to the tidal rivers that meander through Maryland s Eastern Shore, which are located near the heart of the state s poultry industry. Agriculture is the source of 60 to 73% of the nitrogen and 68 to 84% of the phosphorus in Eastern Shore watersheds, which include the Chester, Choptank, Transquaking, Nanticoke, Sassafras, Manokin, Pocomoke and Wicomico rivers. These watersheds help replenish the Bay, provide critical habitat for fish and other wildlife, and are an invaluable recreational resource for those who visit or live on the Eastern Shore. They are also surrounded by 1,339 chicken farms that sent over 500 million broilers to market in 2012, according to the U.S. Department of Agriculture, while generating over 1 billion pounds of manure containing an estimated 30.2 million pounds of phosphate. A thousand broiler chickens create about a ton of phosphorus-rich manure per year, which is then typically spread on cropland or pasture as fertilizer. Because the lower Eastern shore is already saturated with phosphorus, the amount that cannot be absorbed by soil or plants finds its way to the Bay through surface runoff or the discharge from groundwater underneath fields to nearby creeks. Phosphorus is the nutrient of greatest concern on the Eastern Shore, while high chlorophyll-a levels indicate unwelcome algae growth. The University of Maryland s Center for Environmental Sciences (UMCES) has identified benchmark levels that indicate when concentrations of phosphorus and chlorophyll-a are low enough to indicate good water quality. The Environmental Integrity Project analyzed water quality data that reflect actual conditions in Eastern Shore tidal waterways from 2003 to 2013 (please see the discussion of methodology on page 6). 2 The analysis reveals that: Average spring and summer concentrations of total phosphorus were higher (sometimes much higher) than the UMCES benchmarks at all but two of the eighteen monitoring stations in the eight lower Eastern Shore s tidal rivers between 2011 and Longerterm trends indicate that concentrations of total phosphorus are not improving at 14 stations and have worsened at four stations since Average summer chlorophyll-a levels exceed the UMCES criteria at all but one monitoring station over the same three year period, while spring concentrations were higher at twelve of eighteen locations. Trends indicate no improvement at most stations since 2003, while spring and/or summer chlorophyll-a concentrations are on the rise in several waterways. 3
4 On November 15, 2013, in response to pressure from state farming interests, the Department of Agriculture withdrew a proposed Phosphorus Management Tool to identify fields with the greatest potential for phosphorus runoff for more effective control of these hotspots. While calling for additional reductions from sewage treatment plants, the Maryland Farm Bureau has insisted that current practices are good enough to meet Bay water quality goals. Given the high and persistent concentrations of phosphorus and chlorophyll in Eastern Shore watersheds, it is far too early for the farm lobby to declare victory or to block efforts to target and clean up nutrient hotspots. As Professor Donald Boesch, the long-time director of the University of Maryland Center for Environmental Sciences has warned: It took many years of phosphorus application in excess of crop removal to build soil phosphorus concentrations to levels of environmental concern. Accordingly, it will take many years for soil phosphorus concentrations to decline after phosphorus applications are reduced or cease and, consequently, for water quality benefits to be seen without action, high phosphorus hot spots will continue to contribute phosphorus to surface waters, counteracting our best practices elsewhere to attain the required 2025 load reductions. 3 If it will take many years to improve the quality of waters that are already overloaded with phosphorus, Maryland must find the political will today to target the hotspots that threaten to ruin the Eastern Shore s rivers for generations to come. 4

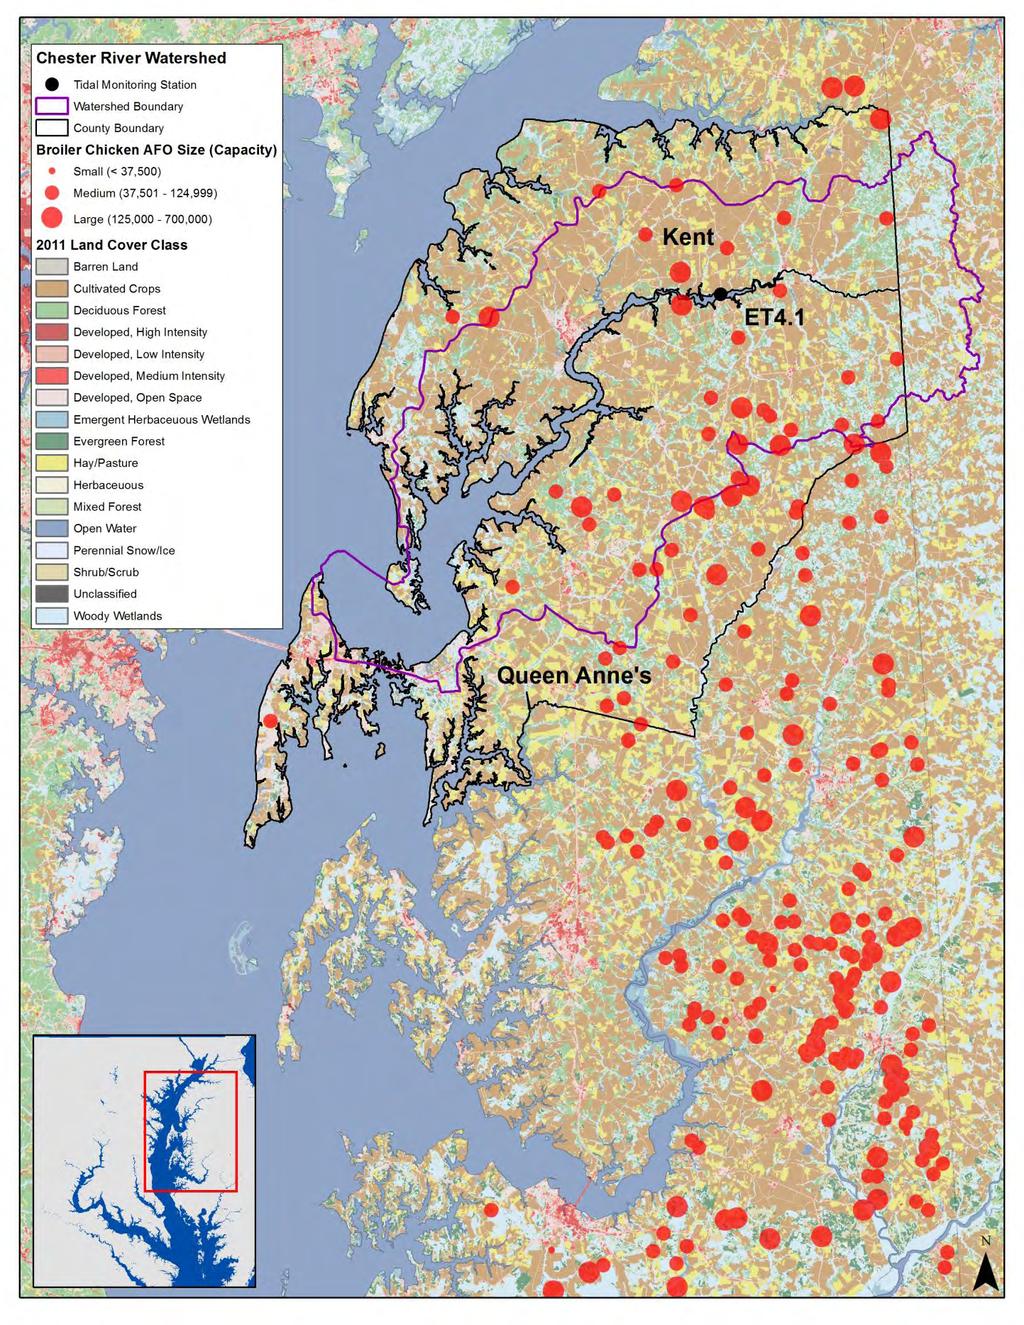
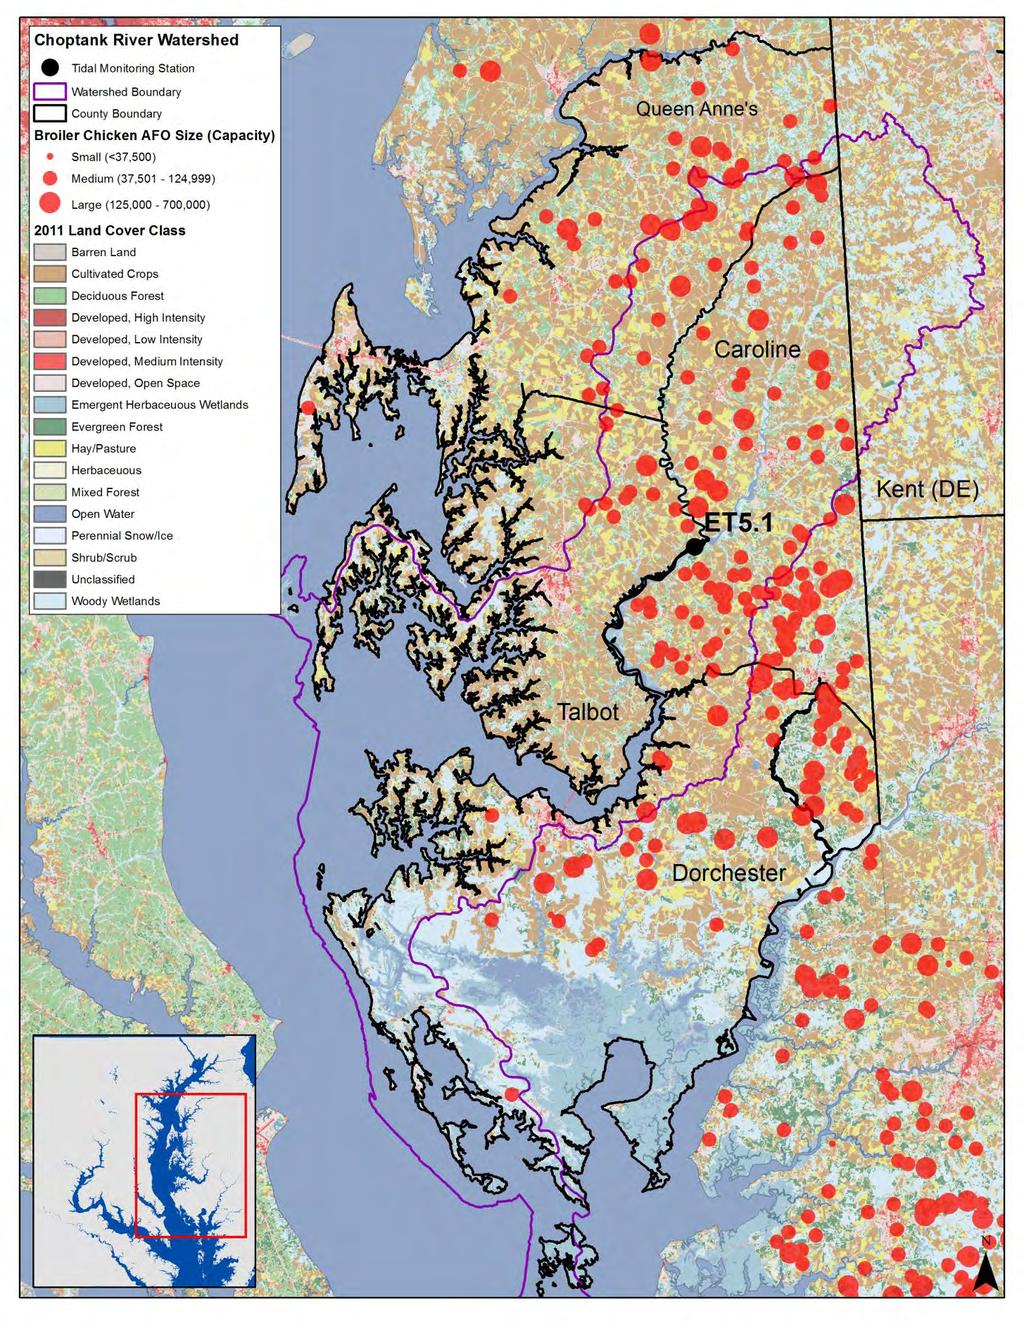
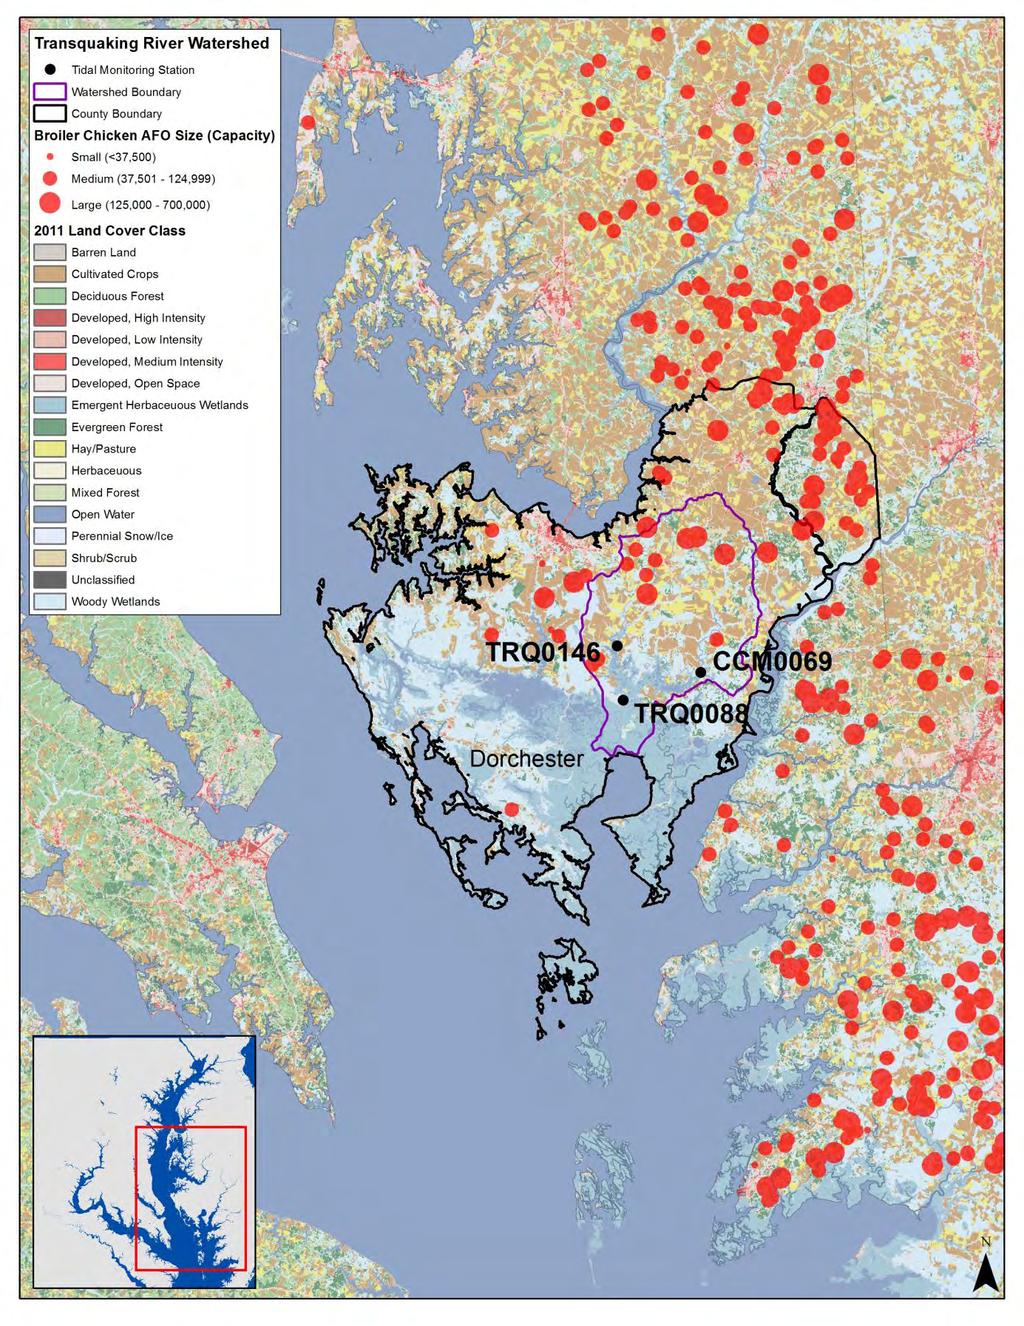
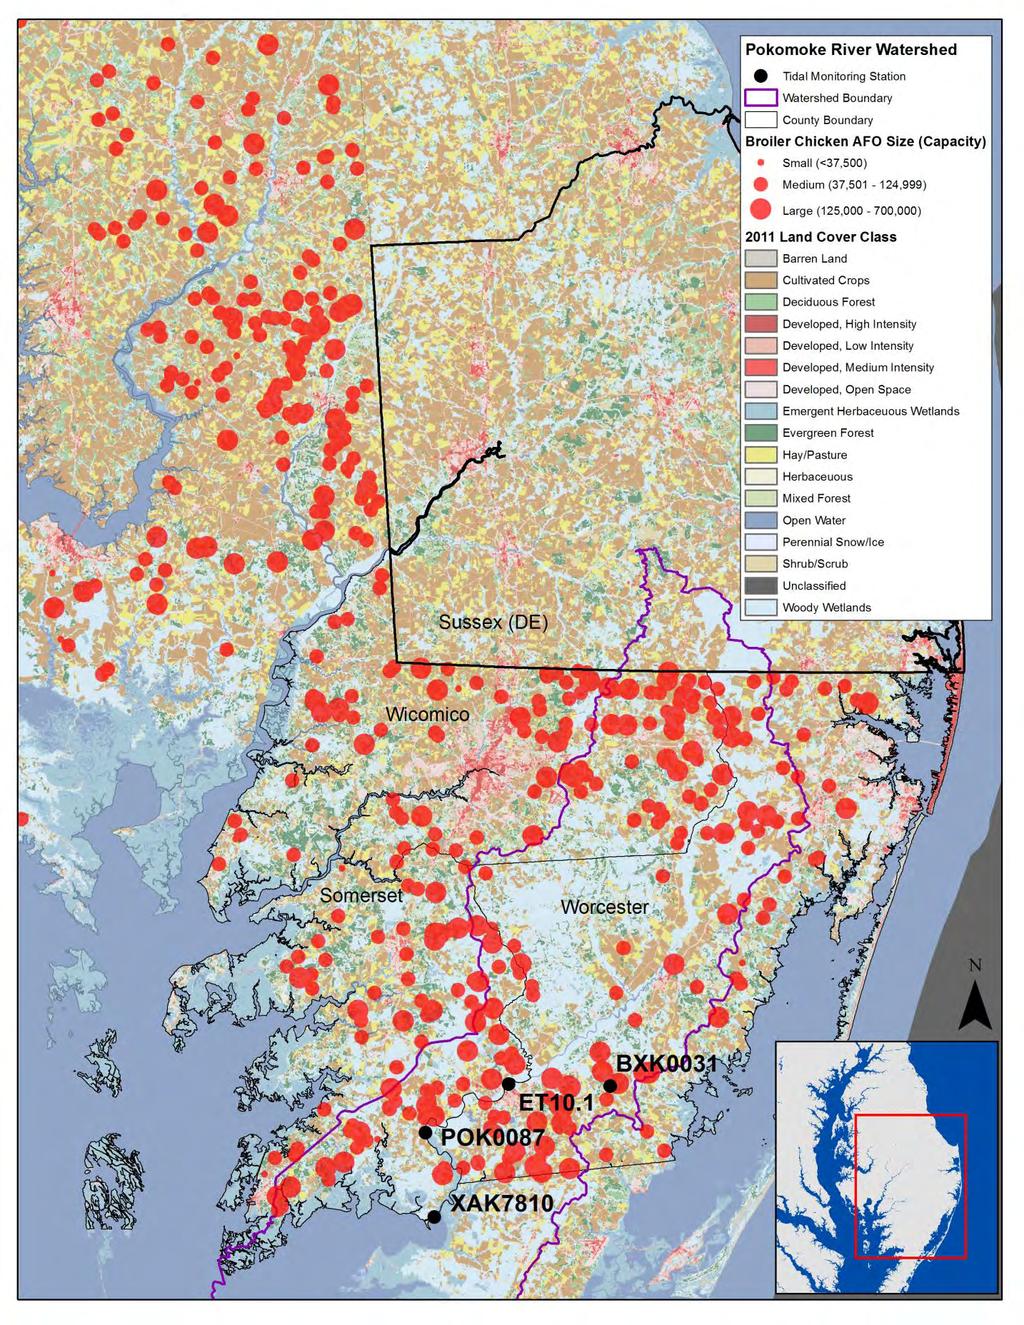
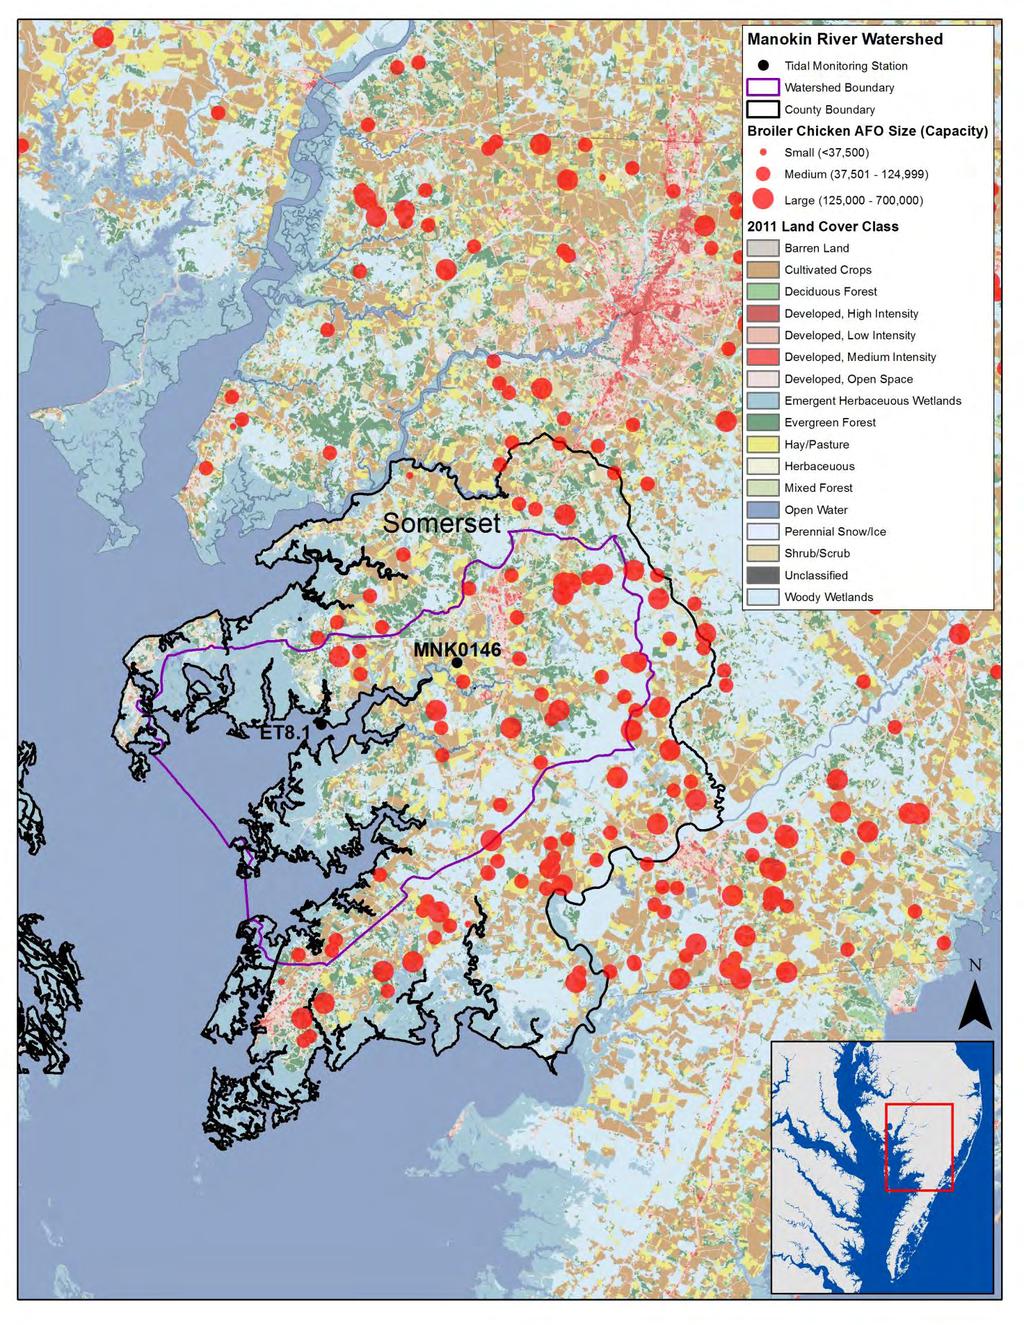
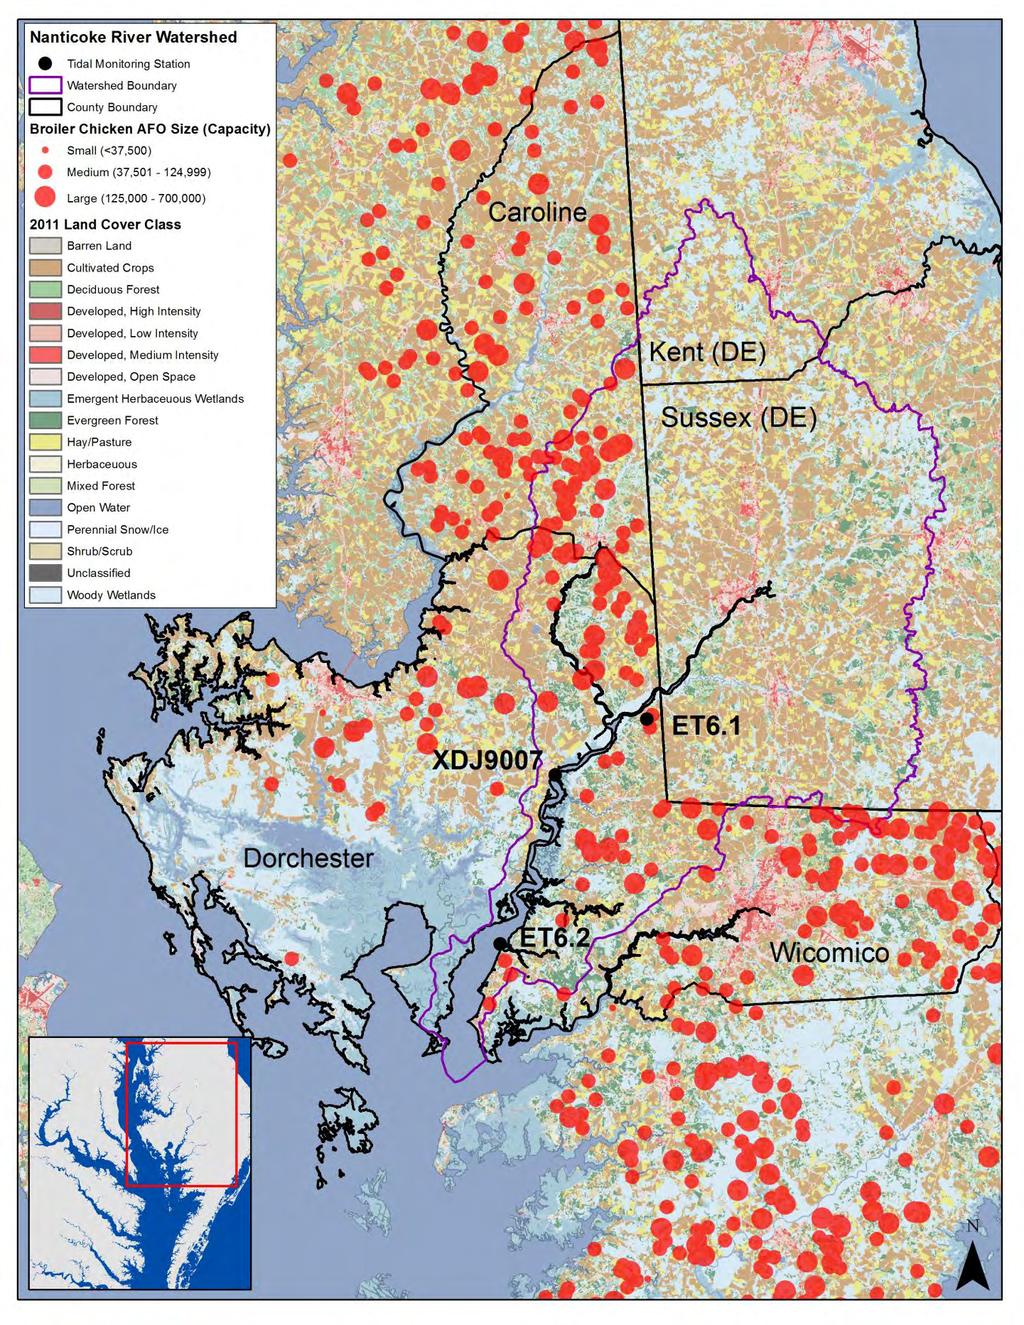
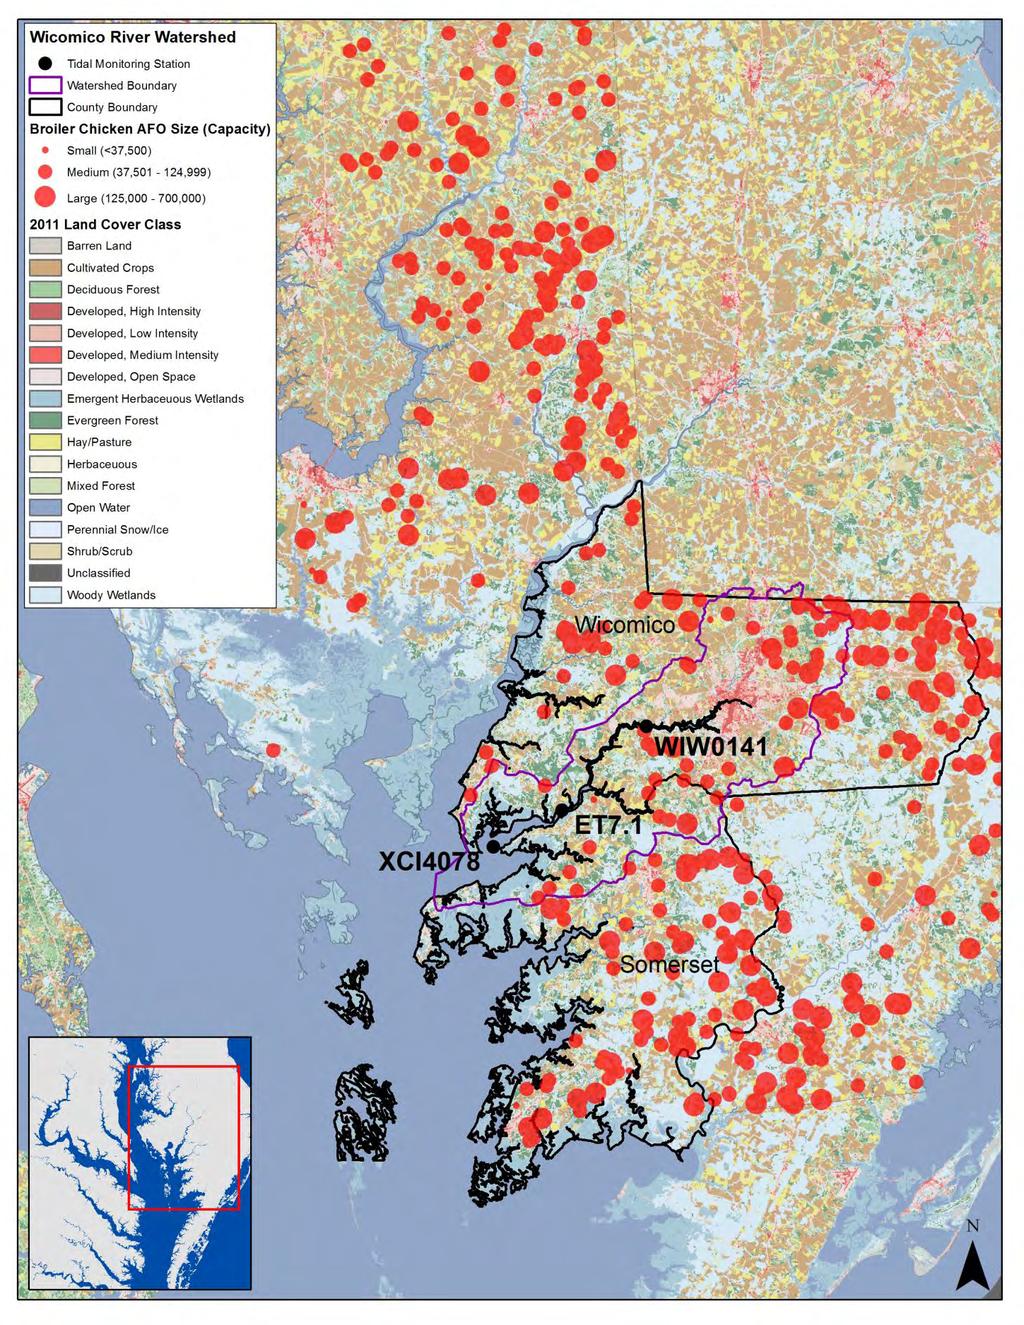
5 Figure 1. Map of tidal monitoring stations assessed and broiler chicken feeding operations on Maryland s Eastern Shore 4 5
6 Scope and Methods The Environmental Integrity Project examined water and habitat quality at 18 tidal monitoring locations in eight Eastern Shore waterways in order to: Quantify the extent to which seasonal average concentrations of phosphorus and chlorophyll-a exceeded water quality benchmarks from ; Determine whether seasonal average concentrations of phosphorus and chlorophyll-a have increased, decreased, or stagnated since 2003; Determine whether indices of biotic integrity indicate if waterways are or have been healthy enough to support healthy communities of fish and other aquatic life over the same time periods. Table 1. Data Sources Data Tidal waterway water quality monitoring data for total phosphorus and chlorophyll-a, and benthic index of biotic integrity scores for 3 tidal waterways ( ) Freshwater stream impairments and % attributable to agriculture ( ) Number of broiler chicken operations and broiler chicken, manure, and phosphate production by county 7 Broiler chicken animal feeding operation (AFO) locations Land Use/Land Cover by watershed; HUC 8 and 10 watershed boundaries Source Chesapeake Bay Program, samples collected by the Maryland Department of Resources (MDNR) 5 Maryland Biological Stream Survey Round 2 data, Watershed Report(s) for Biological Impairment Biological Stressor Identification Analysis Results and Interpretation, Maryland Department of the Environment ( ) 6 U.S. Department of Agriculture s 2012 Census of Agriculture 8 ; University of Maryland Extension 9 Chesapeake Commons and Center for Progressive Reform, original data obtained through public information requests to the Maryland Department of the Environment 10 U.S. Geological Survey (USGS) 2011 National Land Cover Dataset 11 ; USGS Watershed Boundary Dataset 12 We evaluated waterway conditions from by assessing three-year seasonal average concentrations of total phosphorus and chlorophyll-a at each monitoring station alongside relevant UMCES benchmark values. 13 The UMCES benchmarks represent concentrations of total phosphorus and chlorophyll-a that are characteristic of healthy waterways, and they vary by salinity and/or season. 14 Seasonal averages for total phosphorus include samples collected from March through September, spring chlorophyll-a concentrations include samples taken from March through May, and summer chlorophyll-a concentrations include samples taken from July through September. 15 The use of seasonal averages helps to smooth out changes in water flow, salinity, weather, and other sampling conditions that may vary from week to week or from one year to the next. We evaluated trends in total phosphorus and chlorophyll-a concentrations with scatter plots of seasonal average concentrations and a widely-used statistical trend test. 16 Examining trends allows us to determine whether conditions have improved, worsened, or remained stagnant over an extended period of time, as year-to-year comparisons may not reflect true trends due to 6
7 changes in flow, sources, and other factors. The trend analysis begins in 2003 because it marks when monitoring began in upstream portions of several Eastern Shore watersheds. 17 Trends are not flow-adjusted or flow-normalized, and they represent actual concentrations at the time of sampling. 18 Our results appear to follow similar patterns reported in a recent USGS 10-year analysis of flow-adjusted trends in non-tidal waterways leading to the Chesapeake Bay. 19 Index of biotic integrity (IBI) scores are based on field surveys conducted by the Maryland Department of Natural Resources and its contractors, and they are used to indicate whether aquatic habitat has been harmed by water pollution or other habitat-degrading alterations. These scores can apply to fish or benthic organisms like clams, snails, and worms. Most of this information dates from 2001 to 2004, so it could not be used to assess recent conditions or trends over the past ten years, though it provides some context and background on the extent of the water and habitat quality problems in the region. The amount of manure and total phosphorus produced was calculated by the Environmental Integrity Project based on the U.S. Department of Agriculture s 2012 Census of Agriculture s estimate of annual broiler chicken production by county. While manure generation varies from operation to operation, we assumed manure generation to be around 1 ton of manure per 1000 chickens. 20 We assumed that the average phosphate content in that manure, without any chicken litter, was around 2.81%. 21 These assumptions are based on manure production rate estimates and average phosphate content used by the University of Maryland Extension and presented to the Chesapeake Bay Program. 22 7

8 Figure 2. Map of Eastern Shore Watersheds 8
9 Results Phosphorus and Chlorophyll a: Pollution Far Above Benchmarks Average spring and summer total phosphorus concentrations from exceeded UMCES benchmarks at all but 2 out of 18 monitoring stations in the Eastern Shore tidal rivers. They exceeded these benchmarks by at least 160% in the Transquaking, 21% in the lower Pokomoke, 47% in the upper Choptank, 338% in the Manokin, 15% in the Nanticoke, 50% in the Wicomico, 69% in the Chester, and 64% in the Sassafras. One station in the Transquaking river recorded the highest levels, with average concentrations more than five times the UMCES benchmark from Concentrations of spring and summer chlorophyll-a were much higher in the Eastern Shore than the yardstick UMCES uses to identify unhealthy conditions. In , average spring concentrations exceeded benchmark levels by 51% to 1152% in the Transquaking, Upper Choptank, Manokin, and Sassafras. Results were mixed in the Nanticoke and Wicomico and were below benchmark values in the Lower Pocomoke and upper Chester. Summer chlorophyll-a concentrations exceeded benchmarks at all monitoring stations by 24% to 1005%, except at one monitoring station in the Lower Pokomoke that fell below the benchmark. From , the highest average spring concentration were more than 12 times the benchmark at one monitoring station in the Transquaking, and more than 11 times the benchmark at another location in the Sassafras. Table 2. Percent Above or Below Benchmark Values, Seasonal Average Concentrations River Station Total Phosphorus Spring Chlorophyll-a Summer Chlorophyll-a Transquaking TRQ % 318% 262% TRQ % 1152% 900% CCM % 86% 497% Lower Pokomoke BXK % -26% 47% POK % -68% 24% XAK % -25% 63% ET % -67% -45% Upper Choptank ET % 51% 119% Manokin ET8.1 0% 80% 31% MNK % 368% 381% Nanticoke ET6.2 58% 155% 132% XDJ % -21% 167% ET6.1 15% 77% 172% Wicomico ET7.1 50% 47% 125% WIW % 466% 703% XCI4078-3% -5% 29% Upper Chester ET4.1 69% -62% 90% 9
10 River Station Total Spring Summer Phosphorus Chlorophyll-a Chlorophyll-a Sassafras ET3.1 64% 107% 1005% Phosphorus and Chlorophyll-a Concentrations Since 2003: Little to No Improvement Trends from indicate that concentrations of total phosphorus and chlorophyll-a at most Eastern Shore monitoring stations have remained the same. Only chlorophyll-a concentrations in the Manokin appear to have improved. Both total phosphorus and spring chlorophyll-a concentrations have increased in the Sassafras. Trends in two waterways with multiple stations showed mixed results. Total phosphorus increased at one out of three stations in the Nanticoke, while summer concentrations of chlorophyll-a increased at two stations. Total phosphorus increased at two of the three stations in the Transquaking, and summer chlorophyll-a concentrations also increased at one of those stations. Table 3. Trends in Seasonal Average Concentrations, Waterway Station Total Phosphorus Spring Chlorophyll-a Summer Chlorophyll-a Lower Pokomoke BXK0031 No Change No Change No Change ET10.1 No Change No Change No Change POK0087 No Change No Change No Change XAK7810 No Change No Change No Change Manokin ET8.1 No Change Better Better MNK0146 No Change No Change No Change Upper Choptank ET5.1 No Change No Change No Change Nanticoke ET6.1 Worse No Change Worse ET6.2 No Change No Change No Change XDJ9007 No Change No Change Worse Sassafras ET3.1 Worse Worse No Change Transquaking CCM0069 Worse No Change Worse TRQ0088 No Change No Change No Change TRQ0146 Worse No Change No Change Upper Chester ET4.1 No Change No Change No Change Wicomico ET7.1 No Change No Change No Change WIW0141 No Change No Change No Change XCI4078 No Change No Change No Change Biotic Integrity: Habitat Quality Conditions for aquatic life in many of the tidal rivers and non-tidal streams on the Eastern Shore are mixed, but it is clear that many of these waterways are impaired due to low fish and benthic IBI scores. The Chesapeake Bay Benthic Monitoring Program monitors benthic conditions at a four fixed locations in the tidal portions of the Chester, Choptank, and Nanticoke Rivers. Benthic 10
11 IBI scores are available for each station from Scores below 3 indicate marginally degraded, degraded, or severely degraded conditions, while scores of 3 or above indicate relatively good conditions for sediment-dwelling organisms. Since 2003, Benthic IBI scores in the middle Chester River showed good conditions. In the upper Choptank, conditions were marginally degraded or degraded in 6 out of the 10 years since Conditions in the lower Choptank were slightly better, with marginally degraded or degraded conditions in 3 out of the 10 years. The Nanticoke River was in the worst condition by a long margin, with 8 out of the 10 years since 2003 falling into the marginally degraded, degraded, and severely degraded categories. Maryland Department of Natural Resources, in determining its list of impaired waterways under the Clean Water Act, assessed how many miles of non-tidal streams in specific watersheds were impaired, and what percentage of those impairments could be traced back to agriculture. 23 The upper and lower Choptank, Transquaking, middle and lower Chester, lower Wicomico, and upper Pokomoke were recently assessed based on data collected between 2000 and 2004 (Table 3). Twenty percent to 67% of the miles of non-tidal streams in these watersheds were found impaired due to low fish and/or benthic IBI scores. Of those impaired miles of streams, and when sources of the impairments were discernable, 42% to 92% of those impairments were attributed to agriculture. The Transquaking had the highest percentage of impaired stream miles (67%), and 92% of those miles of impaired waterways were traced back to agriculture. However, while 60% of streams in the lower Wicomico watershed were impaired with nutrients, the connection to agricultural sources was unclear. While MDNR s conclusions are based on data collected from , subsequent rounds of sampling have occurred or are currently underway. These results from the beginning of the decade help explain the lasting impact that intensive agriculture has on aquatic habitats. Table 4. Stream miles impaired due to low IBI scores, attributed to agriculture, Watershed % Stream Miles Impaired* % Due to Agriculture Upper Choptank Lower Choptank 45 60** Transquaking Middle Chester Lower Chester Lower Wicomico Upper Pocomoke * Impairments due to low IBI scores ** Agricultural sources of acidity 11
12 Sassafras River The Sassafras River rises in New Castle County in Delaware and courses between Kent and Cecil Counties in Maryland. Average seasonal concentrations of total phosphorus and chlorophyll-a observed in the Sassafras have exceeded benchmark values since at least Spring and summer concentrations of total phosphorus and spring concentrations of chlorophylla have increased since Water Quality Seasonal Average % +/- Benchmark Trend Parameter Station Benchmark Total Phosphorus (mg/l) ET % Worse Spring Chlorophyll-a (ug/l) ET % Worse Summer Chlorophyll-a (ug/l) ET % No Trend 2012 Broiler, Manure, and Phosphate Production by County 2011 Land Use No. Broiler Chickens Pounds of Manure Pounds of Phosphate County No. Poultry Operations Agriculture Forest 66% 17% Kent 9 4,665,000 9,330, ,173 Wetland 11% Cecil 10 (withheld) NA NA Urban 6% 12
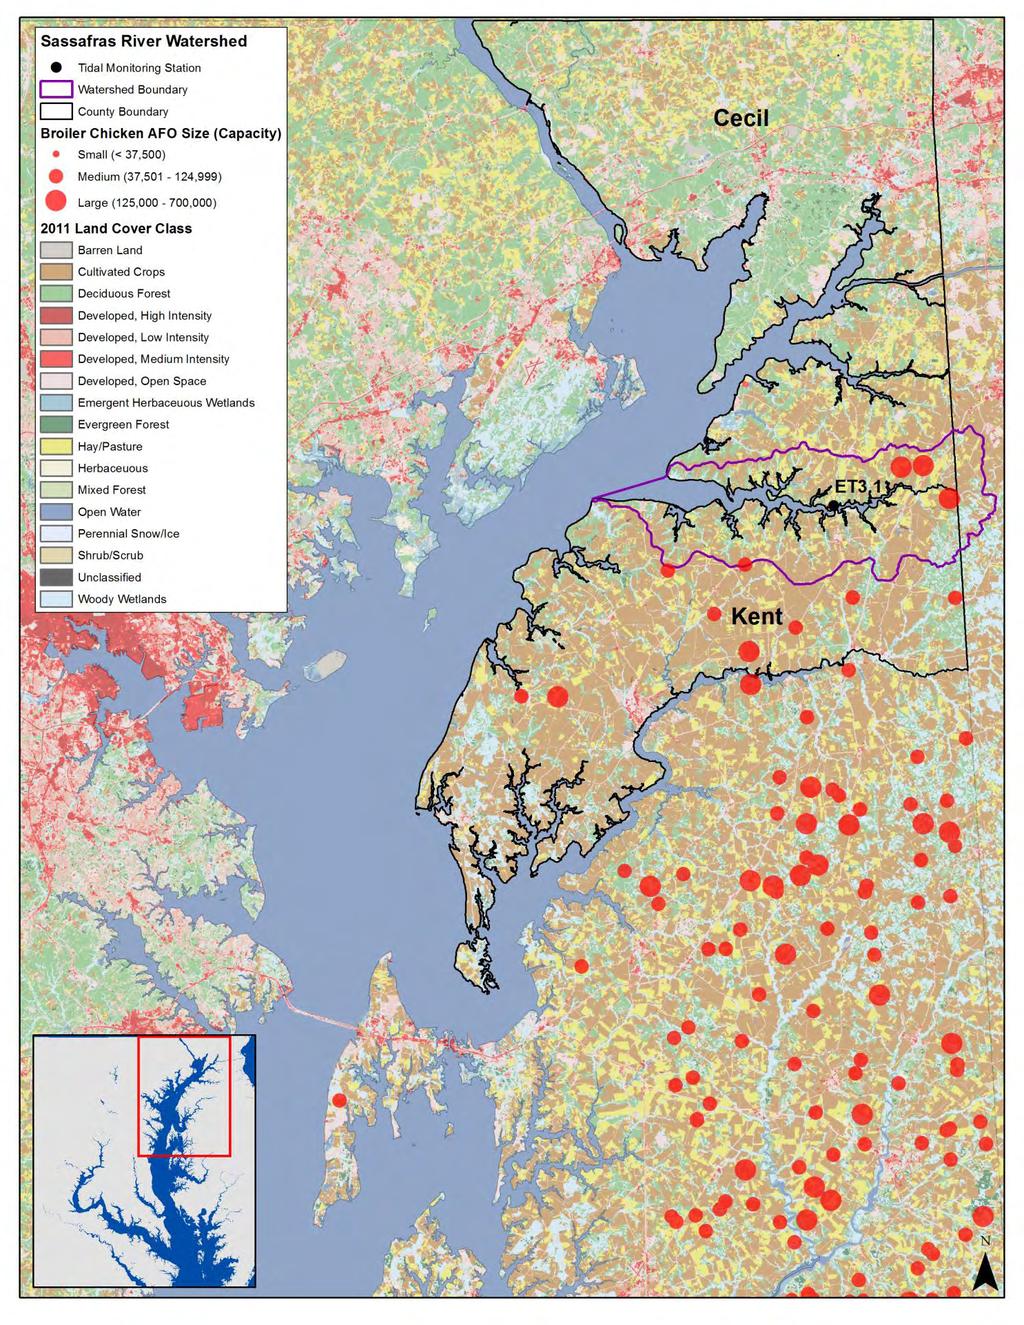
13 13
14 Upper Chester River The Chester River runs between Kent and Queen Anne s Counties in Maryland, and its headwaters originate in New Castle County, Delaware. Average seasonal concentrations of total phosphorus exceeded benchmark levels by 69% from Average spring chlorophyll-a concentrations were below benchmark values by 62%, and summer chlorophyll-a concentrations exceeded benchmark levels by 90% during the same time period. There was no significant trend in concentrations from 2003 to Water Quality Seasonal Average % +/- Benchmark Trend Parameter Station Benchmark Total Phosphorus (mg/l) ET % No Trend Spring Chlorophyll-a (ug/l) ET % No Trend Summer Chlorophyll-a (ug/l) ET % No Trend Benthic Conditions & Impairments Tidal River (Middle Chester) Freshwater Streams (Lower Chester, ) 2012 Benthic Condition (IBI score) Met Restoration Goals (3.53) % Stream miles impaired due to low IBI scores 20% % Impaired stream miles attributed to agriculture 2012 Broiler, Manure, and Phosphate Production by County 2011 Land Use No. Broiler Chickens Pounds of Manure Pounds of Phosphate County No. Poultry Operations Agriculture Forest 62% 17% Kent 9 4,665,000 9,330, ,173 Wetland 12% Queen Anne s 50 21,789,292 43,578,584 1,224,558 Urban 8% 79% 14
15 15
16 Upper Choptank River The Choptank River rises in Kent County, Delaware, courses through Caroline County and serves as the border between Talbot and Dorchester Counties in Maryland as it flows toward the Chesapeake Bay. Average seasonal concentrations of total phosphorus and chlorophyll-a exceeded benchmark values by % from There has been no trend in concentrations from Benthic conditions in the tidal Upper Choptank were degraded in 2012 (B-IBI score of 2.47) and have been variable since Water Quality Seasonal Average % +/- Benchmark Trend Parameter Station Benchmark Total Phosphorus (mg/l) ET % No Trend Spring Chlorophyll-a (ug/l) ET % No Trend Summer Chlorophyll-a (ug/l) ET % No Trend Benthic Conditions & Impairments Freshwater Streams (2000- Tidal River 2004) 2012 Benthic Condition (IBI score) Degraded (2.47) % Stream miles impaired due to low IBI scores 38% % Impaired stream miles attributed to agriculture 42% 2012 Broiler, Manure, and Phosphate Production by County 2011 Land Use No. Broiler No. Broiler Pounds of Pounds of Chicken Chickens Manure Agriculture 55% Phosphate County Operations Forest 14% Caroline ,703, ,407,000 3,523,937 Wetland 24% Dorchester 70 29,388,301 58,737,802 1,650,532 Urban 7% Talbot 30 9,333,120 18,666, ,521 Queen Anne s 50 21,789,292 43,578,584 1,224,558 Kent, DE ,533,471 75,066,942 2,109,381 16
17 17
18 Transquaking River The Transquaking River meanders through Dorchester County, Maryland and empties into Fishing Bay. Three tidal monitoring stations are located in the river, CCM0069, TRQ0088, and TRQ0146. Seasonal average concentrations of both total phosphorus and chlorophyll-a drastically exceeded benchmark values from at all three stations. Station CCM0069 recorded increasing levels of both total phosphorus and chlorophyll-a from Station TRQ0146 also recorded increases in total phosphorus concentrations over the same time period. According to the Maryland Department of Natural Resources, 67% of stream miles leading to the Transquaking are impaired due to low biotic integrity scores, and 92% of those impaired miles can be attributed to agriculture. Water Quality Seasonal Average % +/- Benchmark Trend Parameter Station Benchmark Total Phosphorus (mg/l) CCM % Worse TRQ % No Trend TRQ % Worse Spring Chlorophyll-a (ug/l) CCM % Worse TRQ % No Trend TRQ % No Trend Summer Chlorophyll-a (ug/l) CCM % No Trend TRQ % No Trend TRQ % No Trend Benthic Conditions & Impairments Tidal River Freshwater Streams ( ) 2012 Benthic Condition (IBI score) N/A % Stream miles impaired due to low IBI scores 67% % Impaired stream miles attributed to agriculture 2012 Broiler, Manure, and Phosphate Production by County 2011 Land Use 92% County No. Poultry Operations No. Broiler Chickens Pounds of Manure Pounds of Phosphate Dorchester 70 29,388,301 58,737,802 1,650,532 Agriculture 42% Forest 12% Wetland 42% Urban 3% 18
19 19
20 Lower Pokomoke River The Pokomoke River runs through Wicomico, Somerset, and Worchester counties in Maryland, after rising in Sussex County, Delaware. Four tidal sampling stations are located in this sub watershed; three in oligohaline segments (BXK0031, POK0087, and XAK7810) and one in a tidal fresh segment (ET10.1). Seasonal average concentrations of total phosphorus exceeded benchmark levels at all four stations, and summer concentrations of chlorophyll-a exceeded benchmark levels at three of the four stations from There was no significant trend in concentrations total phosphorus or chlorophyll-a from 2003 to According to the Maryland Department of Natural Resources, 35% of stream miles leading to the upper Pokomoke are impaired due to low biotic integrity scores, and 92% of those impaired miles can be attributed to agriculture. Water Quality Seasonal Average % +/- Benchmark Trend Parameter Station Benchmark Total Phosphorus (mg/l) BXK % No Trend POK % No Trend XAK % No Trend ET % No Trend Spring Chlorophyll-a (ug/l) BXK % No Trend POK % No Trend XAK % No Trend ET % No Trend Summer Chlorophyll-a (ug/l) BXK % No Trend POK % No Trend XAK % No Trend ET % No Trend Benthic Conditions & Impairments Tidal River Freshwater Streams (Upper Pokomoke, ) 2012 Benthic Condition (IBI score) N/A % Stream miles impaired due to low IBI scores 35% % Impaired stream miles attributed to agriculture 2012 Broiler, Manure, and Phosphate Production by County 2011 Land Use No. Broiler Chickens Lbs. of Manure Lbs. of Phosphate County No. Poultry Operations Agriculture Forest 27% 15% Wicomico ,122, ,244,564 3,210,272 Wetland 52% Worcester 99 55,509, ,019,256 3,119,641 Urban 6% Somerset 98 63,651, ,302,312 3,577,195 Sussex, DE ,042, ,085,300 9,781,197 92% 20
21 21
22 Manokin River The Manokin River runs through Somerset County in Maryland. Two tidal monitoring stations are located on the river, ET8.1 and MNK0146. Average seasonal concentrations of total phosphorus and chlorophyll-a exceeded benchmark values from , except at station ET10.1, where total phosphorus concentrations met benchmark levels. Spring and summer average chlorophyll-a concentrations have improved at station ET8.1 from 2003 to There were no significant trends in total phosphorus at both monitoring stations. There were also no significant trends in chlorophyll-a concentrations at station MNK0146. Water Quality Seasonal Average % +/- Benchmark Trend Parameter Station Benchmark Total Phosphorus (mg/l) ET % No Trend MNK % No Trend Spring Chlorophyll-a (ug/l) ET % Better MNK % No Trend Summer Chlorophyll-a (ug/l) ET % Better MNK % No Trend Benthic Conditions & Impairments Tidal River Freshwater Streams (Upper Pokomoke, ) 2012 Benthic Condition (IBI score) N/A % Stream miles impaired due to low IBI scores N/A % Impaired stream miles attributed to agriculture 2012 Broiler, Manure, and Phosphate Production by County 2011 Land Use No. Broiler Tons of Tons of No. Poultry Chickens Manure Phosphate Agriculture 24% County Operations Forest 17% Somerset 98 63,651, ,302,312 3,577,195 Wetland 52% Urban 7% N/A 22
23 23
24 Nanticoke River The Nanticoke River watershed spans over portions of Kent and Sussex counties in Delaware, and Caroline, Dorchester, and Wicomico Counties in Maryland. Three tidal monitoring stations are located in the river, ET6.1, ET6.2, and XDJ9007. Seasonal average concentrations of total phosphorus and chlorophyll-a exceeded benchmark values from at all monitoring stations, except for station XDJ9007 where spring chlorophyll-a concentrations were below the benchmark. Station ET6.1 recorded increasing concentrations of both total phosphorus and summer chlorophyll-a, and station XDJ9007 recorded increasing concentrations of summer chlorophyll-a concentrations from 2003 to Benthic conditions in the tidal portion of the river were degraded in 2012 and have been degraded to some degree since Water Quality Seasonal Average % +/- Benchmark Trend Parameter Station Benchmark Total Phosphorus (mg/l) ET % No Trend XDJ % No Trend ET % Worse Spring Chlorophyll-a (ug/l) ET % No Trend XDJ % No Trend ET % No Trend Summer Chlorophyll-a (ug/l) ET % No Trend XDJ % Worse ET % Worse Benthic Conditions & Impairments Tidal River Freshwater Streams ( ) 2012 Benthic Condition (B-IBI score) Degraded (2.6) % Stream miles impaired due to low IBI scores N/A % Impaired stream miles attributed to agriculture 2012 Broiler, Manure, and Phosphate Production by County 2011 Land Use County No. Poultry Operations No. Broiler Chickens Tons of Manure Tons of Phosphate N/A Agriculture 48% Forest 13% Kent, DE ,533,471 75,066,942 2,109,381 Wetland 26% Sussex, DE ,042, ,085,300 9,781,197 Urban 6% Dorchester, MD 70 29,388,301 58,737,802 1,650,532 Wicomico, MD ,122, ,244,564 3,210,272 24
25 25
26 Wicomico River The Wicomico River courses through Wicomico and Somerset counties in Maryland. There are three tidal monitoring stations in this watershed, WIW-141, ET7.1, and XCI4078. Stations ET7.1 and WIW0141 had seasonal average concentrations of total phosphorus and chlorophyll-a above benchmark values from Total phosphorus and spring chlorophyll-a concentrations hovered below benchmark values at station XCI4078 from , while average summer chlorophyll-a concentrations exceeded benchmark values during the same time period. There were no significant trends in concentrations observed from 2003 to According to the Maryland Department of Natural Resources, 60% of stream miles leading to the Wicomico River are impaired due to low biotic integrity scores. MDNR was unable to confidently associate the impairments with a possible source, though nutrients are a major cause of the low biotic integrity scores. The Wicomico watershed also has the most urban land use of the Eastern Shore watersheds, and the river receives wastewater from the City of Salisbury. Water Quality Seasonal Average % +/- Benchmark Trend Parameter Station Benchmark Total Phosphorus (mg/l) ET % No Trend WIW % No Trend XCI % No Trend Spring Chlorophyll-a (ug/l) ET % No Trend WIW % No Trend XCI % No Trend Summer Chlorophyll-a (ug/l) ET % No Trend WIW % No Trend XCI % No Trend Benthic Conditions & Impairments Tidal River Freshwater Streams ( ) 2012 Benthic Condition (B- IBI score) N/A % Stream miles impaired due to low IBI scores 60% % Impaired stream miles attributed to agriculture 2012 Broiler, Manure, and Phosphate Production by County 2011 Land Use No. Broiler Chickens Pounds of Manure Pounds of Phosphate County No. Poultry Operations Agriculture Forest 29% 24% Wicomico ,122, ,244,564 3,210,272 Wetland 29% Somerset 98 63,651, ,302,312 3,577,195 Urban 18% N/A 26
27 27
28 1 Chesapeake Bay Program 2 Water quality data was not adjusted or normalized by river flow in order to maintain its comparability to healthy concentrations identified by the University of Maryland Center for Environmental Sciences. 3 University of Maryland Center for Environmental Sciences, Why We Need the Phosphorus Management Tool (PMT), January 7, 2014, available from: 20Updated.pdf 4 Chesapeake Bay monitoring station locations were downloaded from the Chesapeake Bay Program. AFO locations were downloaded from All maps are presented in WGS 1984 Web Mercator Auxiliary Sphere. Some stations in the eastern shore watersheds were omitted because they were located too close to open Bay waters. 5 CBP Water Quality Database (1984-present). Available from: Sampling results used in this analysis were collected by the Maryland Department of Natural Resources. 6 Maryland Department of the Environment, Biological Stressor Identification Studies ( ), available from: 7 While poultry operations can be located in specific watersheds and counties, chicken manure can be spread on fields that lie beyond those boundaries. We did not feel it was necessary to present poultry operation statistics on a watershed level because it would not reduce any uncertainty about where manure from a specific poultry operation could enter a waterway. At the time of this analysis, the USDA Census of Agriculture had not provided 2012 statistics by watershed. 8 U.S. Department of Agriculture 2012 Census of Agriculture, Maryland and Delaware Counties, Table 19; available from: 9 University of Maryland Extension, 2003 Manure Summary Report, available from: 11.pdf 10 Chesapeake Commons.org, Maryland AFO locations, project for the Center for Progressive Reform (2013), data available from: 11 Jin, S., Yang, L., Danielson, P., Homer, C., Fry, J., and Xian, G A comprehensive change detection method for updating the National Land Cover Database to circa Remote Sensing of Environment, 132: GIS dataset available from: 12 USGS Watershed Boundary Dataset available from: 13 Integration and Application Network, University of Maryland Center for Environmental Science, Chesapeake Bay Report Card, 14 Id. 15 June is considered a highly variable month for chlorophyll-a, and the benchmark values do not apply during June. See: Buchannan, et al. (2005) Phytoplankton Reference Communities for Chesapeake Bay and its Tidal Tributaries, Estuaries. (28:1) pp We employed the Mann-Kendall trend test. For more information about this method, see D.R. Helsel and R.M. Hirsch, US Geological Survey, Techniques of Water-Resources Investigations, Book 4, Statistical Methods in Water Resources, Chapter 12, Trend Analysis. Available online at: Trend calculations were carried out in R, a free, open-source statistical computing program. 17 According to the USGS, this is likely a short term analysis. However, due to the limited amount of data available prior to 2003 in many for these locations, a longer-term trend analysis was not possible. See: USGS (2013) Summary of Trends and Yields Measures at the Chesapeake Bay Nontidal Network Sites: Water Year 2012 Update, available from: 18 See: USGS National Water-Quality Assessment Program (2008) Nutrient Trends in Streams and Rivers of the United States, Pp See also: note USGS (2013) Summary of Trends and Yields Measures at the Chesapeake Bay Nontidal Network Sites: Water Year 2012 Update, available from: 20 Glancey, et al. (2011) Comparison of Methods for Estimating Poultry Manure Nutrient Generation in the Chesapeake Bay Watershed, PowerPoint presentation available from: 28
29 21 University of Maryland Extension, 2003 Manure Summary Report, available at: 11.pdf 22 Supra, n. 20 and Maryland Department of the Environment, Biological Stressor Identification Studies, available from: 29
Eutrophication: Tracing Nutrient Pollution Back to Penns Creek
 Eutrophication: Tracing Nutrient Pollution Back to Penns Creek Nutrients are substances that life depends on for growth and reproduction. However, when these nutrients enter our planets waterways in excess,
Incorporating monitoring, modeling and trends analyses into management decisions: a Choptank River example
 Incorporating monitoring, modeling and trends analyses into management decisions: a Choptank River example Emily Trentacoste, PhD EPA Chesapeake Bay Program WQGIT Meeting 7/10/2017 DRAFT. DO NOT CITE OR
Fact Sheet. Chesapeake Bay Water Quality
 Fact Sheet Chesapeake Bay Water Quality Water quality is a critical measure of the Chesapeake Bay s health. For the Bay to be healthy and productive, the water must be safe for people and must support
Murky Waters. More Accountability Needed for Agricultural Pollution in the Chesapeake Bay
 Murky Waters More Accountability Needed for Agricultural Pollution in the Chesapeake Bay July 14, 2014 About the Environmental Integrity Project The Environmental Integrity Project (EIP) is a nonpartisan,
Delmarva Whole System Conservation Partnership
 Delmarva Whole System Conservation Partnership From Field to Stream Semi-annual Report Submitted to NRCS vember 30, 2017 Project Period: October 1, 2017 March 31, 2018 Submitted by: The Nature Conservancy
Total Maximum Daily Load Development for Unnamed Tributary to Pitts Creek. Public Meeting March 26, Why Are We Here
 Total Maximum Daily Load Development for Unnamed Tributary to Pitts Creek Public Meeting March, Why Are We Here. Learn about water quality of the stream. Discuss the Total Maximum Daily Load (TMDL) development.
Decision Rationale. Total Maximum Daily Load for Phosphorus for the Sassafras River, Cecil and Kent Counties, Maryland 4/1/2002
 Decision Rationale I. Introduction Total Maximum Daily Load for Phosphorus for the Sassafras River, Cecil and Kent Counties, Maryland 4/1/2002 The Clean Water Act (CWA) requires a Total Maximum Daily Load
MARYLAND NUTRIENT MANAGEMENT PROGRAM
 MARYLAND NUTRIENT MANAGEMENT PROGRAM Improved Implementation Increased Compliance and Enforcement Enhanced Accountability 2009 Annual Report Message from Secretary Hance Improved implementation, increased
Chesapeake Bay Program Indicator Analysis and Methods Document Reducing Pollution Indicators Updated May 2018
 1 Chesapeake Bay Program Indicator Analysis and Methods Document Reducing Pollution Indicators Updated May 2018 Indicator Title: Reducing Pollution Relevant Outcome(s): 2017 Watershed Implementation Plans
BAY BAROMETER. Health and Restoration. in the Chesapeake Watershed
 BAY BAROMETER 212-213 Health and Restoration in the Chesapeake Watershed AT A GLANCE 212-13 BAY HEALTH RESTORATION Water Quality Wetlands 29 percent of the Bay and its tidal rivers met overall conditions
CHESAPEAKE BAY COMPREHENSIVE WATER RESOURCES AND RESTORATION PLAN. Habitat GIT Meeting 9 May 2017
 CHESAPEAKE BAY COMPREHENSIVE WATER RESOURCES AND 255 255 255 237 237 237 0 0 0 217 217 217 163 163 163 200 200 200 131 132 122 239 65 53 80 119 27 RESTORATION PLAN 110 135 120 252 174.59 112 92 56 62 102
Nutrient Management for Water Quality Protection : A Case Study of Delaware
 Scientific registration n o : 1947 Symposium n o : 25 Presentation: Poster Nutrient Management for Water Quality Protection : A Case Study of Delaware's Inland Bays Watershed Gestion des nutriments pour
Restoring a National Treasure: Chesapeake Bay. Presented by Dan Nees, Director Environmental Finance Center University of Maryland April 27, 2007
 Restoring a National Treasure: Chesapeake Bay Presented by Dan Nees, Director Environmental Finance Center University of Maryland April 27, 2007 Agenda Introduction to the Chesapeake Bay Restoration challenges
Chesapeake Bay Program Partnership s Scientific, Technical Assessment and Reporting (STAR) Team Briefing and Options Paper:
 Team Briefing and Options Paper:") Chesapeake Bay Program Partnership s Scientific, Technical Assessment and Reporting (STAR) Team Briefing and Options Paper: Addressing CBP Partnership s and Non-tidal Monitoring Network s 2013 Funding
Chesapeake Bay Program Partnership s Scientific, Technical Assessment and Reporting (STAR) Team Briefing and Options Paper: Addressing CBP Partnership s and Non-tidal Monitoring Network s 2013 Funding
Water Resources Element Appendix
 Appendix Housing Unit Projection Methodology The following assumptions were used to develop the housing unit projections for each Water Resources Element. All projections described in the and this Appendix
APPENDIX A. Nutrient Trading Criteria Specific for the Chesapeake Bay Watershed
 Purpose: APPENDIX A Nutrient Trading Criteria Specific for the Chesapeake Bay Watershed The purpose of Appendix A is to provide additional program specific information regarding the use and incorporation
STATE OF THE BAY IN 2012
 9 10 11 STATE OF THE BAY IN 2012 Nitrogen &!Phosphorus Bay-wide nitrogen loads were similar to 2010, but phosphorus loads decreased. These loads are highly elated to river flows and stormwater runoff that
From My Backyard to Our Bay It s the 911 for the Chesapeake Bay
 From My Backyard to Our Bay Reporting Problems on Our Bay, Rivers, and Streams We can all be the eyes and ears of our local waterways. Maryland has established the Chesapeake Bay Safety and Environmental
Monitoring Data in Support of Mid-Point Assessment
 Monitoring Data in Support of Mid-Point Assessment Doug Moyer Joel Blomquist, Jeni Keisman Based on contributions from dozens of incredibly smart and dedicated scientists 1 Using Monitoring Data To Measure
Protecting & Restoring Local Waters and the Chesapeake Bay
 Protecting & Restoring Local Waters and the Chesapeake Bay Restore America s Estuaries National Conference Gregory Barranco Chesapeake Bay Program Office November 2010 The Chesapeake Bay and Watershed
Reducing Nitrogen, Phosphorus and Sediment Pollution Progress Update. Jeff Corbin, Senior Advisor to the EPA Administrator
 Reducing Nitrogen, Phosphorus and Sediment Pollution Progress Update Jeff Corbin, Senior Advisor to the EPA Administrator Reducing Pollution Briefing Package Overview 1. 29-11 Milestones 2. 211 Progress
The Chesapeake Bay Program
 The Chesapeake Bay Program Partnership, Progress and the Path Forward to Restore the Bay University of Delaware Nutrient Management Symposium August 22, 2011 Jon M. Capacasa, P.E., Director Water Protection
Where are Phosphorus Imbalances in the Chesapeake Bay Watershed?
 Where are Phosphorus Imbalances in the Chesapeake Bay Watershed? Chesapeake Bay Goal Line 2025:Opportunities for Enhancing Agricultural Conservation Hunt Valley, Maryland October 6, 2010 Mark P. Dubin
THE ROLE OF MEMBRANE BIOREACTORS IN ADDRESSING CHESAPEAKE BAY CHALLENGES. Introduction. Chesapeake Bay Water Quality Challenges
 THE ROLE OF MEMBRANE BIOREACTORS IN ADDRESSING CHESAPEAKE BAY CHALLENGES Zohreh Movahed, WATEK Engineering Corporation, 604 S. Frederick Ave, Suite 309, Gaithersburg, MD 20877, zmovahed@watek.com, (240)
Osher Course. What Lies Beneath the Inland Bays?
 Osher Course What Lies Beneath the Inland Bays? Objectives for Course Describe the Delaware Inland Bays and their tributaries Illustrate the ecology and importance of estuaries Demonstrate the threats
Water Quality Standards Attainment
 2017 WIP, 2025 WIP and Water Quality Standards Attainment Management Strategy 2015 2025, v.1 I. Introduction For the past 30 years, the Chesapeake Bay Program (CBP) partnership 1 has been committed to
Watch Us WIP, Now Watch Us Bay Bay: Delaware s Choreographed Approach to Chesapeake Bay Restoration
 Watch Us WIP, Now Watch Us Bay Bay: Delaware s Choreographed Approach to Chesapeake Bay Restoration Session Presenters Marcia Fox, DNREC, Nonpoint Source Program Brooks Cahall, DNREC, Drainage Program
Full Title of Priority: Enhanced Analysis and Explanation of Water-Quality Data for the TMDL Mid-Point Assessment
 MIDPOINT ASSESSMENT PRIORITY WORK PLAN: MEASURE AND EXPLAIN WATER-QUALITY CHANGES LEAD: SCIENTIFIC, TECHNICAL ANALYSIS, AND REPORT (STAR) TEAM 2016-17 EXPECTATIONS Full Title of Priority: Enhanced Analysis
Restoring the Water-Quality Conditions in the Chesapeake Bay: What is working and what still needs to be done
 Restoring the Water-Quality Conditions in the Chesapeake Bay: What is working and what still needs to be done Scott Phillips, USGS Water-Quality Goal Team January 12, 2015 Many Contributors Authors: Christina
MARYLAND DEPARTMENT OF THE ENVIRONMENT 1800 Washington Boulevard Baltimore MD
 MARYLAND DEPARTMENT OF THE ENVIRONMENT 1800 Washington Boulevard Baltimore MD 21230 410-537-3000 1-800-633-6101 Martin O Malley Governor Anthony G. Brown Lieutenant Governor November 6, 2009 Shari T. Wilson
Redwood Shores Lagoon November 2016 Monthly Water Quality Monitoring Report
 Redwood Shores Lagoon November 2016 Monthly Water Quality Monitoring Report Prepared for Redwood City Public Works Services Department 1400 Broadway Redwood City, CA 94063-2594 Prepared by Clean Lakes,
Delmarva Land & Litter Challenge
 Delmarva Land & Litter Challenge Choptank River Symposium Todd Center for the Performing Arts, Chesapeake College August 9, 2016 Ernie Shea, Project Facilitator Chesapeake Bay by the Numbers Land-to-water
Redwood Shores Lagoon February 2019 Monthly Water Quality Monitoring Report
 Redwood Shores Lagoon February 2019 Monthly Water Quality Monitoring Report Prepared for Redwood City Public Works Services Department 1400 Broadway Redwood City, CA 94063-2594 Prepared by Clean Lakes,
Chesapeake Bay. report card
 Chesapeake Bay report card 2010 C- C Healthy water quality provides better habitat conditions for crabs, fish, and other aquatic species. issolved oxygen is essential to the survival of all these organisms;
2014 Chesapeake Bay Watershed Agreement:
 2014 Chesapeake Bay Watershed Agreement: Management Strategy for the 2017 WIP Outcome, 2025 WIP Outcome, and Water Quality Standards Attainment & Monitoring Outcome Introduction Draft February 9, 2015
Prepared by: Maryland Department of the Environment 2500 Broening Highway Baltimore, MD Submitted to:
 Total Maximum Daily Loads of Nitrogen, Phosphorus and Biochemical Oxygen Demand for the Lower Wicomico River Wicomico County and Somerset County, Maryland Prepared by: Maryland Department of the Environment
U.S. Environmental Protection Agency s Interim Expectations for the Phase III Watershed Implementation Plans
 U.S. Environmental Protection Agency s Interim Expectations for the Phase III Watershed Implementation Plans The U.S. Environmental Protection Agency (EPA) provided expectations for the Phase I 1 and Phase
Fact Sheet. Pennsylvania s Chesapeake Bay Tributary Strategy Goals for Nutrient and Sediment Reduction and Habitat Restoration
 Fact Sheet Commonwealth of Pennsylvania Department of Environmental Protection Pennsylvania s Chesapeake Bay Tributary Strategy Goals for Nutrient and Sediment Reduction and Habitat Restoration Why were
Redwood Shores Lagoon May 2017 Monthly Water Quality Monitoring Report
 Redwood Shores Lagoon May 2017 Monthly Water Quality Monitoring Report Prepared for Redwood City Public Works Services Department 1400 Broadway Redwood City, CA 94063-2594 Prepared by Clean Lakes, Inc.
Living in the Chesapeake Bay Watershed. far-removed from every day life, only remembered when its time to go on holiday.
 Delilah Torres March 19, 2008 Environmental Policies Living in the Chesapeake Bay Watershed For people living in more urban areas, the Chesapeake Bay may seem like it is extremely far-removed from every
Natural Resources & Environmental Stewardship
 Natural Resources & Environmental Stewardship Fundamentals of Nutrient Management Melissa L. Wilson Department of Environmental Science & Technology Ag Nutrient Management Program University of Maryland,
Fact Sheet Commonwealth of Pennsylvania Department of Environmental Protection
 Fact Sheet Commonwealth of Pennsylvania Department of Environmental Protection Pennsylvania s Chesapeake Bay Tributary Strategy Frequently Asked Questions Why is Pennsylvania revising its Chesapeake Bay
Little Bay Water Quality Report Card Spring 2014
 Little Bay Water Quality Report Card Spring 2014 Little Bay is a small, semi-enclosed estuary located in the heart of Rockport, Texas. Estuaries, where freshwater from rivers and streams mixes with salt
Biological Uplift in Stream Restoration Projects. September 20, Presentation by: Wetlands and Waterways Program
 Biological Uplift in Stream Restoration Projects September 20, 2017 Presentation by: Wetlands and Waterways Program Integrated Water Planning Program Maryland Department of the Environment Wetlands & Waterways
Finalizing the Chesapeake Bay Health Index (BHI)
") Finalizing the Chesapeake Bay Health Index (BHI) Part 1: Water Quality Index Part 2: Biotic Index Bill Dennison Ben Longstaff, Michael Williams, Claire Buchanan, Roberto Llansó, and Peter Bergstrom On
Finalizing the Chesapeake Bay Health Index (BHI) Part 1: Water Quality Index Part 2: Biotic Index Bill Dennison Ben Longstaff, Michael Williams, Claire Buchanan, Roberto Llansó, and Peter Bergstrom On
Chesapeake Bay Program in Pennsylvania. Karl G. Brown Executive Secretary PA State Conservation Commission
 Chesapeake Bay Program in Pennsylvania Karl G. Brown Executive Secretary PA State Conservation Commission 1 PA s Chesapeake Basin Over 50 percent of the land in PA drains to the Chesapeake Bay The Susquehanna
Analysis of Chlorophyll-a and other data collected in the Illinois River Watershed from
 Analysis of Chlorophyll-a and other data collected in the Illinois River Watershed from 1996-2003 By W.J. Andrews and D.N. Mott USGS Oklahoma Water Science Center For the Oklahoma Clean Lakes and Watersheds
Chesapeake Bay Water Quality Restoration:
 Chesapeake Bay Water Quality Restoration: The Transition to a Regulatory Approach Building on Decades of Cooperative Partnership Rich Batiuk Assoc. Director for Science Chesapeake Bay Program Office U.S.
Understanding Nutrients in the Chesapeake Bay Watershed and Implications for Management and Restoration the EASTERN SHORE
 Understanding Nutrients in the Chesapeake Bay Watershed and Implications for Management and Restoration the EASTERN SHORE Scott W. Ator and Judith M. Denver Guest presented by Joel Blomquist A summary
EXECUTIVE SUMMARY DRAFT CHESAPEAKE BAY TMDL
 EXECUTIVE SUMMARY DRAFT CHESAPEAKE BAY TMDL Introduction The U.S. Environmental Protection Agency has released the draft Chesapeake Bay Total Maximum Daily Load (TMDL), a pollution diet that will compel
Chesapeake Bay Nitrogen Assessments
 Chesapeake Bay Nitrogen Assessments May 20, 2010 Workshop on Nitrogen Assessment Science in the USA Thomas E. Jordan Chesapeake Bay Watershed Area=167,000 km 2 Spans 6 states + DC 6 physiographic provinces
The Snapshot CONODOGUINET CREEK WATERSHED SNAPSHOT
 CONODOGUINET CREEK WATERSHED SNAPSHOT ABOVE: CONODOGUINET CREEK AT RT 74 BRIDGE FACING DOWNSTREAM The Snapshot The Conodoguinet Watershed Snapshot was a collaborative effort to engage local citizens in
Restoring the Chesapeake Bay Challenges & Opportunities
 Restoring the Chesapeake Bay Challenges & Opportunities Jeff Corbin Senior Advisor for Chesapeake Bay U.S. EPA May 29, 2014 A few things to talk about History of Bay Restoration How are we doing? What
Phosphorus Goal Setting Process Questions and Answers 2010
 Lake Winnipesaukee Watershed Management Plan Phase I: Meredith, Paugus, Saunders Bays 1. What is phosphorus? Phosphorus (P) is a naturally occurring element and a major nutrient required for biological
Stay Strong on Stormwater
 Stay Strong on Stormwater December 2013 HARFORD COUNTY HAS A PROBLEM: POLLUTED RUNOFF FOULS OUR WATER, CLOSES OUR BEACHES, THREATENS OUR HEALTH Polluted runoff is a major source of water pollution in Harford
The Choice is Ours... Let s choose clean water
 The Choice is Ours... Let s choose clean water State of the James River 29 Background Since the founding of America on its banks 4 years ago, the James River has played a central and defining role in the
Unsustainable Agriculture. Pennsylvania s Manure Hot Spots and their Impact on Local Water Quality and the Chesapeake Bay
 Unsustainable Agriculture Pennsylvania s Manure Hot Spots and their Impact on Local Water Quality and the Chesapeake Bay AUGUST 31, 2017 ACKNOWLEDGEMENTS This report was researched and written by Abel
Poultry Litter Use and Transport in Caroline, Queen Anne s, Somerset and Wicomico Counties in Maryland: A Summary Report
 MAWP 0601 Poultry Litter Use and Transport in Caroline, Queen Anne s, Somerset and Wicomico Counties in Maryland: A Summary Report Doug Parker, Associate Professor Qing Li, Graduate Research Assistant
Redwood Shores Lagoon August Monthly Water Quality Monitoring Report
 Redwood Shores Lagoon August Monthly Water Quality Monitoring Report Prepared for Redwood City Public Works Services Department 1400 Broadway Redwood City, CA 94063-2594 Prepared by Clean Lakes, Inc. P.
Lake of the Pines. Watershed TMDL. Depressed DO conditions in 3,700 acres of upper reservoir; declining
 Lake O O the Pines Watershed TMDL Presented at: 15 th National NPS Monitoring Workshop August 27, 2007 Vernon D. Rowe, P.E. Pilgrim s Pride Corporation Corporate Environmental Manager Lake of the Pines
Dead Zones for Dinner
 STUDENT READING DEAD ZONES AND EUTROPHICATION: HOW FOOD WE EAT IS CONNECTED TO WATER POLLUTION Introduction Imagine scuba diving in an aquatic environment where life abounds--a place whose biological diversity
Little River Watershed Restoration Project. Mark Powell, Consultant Natural Resources Management
 Little River Watershed Restoration Project Mark Powell, Consultant Natural Resources Management Lessons Learned Strong partnerships RC&D, Soil and Water, 2 counties, Albemarle Commission, Universities,
The Chesapeake Bay Blueprint:
 PHASE II The Chesapeake Bay Blueprint: THE BEST HOPE FOR RESTORING CLEAN WATER THIS NATION HAS EVER SEEN Peter McGowan/U.S. Fish and Wildlife Service Strategic Plan 2016-2020 The Chesapeake Bay Foundation
Chesapeake Bay s Problems
 Environmental Issues for the Chesapeake Bay Russ Perkinson Virginia State Feed Association Conference February 16, 2011 Chesapeake Bay s Problems Congressional appropriation of $27 million for six year
Marinette County Lower Peshtigo River Watershed Management Plan
 Marinette County Lower Peshtigo River Watershed Management Plan MARINETTE COUNTY S EXPERIENCES CREATING A NINE KEY ELEMENT PLAN Plan Goals Learn more about the biota, environmental health, and human health
A Claytor Nature Center Stream Monitoring Experience
 A Claytor Nature Center Stream Monitoring Experience Conduct field investigations in which distinctions are made among observations, hypotheses, results and conclusions Perform a visual habitat assessment
Some Context behind the Implementation of Numeric Nutrient Criteria or Why do we have these Water Quality Regulations?
 Some Context behind the Implementation of Numeric Nutrient Criteria or Why do we have these Water Quality Regulations? Mark W. Clark and Thomas Obreza Soil and Water Science Department University of Florida,
Chesapeake Bay Program Models:
 Chesapeake Bay Program Models: A Guide to Better Understanding Modeling and Decision Support Tool Forum Penn State Harrisburg August 1, 2011 1 Mark Dubin Agricultural Technical Coordinator University of
MDA BMP Functional Equivalents. Update WQGIT 11/12/13
 MDA BMP Functional Equivalents Update WQGIT 11/12/13 Executive Order 12508 In January of 2009, President Obama issued Executive Order (EO) 12508 on the Chesapeake Bay. May 12, 2010, the EO Strategy was
Triblet Characteristics & Responses
 Triblet Characteristics & Responses K.G. Sellner 1, W.R. Boynton 2, J. Testa 2, T. Rosen 3, R.J. Orth 4, D. Dauer 5, and J. Uphoff 6 1 Center for Coastal & Watershed Studies, Hood College 2 UMCES-CBL 3
Integrating Air and Water Environmental Management in the Chesapeake Bay Program: An Encouraging Tale
 Integrating Air and Water Environmental Management in the Chesapeake Bay Program: An Encouraging Tale SERC Lecture Series August 15, 2017 Lewis C. Linker 1, Gary W. Shenk 1, Jesse Bash, & Ping Wang 3 1U.S.
Terminology. Supply Chain Resilience Transportation Interests
 Tim Snow Terminology Supply Chain Resilience Transportation Interests Supply Chain The sequence of processes involved in the production and distribution of a commodity Agricultural Supply Chain Resiliency
Delaware Department of Transportation Agriculture Supply Chain Study: Transportation Supply Chain Analysis ihs.com
 IHS TRANSPORTATION CONSULTING Delaware Department of Transportation Agriculture Supply Chain Study: Transportation Supply Chain Analysis ihs.com Overview of Findings Delmarva Freight Summit June 24 th,
U.S. Environmental Protection Agency s Interim Expectations for the Phase III Watershed Implementation Plans
 U.S. Environmental Protection Agency s Interim Expectations for the Phase III Watershed Implementation Plans The U.S. Environmental Protection Agency (EPA) provided expectations for the Phase I 1 and Phase
Presented by Jack Pflaumer
 Presented by Jack Pflaumer Bureau of Environmental Analysis, Restoration and Standards Division of Water Monitoring and Standards New Jersey Department of Environmental Protection February 23, 2017 Agenda
James River Alternatives Analysis June 23, 2005
 James River Alternatives Analysis June 23, 2005 Prepared by: Virginia Department of Environmental Quality in cooperation with the U.S. EPA Chesapeake Bay Program Office [ THIS PAGE INTENTIONALLY LEFT BLANK
Clean Water Optimization Tool Case Study: Kent County
 Clean Water Optimization Tool Case Study: Kent County Through a grant from the Town Creek Foundation, the Center for Watershed Protection created a userfriendly and simple Clean Water Optimization Tool
Observations on Nutrient Management and the Chesapeake Bay TMDL
 Observations on Nutrient Management and the Chesapeake Bay TMDL Introduction William J. Rue and Sadie B. Barr EA Engineering, Science & Technology, Inc. 15 Loveton Circle, Sparks, MD 21152 On 29 December
The Chesapeake Bay TMDL
 The Chesapeake Bay TMDL December 29, 2010 EPA Update on Implementation Progress County Engineers Association of Maryland Fall Conference 2015 Jon M. Capacasa, Water Division Director US EPA Region III
Water Quality Study In the Streams of Flint Creek and Flint River Watersheds For TMDL Development
 Water Quality Study In the Streams of Flint Creek and Flint River Watersheds For TMDL Development Idris Abdi Doctoral Dissertation Presentation Major Advisor: Dr. Teferi Tsegaye April 18, 2005 Alabama
 Good Morning! Bruce Gilman Department of Environmental Conservation and Horticulture Finger Lakes Community College 3325 Marvin Sands Drive Canandaigua, New York 14424 585-785- 1255 gilmanba@flcc.edu Northern
Norwalk Harbor Report Card
 Norwalk Harbor Report Card C+ Following the water s trail from your house, into the river, and to the Harbor The way land is used in a watershed has a significant effect on water quality. In areas where
Clean Water Optimization Tool Case Study: Queen Anne s County
 Clean Water Optimization Tool Case Study: Queen Anne s County Through a grant from the Town Creek Foundation, the Center for Watershed Protection created a userfriendly and simple Clean Water Optimization
PROTECTING OUR WATERWAYS: STORMWATER POLLUTION REDUCTION EFFORTS
 PROTECTING OUR WATERWAYS: STORMWATER POLLUTION REDUCTION EFFORTS Public Information Meeting ~ May 2, 2018 Public Works Stormwater Management Division OVERVIEW Surface Water Quality Protection Municipal
OUR MISSION: To preserve, protect, and restore Delaware s Inland Bays the water that flows into them and the watershed around them.
 OUR MISSION: To preserve, protect, and restore Delaware s Inland Bays the water that flows into them and the watershed around them. OUR In 1988, the Delaware Inland Bays were declared an estuary of national
DRAFT. Tidal Trends in Water Quality: Potomac River 2017 Tributary Summary
 DRAFT Tidal Trends in Water Quality: Potomac River 2017 Tributary Summary Sept 26, 2018 1 Contents 1. Location... 3 1.1 Watershed Physiography... 3 1.2 Tidal Waters and Stations... 4 2. Tidal Water Quality
CHESAPEAKE BAY COMPREHENSIVE WATER RESOURCES AND RESTORATION PLAN - UPDATE. Update to Chesapeake Bay Program STAR January 25, 2018
 CHESAPEAKE BAY COMPREHENSIVE WATER RESOURCES AND RESTORATION 255 255 255 237 237 237 0 0 0 217 217 217 163 163 163 200 200 200 PLAN - UPDATE 131 132 122 239 65 53 80 119 27 110 135 120 252 174.59 112 92
Quittapahilla Creek Watershed Implementation Plan
 Quittapahilla Creek Watershed Implementation Plan Introduction Founded in 1997, the Quittapahilla Creek Watershed Association has been working with landowners, private organizations and public agencies
Land Conservation & Chesapeake Restoration
 Land Conservation & Chesapeake Restoration Peter Claggett Research Geographer, U.S. Geological Survey Coordinator, CBP Land Use Workgroup May 17, 2018 Maryland Land Conservation Conference Linthicum Heights,
BACKGROUND. David Everett
 State of the James BACKGROUND Since the founding of the America on its banks 4 years ago, the James River has played a central and defining role in the development of Virginia. No other natural feature
Chesapeake Bay TMDL and Maryland s Watershed Implementation Plan. Robert M. Summers, Ph.D. Acting Secretary Maryland Department of the Environment
 Chesapeake Bay TMDL and Maryland s Watershed Implementation Plan Robert M. Summers, Ph.D. Acting Secretary Maryland Department of the Environment TMDL Background TMDL = Total Maximum Daily Load. The maximum
Chesapeake Bay Program Partnership s Investment in the Chesapeake Monitoring Cooperative: What s Different This Time Around
 Chesapeake Bay Program Partnership s Investment in the Chesapeake Monitoring Cooperative: What s Different This Time Around Rich Batiuk Associate Director for Science, Analysis and Implementation Chesapeake
Monday, January 9th, :00 pm. Montgomery Park, Lobby Conference Rooms
 Monday, January 9th, 2016 6:00 pm Montgomery Park, Lobby Conference Rooms Purpose of This Meeting Provide General Information/Updates on 2016 IR and MD s TMDL Prioritization Encourage public dialogue,
Mike Langland USGS PA Agricultural Advisory Board April 28, 2016
 Mike Langland USGS PA Agricultural Advisory Board April 28, 2016 Chesapeake Bay Nontidal Monitoring Network - Loads to the Bay (1) How are nitrogen, phosphorus, and suspendedsediment loads responding to
Support legislation that will protect the quantity of water in Lake Erie
 Specific Regional Priorities Each of Pennsylvania s major drainage basins has an array of individual characteristics that distinguish it from other regions of the state. These include diverse geographic
The Relationship of Agriculture, Water and the Environment
 The Relationship of Agriculture, Water and the Environment Marcia Fox DNREC, Division of Watershed Stewardship, Nonpoint Source Program Delaware s Watersheds Piedmont Delaware Basin Chesapeake Basin Inland
Guiding the Restoration of the Chesapeake Bay: The EPA Chesapeake Bay Program Partnership. Keely Clifford U.S. Embassy Paris
 Guiding the Restoration of the Chesapeake Bay: The EPA Chesapeake Bay Program Partnership Keely Clifford U.S. Embassy Paris PISCES Workshop June 14, 2011 1 Chesapeake Bay Watershed About 17 million people
CHESAPEAKE BAY COMPREHENSIVE WATER RESOURCES AND RESTORATION PLAN. Update to Chesapeake Bay Program Management Board June 14, 2018
 CHESAPEAKE BAY COMPREHENSIVE WATER RESOURCES AND 255 255 255 237 237 237 0 0 0 217 217 217 163 163 163 200 200 200 131 132 122 239 65 53 80 119 27 RESTORATION PLAN 110 135 120 252 174.59 112 92 56 62 102
Statewide Results (Final Target)
") Statewide Results (Final Target) Nutrient Trading in Maryland 2017 National Watershed and Stormwater Conference April 4, 2016 Jason Keppler Watershed Implementation Program Nitrogen Sector 2009 2025 Allocation
Statewide Results (Final Target) Nutrient Trading in Maryland 2017 National Watershed and Stormwater Conference April 4, 2016 Jason Keppler Watershed Implementation Program Nitrogen Sector 2009 2025 Allocation
Instructions to Regional Planners
 Module 1 Educator s Guide, Handout 3: Regional Planner Instructions Investigation 1 Instructions to Regional Planners You are a planner on the Chesapeake Bay regional planning council. Prior to the town