Long Term Water Quality Trends in Wisconsin Lakes. Katie Hein Wisconsin Department of Natural Resources
|
|
|
- Harold Wilkinson
- 6 years ago
- Views:
Transcription

1 Long Term Water Quality Trends in Wisconsin Lakes Katie Hein Wisconsin Department of Natural Resources

2 14,3 lakes > 1 hectare


3

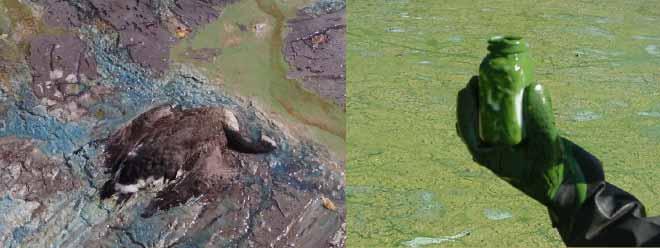
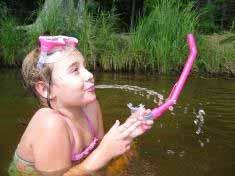
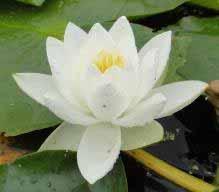
4 Photos: Buzz Sorge


5 Phosphorus Reduction Actions in Wisconsin Soil Conservation Clean Water Act Wastewater Treatment Runoff program Coon Valley Great Lakes Water Quality Agreement Regulate Concentrated Animal Feeding Operations Discharge <1 mg/l phosphorus statewide Runoff performance standards and prohibitions Tighten rules for large animal farms Fertilizer phosphorus ban Dish detergent <.5% phosphorus by weight Phosphorus criteria for all surface waters Phosphorus budgets for impaired watersheds CAFO s Phosphorus bans


6 Future Nutrient Loading Threats Projected Change in Frequency of 2 Precipitation Events 198 to 255 days/decade Increase in Housing Density


7 Is lake water quality getting better, worse, or staying the same? Melvin McCartney, Lake Monona
8 Long Term Water Quality Monitoring Spring and 3 X s in summer: Secchi depth Temperature/D.O. profile Total Phosphorus Chlorophyll a Conductivity (optional) ph (optional) 1 X in summer: Color Total Kjeldahl Nitrogen NO2+NO3 Alkalinity 5 year cycle: Ca Mg 61 Lakes
9 Trends in Total Phosphorus Over Time 8 lakes decreasing TP 46 lakes no change in TP 6 lakes increasing TP Latitude Average + stdev decrease steady increase
10 Trends in Total Phosphorus Over Time Decrease Steady Increase Vern Wolf Pelican Lac Courte Oreilles Silver Ripley TP Criteria Crystal Total Phosphorus (mg/l)

11 Expand analysis to all WDNR data WDNR Data Download: 218,3 records 151 lakes Data from Up to 34 years of data on a single lake
12 Exclude hypereutrophic lakes (.1 mg/l) from Total Phosphorus analysis 9 8 Number of Lakes hypereutrophic lakes Maximum Annual Average TP (mg/l)
13 Simple linear regressions June 15 September 15 Annual Average Natural logarithm of concentration Color (SU)
14 Limit trend analysis to lakes with at least 3 5 years of data Slope ((ln(unit+1))/yr) Total Phosphorus Alkalinity Total Kjeldahl Nitrogen Calcium NO2+NO Magnesium Total Years of Record
15 Limit trend analysis to lakes with at least 3 5 years of data Slope ((ln(unit+1))/year) Total Phosphorus Total Kjeldahl Nitrogen Color Alkalinity Calcium NO2+NO Magnesium Total Years of Record 1 1.5
16 Trend Slopes Near on Most Lakes median: Slope ((ln(unit+1))/year) TP TKN NO2+NO3 Alkalinity Ca Mg Color
17 3% 27% of lakes had a significant trend Percent Lakes with Significant Trend Total 2 N: Increasing Decreasing TP TKN NO2+NO3 Alk Ca Mg Color
18 Does time period matter? Phosphorus Year
19 Does time period matter? Phosphorus Year
20 Fewer lakes with increasing phosphorus trend in recent years Percent of Lakes with Significant Trend
21 TP (mg/l) TP (mg/l) Rock Lake, Jefferson County ug/l per year Fox Lake, Dodge County ug/l per year TP (mg/l) Devils Lake, Sauk County

22 No Spatial Pattern in Temporal Trends TKN NO2+NO3

23 No Spatial Pattern in Temporal Trends Alkalinity Color

24 No Spatial Pattern in Temporal Trends Calcium Magnesium

25 No Spatial Pattern in Temporal Trends TP
26 Are lakes getting better or worse? Maximum TP (mg/l) TP Stays Low TP Stays High Decreasing Increasing Recreation Criterion Minimum TP (mg/l) no change


27 Reasons for Phosphorus Decline Urbanization of Agricultural Land Septic to Municipal Sewage Algal to Plant Dominated Lake Best Management Practices Melvin McCartne Bruce Werre


28 Reasons for Increasing Phosphorus Agriculture Lake Shore Development Plant to Algal Dominated Lake Climate and Water Levels Carp Exclosure USGS
29 National Aquatic Resource Surveys: Minimally Disturbed Lakes and Streams are Getting Worse (µg/l) from Stoddard et al. 216 Env Sci & Tech
30 National vs. Wisconsin Trends National Reference Lakes 1 All Wisconsin Lakes Median annual TP increase: 1.6 ug/l/year TP in 212 (ug/l) TP in 27 (ug/l).27 ug/l/year n=332 from Stoddard et al. 216 Env Sci & Tech
31 Trends more extreme with less than 3 5 years of data Slope ((ln(unit+1))/yr) Total Phosphorus Alkalinity Total Kjeldahl Nitrogen Calcium NO2+NO Magnesium Total Years of Record
32 Trends in Total Phosphorus from vs. Full Record Full Record Percent Slope Years of Data: 4 31 Start Year: End Year: Percent Slope Full Record Number of Lakes Number of Lakes Full Record Median Slope.35% Percent Slope Median Slope.263% Percent Slope Paired T Test (p<.2)
33 Analytical Approach Consider length of record when drawing conclusions about trends Slopes from 2 years of data much more extreme than those from longer records Simple linear regression over long period of record may mask recent trends Fewer lakes with increasing phosphorus trends in recent years

34 Summary of Trends Most lakes have not changed over time spans of 3 43 years, but a small percent of lakes have significantly increasing or decreasing trends. Lack of spatial pattern suggests local watershed processes are important drivers Median slope Calcium, Magnesium NO2+NO3 + TP, TKN, Alkalinity, Color

35 Future Work Analyze potential drivers of change: land cover, climate, policy & management actions Examine nonlinear trends over time Investigate lakes that are vulnerable to eutrophication Celebrate success stories

36 Thanks to Department of Natural Resources lake biologists, summer staff, and citizen volunteers!
Status and Trends of Water Quality in Wisconsin s Lakes, Streams, and Rivers
 Status and Trends of Water Quality in Wisconsin s Lakes, Streams, and Rivers Tim Asplund, Matt Diebel, Katie Hein, and Mike Shupryt Water Resources Program, WDNR AWRA Wisconsin Section Annual Meeting March
Portage Lake Hubbard County
 Prepared in cooperation with the Minnesota Department of Natural Resources Minnesota Lake ID: 9- Area: acres Watershed Area: 6,7 acres Ecoregion: Northern Lakes and Forests (NLF) Portage Lake Hubbard County
Interpreting Lake Data
 Interpreting Lake Data Indiana Clean Lakes Program The Indiana Clean Lakes Program was created in 1989 as a program within the Indiana Department of Environmental Management's (IDEM) Office of Water Management.
A Summary of Efforts to Reduce Phosphorus in the Red Cedar River Basin
 A Summary of Efforts to Reduce Phosphorus in the Red Cedar River Basin State Laws to Reduce Phosphorus 1970s - Restriction on phosphorus in laundry detergent 1992 - Limits on point sources with significant
ARKANSAS NUTRIENT CRITERIA DEVELOPMENT. EPA Region 6 Nutrient RTAG Dallas, Texas April 14, 2015
 ARKANSAS NUTRIENT CRITERIA DEVELOPMENT EPA Region 6 Nutrient RTAG Dallas, Texas April 14, 2015 CRITERIA DEVELOPMENT MILESTONES Assessment Methodology Beaver Lake Wadeable Streams Nutrient Trading-Act 335
Wisconsin River. Hardest Working River In the Nation
 Hardest Working River In the Nation Hardest Working River In The Nation Largest Basin In Wisconsin 430 miles in length 20% of Wisconsin, with diverse land use 14,776 mi2 catchment at Prairie du Sac Dam
Water Quality Study In the Streams of Flint Creek and Flint River Watersheds For TMDL Development
 Water Quality Study In the Streams of Flint Creek and Flint River Watersheds For TMDL Development Idris Abdi Doctoral Dissertation Presentation Major Advisor: Dr. Teferi Tsegaye April 18, 2005 Alabama
Wakefield Lake TMDL Public Meeting 3/17/2014. Jen Koehler, PE Barr Engineering
 Wakefield Lake TMDL Public Meeting 3/17/2014 Jen Koehler, PE Barr Engineering Outline Project Contacts Introduction to Wakefield Lake Thoughts/Questions/Concerns About TMDL Studies Lake Water Quality and
Envirothon Aquatics. Mike Archer, NE Dept. of Environmental Quality. Katie Pekarek, Nebraska Extension Jeff Blaser, Nebraska Game and Parks
 Envirothon Aquatics Mike Archer, NE Dept. of Environmental Quality Katie Pekarek, Nebraska Extension Jeff Blaser, Nebraska Game and Parks Lake Watersheds Watershed = area contributing water to pond Surface
Potter Lake. University of Kansas Lawrence Campus, Douglas County, Kansas. Water Quality Evaluation January 13, 2014
 Potter Lake University of Kansas Lawrence Campus, Douglas County, Kansas Water Quality Evaluation 2011-2013 January 13, 2014 Prepared by the Department of Environment, Health & Safety University of Kansas,
Nutrients and Ecosystems
 Nutrients and Ecosystems Fertilizer Application Rates Lawns: Athletic Fields: Pastures (Dairy): Vegetables: Corn: Citrus: Forests: 80-240 kg N/ha/yr 200-280 kg N/ha/yr 240-360 kg N/ha/yr 180-200 kg N/ha/yr
Laurel Lake water quality, nutrients, and algae, summer
 Laurel Lake water quality, nutrients, and algae, summer 2011 1 H.A. Waterfield, W.N. Harman and M.F. Albright SAMPLING ACTIVITIES Site visits to Laurel Lake were made on 16 June and 25 July 2011; water
CITIZEN MONITORING AS WATERSHED MANAGEMENT TOOL. Reesa Evans Lake Specialist Certified Lake Manager Adams County LWCD
 CITIZEN MONITORING AS WATERSHED MANAGEMENT TOOL Reesa Evans Lake Specialist Certified Lake Manager Adams County LWCD Setting Up Monitoring When looking at setting up a monitoring program, the first step
Gull Lake CASS & CROW WING COUNTIES
 Gull Lake 11-0305-00 CASS & CROW WING COUNTIES Summary Gull Lake is located just northwest of Brainerd, Minnesota, on the border of Cass and Crow Wing Counties. It covers 9,947 acres, which places it in
Phosphorus Rules NR , NR 151 and NR 217 Subchapter III
 Phosphorus Rules NR 102.06, NR 151 and NR 217 Subchapter III Jim Baumann Wisconsin Department of Natural Resources james.baumann@wisconsin.gov 608/266-9277 Phosphorus 3 Rule Changes S. NR 102.06 phosphorus
Jordan River Total Maximum Daily Load Study. Presented By: James Harris Utah Division of Water Quality
 Jordan River Total Maximum Daily Load Study Presented By: James Harris Utah Division of Water Quality Jordan River Watershed TMDL Study Area No Introduction Necessary A Few Things to Point Out... Lower
State Water Resources Monitoring Priorities and Role of Citizen Based Monitoring Tim Asplund, WDNR April 5, 2013
 State Water Resources Monitoring Priorities and Role of Citizen Based Monitoring Tim Asplund, WDNR April 5, 2013 From Ken Johnson, WDNR Water Division Administrator: Please extend my gratitude to all those
Determination of Total Nitrogen and Phosphorus in Environmental Waters
 Determination of Total Nitrogen and Phosphorus in Environmental Waters Brian De Borba, Jeffrey Rohrer, and Richard Jack Thermo Fisher Scientific, Sunnyvale, CA, USA PITTCON Conference & Expo March 4, 2014
EUTROPHICATION. Student Lab Workbook
 EUTROPHICATION Student Lab Workbook THE SCIENTIFIC METHOD 1. Research Background literature research about a topic of interest 2. Identification of a problem Determine a problem (with regards to the topic)
Water Quality Sampling Presentation Ministry of the Environment. Presented by Dana Cruikshank Surface Water Specialist October 2009
 Water Quality Sampling Presentation Ministry of the Environment Presented by Dana Cruikshank Surface Water Specialist October 2009 1 5W s of Water Quality Sampling WHY WHAT WHERE WHEN WHO Sampling is an
Boy Lake CASS COUNTY
 Boy Lake 11-143- CASS COUNTY Summary Boy Lake is located near Remer, MN in Cass County. It covers 3,452 acres, which places it in the upper 1% of lakes in Minnesota in terms of size. Boy Lake has two main
 Good Morning! Bruce Gilman Department of Environmental Conservation and Horticulture Finger Lakes Community College 3325 Marvin Sands Drive Canandaigua, New York 14424 585-785- 1255 gilmanba@flcc.edu Northern
Comparison of Total Phosphorus in Lakes in Kalkaska County, Michigan and Relation to Trophic State
 Comparison of Total Phosphorus in Lakes in Kalkaska County, Michigan and Relation to Trophic State Opeoluwa Oyewole, Oral Roberts University, OK Scott Carr, Anderson University, IN Dave Mahan, Au Sable
An Investigation of External Nutrient Loading from Eight Streams into Honeoye Lake
 An Investigation of External Nutrient Loading from Eight Streams into Honeoye Lake Finger Lakes Institute 4 th Annual Conference October 18, 2008 Bin Zhu, Ph.D. Research Scientist www.rochersterenvironment.com
Red Rock Lake: A Path Forward
 University of Minnesota Morris Digital Well University of Minnesota Morris Digital Well Center for Small Towns 6-2016 Red Rock Lake: A Path Forward Colette Millard Student - University of Minnesota, Morris
Subwatershed Prioritization of the Lake Wister Watershed Using Baseflow Water Quality Monitoring Data
 Subwatershed Prioritization of the Lake Wister Watershed Using Baseflow Water Quality Monitoring Data Bradley J. Austin, Brina Smith, and Brian E. Haggard Eutrophication Process by which excess nutrients
Factsheet: Town of Deep River Water Quality and Stormwater Summary
 79 Elm Street Hartford, CT 06106-5127 www.ct.gov/deep Affirmative Action/Equal Opportunity Employer Factsheet: Town of Deep River Water Quality and Stormwater Summary This document was created for each
Estimating Michigan s Trophic State Trends with Satellite Imagery USGS Recent Inland Lake Studies
 Estimating Michigan s Trophic State Trends with Satellite Imagery USGS Recent Inland Lake Studies Lori Fuller USGS Michigan-Ohio Water Science Center 2016 Michigan Inland Lakes Convention April 29, 2016
Evaluation of Leaf Collection Programs as a Means to Reduce Nutrient Loads from Urban Basins in Wisconsin
 Evaluation of Leaf Collection Programs as a Means to Reduce Nutrient Loads from Urban Basins in Wisconsin History of the U.S. Geological Survey Water Resources Division The Water Resources Division is
CREEKS OF THE MIDDLE FOX RIVER 2016 Progress Report
 CREEKS OF THE MIDDLE FOX RIVER 2016 Progress Report Brewster approximately three years after dam removal Presented by the Sierra Club Valley of the Fox Water Sentinels ILLINOIS CHAPTER PRESERVING THE FOX
Trends in Dissolved Reactive Phosphorus in Lake Erie Tributaries
 Trends in Dissolved Reactive Phosphorus in Lake Erie Tributaries R. Peter Richards, David B. Baker, John P. Crumrine National Center for Water Quality Research Heidelberg College Tiffin, Ohio 44883 Windsor,
PROJECT REFERENCE NO. : 37S1386
 STUDIES ON HEAVY METAL CONCENTRATION AND EUTROPHICATION THROUGH POLLUTED LAKES AND MITIGATION THROUGH BIOREMEDIATION A CASE STUDY ON BYRAMANGALA LAKE, RAMANAGRAM DISTRICT, KARNATAKA PROJECT REFERENCE NO.
2012 Nutrient Regulations Update
 2012 Nutrient Regulations Update OWEA Government Affairs Workshop March 1, 2012 Guy Jamesson, PE, BCEE Malcolm Pirnie, The Water Division of ARCADIS Imagine the result Agenda Nutrient impacts Nutrient
Warm Mineral Springs Sampling by Sarasota County
 Warm Mineral Springs Sampling by Sarasota County John Ryan, Kathryn Meaux, Rene Janneman and Jon S. Perry Sarasota County Environmental Services Sarasota, Florida September 11 Warm Mineral Springs is a
FLORIDA DEPARTMENT OF ENVIRONMENTAL PROTECTION SOUTHWEST DISTRICT PEACE RIVER BASIN UPPER PEACE RIVER PLANNING UNIT.
 FLORIDA DEPARTMENT OF ENVIRONMENTAL PROTECTION Division of Environmental Assessment and Restoration Water Quality Evaluation and TMDL Program SOUTHWEST DISTRICT PEACE RIVER BASIN UPPER PEACE RIVER PLANNING
The COLA Experience. A Partnership to Save the Lake
 The COLA Experience A Partnership to Save the Lake State Map County map Lake map Lac Courte Oreilles Watershed 68,990 ac Lac Courte Oreilles Hayward Round L Grindstone L LCO Sand L Whitefish L Lac Courte
Climate Change, Precipitation Trends and Water Quality David S. Liebl
 Climate Change, Precipitation Trends and Water Quality David S. Liebl Wisconsin Lakes Partnership Convention Stevens Point 4/25/14 Map - Kate Barrett Wisconsin Precipitation Trends: 1950-2006 Annual Summer
GULF OF MEXICO - SEGMENT 2501
 GULF OF MEXICO - SEGMENT 2501 GULF OF MEXICO - SEGMENT 2501 LAND COVER BACTERIA CHLOROPHYLL A Impairment Concern No Impairments or Concerns GULF OF MEXICO - SEGMENT 2501 OTHER IMPAIRMENTS Bays & Estuaries
Watershed and Water Quality Modeling to Support TMDL Determinations Lake Oologah
 Watershed and Water Quality Modeling to Support TMDL Determinations Lake Oologah 26 th Annual Conference Oklahoma Clean Lakes and Watersheds Association (OCLWA) April 5-6, 2017 Stillwater, Oklahoma Lake
NC Ambient Lake Assessment Program Overview including Coastal Lakes
 NC Ambient Lake Assessment Program Overview including Coastal Lakes Danielle Mir NC Division of Water Quality Environmental Sciences Section, Intensive Survey Unit Intensive Survey Unit Within the Environmental
KENTUCKY S NUTRIENT STRATEGY Identification and Discussion of Potential Impacts
 Click to edit Master title style KENTUCKY S NUTRIENT STRATEGY Identification and Discussion of Potential Impacts SPEAKERS Kyle Hagen, PE William Shane, PE DATE August 20, 2014 Click INTRODUCTION to edit
Pembina River Watershed Water Quality Report
 Pembina River Watershed Water Quality Report January 29 Prepared by: Manitoba Water Stewardship 16-123 Main St. Winnipeg, MB. Canada State of the Watershed Report 5OA and 5OB Pembina River Watershed -
Water Chemistry. Water 101
 Water Chemistry Water 101 I. Introduction A. Water is not pure Many different kinds of chemicals dissolved in it Ions, organic chemicals, organic matter, particulate matter, and gases can all be in water
Lake Pepin Photo by Guy Schmickle
 Science Advisory Panel Meeting Lake Pepin Water Quality Modeling Project April 30, 2008 Lake Pepin Photo by Guy Schmickle Overview Modeling status Historical system behavior Model simulation scenarios
Portage County Lake Planning Process
 Portage County Lake Planning Process Lake Leaders Kemp Field Station September 2010 Jen McNelly and Nancy Turyk Center for Watershed Science and Education UW-Stevens Point Types of Planning Emotional Crisis
Madison Metropolitan Sewerage District Adaptive Management Plan
 Madison Metropolitan Sewerage District Adaptive Management Plan January, 2017 1 Table of Contents I. Introduction and Background... 5 Meeting DNR Adaptive Management Planning Elements... 8 II. Eligibility
AN INVESTIGATION OF EXTERNAL NUTRIENT LOADING FROM EIGHT STREAMS INTO HONEOYE LAKE
 AN INVESTIGATION OF EXTERNAL NUTRIENT LOADING FROM EIGHT STREAMS INTO HONEOYE LAKE Dr. Bin Zhu Finger s Institute Hobart and William Smith Colleges 61 S Main Street Geneva, NY Prepared for: Honeoye Watershed
The Mekong River Report Card on Water Quality ( )
") The Mekong River Report Card on Water Quality (2000-2006) Volume 1: September 2008 Mekong River Commission Background The water resources of the Mekong River support the livelihoods of most of the 60 million
The Mekong River Report Card on Water Quality (2000-2006) Volume 1: September 2008 Mekong River Commission Background The water resources of the Mekong River support the livelihoods of most of the 60 million
MURPHY DRAIN CATCHMENT
 The RVCA produces individual reports for 16 catchments in the Lower Rideau subwatershed. Using data collected and analysed by the RVCA through its watershed monitoring and land cover classification programs,
LAKE PARTNER PROGRAM. Report Card 2015
 LAKE PARTNER PROGRAM Report Card 2015 Contents 1 What This Report Tells You 2 Ontario s Lakes 3 What is the Lake Partner Program? 5 Total Phosphorus 8 Calcium 10 Water Clarity 12 Moving Forward What You
Numeric Nutrient Criteria Development
 Florida Department of Environmental Protection Numeric Nutrient Criteria Development Bureau of Assessment and Restoration Support Daryll Joyner, Bureau Chief Summary of Presentation Background info on
ALAN PLUMMER ASSOCIATES, INC. ENVIRONMENTAL ENGINEERS - DESIGNERS - SCIENTISTS
 Grapevine Lake Watershed Characteristics February 18, 2010 NCTCOG REGIONAL WATERSHED ROUNDTABLE ALAN PLUMMER ASSOCIATES, INC. ENVIRONMENTAL ENGINEERS - DESIGNERS - SCIENTISTS 1 Presentation Overview Geography
Long-Term Volunteer Lake Monitoring in the Upper Woonasquatucket Watershed
 Long-Term Volunteer Lake Monitoring in the Upper Woonasquatucket Watershed Linda Green URI Watershed Watch 1-87-95, lgreen@uri.edu WATER QUALITY IS A REFLECTION OF THE ACTIVITIES IN THE LANDS AND WATERS
BIG ROCHE A CRI LAKE CHARACTERISTICS
 BIG ROCHE A CRI LAKE CHARACTERISTICS Lake Description Big Roche Cri Lake is located in north central Adams County and has a surface area of 205 acres, a shoreline length of 6.1 mile, a volume of 6,993
Sources for Bottom Water Phosphates and Suspended Sediments in Southern Cayuga Lake, New York
 Sources for Bottom Water Phosphates and Suspended Sediments in Southern Cayuga Lake, New York Prabighya Basnet Hobart & William Smith Colleges Geneva, NY Outline of Today s Presentation Introduce Problem
Characterization of dissolved organic matter in Colorado watersheds: The role of nutrients and algae on DBP formation
 Characterization of dissolved organic matter in Colorado watersheds: The role of nutrients and algae on DBP formation Amanda Hohner, Alia Khan, Diane McKnight, R. Scott Summers, and Fernando Rosario-Ortiz
Appendix 5. Fox River Study Group Interim Monitoring Evaluation
 Appendix 5. Fox River Study Group Interim Monitoring Evaluation Introduction Submitted to Fox River Study Group 6 March 3 The purpose of this report is to review data collected by the Fox River Study Group
Wisconsin Wastewater Operators Association. Protecting Our Water Resources: The Future Bill Hafs - NEW Water 10/2014
 Wisconsin Wastewater Operators Association Protecting Our Water Resources: The Future Bill Hafs - NEW Water 10/2014 The Fox River Contributes 1/3 of All Nutrients to Lake Michigan APRIL 15, 2011 Photo
Status and Trend Monitoring of Selected Lakes in Lyon County 2007
 Taunton Cottonwood Lake Minneota Cottonwood Ghent School Grove Lake Marshall Goose Lake Lynd Russell Rock Lake Florence Lake Yankton Tracy Balaton Garvin Status and Trend Monitoring of Selected Lakes in
Total Maximum Daily Loads for Total Phosphorus and Total Suspended Solids in the Rock River Basin
 Total Maximum Daily Loads for Total Phosphorus and Total Suspended Solids in the Rock River Basin Columbia, Dane, Dodge, Fond du Lac, Green, Green Lake, Jefferson, Rock, Walworth, Washington, and Waukesha
Chapter Seven: Factors Affecting the Impact of Nutrient Enrichment on the Lower Estuary
 Chapter Seven: Factors Affecting the Impact of Nutrient Enrichment on the Lower Estuary As presented in Chapter Six, the water quality data for the upper stations of the tidal freshwater Potomac Estuary
Water Quality Monitoring:
 Water Quality Monitoring: Lesson Plan for Exploring Time Series Data Presenters: Janet Vail, Fallon Januska, Dirk Koopmans Lake Michigan Center in Muskegon, Michigan Home of Annis Water Resources Institute
St. Lucie Estuary: Analysis of Annual Cycles and Integrated Water Column Productivity
 St. Lucie Estuary: Analysis of Annual Cycles and Integrated Water Column Productivity Tom Gallo, Malcolm Pirnie Inc. Clifton Bell, Malcolm Pirnie Inc. Peter Doering, South Florida Water Management District
LAKE TARPON WATER QUALITY MANAGEMENT PLAN SCOPE OF WORK
 LAKE TARPON WATER QUALITY MANAGEMENT PLAN SCOPE OF WORK Project Background Lake Tarpon With a surface area of approximately four square miles and a watershed of approximately 52 square miles, Lake Tarpon,
Chesapeake Bay s Problems
 Environmental Issues for the Chesapeake Bay Russ Perkinson Virginia State Feed Association Conference February 16, 2011 Chesapeake Bay s Problems Congressional appropriation of $27 million for six year
ASSIMILATIVE CAPACITY MODELING USING INTEGRATED WATERSHED AND LAKE MODELS IN SUPPORT OF THE GEORGIA COMPREHENSIVE STATEWIDE WATER MANAGEMENT PLAN
 B.J. Watson, et al., Int. J. of Design & Nature and Ecodynamics. Vol. 7, No. 2 (2012) 155 165 ASSIMILATIVE CAPACITY MODELING USING INTEGRATED WATERSHED AND LAKE MODELS IN SUPPORT OF THE GEORGIA COMPREHENSIVE
Lake Pepin Watershed TMDL: Looking Ahead. August 2008 Sector Meetings. Lake Pepin Photo by Guy Schmickle
 Lake Pepin Watershed TMDL: Looking Ahead August 2008 Sector Meetings Lake Pepin Photo by Guy Schmickle Three Questions What are the critical issues to face moving forward? How can we as a sector address
Waterford Waterway & Tichigan Lake 2017 Water Quality and Algae Sampling Report
 Waterford Waterway & Tichigan Lake 2017 Water Quality and Algae Sampling Report September 20, 2017 Prepared for: Waterford Waterway Management District Prepared by: James Scharl 0 Toll Free: 866-208-0724
CADDO LAKE WATERSHED PROTECTION PLAN Technical Memo (Task 1.2.3)
") CADDO LAKE WATERSHED PROTECTION PLAN Technical Memo (Task 1.2.3) Prepared for: Northeast Texas Municipal Water District 4180 FM 250 P.O. Box 955 Hughes Springs, TX 75656 By: Espey Consultants, Inc. EC
CADDO LAKE WATERSHED PROTECTION PLAN Technical Memo (Task 1.2.3) Prepared for: Northeast Texas Municipal Water District 4180 FM 250 P.O. Box 955 Hughes Springs, TX 75656 By: Espey Consultants, Inc. EC
Watershed, Hydrodynamic, Water Quality and Sediment Flux Modeling to Support TMDL Determinations, Lake Thunderbird
 Watershed, Hydrodynamic, Water Quality and Sediment Flux Modeling to Support TMDL Determinations, Lake Thunderbird 24 th Annual Conference Oklahoma Clean Lakes and Watersheds Association (OCLWA) April
Nutrients and Water Quality in the East Souris River Watershed
 Nutrients and Water Quality in the East Souris River Watershed Phosphorus and nitrogen occur naturally and are important plant nutrient sources in water bodies. However, several human factors have created
Hydrology and Water Quality. Water. Water 9/13/2016. Molecular Water a great solvent. Molecular Water
 Hydrology and Water Quality Water Molecular Water Exists as an equilibrium But equilibrium altered by what is dissolved in it Water Molecular Water a great solvent In reality, water in the environment
North Dakota s Nutrient Reduction Strategy. Presented to the 2016 ND Water Quality Monitoring Conference March 4, 2016
 North Dakota s Nutrient Reduction Strategy Presented to the 2016 ND Water Quality Monitoring Conference March 4, 2016 Nutrients Nutrients, in appropriate amounts, are essential to the growth and health
What s Happening in Lake Whatcom?
 What s Happening in Lake Whatcom? Dr. Robin A. Matthews, Director Institute for Watershed Studies Huxley College of the Environment Western Washington University June 6, 2011 Site 2 Basin 2 Lake Whatcom
Grants Pass Water Quality Monitoring
 Grants Pass Water Quality Monitoring 2003-2005 Rogue Valley Council of Governments April 2005 Rogue Valley Council of Governments Natural Resources Department 155 North First Street Central Point, Oregon
Environmental Consideration of Dairy Systems
 Environmental Consideration of Dairy Systems Phosphorus and Water Quality Neil Hansen, Colorado State University neil.hansen@colostate.edu Environmental Issues Agricultural nutrients in surface and ground
Welcome. Thank you for joining us!
 Welcome. Thank you for joining us! Watershed Restoration and Protection Strategy (WRAPS) Study Implementation Workshop June 24, 2014 Lower Mississippi River Watershed Management Organization Tonight s
Potato Lake 2010 Project Results and APM Plan. Saturday May 28, 2011 Dave Blumer, Jake Macholl SEH Lake Scientists
 Potato Lake 2010 Project Results and APM Plan Saturday May 28, 2011 Dave Blumer, Jake Macholl SEH Lake Scientists Lake and Aquatic Plant Management Planning Goal: To maintain or improve the overall condition
APPENDIX B: POLLUTANT LOADING ANALYSIS. Appendix B: Pollutant Loading Analysis
 APPENDIX B: POLLUTANT LOADING ANALYSIS Appendix B: Pollutant Loading Analysis This page has been intentionally left blank. Appendix B: Pollutant Loading Analysis Appendix B Pollutant Loading Analysis Methodology
Medicine Lake Excess Nutrients TMDL project: Water Quality Standards
 Medicine Lake Excess Nutrients TMDL project: Water Quality Standards Steering Committee Meeting #1 November 18 th, 2008 Water Quality Standards Water quality standards the fundamental benchmarks by which
Nutrient Management. Department of Environmental Quality
 Nutrient Management What is Nutrient Management? Nitrogen (N) and Phosphorous (P) are nutrients needed by all living organisms N & P occur naturally in the environment N & P are also a by-product of development
Nutrient Issues in Lake Ontario. Lisa Trevisan Ontario Ministry of the Environment and Climate Change
 Nutrient Issues in Lake Ontario Lisa Trevisan Ontario Ministry of the Environment and Climate Change March 26, 2015 Outline Lake Ontario facts and figures Nutrient stressors in Lake Ontario Cyanobacteria
a) Temperature b) Light c) Decomposition d) Mixing/Turbulence e) Salinity
 Temperature b) Light c) Decomposition d) Mixing/Turbulence e) Salinity") Dissolved Oxygen and Primary Productivity Activity Introduction: DO is often used as an indicator of water quality. You have probably read or seen news reports of fish kills that have been linked to sewage
Dissolved Oxygen and Primary Productivity Activity Introduction: DO is often used as an indicator of water quality. You have probably read or seen news reports of fish kills that have been linked to sewage
An Introduction to The Ecology of Lakes, Ponds and Reservoirs. Developing a Management Plan
 An Introduction to The Ecology of Lakes, Ponds and Reservoirs Developing a Management Plan Stephen J. Souza, Ph.D. Princeton Hydro, LLC 1108 Old York Road Ringoes, NJ 08551 ssouza@princetonhydro.com Objective
Dissolved Organic Carbon Augmentation:
 National Conference on Mining Influenced Waters Dissolved Organic Carbon Augmentation: An Innovative Tool for Managing Operational and Closure-Phase Impacts from Mining on Surface Water Resources Charles
Welcome. Thank you for joining us! Lower Mississippi River Watershed Management Organization
 Welcome. Thank you for joining us! Lower Mississippi River Watershed Management Organization Lower Mississippi River Watershed Management Organization Watershed Restoration and Protection (WRAP) Study
Mystic River Watershed. Baseline Index Report
 Mystic River Watershed Baseline Index Report 2001 2007 ABR049 ABR028 MIB001 Mill Brook WIB001 ABR006 UPL001 MYR071 MEB001 ALB006 Alewife Brook MAR036 Map of watershed with Mystic Monitoring Network baseline
Water Quality Monitoring at Mississippi National River and Recreation Area
 National Park Service U.S. Department of the Interior Natural Resource Stewardship and Science Water Quality Monitoring at Mississippi National River and Recreation Area 2012 Summary Report Natural Resource
Chapter 3. Lake Assessments
 Chapter 3. Lake Assessments Introduction The Pelican Group of Lakes encompasses 4 lakes: Pelican, Little Pelican, Bass, and Fish. Although these lakes have somewhat different characteristics, they are
Working with partners to manage Invasive Aquatic Plants
 Working with partners to manage Invasive Aquatic Plants By: Chip Welling Coordinator, Management of Invasive Aquatic Species MnDNR To: State of Water conference Alexandria Date: 2016 April 15 S-o-W_2016_Apr_15-CW.ppt
Water Quality in Stormwater Ponds
 Water Quality in Stormwater Ponds Linking Nutrients, Algae and Dissolved Oxygen Erik M. Smith University of South Carolina, Baruch Marine Field Laboratory North Inlet - Winyah Bay National Estuarine Research
MONITORING THE SUSTAINABLE MANAGEMENT OF NUTRIENTS ON C&H FARM IN BIG CREEK WATERSHED
 Big Creek Research & Extension Team Quarterly Report Big Creek Research and Extension Team University of Arkansas System Division of Agriculture Quarterly Report January 1 to March 31, 2018 MOITORIG THE
Restoration and Protection of the Water Resources of the Greenwood Lake Watershed in New Jersey
 Restoration and Protection of the Water Resources of the Greenwood Lake Watershed in New Jersey Greenwood Lake Commission Bi-state commission that was formed in 2001 for the express purpose of improving
Blue-green algae, more appropriately
 Algal Toxins Microcystin in Minnesota Lakes Steven Heiskary and Matt Lindon Where Do We Find It and What Does It Relate To? Blue-green algae, more appropriately referred to as cyanobacteria, are a common
South Venice Water Quality
 SARASOTA COUNTY South Venice Water Quality Summary of Data Collected in Support of the South Venice Civic Association Water Quality Task Force Sarasota County Water Resources 8//24 Introduction The South
Ponds: Careful of the Fish!
 Ponds: Careful of the Fish! Dr. Chuck Cichra Extension Fisheries Specialist University of Florida / IFAS SFRC - Program of Fisheries & Aquatic Sciences All Plants Need Water, Light, and Nutrients Aquatic
Nutrient Loading: NAWQA Regional SPARROW model
 Nutrient Loading: NAWQA Regional SPARROW model Pee Dee River Basin and Winyah Bay Estuary Waccamaw Water Quality Data Conference Wednesday, September 19, 2013 Celeste Journey, Water-Quality Specialist
WATERSHED. Maitland Valley. Report Card 201
 Maitland Valley WATERSHED Report Card 201 The Maitland Valley Conservation Authority has prepared this report card as a summary on the state of our forests, wetlands, surface water, and ground water resources.
Yahara WINS Group Meeting. September 13, 2017
 Yahara WINS Group Meeting September 13, 2017 Approval of Minutes Review and acceptance of 06/13/2017 meeting summary Updates Consulting Director contract signed Yahara Pride LDMI project moving forward
MONITORING THE SUSTAINABLE MANAGEMENT OF NUTRIENTS ON C&H FARM IN BIG CREEK WATERSHED
 Big Creek Research & Extension Team Quarterly Report Big Creek Research and Extension Team University of Arkansas System Division of Agriculture Quarterly Report July 1 to September 30, 2017 MOITORIG THE