Utilities Infrastructure Session 301C EU Utility Master Planning (cont.) Heating & Cooling Systems Basics. Purpose of Today s Presentation.
|
|
|
- August Hawkins
- 5 years ago
- Views:
Transcription
 Heating & Cooling Systems Basics APPA Institute for Facilities Management Bill Nelson PE 1 Purpose of Today s Presentation To provide a broad understanding of")

1 Utilities Infrastructure Session 301C EU Utility Master Planning (cont.) Heating & Cooling Systems Basics APPA Institute for Facilities Management Bill Nelson PE 1 Purpose of Today s Presentation To provide a broad understanding of central heating and cooling systems (This is a core course - you may see some duplication in other classes) To share information about current technologies related to central plants To provide some useful handout material with sizing guides DOE Energy Projections to 20 2 Agenda Introduction Community energy Advantages of a central energy system Efficiencies Pollution reduction The Fundamentals Water Psychometrics 3
2 Agenda (cont.) Chilled Water System Air Handlers & Coils Chillers Cooling towers Steam and Hot Water Systems Boilers Piping Traps & Expansion Joints Energy Prices US Building Stock 4 Words of Wisdom Duct tape is like the force; it has a light side and a dark side, and it holds the universe together 5 Agenda Introduction Community energy Advantages of a central energy system Efficiencies Pollution reduction The Fundamentals Water Psychometrics 6
 Aesthetic options Lower operating cost Better management and energy control Higher overall efficiency Multiple")
3 Community Energy Labs Library Classrooms Central Energy System Hospital Dormitories 7 Heating and Cooling Systems Advantages Integrated solutions Less equipment Lower service cost Better space utilization Alternate technological option 8 Central Energy System Advantages (cont) Aesthetic options Lower operating cost Better management and energy control Higher overall efficiency Multiple fuel capabilities 9


4 Pollution Reduction Power production shifted from mostly coal-fired utility plants to natural gas plant Reduction by avoiding utility transmission losses Reduction by using cogeneration for heating 10 Central Energy System Topics Chilled water systems components configurations Steam and hot water systems components fuels Combined heat and power 11 Agenda Introduction Community energy Advantages of a central energy system Efficiencies Pollution reduction The Fundamentals Water Psychometrics 12

 0 2000 00 6000 7500 10000 Barometric Pressure (inhg) 29.92 28.86 25.84 23.98 22.")
5 Fundamentals: Water--Ideal Heat Transfer Fluid 75ºF 76ºF Specific Heat 32ºF 1 BTU/lb 212ºF Heat of Fusion 144 BTU/lb Heat of Vaporization 970 BTU/lb 13 Psychrometric Formulas Standard Air At Sea Level 70 o F Dry Bulb 50% Relative Humidity 59 o F Wet Bulb 50 o F Dew Point 52 gr moisture/ LB 25.4 h BTU/LB Specific Volume 13.5 ft 3 /LB ONE CUBIC FOOT Sea Level Elevation (feet) Barometric Pressure (inhg) Specific Heat BTU/LB o F 14 Psychrometrics: Definitions One Cubic Foot 15
6 Applied Psychrometrics: Properties of Moist Air Dry-Bulb Temperature, DB Temperature of air as registered by an ordinary thermometer Dewpoint or Saturation Temp. F Dry-Bulb temp. F Grains of Moisture Per Pound of Dry Air DB Applied Psychrometrics: Properties of Moist Air Wet-Bulb Temperature, WB Temperature registered by a thermometer whose bulb is covered by a wetted wick and exposed to a current of rapidly moving air Dewpoint or Saturation Temp. F Dry-Bulb temp. F WB Grains of Moisture Per Pound of Dry Air Applied Psychrometrics: Properties of Moist Air Dew point Temperature, DP Temp. at which condensation of moisture begins when air is cooled Dewpoint or Saturation Temp. F Dry-Bulb temp. F DP Grains of Moisture Per Pound of Dry Air
7 Applied Psychrometrics: Properties of Moist Air Relative Humidity, %RH Ratio of actual water vapor pressure in air to the pressure of saturated water vapor in air at the same temperature Dewpoint or Saturation Temp. F 7 Dry-Bulb temp. F Grains of Moisture Per Pound of Dry Air %RH Applied Psychrometrics: Properties of Moist Air Enthalpy (h) Total heat, BTU per pound of dry air Thermal property indicating the quantity of heat in the air above an arbitrary datum The datum for dry air is 0 F and, for the moisture content, 32 F water Dewpoint or Saturation Temp. F 7 Dry-Bulb temp. F Grains of Moisture Per Pound of Dry Air Applied Psychrometrics: Properties of Moist Air Specific Volume, (V) Cubic feet of the mixture per pound of dry air Grains of Moisture Per Pound of Dry Air Dewpoint or Saturation % Temp. F 70% 80% 50% 30 60% 30% 20 Dry-Bulb % 20% 10% Cu ft 10 temp. F

8 Psychrometrics: Processes Air conditioning processes may be shown graphically on the chart Evaporative cooling 65 Sensible 60 cooling Humidifying Dehumidifying Sensible heating Chemical Dehydration Agenda (cont.) Chilled Water System Air Handlers & Coils Chillers Cooling towers Pumps and piping Steam and Hot Water Systems Boilers Piping Traps & Expansion Joints Combined heat and power (CHP) 23 Chilled Water System Components Air Handlers/Coils Chillers Cooling Towers / Condensers Pumps / Piping IT IS ALL ABOUT MOVING BTU S 24

9 Chilled Water System Cooling Tower Air Handler Chillers Pumps & Piping 25 Air Handling: All Air Systems 26 Chilled Water System Components: Coils 27


10 Chillers 4 Types Chilled Water System Components Centrifugal Screw Absorption Reciprocating 28 Chilled Water System Components: Chillers Centrifugal Chillers 29 Centrifugal Chillers 30


11 Chilled Water System Components: Chillers Screw Chillers 31 Single Stage Absorption Chillers Chilled Water System Components: Chillers 32 Single Stage Steam-Fired Absorption Unit 33

12 Two Stage Steam-Fired Absorption Unit 34 Chilled Water System Components Cooling Towers Forced Draft Induced Draft Condensers Water Cooled Air Cooled 35 Entering Air Dewpoint or 7 Saturation Temp. F Dry-Bulb temp. F % Sample Calculations Cooling Tower 25 60% % 20% Leaving Air 100 o F DB 82 o FDB 70 o F WB 81 o FWB 22 %RH 95 %RH 54 o F DP 80 o FDP 64 gr/lb 160 gr/lb 34.2 BTU/LB 44.9 BTU/LB % 70% 26 50% 30% % Grains of Moisture Per Pound of Dry Air


13 Sample Calculations Cooling Tower 200 Ton Tower Cool 600 gpm from 90 o F to 80 o F with a 70 o F wb ambient. BTUH w = 600 gpm x 8.33 LB/gal x 60 min/hr x (90-80)DT = 3,000,000 BTUH 37 Chilled Water System Components Cooling Towers Forced Draft Induced Draft 38 Chilled Water System Components Pumps/ Piping Primary/Secondary Direct Primary Parallel Pumping Series Pumping Variable Speed Pumping Reverse Return Piping System 39
.")
14 CHILLED WATER PIPING CAPACITY TONS (1000 ft 2 ) Capacity Area GPM s were selected to maintain water velocities (V) below 10 fps, and pressure drop (f) below 1 /100 for large size pipes. The GPM values for smaller size pipes were selected to maintain water velocities below 7 fps, and pressure drop below 4 /100. The velocities and friction drop values are according to Cameron. (C=100) s of gross sq. ft. of building are figured at 300 GSF/ton, I.e. (10,500) indicates that approximately 10,500,000 GSF can be air-conditioned with 35,000 tons. For heavy research areas use 220 GSF/ton. HP values to pump the water through 1000 return calculated using: HP = GPM x TDH TDH = 2000 x f 39 x This chart is intended to be used for obtaining an initial estimate of required pipe size and cost. Actual system design must be based on values obtained specifically for the project. Total installed cost per linear ft. of buried supply & return (2 pipes) piping. Price includes trenching, insulation, fittings, backfill & moderate amounts of surfacing repairs. For total project cost add A-E fees, testing, escalations, contingencies, etc. Agenda (cont.) Chilled Water System Air Handlers & Coils Chillers Cooling towers Pumps and piping Steam and Hot Water Systems Boilers Piping Traps and Expansion Joints Combined heat and power (CHP) 41 HVAC System: Steam and Condensate General Arrangement Building Boiler Deaerator Condensate Tank Boiler Feed Pumps Condensate Pumps 42

15 43 Steam Boilers Fire Tube Boiler vs. Water Tube Boiler Fire Tube Water circulates around the tubes Lower cost Higher water volume Easier to maintain water level Water Tube Water circulates through the tubes Larger capacities and pressures available Faster start up Quicker response 44 Steam Boilers Geometry: D-Type Burner is offset to one side with a single row of tubes on the outside and the convection section on the other side Flue gas travels down the furnace, turns at the back wall, and then travels back through the convection section The stack connection is on the side of the boiler 45
16 Steam Piping Design Distribution System Types Walking Tunnel Shallow Tunnel Direct Buried Material Types Carbon Steel (ANSI B 16.9 A106) Other 46 Piping Design Insulation Types Factory applied (Perma Pipe) Field applied Pitch Velocity/pressure limits Condensate Returns/Trapping Effect of Leaks Expansion devices Supports/guides/anchors Hookups/Accessories 47 Condensate Return-Traps Typical Application Types Thermostatic Liquid expansion Balanced pressure Bimetallic 48

17 Condensate Return-Traps Types (cont d) Mechanical Bucket Float Thermodynamic Impulse Disc 49 Typical Application 50 Mechanical-Float & Thermostatic 51

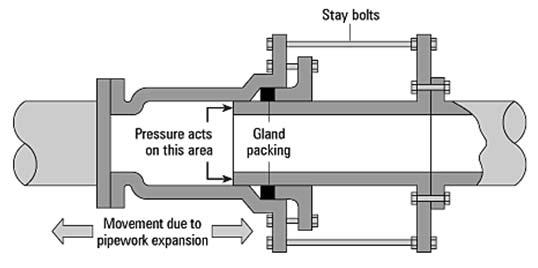

18 Expansion-Basic Restraint 52 Expansion-Sliding Joint 53 Expansion-Bellows 54

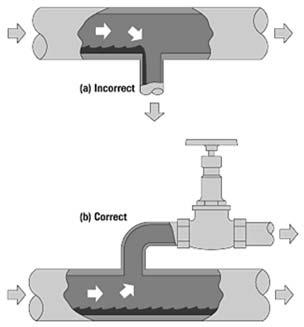
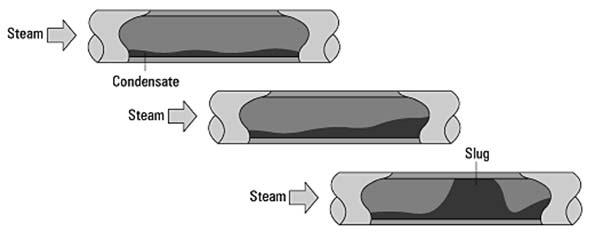
19 Hookup-Main Drips Bad Good 55 Hookup-Takeoff 56 Waterhammer-Steam Induced 57
![Tunnel Flooding-Condensate Generation 58 STEAM SYSTEM PIPING CAPACITY 1000 lb/hr (1000 ft 2 ) [HP] Steam Quantity Area Feedwater](/docs-images/82/86395364/images/20-0.jpg "Pump HP Building SQFT values are based on 60 Btuh/sqft peak average combined load (building heat and domestic hot water).")


20 Tunnel Flooding-Condensate Generation 58 STEAM SYSTEM PIPING CAPACITY 1000 lb/hr (1000 ft 2 ) [HP] Steam Quantity Area Feedwater Pump HP Building SQFT values are based on 60 Btuh/sqft peak average combined load (building heat and domestic hot water). For winter lows below +25 F: at 0 F multiply building SQFT by 0.8, at -20 F multiply building SQFT by 0.6. Steam lines are sized to approximately 10,000 ft/min. Condensate lines are sized to approximately yield pressure drops less than 2 /100. Prices shown are construction cost for a direct buried dual conduit piping system. This chart is intended to be used for obtaining an initial estimate of required pipe size and cost. Actual system design must be based on values obtained specifically for the project. Total installed cost per linear ft. of buried supply & return (2 pipes) piping. Price includes trenching, insulation, fittings, backfill & moderate amounts of surfacing repairs. For total project cost add A-E fees, testing, escalations, contingencies, etc. 59 A Barrel of Oil (42 Gallons) $

21 Fuel Prices (est.) Natural 80% Efficiency $7.00 / million Btu 75% Efficiency $2.60/million Btu 96% Efficiency $28.00/million Btu 80% Efficiency Grade $/million Btu Gasoline Diesel Jet Fuel % Efficiency $8.00/million Btu 75% Efficiency $19.00/million Btu 61 ANNUAL ENERGY OUTLOOK Reference Case APRIL 2015 WDC U.S. Energy Information Administration Independent Statistics & Analysis Key results from AEO2015 In most AEO2015 cases, U.S. net energy imports, including all fuels, decline and ultimately end by 2030 for the first time since the 1950s Strong growth in domestic production of crude oil from tight formations through 2020 and limited growth in domestic demand after 2020 leads to a decline in net petroleum and other liquids imports The United States transitions from being a net importer of natural gas to a net exporter by 2017 in all cases U.S. energy consumption grows at a modest rate over the projection with reductions in energy intensity resulting from improved technologies and trends driven by existing laws and regulations Renewables provide an increased share of electricity generation, reflecting rising long term natural gas prices and the high capital costs of new coal and nuclear generation capacity 63

22 Key results from AEO2015 (continued) Improved efficiency of energy consumption in end use sectors and a shift away from more carbon intensive fuels help to stabilize U.S. energy related carbon dioxide emissions, which remain below the 2005 level through 20 Growth of domestic crude oil and natural gas production varies significantly across regions and cases, leading to shifts in crude oil and natural gas flows between regions, requiring infrastructure adjustments The AEO2015 cases generally reflect current policies, including final regulations and the sunset of tax credits under current law; consistent with this approach, EPA s proposed Clean Power Plan rules for existing fossil fired electric generating units or the effects of relaxing current limits on crude oil exports are not considered in AEO OVERVIEW OF U.S. ENERGY SUPPLY AND DEMAND Crude oil price projection is lower in the AEO2015 Reference case than in AEO2014, particularly in the near term Brent crude oil spot price 2013 dollars per barrel History 2013 Projections AEO2014 AEO2015 Source: EIA, Annual Energy Outlook 2015 Reference case and Annual Energy Outlook 2014 Reference case 66
23 Reductions in energy intensity largely offset impact of GDP growth, leading to slow projected growth in energy use U.S. primary energy consumption quadrillion Btu History Renewables (excluding liquid biofuels) 2013 Projections Natural gas 27% 8% 27% 9% 29% 10% Coal Nuclear Liquid biofuels 18% 8% 1% 19% 8% 1% 18% 8% 1% Petroleum and other liquids 36% 35% 33% Source: EIA, Annual Energy Outlook 2015 Reference case 67 U.S. net energy imports continue to decline in the near term, reflecting increased oil and natural gas production coupled with slow demand growth U.S. net energy imports quadrillion Btu History 2013 Projections Low Oil Price Reference High Oil Price High Oil and Gas Resource Source: EIA, Annual Energy Outlook CO 2 emissions are sensitive to the influence of future economic growth and energy price trends on energy consumption energy related carbon dioxide emissions million metric tons History 2013 Projections High Economic Growth High Oil and Gas Resource Reference Low Economic Growth Source: EIA, Annual Energy Outlook

24 CO 2 emissions per dollar of GDP decline faster than energy use per dollar of GDP with a shift towards lower carbon fuels energy and emission intensity index, 2005=1 History Projections Energy use per capita Energy use per 2009 dollar of GDP Carbon dioxide emissions per 2009 dollar GDP Source: EIA, Annual Energy Outlook 2015 Reference case 70 PETROLEUM AND OTHER LIQUID SUPPLY AEO2015 explores scenarios that encompass a wide range of future crude oil price paths Brent crude oil spot price 2013 dollars per barrel History 2013 Projections High Oil Price Reference High Oil and Gas Resource Low Oil Price Source: EIA, Annual Energy Outlook


25 U.S. crude oil production rises above previous historical highs before 2020 in all AEO2015 cases, with a range of longer term outcomes U.S. crude oil production million barrels per day History Reference High Oil and Gas Resource Low Oil Price U.S. maximum production level of 9.6 million barrels per day in 1970 Tight oil Lower 48 offshore Alaska Other lower 48 onshore Source: EIA, Annual Energy Outlook Growth of onshore crude oil production varies across supply regions, affecting pipeline and midstream infrastructure needs change between 2013 and 20 in U.S. lower 48 onshore crude oil production by region million barrels per day Dakotas/Rocky Mountains West Coast East Southwest Gulf Coast Midcontinent 4.1 Source: EIA, Annual Energy Outlook Combination of increased tight oil production and higher fuel efficiency drive projected decline in oil imports U.S. liquid fuels supply million barrels per day History Projections 20 Net petroleum and other liquids imports 33% 14% 21% Natural gas plant liquids 17% 21% 14% 17% 29% Tight oil production 22% Other crude oil production (excluding tight) 23% 25% 27% Other 14% 12% 12% Note: Other includes refinery gain, biofuels production, all stock withdrawals, and other domestic sources of liquid fuels Source: EIA, Annual Energy Outlook 2015 Reference case 75


26 net crude oil and petroleum product imports as a percentage of total U.S. supply percent 2013 History Projections Low Oil Price Reference High Oil Price High Oil and Gas Resource Source: EIA, Annual Energy Outlook In the transportation sector, motor gasoline use declines; diesel fuel, jet fuel, and natural gas use all grow transportation energy consumption by fuel quadrillion Btu History 2013 Projections % Diesel 31% 31% Other* 10% 3% 4% Jet fuel Ethanol 1% 13% 4% CNG/LNG 14% 2% 5% 3% 3% 58% Motor gasoline 48% 44% Source: EIA, Annual Energy Outlook 2015 Reference case *Includes aviation gasoline, propane, residual fuel oil, lubricants, electricity, and liquid hydrogen 77 U.S. net exports of petroleum products vary with the level of domestic oil production given current limits on U.S. crude oil exports U.S. petroleum product imports and exports million barrels per day High Oil and Gas History Reference Low Oil Price Resource 2013 Total petroleum product net exports Total petroleum product Other petroleum High Oil and Gas Resource net exports product exports Reference Low Oil Price Motor gasoline exports Distillate exports Other petroleum product imports Distillate imports Motor gasoline imports Source: EIA, Annual Energy Outlook


27 NATURAL GAS Future domestic natural gas prices depend on both domestic resource availability and world energy prices average Henry Hub spot prices for natural gas 2013 dollars per million Btu History 2013 Projections High Oil Price Reference Low Oil Price High Oil and Gas Resource Source: EIA, Annual Energy Outlook Shale resources remain the dominant source of U.S. natural gas production growth U.S. dry natural gas production trillion cubic feet History 2013 Projections billion cubic feet per day Shale gas and tight oil plays Other lower 48 onshore Lower 48 offshore Tight gas Coalbed methane Alaska Source: EIA, Annual Energy Outlook 2015 Reference case 81


28 Natural gas consumption growth is driven by increased use in all sectors except residential U.S. dry gas consumption trillion cubic feet History Projections billion cubic feet per day Residential Commercial Transportation** Electric power Industrial* Source: EIA, Annual Energy Outlook 2015 Reference case *Includes combined heat-and-power and lease and plant fuel **Includes pipeline fuel 82 Growth in manufacturing output and use of natural gas reflect high natural gas supply and low prices, particularly in near term manufacturing natural gas consumption quadrillion Btu billion cubic feet per day Food Bulk chemicals Refining and related Other manufacturing Metal based durables Iron and steel Paper Aluminum Glass Source: EIA, Annual Energy Outlook 2015 Reference case 83 Projected U.S. natural gas exports reflect the spread between domestic natural gas prices and world energy prices U.S. natural gas imports and exports trillion cubic feet History 2013 Alaska LNG exports billion cubic feet per day 2013 Projections 2013 Lower 48 states LNG exports Pipeline exports to Mexico LNG imports Pipeline exports to Canada Reference Pipeline imports from Canada High Oil and Gas Resource Low Oil Price Source: EIA, Annual Energy Outlook
 Electricity use Period Average Growth Electricity use GDP 1950s 9.8 4.2 1960s 7.3 4.5 History 2013 1970s 4.7 3.2 1980s 2.9 3.")
29 ELECTRICITY Growth in electricity use slows, but electricity use still increases by 24% from 2013 to 20 U.S. electricity use and GDP percent growth (rolling average of 3 year periods) Electricity use Period Average Growth Electricity use GDP 1950s s History s s s Projections Gross domestic product Source: EIA, Annual Energy Outlook 2015 Reference case 86 Over time the electricity mix gradually shifts to lower carbon options, led by growth in renewables and gas fired generation electricity net generation trillion kilowatthours 1993 History 2013 Projections % 27% Natural gas 31% 13% 11% 13% 16% Renewables 18% 53% 39% 38% Coal 34% 19% Petroleum and other liquids 19% 1% 18% 1% Nuclear 16% 1% 4% Source: EIA, Annual Energy Outlook 2015 Reference case 87


30 Non hydro renewable generation grows to double hydropower generation by 20 renewable electricity generation by fuel type billion kilowatthours History 2013 Projections Conventional Hydroelectric Power Wind Solar Geothermal Biomass Municipal waste/landfill gas Source: EIA, Annual Energy Outlook 2015 Reference case 88 Growth in wind and solar generation meets a significant portion of projected total electric load growth in all AEO2015 cases U.S. renewable generation in all sectors by fuel billion kilowatthours 20 Wind Solar Biomass and waste Geothermal Conventional hydroelectric power Source: EIA, Annual Energy Outlook For more information U.S. Energy Information Administration home page Annual Energy Outlook Short Term Energy Outlook International Energy Outlook Today In Energy Monthly Energy Review State Energy Portal Drilling Productivity Report 90


31 U.S. Energy Flow Trends QUADRILLION BTUs (10 15 ) Source: GLHN Architects & Engineers, Inc. Fossil Fuels & Climate Change 92 The U.S. Built Environment Currently the US Building stock is approx. 200 billion sf. 93
32 The U.S. Built Environment Over the next 30 years 52 billion sf will be demolished 94 The U.S. Built Environment 150 billion sf will be Remodeled 95 The U.S. Built Environment 150 billion sf will be New construction 96

33 The U.S. Built Environment Therefore, by the year 20, three-quarters of the building stock will be new or renovated 97 Can We Do It- Done it before 98 A SMART Goal Over the next 5-7 years the University of Arizona will add 1 million square feet to their built environment; the consumption of fossil fuels will remain at 2007 levels. 99

34 Questions? 100
Annual Energy Outlook 2015
 Annual Energy Outlook 215 for Asia Pacific Energy Research Centre Annual Conference 215 Tokyo, Japan by Sam Napolitano Director of the Office of Integrated and International Energy Analysis U.S. Energy
Fuels Used in Electricity Generation
 Fuels Used in Electricity Generation for Energy and Climate Change Research Seminar May 17 th, 2012 Washington, DC by, Office of Electricity, Coal, Nuclear and Renewables Analysis Energy Information Administration
International Energy Outlook: key findings in the 216 Reference case World energy consumption increases from 549 quadrillion Btu in 212 to 629 quadril
 EIA's Global Energy Outlook For The Institute of Energy Economics, Japan October 5, 216 Japan By Adam Sieminski, Administrator U.S. Energy Information Administration Independent Statistics & Analysis www.eia.gov
Status and outlook for shale gas and tight oil development in the U.S.
 Status and outlook for shale gas and tight oil development in the U.S. for Energy Symposium, University of Oklahoma, Price College Energy Institute Norman, OK by Adam Sieminski, Administrator U.S. Energy
Oil and natural gas: market outlook and drivers
 Oil and natural gas: market outlook and drivers for American Foundry Society May 18, 216 Washington, DC by Howard Gruenspecht, Deputy Administrator U.S. Energy Information Administration Independent Statistics
Energy Outlook for National Ocean Industries Association Annual Meeting April 17, 2015 Washington, D.C.
 Energy Outlook 215 for National Ocean Industries Association Annual Meeting Washington, D.C. by Howard Gruenspecht, Deputy Administrator U.S. Energy Information Administration Independent Statistics &
U.S. Shale Gas in Context
 U.S. Shale Gas in Context Overview of U.S. Natural Gas production and trends For National Conference of State Legislatures Natural Gas Policy Institute September 9, 215 Pittsburgh, Pennsylvania By Grant
Utilities Infrastructure Cooling Production 316. Purpose of Today s Presentation. Agenda. GLHN Architects & Engineers, Inc.
 Utilities Infrastructure Cooling Production 316 APPA Institute for Facilities Management Fort Worth January 2019 Bill Nelson PE 1 Purpose of Today s Presentation To provide a broad understanding of central
World and U.S. Oil and Gas Production and Price Outlook: To Infinity (or at least 2050) and Beyond
 and Beyond") World and U.S. Oil and Gas Production and Price Outlook: To Infinity (or at least 25) and Beyond Energy and Environment Symposium April 18, 218 Rifle, Colorado by Troy Cook, Senior Global Upstream Analyst,
World and U.S. Oil and Gas Production and Price Outlook: To Infinity (or at least 25) and Beyond Energy and Environment Symposium April 18, 218 Rifle, Colorado by Troy Cook, Senior Global Upstream Analyst,
Annual Energy Outlook 2018
 Annual Energy Outlook 218 Columbia University, Center on Global Energy Policy February 13, 218 New York, NY John J. Conti, Deputy Administrator U.S. Energy Information Administration U.S. Energy Information
Utilities Infrastructure Cooling Distribution. Purpose of Today s Presentation. Agenda. GLHN Architects & Engineers, Inc.
 Utilities Infrastructure Cooling Distribution APPA Institute for Facilities Management Dallas Jan 2017 Bill Nelson PE 1 Purpose of Today s Presentation To provide a broad understanding of Chilled water
Annual Energy Outlook 2010 Reference Case
 Annual Energy Outlook 21 Reference Case The Paul H. Nitze School of Advanced International Studies December 14, 29 Washington, DC Richard Newell, Administrator Richard Newell, SAIS, December 14, 29 1 How
U.S. oil and natural gas outlook
 U.S. oil and natural gas outlook New York, NY By Adam Sieminski, EIA Administrator U.S. Energy Information Administration Independent Statistics & Analysis www.eia.go v The U.S. has experienced a rapid
Utilities Infrastructure Cooling Production. Purpose of Today s Presentation. Agenda. GLHN Architects & Engineers, Inc. APPA Institute Session 301C EU
 Utilities Infrastructure Cooling Production APPA Institute for Facilities Management Dallas Jan 2017 Bill Nelson PE 1 Purpose of Today s Presentation To provide a broad understanding of central cooling
Annual Energy Outlook 2017 with projections to 2050
 Annual Energy Outlook 217 with projections to 25 #AEO217 January 5, 217 Table of contents Page Overview/key takeaways 3 Critical drivers and uncertainty 31 Petroleum and other liquids 4 Natural gas 51
Annual Energy Outlook 2018 with projections to 2050
 Annual Energy Outlook 218 with projections to 25 February 218 U.S. Energy Information Administration Office of Energy Analysis U.S. Department of Energy Washington, DC 2585 This publication is on the Web
Overview. Key Energy Issues to Economic Growth
 Key Energy Issues to 225 The Energy Information Administration (EIA), in preparing model forecasts for its Annual Energy Outlook 25 (AEO25), evaluated a wide range of current trends and issues that could
Early Release Overview
 Annual Energy Outlook 21 Early Release Overview December 29 Energy Trends to 235 In preparing the Annual Energy Outlook 21 (AEO- 21), the Energy Information Administration (EIA) evaluated a wide range
U.S. EIA s Liquid Fuels Outlook
 U.S. EIA s Liquid Fuels Outlook NCSL 2011 Energy Policy Summit: Fueling Tomorrow s Transportation John Staub, Team Lead August 8, 2011 San Antonio, Texas U.S. Energy Information Administration Independent
Energy Markets. U.S. Energy Information Administration. for Center on Global Energy Policy, Columbia University November 20, 2015 New York, New York
 Energy Markets for Center on Global Energy Policy, Columbia University New York, New York by Adam Sieminski, Administrator U.S. Energy Information Administration U.S. Energy Information Administration
Short Term Energy Outlook March 2011 March 8, 2011 Release
 Short Term Energy Outlook March 2011 March 8, 2011 Release Highlights West Texas Intermediate (WTI) and other crude oil spot prices have risen about $15 per barrel since mid February partly in response
Annual Energy Outlook 2017
 Annual Energy Outlook 217 Valve Manufacturers Association of America VMA Technical Seminar 217 March 2, 217 Nashville, TN By, Director, Office of Integrated and International Energy Analysis U.S. Energy
Energy Markets. U.S. Energy Information Administration. for. October 29, 2015 Golden, Colorado. by Adam Sieminski, Administrator
 Energy Markets for The Payne Institute for Earth Resources at the Colorado School of Mines Golden, Colorado by Adam Sieminski, Administrator U.S. Energy Information Administration U.S. Energy Information
AEO2005 Overview. Key Energy Issues to Economic Growth
 Key Energy Issues to 225 The Energy Information Administration (EIA), in preparing model forecasts for its Annual Energy Outlook 25 (AEO25), evaluated a wide range of current trends and issues that could
Annual Energy Outlook 2005
 Page 1 of 5 Home >EIA Brochures > Annual Energy Outlook 2005 Annual Energy Outlook 2005 With Projections to 2025 Figure 1. Energy Prices, 1970-2025 (2003 dollars per million Btu) The Annual Energy Outlook
EIA s Energy Outlook Through 2035
 EIA s Energy Outlook Through 235 ReThink Montgomery Speaker Series Energy March 23, 21 Silver Spring, Maryland A. Michael Schaal, Director, Oil and Gas Division Office of Integrated Analysis and Forecasting
Drivers of future U.S. carbon dioxide emissions: insights from the Annual Energy Outlook 2011
 Drivers of future U.S. carbon dioxide emissions: insights from the Annual Energy Outlook 2011 Global Climate Change Research Seminar Electric Power Research Institute, Deputy Administrator May 25, 2011
Annual Energy Outlook 2016 and International Energy Outlook 2016
 Annual Energy Outlook 216 and International Energy Outlook 216 Energy Risk and Critical Infrastructure Workshop Troy Cook, Senior Global Upstream Analyst, EIA May 25-25, 216 Denver, CO U.S. Energy Information
Impact of American Unconventional Oil and Gas Revolution
 National University of Singapore Energy Studies Institute 18 May 215 Impact of American Unconventional Oil and Gas Revolution Edward C. Chow Senior Fellow Revenge of the Oil Price Cycle American Innovation:
International Energy Outlook 2016
 International Energy Outlook 2016 For APERC Annual Conference 2017 Tokyo, Japan By Angelina LaRose U.S. Energy Information Administration Independent Statistics & Analysis www.eia.gov Global outlook 2
International Energy Outlook 2017
 International Energy 217 for Eighth IEA-IEF-OPEC Symposium on Energy s February 14, 218 Riyadh, Saudi Arabia U.S. Energy Information Administration U.S. Energy Information Administration Independent Statistics
Power & Politics Navigating the Changing Vision of Our Energy Future. Rayola Dougher, API Senior Economic Advisor,
 Power & Politics Navigating the Changing Vision of Our Energy Future Rayola Dougher, API Senior Economic Advisor, dougherr@api.org U.S. oil and natural gas production is increasing as a result of technological
APPA 2017 Fuels 1. Energy Fuel Types Fuel consumption What fuels are we using? What are we using it for?
 Barry Mielke, PE South Dakota State University Energy Fuel Types Fuel consumption What fuels are we using? What are we using it for? APPA 2017 Fuels 1 As defined by your science teacher, Energy is the
Summer Fuels Outlook. Gasoline and diesel. April 2018
 April 2018 Summer Fuels Outlook This outlook focuses on prices and consumption of gasoline, diesel, and electricity (see Summer Fuels Outlook motor gasoline table and electricity table). The use of these
Oil and gas outlook. For New York Energy Forum October 15, 2015 New York, NY. By Adam Sieminski, Administrator. U.S. Energy Information Administration
 Oil and gas outlook For New York Energy Forum New York, NY By Adam Sieminski, Administrator U.S. Energy Information Administration U.S. Energy Information Administration Independent Statistics & Analysis
Global energy markets
 For Woodrow Wilson Center Global Energy Forum September 21, 215 Washington, DC by Adam Sieminski, Administrator U.S. Energy Information Administration U.S. Energy Information Administration Independent
************ Day 2 ************ ************ Session 2, Session 3 11:45 and 1:45 ************
 Natural Gas Value Chain: Discussion Questions ************ Day 2 ************ ************ Session 2, Session 3 11:45 and 1:45 ************ Electric Generation What other generation fuels are in the mix?
Centerpoint Energy. Energy Efficiency & Technology Conference. Steam and Process Heat Recovery. May 23, 2017
 Centerpoint Energy Energy Efficiency & Technology Conference Steam and Process Heat Recovery May 23, 2017 Madison, WI Tom Tucker, P.E. Principal 1 General Agenda About Kinergetics Boilers and Steam Systems
Boiler and. steadily increases while the supply decreases energy
 FEATURE ARTICLE by William G. Acker ENERGY SURVEYS FOR Stewart Cohen/Stone The efficient use of energy is fast becoming a top concern for industry. As business managers become more conscientious about
Short-Term Energy Outlook (STEO)
") May 2013 Short-Term Energy Outlook (STEO) Highlights Falling crude oil prices contributed to a decline in the U.S. regular gasoline retail price from a year to date high of $3.78 per gallon on February
May 2013 Short-Term Energy Outlook (STEO) Highlights Falling crude oil prices contributed to a decline in the U.S. regular gasoline retail price from a year to date high of $3.78 per gallon on February
The bitterness of poor quality is remembered long after the sweetness of low price is forgotten!
 Heat Pump Sizing Using ACCA Manual J8 It s s a Building Code Requirement Size the Equipment BEFORE You Build The bitterness of poor quality is remembered long after the sweetness of low price is forgotten!
Which honored guest graduated from Service High School in 1990?
 #AOGA2015 #AOGA2015 Which honored guest graduated from Service High School in 1990? Attorney General Craig Richards House Majority Leader Charisse Millett Senator Lesil McGuire Department of the Interior
International Energy Outlook 2017
 International Energy Outlook 217 September 14, 217 Table of contents Page Overview 3 Petroleum and other liquids 31 Natural gas 47 Coal 61 Electricity 75 Buildings 91 Industrial 15 Transportation 117 Energy-related
Central Plant Management EU 302
 Central Plant Management EU 302 Jay Becker, P.E. COURSE OVERVIEW Central Heating & Chiller Plants CHP / Cogeneration / High Voltage Systems Maintenance Staffing COURSE OVERVIEW, continued Contract Work
Short-Term and Long-Term Outlook for Energy Markets
 Short-Term and Long-Term Outlook for Energy Markets Guy Caruso Administrator, Energy Information Administration guy.caruso@eia.doe.gov Fueling the Future: Energy Policy in New England December 2, 25 Boston,
Data and Analysis from EIA to Inform Policymakers, Industry, and the Public Regarding Power Sector Trends
 Data and Analysis from EIA to Inform Policymakers, Industry, and the Public Regarding Power Sector Trends for Power Sector Trends in the Eastern Interconnection Atlanta, GA by Howard Gruenspecht, Deputy
Regional energy challenges in New England and Eastern Canada
 Regional energy challenges in New England and Eastern Canada For 39 th Annual Conference of New England Governors and Eastern Canadian Premiers () August 31, 2015 St. John s By Adam Sieminski Energy Information
International Energy Outlook 2011
 International Energy Outlook 211 Center for Strategic and International Studies, Acting Administrator September 19, 211 Washington, DC U.S. Energy Information Administration Independent Statistics & Analysis
Seventh Biennial Report on Progress toward Greenhouse Gas Reduction Goals
 Report to the Joint Standing Committee on Environment and Natural Resources 128 th Legislature, Second Session Seventh Biennial Report on Progress toward Greenhouse Gas Reduction Goals January 2018 Contact:
Energy Availability and the Future of the Fertilizer Industry. Rayola Dougher API Senior Economic Advisor
 Energy Availability and the Future of the Fertilizer Industry Rayola Dougher API Senior Economic Advisor dougherr@api.org Energy: the engine of our economic growth 1974 1980 1986 1992 1998 2004 2010 2016
Central Plant Management EU 302
 Central Plant Management EU 302 Jay Becker, P.E. KEY POINTS TAKE AWAYS Plants are vital Know Needs & Meet Needs Reliability Economics Planning & Communication O & M; Efficiency; Sustainable Staff (training,
Professor Eugene Silberstein, CMHE SUFFOLK COUNTY COMMUNITY COLLEGE BRENTWOOD, NY CENGAGE DELMAR LEARNING CLIFTON PARK, NY
 ...WITHOUT TEARS Professor Eugene Silberstein, CMHE SUFFOLK COUNTY COMMUNITY COLLEGE BRENTWOOD, NY CENGAGE DELMAR LEARNING CLIFTON PARK, NY HVAC EXCELLENCE INSTRUCTOR CONFERENCE LAS VEGAS, NEVADA MARCH
Milken Institute: Center for Accelerating Energy Solutions
 Milken Institute: Center for Accelerating Energy Solutions Center for Accelerating Energy Solutions Promotes policy and market mechanisms to build a more stable and sustainable energy future Identifies
PAPER-1: GENERAL ASPECTS OF ENERGY MANAGEMENT AND ENERGY AUDIT
 NATIONAL PRODUCTIVITY COUNCIL Dr. AMBEDKAR INSTITUTE OF PRODUCTIVITY, CHENNAI 19 th NATIONAL CERTIFICATION EXAMINATION for ENERGY MANAGERS & ENERGY AUDITORS Sept 2018 SYLLABUS PAPER-1: GENERAL ASPECTS
API Industry Outlook. Third Quarter R. Dean Foreman, Ph.D. Great Plains and EmPower ND Energy Conference October 8, 2018.
 API Industry Outlook Third Quarter 2018 R. Dean Foreman, Ph.D. Chief Economist American Petroleum Institute Great Plains and EmPower ND Energy Conference October 8, 2018 American Updated Petroleum September
Combined Heat and Power: Markets and Challenges
 Combined Heat and Power: Markets and Challenges Bruce A. Hedman ICF International Roundtable on Industrial Energy Efficiency and CHP June 28, 2012 Acknowledgements Based on work supported by: DOE s Advanced
Short-Term Energy and Summer Fuels Outlook (STEO)
") April 2013 Short-Term Energy and Summer Fuels Outlook (STEO) Highlights During the April through September summer driving season this year, regular gasoline retail prices are forecast to average $3.63
April 2013 Short-Term Energy and Summer Fuels Outlook (STEO) Highlights During the April through September summer driving season this year, regular gasoline retail prices are forecast to average $3.63
The Outlook for Energy: A View to 2040
 The Outlook for Energy: A View to 2040 Rob Gardner March 2014 This presentation includes forward looking statements. Actual future conditions (including economic conditions, energy demand, and energy supply)
Update on U.S. Oil and Gas Proved Reserves, Highlighting the Contribution of the Williston Basin
 Update on U.S. Oil and Gas Proved Reserves, Highlighting the Contribution of the Williston Basin Steven G. Grape Energy Information Administration Office of Oil and Gas Reserves & Production Division Dallas,
Measuring Enthalpy to Calculate Efficiency Application Note Summary. 2 Introduction. 3 What to Measure.
 Power Knot LLC 501 Valley Way Milpitas CA 95035 USA Measuring Enthalpy to Calculate Efficiency Application Note 96-02000-08 +1-408-587-9333 www.powerknot.com 1 Summary This application note describes in
U.S. Energy Market Outlook
 U.S. Energy Market Outlook for Energy Policy Institute National Governor's Association Washington, DC by Howard Gruenspecht, Deputy Administrator U.S. Energy Information Administration Independent Statistics
Short-Term Energy Outlook and Winter Fuels Outlook
 Short-Term Energy Outlook and Winter Fuels Outlook For NASEO Winter Fuels Outlook Conference Washington, DC By Adam Sieminski, Administrator U.S. Energy Information Administration Independent Statistics
FROM RAILROAD COMMISSIONER RYAN SITTON
 2018 E N E R G Y M A R K E T O U T L O O K FROM RAILROAD COMMISSIONER RYAN SITTON TABLE OF CONTENTS 2018 ENERGY MARKET OUTLOOK Summing up the analysis contained in this report in a few sentences, my prediction
Chilled Water Distribution Systems. APPA Institute for Facilities Management New Orleans, LA January 19, 2016
 Chilled Water Distribution Systems APPA Institute for Facilities Management New Orleans, LA January 19, 2016 1 Purpose of Today s Presentation To provide a broad understanding of chilled water distribution
Driving Forces Behind Generation Fuel Mix In the Annual Energy Outlook 2006
 Driving Forces Behind Generation Fuel Mix In the Annual Energy Outlook 26 33 rd Annual PURC Conference February 24, 26 Energy Information Administration Independent statistical agency within the Department
The Outlook for Energy: A View to 2040
 The Outlook for Energy: A View to 2040 Todd Onderdonk United States Association for Energy Economics February 2013 This presentation includes forward-looking statements. Actual future conditions (including
Princeton University Facilities Engineering
 Princeton University Facilities Engineering Environmental & Energy Study Institute International District Energy Association District Energy & Combined Heat & Power at Princeton University Rayburn House
Thermal & Fluids PE References Exam Errata
 Thermal & Fluids PE References Exam Errata This product has been updated to incorporate all changes shown in the comments on the webpage and email comments as of February, 2 2018. If you have purchased
Gas and Crude Oil Production Outlook
 Gas and Crude Oil Production Outlook COQA/CCQTA Joint meeting October 3-31, 214 San Francisco, California By John Powell Office of Petroleum, Natural Gas, and Biofuels Analysis U.S. Energy Information
Large University Central Chiller Plant Design Considerations
 Carrier Engineering Newsletter Volume 5, Issue 3 Large University Central Chiller Plant Design Considerations Large campus chilled water plants have unique constraints and need careful evaluation for successful
API Automotive/Petroleum Industry Forum Alessandro Faldi
 API Automotive/Petroleum Industry Forum Alessandro Faldi April 17, 2018 2018 Outlook for Energy: A View to 2040 The Outlook for Energy includes Exxon Mobil Corporation s internal estimates and forecasts
Energy Efficiency Strategies Waste Heat Recovery & Emission Reductions
 Energy Efficiency Strategies Waste Heat Recovery & Emission Reductions TUR Continuing Education Conference Sturbridge Host Hotel April 14, 2010 With fuel prices increasing and environmental pressure to
Global Energy Trends and Where Alaska Fits
 Global Energy Trends and Where Alaska Fits for 39 th Annual Alaska Resource Conference November 14, 218 Anchorage, AK by Dr. Ian Mead, Assistant Administrator for Energy Analysis U.S. Energy Information
Outlook for Oil and Gas and Implications for Biomass
 Outlook for Oil and Gas and Implications for Biomass John P. Martin, Ph.D. New York State Energy Research and Development Authority February 17, 2010 Misc. Pictures Here Energy Choices 21 st Century Energy
Section 1. Electricity and Your Community. What Do You See? Think About It. Investigate. Learning Outcomes
 Chapter 7 Earth s Natural Resources Section 1 Electricity and Your Community What Do You See? Learning Outcomes In this section, you will Compare energy resources used to generate electricity in the United
AEO2010 Commercial Sector Projections. Energy Forecasting Group Annual Meeting April 29, 2010 Las Vegas, Nevada
 AEO2010 Commercial Sector Projections Energy Forecasting Group Annual Meeting April 29, 2010 Las Vegas, Nevada Erin Boedecker, Operations Research Analyst Overview What s changed Modeling changes Review
Shale Gas. A Game Changer for U.S. and Global Gas Markets? Flame European Gas Conference March 2, 2010, Amsterdam. Richard G. Newell, Administrator
 Shale Gas A Game Changer for U.S. and Global Gas Markets? Flame European Gas Conference March 2, 2010, Amsterdam Richard G. Newell, Administrator Richard Newell, March SAIS, December 2, 2010 14, 2009 1
AIChE: Natural Gas Utilization Workshop Overcoming Hurdles of Technology Implementation
 AIChE: Natural Gas Utilization Workshop Overcoming Hurdles of Technology Implementation Natural Gas in the United States: An Overview of Resources and Factors Affecting the Market November 2, 216 Justin
Welcome Everyone. Not Quite this kind! Geothermal Heat Pumps are a indirect solar heating system! Introduction to Geothermal
 Welcome Everyone To the Introduction to Geothermal Heat Pump Technology! Introduction to Geothermal What is geothermal technology and how does it work Technology & Components Heat Pump Operation Earth
Gregory W. Stevens and Ronald K. Ishii, Alternative Energy Systems Consulting, Inc.
 A Study of Optimizing the System Integration of Combined Heat and Power (CHP) with Absorption Cooling for Cold Storage Applications: Design Considerations, Modeling and Life Cycle Costing Gregory W. Stevens
December 13, 2012 Energy Efficient Cooling Information Service Webinar Series Christine Brinker and Gearoid Foley CHP with Absorption Chilling
 December 13, 2012 Energy Efficient Cooling Information Service Webinar Series Christine Brinker and Gearoid Foley CHP with Absorption Chilling Technical Assistance Education and Outreach Executive Order
U.S. Carbon Dioxide Emissions from Energy Sources 2006 Flash Estimate
 U.S. Carbon Dioxide Emissions from Energy Sources 2006 Flash Estimate Energy Information Administration U.S. Department of Energy May 2007 Office of Integrated Analysis & Forecasting, EI-81 This flash
Highlights. Figure 1. World marketed energy consumption, (quadrillion Btu)
") Highlights World marketed energy consumption increases by 49 percent from 27 to 235 in the Reference case. Total energy demand in the non-oecd countries increases by 84 percent, compared with an increase
Highlights World marketed energy consumption increases by 49 percent from 27 to 235 in the Reference case. Total energy demand in the non-oecd countries increases by 84 percent, compared with an increase
The Outlook for Energy: A View to 2040
 The Outlook for Energy: A View to 2040 Todd Onderdonk USAEE -- Houston February 2014 This presentation includes forward-looking statements. Actual future conditions (including economic conditions, energy
NOIA s mission is to secure reliable access to the nation s valuable. and supplied in an environmentally responsible manner.
 Energy Challenges for Georgia and the NATion NOIA s mission is to secure reliable access to the nation s valuable offshore energy resources in order that they may be developed, produced and supplied in
Shale Gas and the Outlook for U.S. Natural Gas Markets and Global Gas Resources
 Shale Gas and the Outlook for U.S. Natural Gas Markets and Global Gas Resources Organization for Economic Cooperation and Development (OECD) Richard Newell, Administrator June 21, 2011 Paris, France U.S.
Power Technologies. Question. Answer. Energy is the ability to do work or change the system. Answer. Question. What are the various sources of energy?
 What is energy? Energy is the ability to do work or change the system. What are the various sources of energy? Fossil fuels Oil (Petroleum) Propane Natural gas Coal Alternative fuels Nuclear Wind Solar
US Energy Policy: Time for a Reality Check? Lucian Pugliaresi Energy Policy Research Foundation, Inc. Open Round Columbia 2010
 US Energy Policy: Time for a Reality Check? Lucian Pugliaresi Energy Policy Research Foundation, Inc Open Round Columbia 2010 Columbia Petroleum Show Industrial Panel Bogota December 2, 2009 Energy Policy
U.S. natural gas and LNG exports
 U.S. natural gas and LNG exports For Hudson Institute Washington DC April 6, 216 By Victoria Zaretskaya Office of Petroleum, Natural Gas, and Biofuels Analysis U.S. Energy Information Administration Independent
WHY IS THERE A NEED FOR MORE ACCURACY IN DRY KILN CONTROL
 WHY IS THERE A NEED FOR MORE ACCURACY IN DRY KILN CONTROL Leon Breckenridge Integrated Energy Economic Services, Inc. Yakima, Washington INTRODUCTION Section A Parameters for Measurement and Control The
NOIA s mission is to secure reliable access to the nation s valuable. and supplied in an environmentally responsible manner.
 Energy Challenges for Nebraska and the NATion NOIA s mission is to secure reliable access to the nation s valuable offshore energy resources in order that they may be developed, produced and supplied in
The Impact of Developing Energy and Environmental Policy on the Gas Industry Plus Impacts of the Current Economic State
 The Impact of Developing Energy and Environmental Policy on the Gas Industry Plus Impacts of the Current Economic State Gas / Electric Partnership Conference XVII Gas Compression from Production thru Transmission
Farm Energy IQ. Modifying Energy Buying Habits. Farms Today Securing Our Energy Future. Gary Musgrave, Penn State Extension
 Farm Energy IQ Farms Today Securing Our Energy Future Modifying Energy Buying Habits Gary Musgrave, Penn State Extension Farm Energy IQ Modifying Energy Buying Habits Introductions Learning Objectives
Challenges in Industrial Waste Heat Recovery. Texas Technology 2006 Showcase Tony Dafft December 6 & 7, 2006
 Challenges in Industrial Waste Heat Recovery Texas Technology 2006 Showcase Tony Dafft December 6 & 7, 2006 Outline Plant Statistics and Energy History Tools Used to Identify Projects Sample of Projects
ECONOMIC BENEFITS OF HYBRID TURBINE INLET CHILLING FOR A SMALL GAS TURBINE IN AN INDUSTRIAL PROCESS
 white paper ECONOMIC BENEFITS OF HYBRID TURBINE INLET CHILLING FOR A SMALL GAS TURBINE IN AN INDUSTRIAL PROCESS By Christopher Hjorth, Enterprise Products, Mt. Belvieu, TX Marcus Bastianen P.E., Everest
The Outlook for Energy
 The Outlook for Energy a view to 23 Rob Gardner 33 rd Annual Marine / Offshore Industry Outlook Conference March 25, 21 This presentation includes forward-looking statements. Actual future conditions (including
Short-Term Energy and Winter Fuels Outlook
 October 2012 Short-Term Energy and Winter Fuels Outlook EIA projects average household expenditures for heating oil and natural gas will increase by 19 percent and 15 percent, respectively, this winter
Highlights. Figure 1. World Marketed Energy Consumption by Region,
 Highlights World energy consumption is projected to increase by 71 percent from 3 to 23. Fossil fuels continue to supply much of the energy used worldwide, and oil remains the dominant energy source. In
U.S. Historical and Projected Shale Gas Production
 U.S. Historical and Projected Shale Gas Production Phyllis Martin Phyllis Martin, Senior Energy Analyst Office of Petroleum, Gas and Biofuels Analysis U.S. Energy Information Administration phyllis.martin@eia.doe.gov
October U.S. Energy Information Administration Winter Fuels Outlook October
 October 2017 Winter Fuels Outlook EIA forecasts that average household expenditures for all major home heating fuels will rise this winter because of expected colder weather and higher energy costs. Average