FSC-H FSC-H FSC-H
|
|
|
- Philip Johns
- 5 years ago
- Views:
Transcription


1 Supplement Figure A 4 h control + h B 4 h control + h


2 Supplement Figure A-H BV6/TNF-α + ctrl A B 9 h C D h E F 8 h G H


3 Supplement Figure I-P + ctrl I J 8 h K L 4 h M N h O P
 * *non-specific band (h) phax bc RIP-IP - - TNFR RelA B Survival (% control) 7 kda kda E")
4 Supplement Figure 3 A Survival (% control) BV Necr D F H I sirna RIP ctrl RIP sirna ctrl RIP3 RIP3 sirna ctrl MLKL MLKL RIP RIP3 mrna levels(% control) * *non-specific band (h) phax bc RIP-IP - - TNFR RelA B Survival (% control) 7 kda kda E Survival (% control) lysate kda BV6 sirna ctrl RIP RIP3 MLKL kda kda control sirna 5 kda kda J TNFR RelA BV6 BV6 + G (h) RIP Caspase 8 sirna ctrl TNFR sirna ctrl RelA ctrl RIP RIP3 MLKL bc - - kda 7 kda kda Survival (% control) C mrna levels (% control) control sirna RIP RIP3 Necr. GSK'87 NSA Caspase 8-IP K TNFR surface expression (%control) bc lysate ** ** (h) kda 35 kda kda
5 Supplement Figure 4 A nucleus (h) TNF-α RelA p5 PARP Caspase 3 cytoplasm kda kda 35 kda B D mrna (x-fold increase) IĸBα (h) pikbα HCT6 XIAP (h) pikbα cfliplong HT9 ciap C Survival (% control) (h) pikbα MLN TNF-α SW kda kda E mrna (x-fold change) HCT HT SW TNF-α IL-8 CCL TNF-α IL-8 CCL TNF-α IL-8 CCL F TNF-α (pg/ml) HCT6 HT9 SW4 HCT6 HT9 SW4 + G RIP RIP3 Caspase 8 MLKL * HCT6 HT9 SW4 * non-specific band 7 kda kda
6 Supplement Figure 5 A mrna (x-fold increase) IDN-734 B TNF-α IL-8 CCL C TNF-α (pg/ml) IDN-734 D mrna (x-fold change) Z-DEVD Z-VEID Z-IETD Survival (% control) + IDN Necr TNF-α IL-8 CCL
 EDD Survival (% control) RIP bc RIP-IP 4h - - sirip3")

 3h 3 kda 7 kda TNF-α IL-8 CCL 3 sirip3 sirip3 siedd")
 3 sicasp8")
7 Supplement Figure 6 A mrna (x-fold increase) B C mrna (x-fold change) EDD Survival (% control) RIP bc RIP-IP 4h - - sirip3 siedd 3h E G mrna (x-fold increase) TNF-α IL-8 CCL + + Necr siedd bc lysate 4h - - Survival (% control) 3h 3 kda 7 kda TNF-α IL-8 CCL 3 sirip3 sirip3 siedd siedd F sijnk TNF-α IL-8 3 CCL 8 sicasp8 sicasp8 sicasp H TNF-α (pg/ml) 3 sicasp8 D TNF-α (pg/ml) I Proliferation (%) IDN-734 sirip3 siedd 5 3


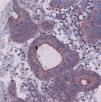


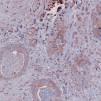


8 Supplement Figure 7 A cleaved Caspase 3 (IHC-Score) Apoptosis-like Necroptosis-like Resistant n.s n.s * p =.4 p =.8 p =.7 p =.3 p = n.s p =. + B nuclear RelA (IHC-Score) µm + * + µm Apoptosis-like Necroptosis-like Resistant n.s ** * p =.58 n.s p = µm p =. p = p =.5 n.s p =.3 + µm µm µm C Tissue # RIP Apoptosis -like Necroptosis -like Resistant kda RIP3 Caspase 8 MLKL kda Ponceau S 7 kda
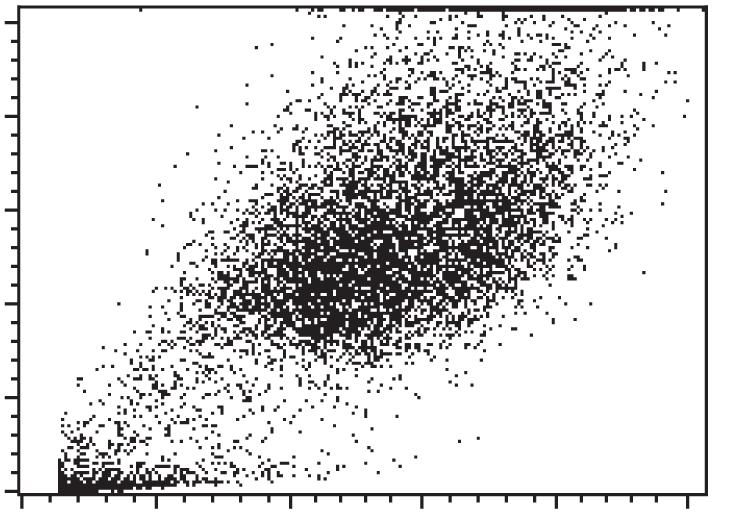
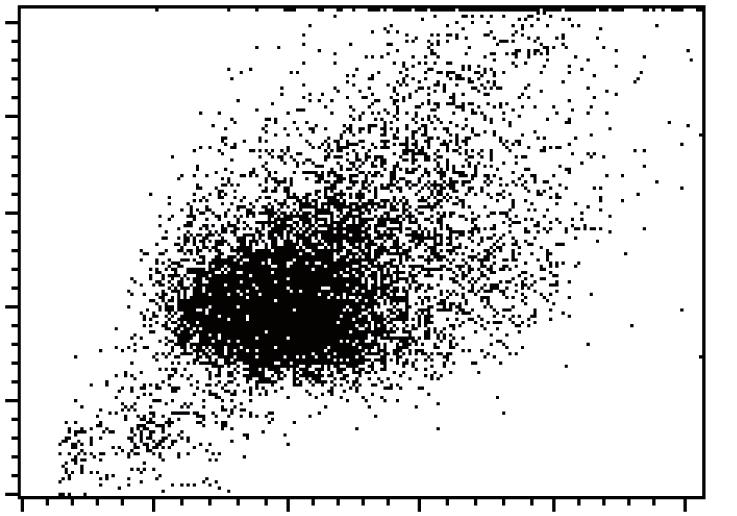
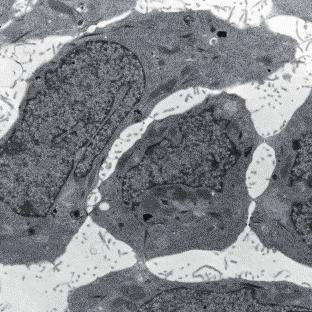
9 Supplement Figures Supplement Figure : Discrimination of apoptotic and necrotic cell death in HCT6 and HT9. A: HCT6 were pre-treated with (5 µm) for hours, followed by treatment with (5 µg/ml) for the indicated durations. Cellular size (forward scatter, FSC) and granularity (side scatter, SSC) versus cell permeability (PI-positivity, red dots) was analyzed via flow cytometry to discriminate apoptotic from necrotic cell death (according to Vanden Berghe et al.). After 4 hours of treatment, apoptotic particles (small PI-negative dots in the box of the lower left corner) and plasma membrane blebbing (spreading of the dots) were detected. After hours this was followed by the occurrence of an increased subpopulation of PI-positive cells (box in the center) indicative for plasma membrane permeability in the stage of secondary necrosis. Addition of suppressed induced apoptosis. Data shown of one out of three representative experiments. B: In HT9, which were treated as explained in Supplement Figure A, co-treatment of and caused primary necrotic death after hours of treatment as indicated by a PI-positive sub-population of enlarged celluar size (box shifted to right) in the absence of previous apoptotic changes. Data shown of one out of three representative experiments. Supplement Figure : Ultrastructural analysis of necroptosis. HT9 were pre-treated with for hours and incubated with BV6 (.6 µm) plus TNF-α (5 ng/ml) (A-H), or (5 µg/ml) (I-P). Morphological changes were analyzed via electron microscopy after the indicated durations. Cytoplasm of untreated HT9 cells (A, B, I, J) was rich of rough endoplasmic reticulum (ER) and
10 normal sized mitochondria with regular structure of cristae. After 9 hours of BV6/TNFα/ (C, D), or 8 hours of / treatment (K, L), discrete vacuolization of the ER was visible as a sign of cellular stress. Dehiscence of cristae and an edematous matrix in mitochondria of normal size indicated for early mitochondrial degeneration. After hours (E, F) or 4 hours (M, N), respectively, prominent enlargement of mitochondria was visible with partial loss of cristae and vacuolization. After 8 hours (G, H) or hours (O, P), dramatic vacuolization and disruption of cell organelles and rupture of plasma membranes was observed. Note that the structure of the nucleus remained intact until late stages of necroptosis. Scale bars: µm. Supplement Figure 3: RIP, RIP3 and MLKL are required for necroptosis A: BV6/TNF-α and induced necroptosis in HT9. Necroptosis was induced with (5 µm) and BV6 (.6µM) in the presence of TNF-α (5 ng/ml) for 48 hours. Mean percentage of treated cells obtained from three independent experiments with three technical replicates each (± SD, two-sided Student s t-test, P <.). B: Knockdown of RIP, RIP3 or MLKL had no significant effects on, BV6 or 5- FU treatment. HT9 were transfected with sirnas and treated with, BV6 (.6 µm) or (5 µg/ml) for 48 hours. Mean percentage of control (ctrl, scrambled sirna and ), obtained from three independent experiments with three technical replicates each (± SD). C: Knockdown efficiencies of indicated sirnas on mrna level as quantified via qrt- PCR after 48 hours. Mean percentage of control (ctrl, scrambled sirna and ), obtained from three independent experiments with two technical replicates each (± SD, two-sided Student s t-test, P <.).
11 D: Knockdown efficiencies of indicated sirnas on protein levels as analyzed by Western blot after 48 hours. Asterisk: non-specific band. : loading control. E: Effect of chemical RIP, RIP3 and MLKL inhibitors on necroptosis. HT9 cells were pre-treated with, Necrostatin- (Necr., µm), GSK 87 (5 µm) or Necrosulfonamide (NSA, µm) for hours, followed by addition of BV6 (.6 µm) or (5 µg/ml) for 48 hours. Mean percentage of control (), obtained from three independent experiments with three technical replicates each (± SD, two-sided Student s t-test, P <.). F: phax levels after treatment. HT9 cells were treated with (5 µg/ml) for the indicated durations and levels of phax were quantified via Western blot. G: Immunoprecipitation of caspase 8 after treatment with and. HT9 were treated with (5 µm) and (5 µg/ml) for the indicated durations. Co-immunopreciptitation was performed on lysates using a specific antibody against caspase 8 and samples were analyzed via Western blot. Bc: bead control. H: Immunoprecipitation of RIP after treatment with and. HT9 cells were treated with (5 µm) and (5 µg/ml) for 3 hours. Coimmunoprecipitation was performed on lysates using a specific antibody against RIP and samples were analyzed for RIP and RIP3 via Western blot. Bc: bead control. I: Knockdown efficiency of sitnfr and sirela on mrna level as quantified via qrt- PCR after 48 hours. Mean percentage of control (ctrl, scrambled sirna and ), obtained from three independent experiments with two technical replicates each (± SD, two-sided Student s t-test, P <.). 3
12 J: Knockdown efficiency of sitnfr and sirela on protein level as analyzed by Western blot after 48 hours. : loading control. K: Elevated TNFR cell surface expression after treatment. HT9 were treated with (5 µg/ml) for the indicated durations and receptor cell surface expression was analyzed via flow cytometry. Mean percentage of treated cells obtained from three independent experiments (± SD, two-sided Student s t-test, **P <.). Supplement Figure 4: Activation of NF-κB by and A: and induced nuclear translocation of RelA and p5. HT9 cells were treated with (5 µm) and (5 µg/ml) for the indicated durations. Nuclear and cytosolic compartments were separately analyzed for the presence of RelA and p5 via Western blot. TNF-α (5 ng/ml) treated samples served as a positive control. PARP: loading control for nuclear fraction. Caspase 3: loading control for cytosolic fraction. B: Necroptosis was accompanied by increased transcription of NF-κB target genes as quantified by qrt-pcr. HT9 cells were treated with and (as described in B) for 4 hours. Mean fold increase compared to control (), obtained from three independent experiments with two technical replicates each (± SD, two-sided Student s t-test, P <.). C: Effect of MLN-494 on necroptosis. HT9 were treated with and (as indicated in B) for 48 hours, in the presence or absence of MLN-494 ( µm) and/or TNF-α (5 ng/ml). Mean percentage of control (), obtained from three independent experiments with three technical replicates each (± SD, two-sided Student s t-test, P <.). 4
13 D: piκbα levels after and treatment was only detected in HT9, but not in HCT6 or SW4. After treatment with (5 µm) and (5 µg/ml) for 4 hours lysates were analyzed via Western blot. : loading control. E: and treatment induced increased mrna levels of NF-κB dependent target genes in HT9, but not in HCT6 or SW4. Cells were treated with (5 µm) and (5 µg/ml) for 4 hours and target genes were quantified via qrt- PCR. Mean fold change compared to control () obtained from three independent experiments with two technical replicates each (± SD). F: TNF-α production by HCT6, HT9 and SW4 cells in response to and Z- VAD. Cells were treated as described in B, and after 4 hours TNF-α was quantified in supernatants via ELISA. Mean of one out of three representative experiments with two technical replicates each (± SD). G: Basal expression levels of components of the necroptosis pathway in HCT6, HT9 and SW4 cells as quantified via Western blot. Asterisk: non-specific band. : loading control. Supplement Figure 5: Effects of various caspase inhibitors A: Effect of combinatory treatment of and the pan-caspase inhibitor IDN-734 on NF-κB target gene transcription as quantified by qrt-pcr. HT9 cells were pretreated for hours with IDN-734 (5 µm), followed by addition of (5 µg/ml) for 4 hours. Mean fold increase compared to control (), obtained from three independent experiments with two technical replicates each (± SD, two-sided Student s t-test, P <.). B: Effect of and IDN-734 on autocrine TNF-α production. HT9 cells were treated as indicated in C. Mean fold increase compared to control (), obtained 5
14 from three independent experiments with two technical replicates each (± SD, twosided Student s t-test, P <.). C: and IDN-734 induced necroptosis. HT9 cells were pre-treated for hours with IDN-734 (5 µm) and/or Necrostatin ( µm), followed by addition of (5 µg/ml) for 48 hours. Percentage of cells treated with. Mean obtained from three independent biological replicates with three technical replicates each (± SD, two-sided Student s t-test, P <.). D: Effects of Z-DEVD, Z-VEID and Z-IETD on NF-κB dependent target genes. HT9 cells were pre-treated for hours with Z-DEVD, Z-VEID or Z-IETD (5 µm each), followed by stimulation with (5 µg/ml) for 4 hours. mrna levels were quantified by qrt-pcr. Mean fold change compared to control (), obtained from three independent experiments with two technical replicates each (± SD). Supplement Figure 6: Robust activation of NF-κB in response to and Z- VAD requires caspase 8 A: Effects of Necrostatin- on NF-κB dependent target gene expression as quantified by qrt-pcr. HT9 were treated with (5 µm), Necrostatin- ( µm) and 5- FU (5 µg/ml) for 4 hours. Mean fold change compared to control (), obtained from three independent experiments with two technical replicates each (± SD, twosided Student s t-test, P <.). B: Immunoprecipitation of RIP after treatment with and. HT9 cells were treated with (5 µm) and (5 µg/ml) for 4 or 3 hours. Coimmunopreciptitation was performed on lysates using a specific antibody against RIP and samples were analyzed for EDD and RIP via Western blot. Bc: bead control. 6
15 C: Effects of RIP3 or EDD knockdown on NF-κB dependent target gene expression as quantified by qrt-pcr. HT9 were transfected with indicated sirnas and treated with (5 µm) and (5 µg/ml) for 4 hours. Mean fold change compared to control (, scrambled sirna and ), obtained from three independent experiments with two technical replicates each (± SD, two-sided Student s t-test, P <.). D: Effects of RIP3 or EDD knockdown on TNF-α secretion. Cell culture supernatants from Supplement Figure 6B were analyzed via ELISA for TNF-α levels. Means of one of three representative experiments with two technical replicates each (± SD, twosided Student s t-test, P <.). E: Effects of EDD knockdown on necroptosis. HT9 cells were transfected with the indicated sirnas and treated with (5 µm) and (5 µg/ml) for 48 hours. Mean percentage of control (, scrambled sirna, and ), obtained from three independent experiments with three technical replicates each (± SD). F: Effects of JNK knockdown on necroptosis. HT9 cells were transfected and treated as described in Supplement Figure 6D. Mean percentage of control (, scrambled sirna, and ), obtained from three independent experiments with three technical replicates each (± SD). G: Effects of caspase 8 knockdown on NF-κB dependent target gene expression as quantified by qrt-pcr. HT9 cells were transfected and treated as described in Supplement Figure 6B. Mean fold increase compared to control (, scrambled sirna and ), obtained from three independent experiments with two technical replicates each (± SD, two-sided Student s t-test, P <.). 7
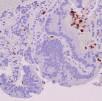
16 H: Effects of caspase 8 knockdown on TNF-α secretion. Cell culture supernatants from Supplement Figure 6F were analyzed via ELISA for TNF-α levels. Means of one of three representative experiments with two technical replicates each (± SD, twosided Student s t-test, P <.). I: Immunohistochemical staining of Ki-67/MIB was performed on sections of xenografts and the fraction of positive nuclei was quantified via computer-assisted image analysis using Aperio Image Scope software. Mean percentage of positive nuclei obtained from representative vital tumor regions (> 5 nuclei), ± SD, twosided Student s t-test: not significant, P >.5. Supplement Figure 7: Analysis of CRC tumor specimens A: Immunohistochemical staining of cleaved caspase 3 was performed on sections of treated tissue slices and intensity of staining was quantified using the following immunohistochemical (IHC) score: = negative, = weakly positive, = moderately positive, 3 = strongly positive. Boxplots show IHC scores obtained from apoptosislike (n = 4, tissue #-4), necroptosis-like (n = 5, tissue #5-9) and resistant (n = 4, tissue #-3) cases (± SD, two-sided Student s t-test: *P <.5, P <., n.s.: not significant). B: Immunohistochemical staining of RelA was performed on sections of treated tissue slices and intensity of staining was quantified using the following immunohistochemical (IHC) score: percentage of positive nuclei ( = -9%, = - 9%, 3 = >%) x intensity of staining ( = negative, = weakly positive, = moderately positive, 3 = strongly positive). Boxplots show IHC scores obtained from the subgroups as explained in A (± SD, two-sided Student s t-test: *P <.5, **P <., n.s.: not significant). Asterisk: maximum outlier. 8
17 C: D: Basal expression levels of components of the necroptosis pathway in all human samples as quantified via Western blot using µg of protein lysate of each sample. and Ponceau S: loading control. 9
3 P p25. p43 p41 28 FADD. cflips. PE-Cy5 [Fluorescence intensity]
![3 P p25. p43 p41 28 FADD. cflips. PE-Cy5 [Fluorescence intensity]](/thumbs/87/97394430.jpg "3 P p25. p43 p41 28 FADD. cflips. PE-Cy5 [Fluorescence intensity]") L S p4 3 D3 76 N S L Ve ct or p4 3 D3 76 N S L Ve ct or A aspase 8 FADD TRAF2 D95-R - + Vector D95L TL I S L D376N T RAIL-R1 T RAIL-R2 D95-R E-y5 [Fluorescence intensity] Supplemental Fig. 1 Different
L S p4 3 D3 76 N S L Ve ct or p4 3 D3 76 N S L Ve ct or A aspase 8 FADD TRAF2 D95-R - + Vector D95L TL I S L D376N T RAIL-R1 T RAIL-R2 D95-R E-y5 [Fluorescence intensity] Supplemental Fig. 1 Different
Cell death analysis using the high content bioimager BD PathwayTM 855 instrument (BD
 Supplemental information Materials and Methods: Cell lines, reagents and antibodies: Wild type (A3) and caspase-8 -/- (I9.2) Jurkat cells were cultured in RPMI 164 medium (Life Technologies) supplemented
Li et al., Supplemental Figures
 Li et al., Supplemental Figures Fig. S1. Suppressing TGM2 expression with TGM2 sirnas inhibits migration and invasion in A549-TR cells. A, A549-TR cells transfected with negative control sirna (NC sirna)
Supplementary Information
 Supplementary Information Sam68 modulates the promoter specificity of NF-κB and mediates expression of CD25 in activated T cells Kai Fu 1, 6, Xin Sun 1, 6, Wenxin Zheng 1, 6, Eric M. Wier 1, Andrea Hodgson
Supplemental Fig. 1: PEA-15 knockdown efficiency assessed by immunohistochemistry and qpcr
 Supplemental figure legends Supplemental Fig. 1: PEA-15 knockdown efficiency assessed by immunohistochemistry and qpcr A, LβT2 cells were transfected with either scrambled or PEA-15 sirna. Cells were then
SUPPLEMENTARY INFORMATION
 DOI: 10.1038/ncb3240 Supplementary Figure 1 GBM cell lines display similar levels of p100 to p52 processing but respond differentially to TWEAK-induced TERT expression according to TERT promoter mutation
JCB. Supplemental material THE JOURNAL OF CELL BIOLOGY. Kimura et al.,
 Supplemental material JCB Kimura et al., http://www.jcb.org/cgi/content/full/jcb.201503023/dc1 THE JOURNAL OF CELL BIOLOGY Figure S1. TRIMs regulate IFN-γ induced autophagy. (A and B) HC image analysis
Supplemental Information. DNp63 Inhibits Oxidative Stress-Induced Cell. Death, Including Ferroptosis, and Cooperates with
 Cell Reports, Volume 21 Supplemental Information DNp63 Inhibits Oxidative Stress-Induced Cell Death, Including Ferroptosis, and Cooperates with the BCL-2 Family to Promote Clonogenic Survival Gary X. Wang,
Dual PI3K/ERK inhibition induces necroptotic cell death of Hodgkin Lymphoma cells through IER3 downregulation
 Dual PI3K/ERK inhibition induces necroptotic cell death of Hodgkin Lymphoma cells through IER3 downregulation *Silvia Laura Locatelli, 1 Giuseppa Careddu, 1 Giuliano Giuseppe Stirparo, 1 Luca Castagna,
Supplementary Online Material
 Material and Methods Supplementary Online Material Reagents and antibodies Wortmannin, JNK inhibitor II (Anthra[1,9-cd]pyrazol-6(2H)-one 1,9-pyrazoloanthrone), SB 2358, and PD 9859 were purchased from
Supplementary Figure 1. IFN-γ induces TRC dormancy. a, IFN-γ induced dormancy
 Supplementary Figure 1. IFN-γ induces TRC dormancy. a, IFN-γ induced dormancy of various tumor type TRCs, including H22 (murine hepatocarcinoma) and CT26 (murine colon cancer). Bar, 50 µm. b, B16 cells
supplementary information
 DOI: 10.1038/ncb2172 Figure S1 p53 regulates cellular NADPH and lipid levels via inhibition of G6PD. (a) U2OS cells stably expressing p53 shrna or a control shrna were transfected with control sirna or
monoclonal antibody. (a) The specificity of the anti-rhbdd1 monoclonal antibody was examined in
 The specificity of the anti-rhbdd1 monoclonal antibody was examined in") Supplementary information Supplementary figures Supplementary Figure 1 Determination of the s pecificity of in-house anti-rhbdd1 mouse monoclonal antibody. (a) The specificity of the anti-rhbdd1 monoclonal
Supplementary information Supplementary figures Supplementary Figure 1 Determination of the s pecificity of in-house anti-rhbdd1 mouse monoclonal antibody. (a) The specificity of the anti-rhbdd1 monoclonal
Supplemental figure 1: Phenotype of IMC and MDSC after purification. A. Gating
 Supplemental Figure Legend: Supplemental figure 1: Phenotype of IMC and MDSC after purification. A. Gating strategy for mouse MDSC. CD11b + Ly6C high Ly6G - cells are defined as M-MDSC. CD11b + Ly6C low
Figure S1 (related to Fig. 1): The prototypical mitochondrial pathway of apoptosis is involved in cell-death of v-src-transformed cells.
: The prototypical mitochondrial pathway of apoptosis is involved in cell-death of v-src-transformed cells.") Figure S1 (related to Fig. 1): The prototypical mitochondrial pathway of apoptosis is involved in cell-death of v-src-transformed cells. (A) Non-transformed (Control cells) and v-srctransformed 3T3 cells
Figure S1 (related to Fig. 1): The prototypical mitochondrial pathway of apoptosis is involved in cell-death of v-src-transformed cells. (A) Non-transformed (Control cells) and v-srctransformed 3T3 cells
Supplementary Materials for
 www.sciencesignaling.org/cgi/content/full/4/198/ra74/dc1 Supplementary Materials for Short RNA Duplexes Elicit RIG-I Mediated Apoptosis in a Cell Type and Length-Dependent Manner Osamu Ishibashi, Md. Moksed
SUPPLEMENTAL MATERIALS SIRTUIN 1 PROMOTES HYPEROXIA-INDUCED LUNG EPITHELIAL DEATH INDEPENDENT OF NRF2 ACTIVATION
 SUPPLEMENTAL MATERIALS SIRTUIN PROMOTES HYPEROXIA-INDUCED LUNG EPITHELIAL DEATH INDEPENDENT OF NRF ACTIVATION Haranatha R. Potteti*, Subbiah Rajasekaran*, Senthilkumar B. Rajamohan*, Chandramohan R. Tamatam,
Transcriptional regulation of IFN-l genes in Hepatitis C virus-infected hepatocytes via IRF-3 IRF-7 NF- B complex
 POSTER PRESENTATION Transcriptional regulation of IFN-l genes in Hepatitis C virus-infected hepatocytes via IRF-3 IRF-7 NF- B complex Hai-Chon Lee *, Je-In Youn, Kyungwha Lee, Hwanyul Yong, Seung-Yong
Supplementary Figure 1: Overexpression of EBV-encoded proteins Western blot analysis of the expression levels of EBV-encoded latency III proteins in
 Supplementary Figure 1: Overexpression of EBV-encoded proteins Western blot analysis of the expression levels of EBV-encoded latency III proteins in BL2 cells. The Ponceau S staining of the membranes or
Supplementary Infomation
 Supplementary Infomation Mycobacterium avium MAV2054 protein induces macrophage apoptosis through targeting to mitochondria and reduces intracellular growth of the bacteria. Kang-In Lee 1,2, Jake Whang
Supplementary Figure 1 PARP1 is involved in regulating the stability of mrnas from pro-inflammatory cytokine/chemokine mediators.
 Supplementary Figure 1 PARP1 is involved in regulating the stability of mrnas from pro-inflammatory cytokine/chemokine mediators. (a) A graphic depiction of the approach to determining the stability of
Supplementary Figure 1. GST pull-down analysis of the interaction of GST-cIAP1 (A, B), GSTcIAP1
, GSTcIAP1") Legends Supplementary Figure 1. GST pull-down analysis of the interaction of GST- (A, B), GST mutants (B) or GST- (C) with indicated proteins. A, B, Cell lysate from untransfected HeLa cells were loaded
Legends Supplementary Figure 1. GST pull-down analysis of the interaction of GST- (A, B), GST mutants (B) or GST- (C) with indicated proteins. A, B, Cell lysate from untransfected HeLa cells were loaded
T H E J O U R N A L O F C E L L B I O L O G Y
 T H E J O U R N A L O F C E L L B I O L O G Y Supplemental material Han et al., http://www.jcb.org/cgi/content/full/jcb.201311007/dc1 Figure S1. SIVA1 interacts with PCNA. (A) HEK293T cells were transiently
Supplementary Figure 1. Intracellular distribution of the EPE peptide. HeLa cells were serum-starved (16 h, 0.1%), and treated with EPE peptide,
, and treated with EPE peptide,") Supplementary Figure 1. Intracellular distribution of the EPE peptide. HeLa cells were serum-starved (16 h, 0.1%), and treated with EPE peptide, conjugated with either TAT or Myristic acid and biotin for
Supplementary Figure 1. Intracellular distribution of the EPE peptide. HeLa cells were serum-starved (16 h, 0.1%), and treated with EPE peptide, conjugated with either TAT or Myristic acid and biotin for
SUPPLEMENTARY INFORMATION
 doi:10.1038/nature09732 Supplementary Figure 1: Depletion of Fbw7 results in elevated Mcl-1 abundance. a, Total thymocytes from 8-wk-old Lck-Cre/Fbw7 +/fl (Control) or Lck-Cre/Fbw7 fl/fl (Fbw7 KO) mice
Supplemental Figure 1
 Supplemental Figure 1 A IL-12p7 (pg/ml) 7 6 4 3 2 1 Medium then TLR ligands MDP then TLR ligands Medium then TLR ligands + MDP MDP then TLR ligands + MDP B IL-12p4 (ng/ml) 1.2 1..8.6.4.2. Medium MDP Medium
Ma, et al. Supplemental Data
 Ma, et al Supplemental Data Title: Calpain mediates pulmonary vascular remodeling in rodent models of pulmonary hypertension and its inhibition attenuates pathologic features of disease Authors: Wanli
A Tumor Necrosis Factor-Alpha-Mediated Pathway Promoting Autosomal Dominant Polycystic Kidney Disease.
 A Tumor Necrosis Factor-Alpha-Mediated Pathway Promoting Autosomal Dominant Polycystic Kidney Disease. Xiaogang Li, Brenda S. Magenheimer, Sheng Xia, Teri Johnson, Darren P. Wallace, James P. Calvet and
Stabilization of the Transcription Factor Foxp3 by the Deubiquitinase USP7 Increases Treg-Cell-Suppressive Capacity
 Immunity, Volume 39 Supplemental Information Stabilization of the Transcription Factor Foxp3 by the Deubiquitinase USP7 Increases Treg-Cell-Suppressive Capacity Jorg van Loosdregt, Veerle Fleskens, Juan
Supplementary Information. ATM and MET kinases are synthetic lethal with. non-genotoxic activation of p53
 Supplementary Information ATM and MET kinases are synthetic lethal with non-genotoxic activation of p53 Kelly D. Sullivan 1, Nuria Padilla-Just 1, Ryan E. Henry 1, Christopher C. Porter 2, Jihye Kim 3,
SUPPLEMENTARY INFORMATION
 SUPPLEMENTARY INFORMATION Contents: Supplementary Figure 1. Additional structural and binding data for designed tuim peptides. Supplementary Figure 2. Subcellular localization patterns of designed tuim
Supplementary data. sienigma. F-Enigma F-EnigmaSM. a-p53
 Supplementary data Supplemental Figure 1 A sienigma #2 sienigma sicontrol a-enigma - + ++ - - - - - - + ++ - - - - - - ++ B sienigma F-Enigma F-EnigmaSM a-flag HLK3 cells - - - + ++ + ++ - + - + + - -
Supplemental Information. The TRAIL-Induced Cancer Secretome. Promotes a Tumor-Supportive Immune. Microenvironment via CCR2
 Molecular Cell, Volume 65 Supplemental Information The TRAIL-Induced Cancer Secretome Promotes a Tumor-Supportive Immune Microenvironment via CCR2 Torsten Hartwig, Antonella Montinaro, Silvia von Karstedt,
Transcriptional regulation of BRCA1 expression by a metabolic switch: Di, Fernandez, De Siervi, Longo, and Gardner. H3K4Me3
 ChIP H3K4Me3 enrichment.25.2.15.1.5 H3K4Me3 H3K4Me3 ctrl H3K4Me3 + E2 NS + E2 1. kb kb +82 kb Figure S1. Estrogen promotes entry of MCF-7 into the cell cycle but does not significantly change activation-associated
SUPPLEMENTARY INFORMATION
 DOI: 10.1038/ncb3562 In the format provided by the authors and unedited. Supplementary Figure 1 Glucose deficiency induced FH-ATF2 interaction. In b-m, immunoblotting or immunoprecipitation analyses were
SUPPLEMENTARY INFORMATION
 doi:.8/nature85 Supplementary Methods Plasmid construction Murine RIG-I, HMGB and Rab5 cdnas were obtained by polymerase chain reaction with reverse transcription (RT-PCR) on total RNA from, and then cloned
SONOMA STATE UNIVERSITY DEPARTMENT OF BIOLOGY BIOLOGY 344: CELL BIOLOGY Fall 2013
 SONOMA STATE UNIVERSITY DEPARTMENT OF BIOLOGY BIOLOGY 344: CELL BIOLOGY Fall 2013 Instructor Murali C. Pillai, PhD Office 214 Darwin Hall Telephone (707) 664-2981 E-mail pillai@sonoma.edu Website www.sonoma.edu/users/p/pillai
Supporting Information
 Supporting Information He et al. 10.1073/pnas.1116302108 SI Methods Cell Culture. Mouse J774A.1 and RAW 264.7 macrophages were obtained from ATCC and were cultured in MEM supplemented with 10% FS (Sigma)
Supplementary Materials for
 advances.sciencemag.org/cgi/content/full/4/9/eaat5401/dc1 Supplementary Materials for GLK-IKKβ signaling induces dimerization and translocation of the AhR-RORγt complex in IL-17A induction and autoimmune
Supplementary Figure S1. Immunodetection of full-length XA21 and the XA21 C-terminal cleavage product.
 Supplementary Information Supplementary Figure S1. Immunodetection of full-length XA21 and the XA21 C-terminal cleavage product. Total protein extracted from Kitaake wild type and rice plants carrying
Supplemental Figure 1: GB-induced cell death is ROS-dependent. (a-b) K562 cells pre-incubated or not with NAC for 1h were treated with a sublytic
 K562 cells pre-incubated or not with NAC for 1h were treated with a sublytic") Supplemental Figure 1: GB-induced cell death is ROS-dependent. (a-b) K562 cells pre-incubated or not with NAC for 1h were treated with a sublytic dose of P +/- GB. ROS production (a) and cell death (b)
Supplemental Figure 1: GB-induced cell death is ROS-dependent. (a-b) K562 cells pre-incubated or not with NAC for 1h were treated with a sublytic dose of P +/- GB. ROS production (a) and cell death (b)
Albumin. MMP-9 (tertiary granules) Lactoferrin. MPO (U/ml) ctrl PMN-sec
 Lactoferrin. MPO (U/ml) ctrl PMN-sec") Figure S1: Antibody cross-linking of CD18 induces release of primary, secondary, and tertiary granules as well as secretory vesicles. Freshly isolated PMN were incubated with primary anti-cd18 mab IB4
Figure S1: Antibody cross-linking of CD18 induces release of primary, secondary, and tertiary granules as well as secretory vesicles. Freshly isolated PMN were incubated with primary anti-cd18 mab IB4
APOPTOSIS. Monitor programmed cell death from membrane to nucleus
 APOPTOSIS Monitor programmed cell death from membrane to nucleus INTRINSIC. EXTRINSIC. SIMPLISTIC. Convenient Solutions for Complete Analysis of Apoptosis and Cell Fate Of the three major established programmed
Supplementary Figure 1. Additional RNAi screen data
 Supplementary Figure 1. Additional RNAi screen data A. Cisplatin induced ATR autophosphorylation. Western blot illustrating ATR and phospho-atr (T1989) in cells exposed to 1 µm cisplatin for 24 hours prior
Cell proliferation was measured with Cell Counting Kit-8 (Dojindo Laboratories, Kumamoto, Japan).
.") 1 2 3 4 5 6 7 8 Supplemental Materials and Methods Cell proliferation assay Cell proliferation was measured with Cell Counting Kit-8 (Dojindo Laboratories, Kumamoto, Japan). GCs were plated at 96-well
1 2 3 4 5 6 7 8 Supplemental Materials and Methods Cell proliferation assay Cell proliferation was measured with Cell Counting Kit-8 (Dojindo Laboratories, Kumamoto, Japan). GCs were plated at 96-well
SUPPLEMENTAL EXPERIMENTAL PROCEDURES
 SUPPLEMENTAL EXPERIMENTAL PROCEDURES Luciferase Assays Cells were seeded on 24well plates and grown to 7% confluency. Cells were then transfected with ng of reporter constructs and 1 ng of the renilla
Supplementary Fig. 1. Multiple five micron sections of liver tissues of rats treated
 Supplementary Figure Legends Supplementary Fig. 1. Multiple five micron sections of liver tissues of rats treated with either vehicle (left; n=3) or CCl 4 (right; n=3) were co-immunostained for NRP-1 (green)
Supplementary Fig. 1 Proteomic analysis of ATR-interacting proteins. ATR, ARID1A and
 Supplementary Figure Legend: Supplementary Fig. 1 Proteomic analysis of ATR-interacting proteins. ATR, ARID1A and ATRIP protein peptides identified from our mass spectrum analysis were shown. Supplementary
Supplemental Table 1 Primers used in study. Human. Mouse
 Supplemental Table 1 Primers used in study Human Forward primer region(5-3 ) Reverse primer region(5-3 ) RT-PCR GAPDH gagtcaacggatttggtcgt ttgattttggagggatctcg Raftlin atgggttgcggattgaacaagttaga ctgaggtataacaccaacgaatttcaggc
Supplementary Figure 1. Expressions of stem cell markers decreased in TRCs on 2D plastic. TRCs were cultured on plastic for 1, 3, 5, or 7 days,
 Supplementary Figure 1. Expressions of stem cell markers decreased in TRCs on 2D plastic. TRCs were cultured on plastic for 1, 3, 5, or 7 days, respectively, and their mrnas were quantified by real time
Supplementary Fig S1: Bone marrow macrophages and liver Kupffer cells increase IL-1 in response to adenosine signaling. (a) Murine bone marrow
 Murine bone marrow") Supplementary Fig S1: Bone marrow macrophages and liver Kupffer cells increase IL-1 in response to adenosine signaling. (a) Murine bone marrow derived macrophages (BMDM) were primed with LPS for 16 hrs,
Supplementary Fig S1: Bone marrow macrophages and liver Kupffer cells increase IL-1 in response to adenosine signaling. (a) Murine bone marrow derived macrophages (BMDM) were primed with LPS for 16 hrs,
Surface Toll-like receptor 3 expression in metastatic intestinal epithelial cells induces inflammatory cytokine production and promotes invasiveness
 ARTICLE cro Author s Choice Surface Toll-like receptor 3 expression in metastatic intestinal epithelial cells induces inflammatory cytokine production and promotes invasiveness Received for publication,
Supplementary Figure 1, Wiel et al
 Supplementary Figure 1, Wiel et al Supplementary Figure 1 ITPR2 increases in benign tumors and decreases in aggressive ones (a-b) According to the Oncomine database, expression of ITPR2 increases in renal
Genetic screening for synthetic lethal partners of polynucleotide kinase/phosphatase: potential for targeting SHP-1 depleted cancers
 Genetic screening for synthetic lethal partners of polynucleotide kinase/phosphatase: potential for targeting SHP-1 depleted cancers T.R. Mereniuk et al. Supplemental tlmt Material: il Supplemental l Figures
Supplementary Fig. 1 Kinetics of appearence of the faster migrating form of Bcl-10.
 α-cd3 + α-cd28: Time (min): + + + + + + + + + 0 5 15 30 60 120 180 240 300 360 360 n.s. Supplementary Fig. 1 Kinetics of appearence of the faster migrating form of. Immunoblot of lysates from Jurkat cells
SUPPLEMENTARY INFORMATION. Small molecule activation of the TRAIL receptor DR5 in human cancer cells
 SUPPLEMENTARY INFORMATION Small molecule activation of the TRAIL receptor DR5 in human cancer cells Gelin Wang 1*, Xiaoming Wang 2, Hong Yu 1, Shuguang Wei 1, Noelle Williams 1, Daniel L. Holmes 1, Randal
Mammosphere formation assay. Mammosphere culture was performed as previously described (13,
 Supplemental Text Materials and Methods Mammosphere formation assay. Mammosphere culture was performed as previously described (13, 17). For co-culture with fibroblasts and treatment with CM or CCL2, fibroblasts
HCT116 SW48 Nutlin: p53
 Figure S HCT6 SW8 Nutlin: - + - + p GAPDH Figure S. Nutlin- treatment induces p protein. HCT6 and SW8 cells were left untreated or treated for 8 hr with Nutlin- ( µm) to up-regulate p. Whole cell lysates
Supplementary Figure S1. N-terminal fragments of LRRK1 bind to Grb2.
 Myc- HA-Grb2 Mr(K) 105 IP HA 75 25 105 1-1163 1-595 - + - + - + 1164-1989 Blot Myc HA total lysate 75 25 Myc HA Supplementary Figure S1. N-terminal fragments of bind to Grb2. COS7 cells were cotransfected
T H E J O U R N A L O F C E L L B I O L O G Y
 T H E J O U R N A L O F C E L L B I O L O G Y Supplemental material Rainero et al., http://www.jcb.org/cgi/content/full/jcb.201109112/dc1 Figure S1. The expression of DGK- is reduced upon transfection
Small-Molecule Drug Target Identification/Deconvolution Technologies
 Small-Molecule Drug Target Identification/Deconvolution Technologies Case-Studies Shantani Target ID Technology Tool Box Target Deconvolution is not Trivial = A single Tool / Technology May Not necessarily
 Figure S1: NIK-deficient cells resist to Tweak/TNFα-induced cell death (a) Two independent clones of NIK WT and NIK KO MEFs were treated for 24 hours with Tweak (200 ng/ml) and TNFα (200 U/ml) and cell
ASPP1 Fw GGTTGGGAATCCACGTGTTG ASPP1 Rv GCCATATCTTGGAGCTCTGAGAG
 Supplemental Materials and Methods Plasmids: the following plasmids were used in the supplementary data: pwzl-myc- Lats2 (Aylon et al, 2006), pretrosuper-vector and pretrosuper-shp53 (generous gift of
IGF-1 promotes the development and cytotoxic activity of human NK cells regulated
 Supplementary Information for IGF-1 promotes the development and cytotoxic activity of human NK cells regulated by mir-483-3p Fang Ni 1, 2, Rui Sun 1, Binqing Fu 1, Fuyan Wang 1, Chuang Guo 1, Zhigang
Post-translational modification
 Protein expression Western blotting, is a widely used and accepted technique to detect levels of protein expression in a cell or tissue extract. This technique measures protein levels in a biological sample
Supporting Information
 Supporting Information Chakrabarty et al. 10.1073/pnas.1018001108 SI Materials and Methods Cell Lines. All cell lines were purchased from the American Type Culture Collection. Media and FBS were purchased
Nature Immunology: doi: /ni.3015
 Supplementary Figure 1 Role of RIP1-RIP3 and PGAM5 in RNA virus induced inflammasome activation. (a) LDH release from LPS-primed BMDMs from wild-type mice (WT), Rip3 -/- or Nlrp3 -/- mice infected with
SUPPLEMENTARY INFORMATION
 DOI: 10.1038/ncb3164 Supplementary Figure 1 Validation of effective Gnas deletion and epithelial thickness. a, Representative genotyping in mice treated or not with tamoxifen to show Gnas deletion. To
Supplemental Figure 1: CIP2A and SET levels are increased in some. primary human pancreatic cancer samples. (A) CIP2A mrna levels were
 CIP2A mrna levels were") Supplemental Figure Legends and Figures: Supplemental Figure 1: CIP2A and SET levels are increased in some primary human pancreatic cancer samples. (A) CIP2A mrna levels were measured in 3 benign (non-cancer)
Supplemental Figure Legends and Figures: Supplemental Figure 1: CIP2A and SET levels are increased in some primary human pancreatic cancer samples. (A) CIP2A mrna levels were measured in 3 benign (non-cancer)
Supplementary Information
 Supplementary Information Figure S1. Transiently overexpressed ECFP-TIAF1/EYFP-TIAF1 causes apoptosis of Mv1Lu cells. Mv1Lu cells were transfected by electroporation with ECFP, EYFP, ECFP-TIAF1, EYFP-
TE5 KYSE510 TE7 KYSE70 KYSE140
 TE5 KYSE5 TT KYSE7 KYSE4 Supplementary Figure. Hockey stick plots showing input normalized, rank ordered H3K7ac signals for the candidate SE-associated lncrnas in this study. Rpm Rpm Rpm Chip-seq H3K7ac
Nature Structural & Molecular Biology: doi: /nsmb.3308
 Supplementary Figure 1 Analysis of CED-3 autoactivation and CED-4-induced CED-3 activation. (a) Repeat experiments of Fig. 1a. (b) Repeat experiments of Fig. 1b. (c) Quantitative analysis of three independent
Thyroid peroxidase gene expression is induced by lipopolysaccharide involving Nuclear Factor (NF)-κB p65 subunit phosphorylation
-κB p65 subunit phosphorylation") 1 2 3 4 5 SUPPLEMENTAL DATA Thyroid peroxidase gene expression is induced by lipopolysaccharide involving Nuclear Factor (NF)-κB p65 subunit phosphorylation Magalí Nazar, Juan Pablo Nicola, María Laura
1 2 3 4 5 SUPPLEMENTAL DATA Thyroid peroxidase gene expression is induced by lipopolysaccharide involving Nuclear Factor (NF)-κB p65 subunit phosphorylation Magalí Nazar, Juan Pablo Nicola, María Laura
Stargazin regulates AMPA receptor trafficking through adaptor protein. complexes during long term depression
 Supplementary Information Stargazin regulates AMPA receptor trafficking through adaptor protein complexes during long term depression Shinji Matsuda, Wataru Kakegawa, Timotheus Budisantoso, Toshihiro Nomura,
Supplementary Fig. 1. (A) Working model. The pluripotency transcription factor OCT4
 Working model. The pluripotency transcription factor OCT4") SUPPLEMENTARY FIGURE LEGENDS Supplementary Fig. 1. (A) Working model. The pluripotency transcription factor OCT4 directly up-regulates the expression of NIPP1 and CCNF that together inhibit protein phosphatase
SUPPLEMENTARY FIGURE LEGENDS Supplementary Fig. 1. (A) Working model. The pluripotency transcription factor OCT4 directly up-regulates the expression of NIPP1 and CCNF that together inhibit protein phosphatase
SUPPLEMENTARY INFORMATION
 (Supplementary Methods and Materials) GST pull-down assay GST-fusion proteins Fe65 365-533, and Fe65 538-700 were expressed in BL21 bacterial cells and purified with glutathione-agarose beads (Sigma).
b alternative classical none
 Supplementary Figure. 1: Related to Figure.1 a d e b alternative classical none NIK P-IkBa Total IkBa Tubulin P52 (Lighter) P52 (Darker) RelB (Lighter) RelB (Darker) HDAC1 Control-Sh RelB-Sh NF-kB2-Sh
Supplementary Figure 1. TRIM9 does not affect AP-1, NF-AT or ISRE activity. (a,b) At 24h post-transfection with TRIM9 or vector and indicated
 At 24h post-transfection with TRIM9 or vector and indicated") Supplementary Figure 1. TRIM9 does not affect AP-1, NF-AT or ISRE activity. (a,b) At 24h post-transfection with TRIM9 or vector and indicated reporter luciferase constructs, HEK293T cells were stimulated
Supplementary Figure 1. TRIM9 does not affect AP-1, NF-AT or ISRE activity. (a,b) At 24h post-transfection with TRIM9 or vector and indicated reporter luciferase constructs, HEK293T cells were stimulated
Utility of the dual-specificity protein kinase TTK as a therapeutic target
 Utility of the dual-specificity protein kinase TTK as a therapeutic target for intrahepatic spread of liver cancer Ruoyu Miao, 1,2* Yan Wu, 2* Haohai Zhang, 1 Huandi Zhou, 3 Xiaofeng Sun, 2 Eva Csizmadia,
Quantitative real-time RT-PCR analysis of the expression levels of E-cadherin
 Supplementary Information 1 Quantitative real-time RT-PCR analysis of the expression levels of E-cadherin and ribosomal protein L19 (RPL19) mrna in cleft and bud epithelial cells of embryonic salivary
Revision Checklist for Science Signaling Research Manuscripts: Data Requirements and Style Guidelines
 Revision Checklist for Science Signaling Research Manuscripts: Data Requirements and Style Guidelines Further information can be found at: http://stke.sciencemag.org/sites/default/files/researcharticlerevmsinstructions_0.pdf.
Supplementary Figure 1. (a) The qrt-pcr for lnc-2, lnc-6 and lnc-7 RNA level in DU145, 22Rv1, wild type HCT116 and HCT116 Dicer ex5 cells transfected
 The qrt-pcr for lnc-2, lnc-6 and lnc-7 RNA level in DU145, 22Rv1, wild type HCT116 and HCT116 Dicer ex5 cells transfected") Supplementary Figure 1. (a) The qrt-pcr for lnc-2, lnc-6 and lnc-7 RNA level in DU145, 22Rv1, wild type HCT116 and HCT116 Dicer ex5 cells transfected with the sirna against lnc-2, lnc-6, lnc-7, and the
Supplementary Figure 1. (a) The qrt-pcr for lnc-2, lnc-6 and lnc-7 RNA level in DU145, 22Rv1, wild type HCT116 and HCT116 Dicer ex5 cells transfected with the sirna against lnc-2, lnc-6, lnc-7, and the
Supplementary Materials for
 www.sciencesignaling.org/cgi/content/full/6/282/ra53/dc1 Supplementary Materials for Estrogen Alters the Splicing of Type 1 Corticotropin-Releasing Hormone Receptor in Breast Cancer Cells Suchita Lal,
SUPPLEMENTARY INFORMATION
 DOI: 10.1038/ncb2386 Figure 1 Src-containing puncta are not focal adhesions, podosomes or endosomes. (a) FAK-/- were stained with anti-py416 Src (green) and either (in red) the focal adhesion protein paxillin,
Technical Bulletin. Multiple Methods for Detecting Apoptosis on the BD Accuri C6 Flow Cytometer. Introduction
 March 212 Multiple Methods for Detecting Apoptosis on the BD Accuri C6 Flow Cytometer Contents 1 Introduction 2 Annexin V 4 JC-1 5 Caspase-3 6 APO-BrdU and APO-Direct Introduction Apoptosis (programmed
Nature Medicine: doi: /nm.4464
 Supplementary Fig. 1. Amino acid transporters and substrates used for selectivity screening. (A) Common transporters and amino acid substrates shown. Amino acids designated by one-letter codes. Transporters
B. ADM: C. D. Apoptosis: 1.68% 2.99% 1.31% Figure.S1,Li et al. number. invaded cells. HuH7 BxPC-3 DLD-1.
 A. - Figure.S1,Li et al. B. : - + - + - + E-cadherin CK19 α-sma vimentin β -actin C. D. Apoptosis: 1.68% 2.99% 1.31% - : - + - + - + Apoptosis: 48.33% 45.32% 44.59% E. invaded cells number 400 300 200
Supplementary Fig. 1 related to Fig. 1 Clinical relevance of lncrna candidate
 Supplementary Figure Legends Supplementary Fig. 1 related to Fig. 1 Clinical relevance of lncrna candidate BC041951 in gastric cancer. (A) The flow chart for selected candidate lncrnas in 660 up-regulated
Fig. S1. Effect of p120-catenin overexpression on the interaction of SCUBE2 with E-cadherin. The expression plasmid encoding FLAG.
 Fig. S1. Effect of p120-catenin overexpression on the interaction of SCUBE2 with E-cadherin. The expression plasmid encoding FLAG.SCUBE2, E-cadherin.Myc, or HA.p120-catenin was transfected in a combination
Supplementary Fig S1 Nutlin-3a treatment does not affect cell cycle progression in the absence
 Supplementary Figure Legends Supplementary Fig S1 Nutlin-3a treatment does not affect cell cycle progression in the absence of p53 or p21. HCT116 cells which were null for either p53 (A) or p21 (B) were
Figure S1. Specificity of polyclonal anti stabilin-1 and anti stabilin-2 antibodies Lysates of 293T cells transfected with empty vector, mouse
 Figure S1. Specificity of polyclonal anti stabilin-1 and anti stabilin-2 antibodies Lysates of 293T cells transfected with empty vector, mouse stabilin-1, or mouse stabilin-2 were immunoblotted using anti
Supplementary Figure 1 Pfn1, but not other Pfn isoforms are expressed in
 Supplementary Figure 1 Pfn1, but not other Pfn isoforms are expressed in platelets. (a) RT-PCR of Pfn isoforms in control mouse platelets, Pfn1 -/- platelets and control heart. Expected band size for Pfn1
Mitochondria/Cytosol Fractionation Kit
 Mitochondria/Cytosol Fractionation Kit Sufficient for analysis of 50 samples Cat. No. MIT1000 FOR RESEARCH USE ONLY Not for use in diagnostic procedures. USA & Canada Phone: +1(800) 437-7500 Fax: +1 (951)
At E17.5, the embryos were rinsed in phosphate-buffered saline (PBS) and immersed in
 and immersed in") Supplementary Materials and Methods Barrier function assays At E17.5, the embryos were rinsed in phosphate-buffered saline (PBS) and immersed in acidic X-gal mix (100 mm phosphate buffer at ph4.3, 3 mm
Supplementary Materials and Methods Barrier function assays At E17.5, the embryos were rinsed in phosphate-buffered saline (PBS) and immersed in acidic X-gal mix (100 mm phosphate buffer at ph4.3, 3 mm
Supporting Information
 Supporting Information Stavru et al. 0.073/pnas.357840 SI Materials and Methods Immunofluorescence. For immunofluorescence, cells were fixed for 0 min in 4% (wt/vol) paraformaldehyde (Electron Microscopy
Supplementary Figure 1 Validate the expression of mir-302b after bacterial infection by northern
 Supplementary Figure 1 Validate the expression of mir-302b after bacterial infection by northern blot. Northern blot analysis of mir-302b expression following infection with PAO1, PAK and Kp in (A) lung
Reagents and cell culture Mcl-1 gene expression: real-time quantitative RT-PCR In vitro PP2A phosphatase assay Detection of Mcl-1 in vivo
 Reagents and cell culture Antibodies specific for caspase 3, PARP and GAPDH were purchased from Cell Signaling Technology Inc. (Beverly, MA). Caspase inhibitor z-vad-fmk and ROS scavenger N-acetyl-Lcysteine
VCP adaptor interactions are exceptionally dynamic and subject to differential modulation by a VCP inhibitor
 VCP adaptor interactions are exceptionally dynamic and subject to differential modulation by a VCP inhibitor Liang Xue 1, Emily E. Blythe 1, Elyse C. Freiberger 2, Jennifer Mamrosh 1, Alexander S. Hebert
Figure 1: TDP-43 is subject to lysine acetylation within the RNA-binding domain a) QBI-293 cells were transfected with TDP-43 in the presence or
 QBI-293 cells were transfected with TDP-43 in the presence or") Figure 1: TDP-43 is subject to lysine acetylation within the RNA-binding domain a) QBI-293 cells were transfected with TDP-43 in the presence or absence of the acetyltransferase CBP and acetylated TDP-43
Figure 1: TDP-43 is subject to lysine acetylation within the RNA-binding domain a) QBI-293 cells were transfected with TDP-43 in the presence or absence of the acetyltransferase CBP and acetylated TDP-43
Supplementary Figure 1. The Hsp70 acetylation level is related to the co-chaperone binding of Hsp70 under various stress conditions.
 Supplementary Figure 1. The Hsp70 acetylation level is related to the co-chaperone binding of Hsp70 under various stress conditions. 1 (a) Etoposide treatment gradually changes acetylation level and co-chaperone