b alternative classical none
|
|
|
- Abner Greene
- 5 years ago
- Views:
Transcription


 + RelB cdna (Sh-RNA resistant)")


1 Supplementary Figure. 1: Related to Figure.1 a d e b alternative classical none NIK P-IkBa Total IkBa Tubulin P52 (Lighter) P52 (Darker) RelB (Lighter) RelB (Darker) HDAC1 Control-Sh RelB-Sh NF-kB2-Sh U6 Promoter U6 Promoter KMS11 RPMI-8226 KMS-28PE RelB-Sh RelB-Sh EJM KMS-18 OCIMY5 KMS-26 KMS-12PE H929 KMS-28BM plko.1 Vector RelB-Sh (3 UTR specific) plko.1 Vector RelB-Sh (3 UTR specific) + RelB cdna (Sh-RNA resistant) Ubiquitin Promoter UTMC2 kda RelB-cDNA Whole cell nuclear RPMI-8226 JJN3 WPRE f Relative Expression c Number of Colonies Control-Sh RPMI-8226 Control-Sh h RelB-Sh NF-kB2-Sh Endogenous RelB RelB-Sh RelB-Sh + RelB cdna kda Control-Sh RelB-Sh Relative Expression g Control-Sh RelB-Sh + RelB cdna H929 RelB-Sh Control-Sh NF-kB2-Sh Exogenous RelB RelB-Sh RelB-Sh + RelB cdna RelB Tubulin


2 Supplementary Figure. 1: Related to Figure.1 i NHL Cell Lines Control-Sh RelB-Sh BJAB HBL1 Propidium Iodide LY10 Annexin-V
3 Supplementary Fig. 1. RelB-p52 addiction in MM. (a) JJN3 cells were infected with lentiviruses expressing control-sh RNA or two different sh-rnas targeting RelB or NF-kB2. 5 days later apoptosis was measured by flow-cytometry upon staining with 7AAD and Annexin-V. (b) Whole cell lysates and nuclear extracts from MM cell lines belonging to three distinct groups with regards to mutations that activate alternative NF-kB pathway (by NIK stabilization) or activate the classical NF-kB pathway as indicated by phohspho-ikba and the third group with no mutations that activate alternative or classical pathways, were analyzed for the indicated proteins by immunoblotting. Note the reduced but visible levels of nuclear RelB and p52 in the absence of active NIK or active IKK in the third group of cell lines. (c) RPMI-8226 and H929 cells were infected with the indicated viruses and equal numbers (2000) of cells were seeded into semi-solid methyl-cellulose cultures. 10 days later colony numbers were counted and plotted as indicated and (d) on day 10 colony pictures were taken using a Axiovert S100TV microscope (Zeiss) and presented as indicated. Note the highly impaired colony formation by MM progenitor cells in the absence of RelB or NF-kB2. (e) Schematic representation of plko.1 vector expressing sh-rna targeting 3 UTR of RelB mrna and plko.1 vector simultaneously expressing RelB 3 UTR specific Sh-RNA and RelB cdna (resistant to RelB-sh RNA) under the control of ubiquitin promoter and WPRE regulatory elements. (f & g) Total RNA from JJN3 cells infected with lentiviruses expressing control-sh RNA, or RelB-Sh RNA (targeting 3 UTR) and RelB-Sh RNA (targeting 3 UTR) + RelB cdna, was purified and the levels of endogenous and exogenous RelB were analyzed by quantitative PCR using primers specific to 3 UTR and RelB cdna. Relative expression was plotted as indicated. (h) Whole cell lysates from JJN3 cells infected with the indicated lentiviruses were analyzed for the indicated proteins by immunoblotting. (i) Indicated NHL cell lines were infected with lentiviruses expressing control-sh RNA or Sh-RNA targeting RelB and apoptosis was measured after 5 days by flowcytometry as explained above. Error bars indicate S.D. n=3.

4 Supplementary Figure. 2: Related to Figure. 2 a Anti-Apoptotic b Pro-Apoptotic c survivin 2 Bad p52 Bim-EL Bim-L Bim-S BMF Tubilin Control-Sh NF-kB2-Sh2 kda Relative Expression 3 Bcl-W Bcl Bcl-xl Relative Expression 2.4 BOK Bid Bak Noxa d RelB p52 Bim-EL BMF Tubulin RelB p52 Bim-EL BMF Tubulin e Control-Sh RelB-Sh 1 RelB-Sh 2 RelB Bim-EL Tubulin Control-Sh RelB-Sh NF-kB2-Sh kda kda KMM1 H929 OPM-1

5 Supplementary Figure. 2 continued: Related to Figure. 2 f Bim 2.5kb promoter with NF-kB binding sites at to -1332, to -1237, to and -180 to -166 respectively. 5 TCCGTACGGCAAGACAAGGCGCGGA ACGGCAAGGCCCCTT GCGGGATGTTCCATT CCTCCCACACCCCCGCT GGTGAGCGGGAGGCTAGGGTACACTTCGGGGTGGGGGATGGGCGCGCACATGGCCGCCA GCAGGCAGAGTTACTCCGGTAAACACGCCAGGGACGGCGGCGCGCGCGGGAGGCAACCC AGCGGGGCAACCCCCGCCTTTACCTGTCCGAGCCTG AGTGATTGGGCGTAGGAGC3 NF-kB recognition site -180 to -166 AGCGGGGCAACCCCCG TCGCCCCGTTGGGGGC g h Relative light units k BMF 2.5kb promoter with NF-kB binding sites at to -1462, -268 to -255, -103 to -90, -27 to -14 respectively. 5 AGGATCACTTGAGCCTGGGAG GGCATTCCAGGGACACCTC CAGGGACTCTCTG CTTGCAATGTTTCCATGGGAAGGTTCGTACATTCGTGACCGTC CCTGGCAGCGGCCCAGCCCGGGACTTGGCGCTCACTCGCCATTGGTCAGTCCTCGGCGTG ACGCGCAGGGCGGGGCCTCATCAGCTGTTTGCGGGATGCCCCGAGCAGGCGTA3 NF-kB recognition site -27 to -14 CGGGATGCCCCG GCCCTACGGGGC Bim Promoter i 45,000 40,000 35,000 30,000 25,000 20,000 15,000 10,000 5,000 0 BMF Bim-EL Bim-L RelB Tubulin Control-Sh Control P = RelB-Sh P = P = * Bim and BMF depleted Control-Sh RelB-Sh Relative light units kda BMF promoter pbabe- Empty l pbabe- RelB+p52 BMF Tubulin FUGW-Control FUGW-BMF j (bp) Bim Promoter Input kda -25 Input % Viable Cells IgG RelB-ChIP m RelB Ab 0 KMS-28BM H929 OPM1 KMM1 FUGW- Control FUGW- BMF
6 Supplementary Fig. 2. Transcriptional-Repression of Bim and BMF by RelB-p52. (a & b) Total RNA from Control or RelB- or NF-kB2 depleted cells was analyzed for the levels of indicated BCL2-family members by quantitative real-time PCR and the relative expression levels were plotted as indicated. (c) Whole cell lysates from Control or NF-kB2-depleted (NF-kB2-Sh2) JJN3 cells were analyzed for the indicated proteins by immunoblotting. (d & e) Whole cell lysates from H929, OPM1 and KMM1 MM cells upon infecting with the indicated lentiviruses were analyzed by immunoblotting for the indicated proteins. (f & g) Schematic representation of the 2.5kb promoters of Bim and BMF genes with potential NF-kB binding sites shown in Red. NF-kB binding sites nearest to the transcriptional start sites were highlighted as indicated. For convenience entire length of 2.5kb sequence is not shown. (h&i) Repression of Bim and BMF promoters by RelB and p52. HEK-293T cells were cotransfected with pgl2-bim-basic (h) or pgl2- BMF-Basic (i) luciferase reporter constructs together with the indicated expression vectors. 36hrs later cell lysates were measured for luciferase activity and relative light units were plotted as indicated. Note significant repression of Bim and BMF promoters by RelBp52. P values in (h) were obtained using student's t-test. (j) Recruitment of RelB to Bim promoter in NIK low (invisible NIK levels) MM cells. RelB recruitment to the Bim promoter in the indicated cell lines was analyzed by ChIP analyses as described in Figures 2 and 4, using control IgG or anti-relb antibodies and specific primers corresponding to Bim promoter (-300 to -146). (k) JJN3 cells were infected with lentiviruses expressing control Sh-RNA or Sh-RNAs targeting Bim and BMF and were selected in puromycin prior to depleting RelB. Whole cell lysates were then analyzed by immunoblotting for the depletion of Bim + BMF and RelB. (l) Whole cell lysates from JJN3 cells infected with the indicated lentiviruses were analyzed for the indicated proteins by immunoblotting. (m) JJN3 cells were infected with the indicated lentiviruses and 5 days later apoptosis was measured by flowcytometry as explained above and % viable cells were plotted as indicated. Error bars in all figures indicate S.D. n=3.
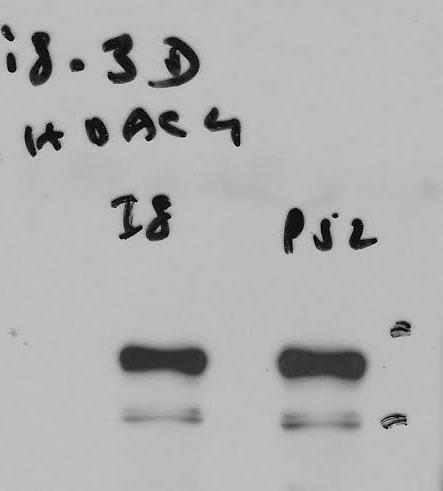
7 Supplementary Figure. 3: Related to Figure 3 JK6L HDAC4 RelB IgG-IP RelB-IP kda IP RelB HDAC4 RelB Input Tubulin Supplementary Fig. 3. RelB interacts with HDAC4. Interaction of endogenous RelB and HDAC4 in JK6L cells was analyzed by immunoprecipitation and immunoblotting as indicated.
 200- Input KMM1 Input IgG HDAC4 Ab HDAC4-ChIP Relative Expression 5 4 3 2 1 0 DMSO BMF TSA Relative Expression 3 2 1 0 DMSO Bim TSA HDAC4 Bim-EL Tubulin KMM1 Control-Sh HDAC4-Sh kda")
8 Supplementary Figure. 4: Related Figure 4. a b c d (bp) 200- Input KMM1 Input IgG HDAC4 Ab HDAC4-ChIP Relative Expression DMSO BMF TSA Relative Expression DMSO Bim TSA HDAC4 Bim-EL Tubulin KMM1 Control-Sh HDAC4-Sh kda e input IgG RelB IgG ChIP RelB RelB-ChIP mir-221 promoter (bp) -300 f Fold induction of Luciferase activity mir-221 promoter pcdna pcdna-relb pcdna-p52 pcdna-relb+p52 g BMF Tubulin Control mir-221 kda -25
9 Supplementary Fig. 4. Regulation of Bim, BMF and mir-221 genes. (a) HDAC4 recruitment to the Bim promoter in KMM1 cells was analyzed by ChIP analysis as described before. (b & c) Levels of BMF and Bim were analyzed by quantitative PCR upon treatment with DMSO or TSA and the relative expression levels were plotted as indicated. (d) Bim levels in KMM1 cells upon depletion of HDAC4 were analyzed by immunoblotting as indicated. (e) Recruitment of RelB to mir-221 promoter. Chromatin from JJN3 cells were immunoprecipitated using a-relb antibody and the immunoprecipitated DNA was PCR-amplified using primers specific to a 310 bp region (-1222 to 911 within the upstream regulatory region of the mir-221 gene. Amplified products were analyzed on agarose gels as indicated. (f) A 2.5kb region upstream to the mir-221 gene was PCR amplified using specific primers and subsequently cloned into pgl2-basic vector upstream to the luciferase gene. KMS28-BM cells were then cotransfected with the pgl2-mir-221-basic vector together with the indicated vectors. Induction of the luciferase activity was plotted as indicated. (g) Whole cell lysates from JJN3 cells infected with control lentivirus or lentivirus expressing exogenous mir-221 were analyzed for BMF levels by immunoblotting as indicated. Error bars indicate S.D. from 3 experiments.
10 Supplementary Figure. 5: Related to Figure 5. a b Propidium Iodide Control-Sh HDAC4-Sh1 HDAC4-Sh2 2.5% 3.66% 1.24% 51.89% 3.84% 55.83% 92% 1.84% 27.5% 19.37% 23.49% 16.85% Number of Colonies KMM1 Number of Colonies 100 H Annexin-V Supplementary Fig. 5. HDAC4 regulates MM cell survival and MM-progenitor cell growth. (A) JJN3 cells were infected with lentiviruses expressing control-sh RNA or two different sh-rnas targeting HDAC4 and apoptosis was measured by flow-cytometry as explained above. (B) KMM1 and H929 cells were were infected with lentiviruses expressing control-sh RNA or sh-rna targeting HDAC4. Cells were washed after 24 hours and equal numbers (2000) of cells were seeded into semi-solid methyl-cellulose cultures. Number of colonies formed by MM progenitor cells were counted on day 10 and plotted as indicated. Error bars indicate S.D. n=3.


11 Supplementary Figure. 6: Related Figure 6. a HDAC4-Flag + + b HDAC4-Flag aa-H4-Flag c + 100aa-H4-Flag + RelB HDAC4-Flag 100aa-H4-Flag RelB HDAC4-Flag 100aa-H4-Flag RelB Tubulin + + kda IP-RelB input b-HA HDAC4-Flag b-HA HDAC4-Flag 100aa-H4-Flag b-HA Tubulin + + kda IP-HA input Bim L Bim S Flag Tubulin Control 100aa-GFP-Flag Control 100aa-H4-Flag kda d %Viability 100aa- GFP-Flag 100aa- H4-Flag e 100aa-H4-Flag Bim-EL BMF HDAC4 RelB Tubulin Control 100aa -H4-Flag kda JJN3 100aa-H4-Flag Bim-EL BMF HDAC4 RelB Tubulin Control 100aa -H4-Flag kda KMS-28BM f Control 100aa-H4-Flag Propidium Iodide ± ±1.7 ± ± ± ± ±0.9 ±2.2 JJN3 g Propidium Iodide Annexin-V Control 100aa-H4-Flag KMS-28BM Annexin-V

12 Supplementary Figure. 6: Related Figure 6. h H929 OPM1 Propidium Iodide Control-Vector aa-H4-Flag Control-Vector 100aa-H4-Flag Annexin-V Supplementary Fig. 6. Specific disruption of RelB-HDAC4 complex by HDAC4-mimeticpolypeptide. (A) HEK-293T cells were cotransfected with pcdna-relb, pcdna-hdac4-flag in the presence or absence of pcdna-100aa-hdac4-flag (100aa-H4-Flag). Interaction of RelB and HDAC4 was analyzed by immunoblotting upon immunoprecipitation of RelB as indicated. Note the sequestration of RelB and disruption of RelB-HDAC4 interaction by the 100aa-H4-peptide. (B). HEK-293T cells were cotransfected with pcdna-hdac4-flag, pcdna-ha b in the presence or absence of 100aa-H4-Flag. Interaction of b with HDAC4 was analyzed by immunoblotting for the indicated proteins upon immunoprecipitation using anti-ha antibody as indicated. (C) KMM1 cells were infected with lentiviruses expressing 100aa-GFP-Flag or 100aa- H4-Flag peptides and the whole cell lysates were analyzed by immunoblotting for the indicated proteins. Note the elevation of Bim levels in 100aa-H4-Flag but not 100aa-GFP-Flag expressing cells. (D) KMM1 cells infected with the indicated lentivirueses were analyzed by flow-cytometry as described above. % viable cells were plotted as indicated. Note that the 100aa-H4-Flag but not 100aa-GFP-Flag peptide induces apoptosis of MM cells. (E) JJN3 and KMS-28BM cells were infected with the indicated lentiviruses. Whole cell lysates (E) and apoptosis (F & G) were analyzed by immunoblotting and flow-cytometry respectively. (H) H929 and OPM1 cells were infected with the indicated lentiviruses and apoptosis was analyzed by flow-cytometry as described. Error bars indicate S.D. n=3.


13 Supplementary Figure. 7: Related Figure 7. a Phospho-RelB Total RelB Tubulin KMS-12PE K12-BM OCI-MY5 H929 JK6L SKMM2 UTMC kda b p-relb Total RelB Bim-EL Bim-L Tubulin Control WT-RelB kda c AR-A01448 mm: 0 5 Phospho-RelB Total RelB Beta-catenin Tubulin kda d U0126 p-relb * RelB * p100 H929 _ + kda e U0126 p-relb * RelB * p-erk KMS-18 U266 L363 KMM _ KMS26 _ + kda f p-erk HDAC1 LDH C N kda p52 p-erk ERK Tubulin Propidium Iodide ERK Tubulin g 7.9 ±0.5 Control-Sh ERK1-Sh-1 ERK1-Sh ± ± ±0.8 Annexin ± ±6.4 ± ±2.1 ± ±10. 4 ± ±2.1
14 Supplementary Fig. 7. (a) ERK1-dependent regulation of RelB in MM cells. Phospho-RelB levels in the indicated cell lines were analyzed by immunoblotting as indicated. (b) Whole cell lysates from control JJN3 and JJN3 cells overexpressing moderate levels of exogenous RelB were analyzed for the indicated proteins by immunoblotting. (c) JJN3 cells were treated with DMSO or GSK3b-specific inhibitor AR-A01448 for 12 hrs and the whole cell lysates were analyzed by immunoblotting as indicated. Note that GSK3b inhibition results in elevation of beta-catenin levels as expected, but does not affect RelBphosphorylation. (d and e) Indicated cell lines were treated with the MEK inhibitor U0126 for 12 hrs. Whole cell lysates were analyzed by immunoblotting for the indicated proteins. Note the normal p100 processing (d) and significant block in RelBphosphorylation upon ERK inhibition (d and e). (f) Nuclear (N) and cytoplasmic (C) extracts from JJN3 cells were analyzed for p-erk levels as indicated. (g) JJN3 cells were infected with lentiviruses expressing control-sh or two different sh-rnas targeting ERK1. Apoptosis was measured after 5 days by flow-cytometry upon staining with propidium iodide and Annexin-V as indicated.


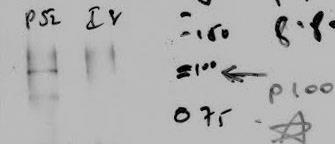
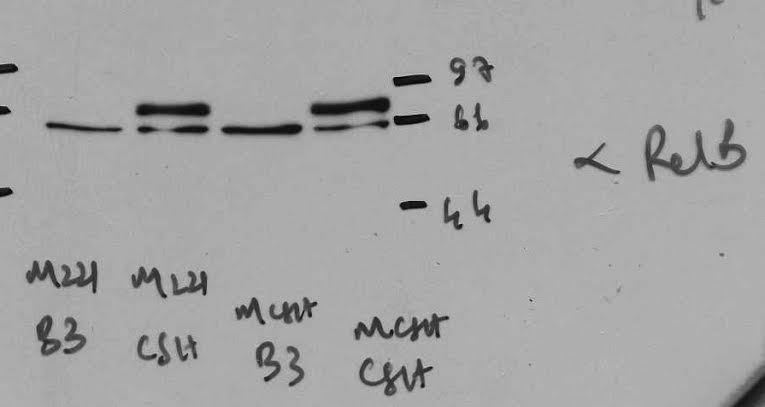
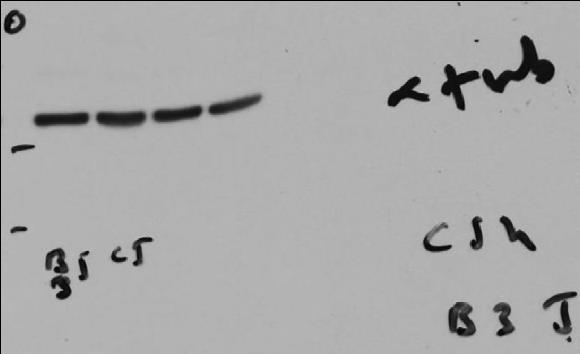
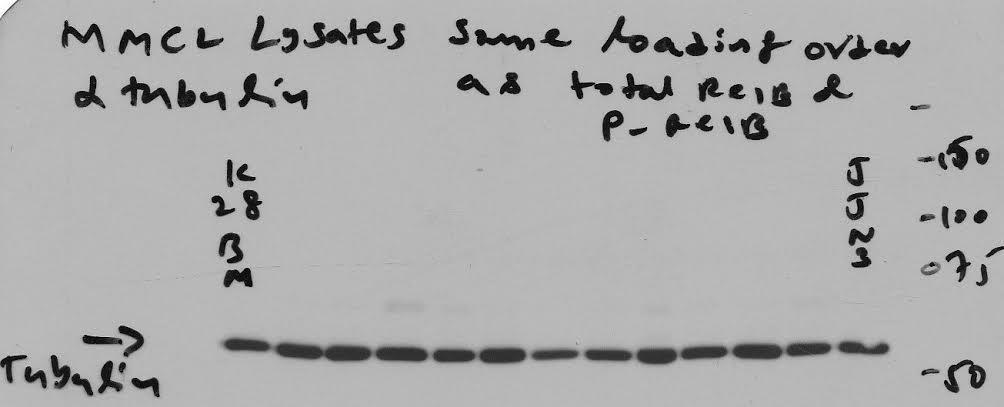
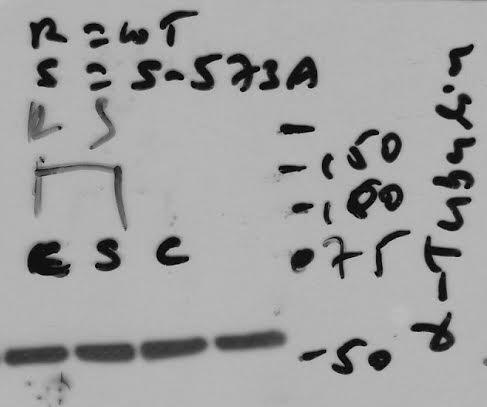
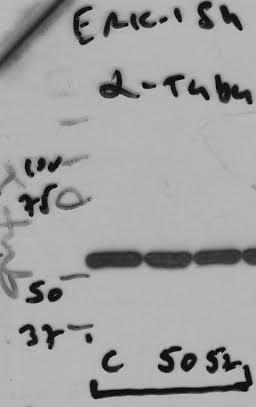
15 Supplementary Fig. 8. Original blots for the main figures were rescanned and were presented below. Fig. 2C RelB lane Fig. 2C p52 lane Fig. 2C p52 lane lighter exposure p100 p52 Fig. 2C Bim


16 Fig. 2C BMF Fig. 2C Tubulin Fig. 2D RelB and tubulin


17 Fig. 2D RelB and Tubulin another exposure Fig. 2D Bim EL another exposure RelB tubulin Fig. 2D Bim EL 25 Fig. 2D Bim L and Bim S Fig. 2D Bim L and Bim S Another exposure 10 RelB Sh control


18 100 bp ladder Fig. 2E RelB Chip Bim Fig. 2E p52 Chip Bim 100 bp ladder bp ladder 100 bp ladder Fig. 2E RelB Chip Bim upstream control primer Fig. 2E p52 Chip Bim upstream control primer

19

20 100 bp ladder


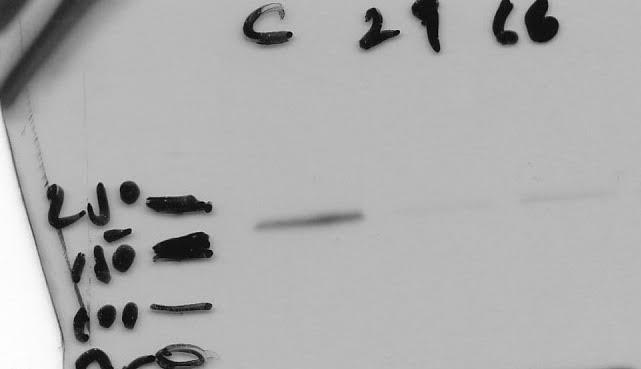
21 Fig. 3A KMM1 IP RelB - IB HDAC4 Fig. 3A KMM1 IP RelB - IB RelB Fig. 3A KMM1 RelB input


22 Fig. 3A KMM1 Tubulin input Fig. 3A KMM1 HDAC4 input


23 Fig. 3A JJN3 IP RelB : IB HDAC4 Fig. 3A JJN3 IP RelB : IB RelB Fig. 3A JJN3 Tubulin input


24 Fig. 3A JJN3 HDAC4 input Fig. 3A JJN3 RelB input


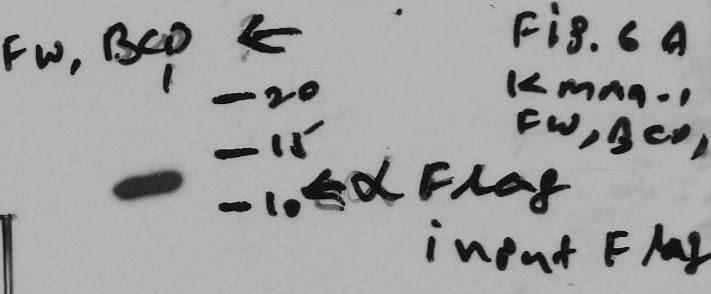
25 Fig. 3B IP: RelB IB: Flag Fig. 3B IP: RelB IB: RelB Fig. 3B Input RelB Fig. 3B IP: RelB IB: RelB. Darker Fig. 3B Input RelB. Darker


26 Fig. 3B Flag input Fig. 3B Tubulin input


27 Fig. 3C IP: Flag IB: RelB Fig. 3C RelB input 250

28 Fig. 3C IP: Flag IB: Flag Fig. 3C Flag Input

29 Fig. 3C Tubulin input


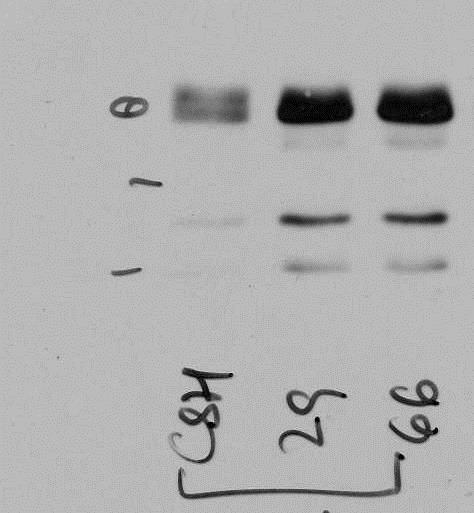
30 Fig. 3D IP: NF-kB2 IB: HDAC Fig. 3D IP: NF-kB2 IB: RelB. 250 Fig. 3D IP: NF-kB2 IB: NF-kB2 (p100).


31 Fig. 3D p100 and p52 input Fig. 3D RelB input Fig. 3D Tubulin input p p52 50
32


33 100bp ladder Fig. 4A Left panel HDAC4 BMF Chip Fig. 4A Right panel Acetyl H3 Chip BMF Promoter 1kb ladder 100 bp ladder positions


34 Fig. 4B Left Panel HDAC4 Chip on Bim promoter 100 bp ladder positoins Fig. 4A and B middle pannels. HDAC4 Chip in RelB-Sh cells for Bim and BMF promoters 1kb ladder 100 bp ladder positions

35 Fig. 4B Right Panel Acetyl H3 Chip on Bim promoter

36 Fig. 4D HDAC4 Fig. 4D HDAC4 Darker.


37 Fig. 4D RelB Fig. 4D RelB Darker Fig. 4D Bim 25 Fig. 4D BMF 20 10


38 Fig. 4D Tubulin 25 Fig. 4F Bim 15 10


39 Fig. 4F BMF Fig. 4F RelB Fig. 4F Tubulin


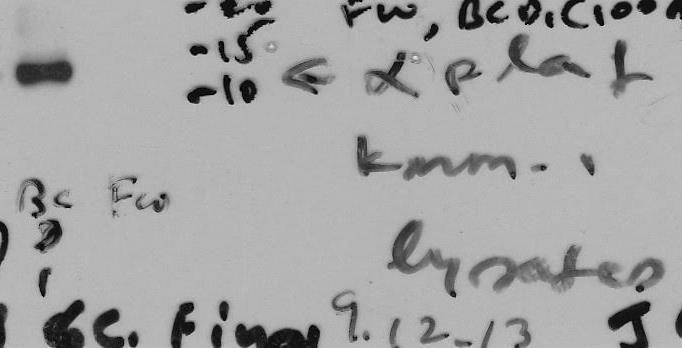
40 Fig. 6a IP: RelB IB: HDAC4 Fig. 6a IP: RelB IB: 100aa H4-flag Fig. 6a IP: RelB IB: RelB Fig. 6a Input Flag 100 AA

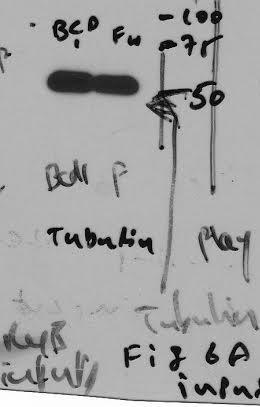
41 Fig. 6a Input HDAC4 Fig. 6a Input Tubulin Fig. 6a Input RelB


42 Fig. 6c Flag 100AA H4 Fig. 6c Bim EL Fig. 6c Bim L and Bim S Fig. 6c BMF


43 Fig. 6c RelB Fig. 6c HDAC4 Fig. 6c Tubulin


44 Fig. 6g RelB Fig. 6g p52 Fig. 6g ciap Fig. 6g Tubulin


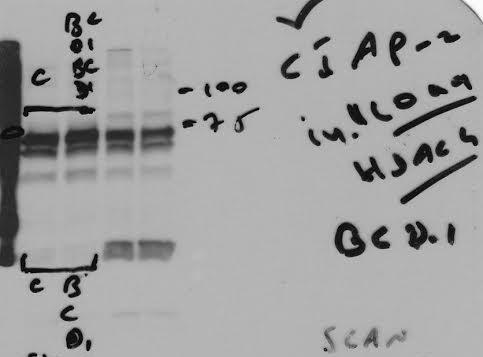
45 Fig. 6h 100aa Flag H4 Fig. 6h Tubulin Fig. 6h p52 Fig. 6h ciap


46 Fig. 7a Phospho RelB Fig. 7a Total RelB Fig. 7a Total RelB Lighter exposure Fig. 7a Tubulin


47 Fig. 7a Tubulin Darker Fig. 7b Phospho RelB Fig. 7b Total RelB Fig. 7b Total RelB Darker


48 Fig. 7c Phospho RelB Fig. 7c Total RelB


49 Fig. 7c HDAC1 Fig. 7c LDH Fig. 7d phospho-relb Chip Bim promoter 100 bp ladder


50 Fig. 7e phospho RelB Fig. 7e Total RelB Fig. 7e Bim EL and BIM L Fig. 7e Tubulin


51 Fig. 7g phospho ERK Fig. 7g phospho RelB


52 Fig. 7g Total ERK and Tubulin Fig. 7g Total RelB


53 Fig. 7h IP RelB IB ERK Fig. 7h IP RelB IB RelB Fig. 7h Tubulin input


54 Fig. 7h RelB input Fig. 7h ERK input


55 Fig. 7i ERK1 KD Fig. 7i Phospho RelB Fig. 7i Total RelB ** ** Nonspecific band

56 Fig. 7i Bim Fig. 7i tubulin


57 Fig. 7k p32 RelB Fig. 7k anti-phospho RelB blot Fig. 7k Flag-RelB and active ERK1 inputs Supplementary Fig. 8. Uncropped immunoblots for the main figures
Supplementary data. sienigma. F-Enigma F-EnigmaSM. a-p53
 Supplementary data Supplemental Figure 1 A sienigma #2 sienigma sicontrol a-enigma - + ++ - - - - - - + ++ - - - - - - ++ B sienigma F-Enigma F-EnigmaSM a-flag HLK3 cells - - - + ++ + ++ - + - + + - -
Supplementary Fig. 1 Proteomic analysis of ATR-interacting proteins. ATR, ARID1A and
 Supplementary Figure Legend: Supplementary Fig. 1 Proteomic analysis of ATR-interacting proteins. ATR, ARID1A and ATRIP protein peptides identified from our mass spectrum analysis were shown. Supplementary
Fig. S1. Effect of p120-catenin overexpression on the interaction of SCUBE2 with E-cadherin. The expression plasmid encoding FLAG.
 Fig. S1. Effect of p120-catenin overexpression on the interaction of SCUBE2 with E-cadherin. The expression plasmid encoding FLAG.SCUBE2, E-cadherin.Myc, or HA.p120-catenin was transfected in a combination
Transcriptional regulation of BRCA1 expression by a metabolic switch: Di, Fernandez, De Siervi, Longo, and Gardner. H3K4Me3
 ChIP H3K4Me3 enrichment.25.2.15.1.5 H3K4Me3 H3K4Me3 ctrl H3K4Me3 + E2 NS + E2 1. kb kb +82 kb Figure S1. Estrogen promotes entry of MCF-7 into the cell cycle but does not significantly change activation-associated
Supplementary Figure 1. GST pull-down analysis of the interaction of GST-cIAP1 (A, B), GSTcIAP1
, GSTcIAP1") Legends Supplementary Figure 1. GST pull-down analysis of the interaction of GST- (A, B), GST mutants (B) or GST- (C) with indicated proteins. A, B, Cell lysate from untransfected HeLa cells were loaded
Legends Supplementary Figure 1. GST pull-down analysis of the interaction of GST- (A, B), GST mutants (B) or GST- (C) with indicated proteins. A, B, Cell lysate from untransfected HeLa cells were loaded
Supplementary Table 1. Sequences for BTG2 and BRCA1 sirnas.
 Supplementary Table 1. Sequences for BTG2 and BRCA1 sirnas. Target Gene Non-target / Control BTG2 BRCA1 NFE2L2 Target Sequence ON-TARGET plus Non-targeting sirna # 1 (Cat# D-001810-01-05) sirna1: GAACCGACAUGCUCCCGGA
SUPPLEMENTARY INFORMATION
 DOI: 10.1038/ncb3209 Supplementary Figure 1 IR induces the association of FH with chromatin. a, U2OS cells synchronized by thymidine double block (2 mm) underwent no release (G1 phase) or release for 2
Cell proliferation was measured with Cell Counting Kit-8 (Dojindo Laboratories, Kumamoto, Japan).
.") 1 2 3 4 5 6 7 8 Supplemental Materials and Methods Cell proliferation assay Cell proliferation was measured with Cell Counting Kit-8 (Dojindo Laboratories, Kumamoto, Japan). GCs were plated at 96-well
1 2 3 4 5 6 7 8 Supplemental Materials and Methods Cell proliferation assay Cell proliferation was measured with Cell Counting Kit-8 (Dojindo Laboratories, Kumamoto, Japan). GCs were plated at 96-well
SUPPLEMENTARY INFORMATION
 DOI: 10.1038/ncb3240 Supplementary Figure 1 GBM cell lines display similar levels of p100 to p52 processing but respond differentially to TWEAK-induced TERT expression according to TERT promoter mutation
Regulation of transcription by the MLL2 complex and MLL complex-associated AKAP95
 Supplementary Information Regulation of transcription by the complex and MLL complex-associated Hao Jiang, Xiangdong Lu, Miho Shimada, Yali Dou, Zhanyun Tang, and Robert G. Roeder Input HeLa NE IP lot:
transcription and the promoter occupancy of Smad proteins. (A) HepG2 cells were co-transfected with the wwp-luc reporter, and FLAG-tagged FHL1,
 HepG2 cells were co-transfected with the wwp-luc reporter, and FLAG-tagged FHL1,") Supplementary Data Supplementary Figure Legends Supplementary Figure 1 FHL-mediated TGFβ-responsive reporter transcription and the promoter occupancy of Smad proteins. (A) HepG2 cells were co-transfected
Supplementary Data Supplementary Figure Legends Supplementary Figure 1 FHL-mediated TGFβ-responsive reporter transcription and the promoter occupancy of Smad proteins. (A) HepG2 cells were co-transfected
Supplementary Fig. 1. Schematic structure of TRAIP and RAP80. The prey line below TRAIP indicates bait and the two lines above RAP80 highlight the
 Supplementary Fig. 1. Schematic structure of TRAIP and RAP80. The prey line below TRAIP indicates bait and the two lines above RAP80 highlight the prey clones identified in the yeast two hybrid screen.
Figure 1: TDP-43 is subject to lysine acetylation within the RNA-binding domain a) QBI-293 cells were transfected with TDP-43 in the presence or
 QBI-293 cells were transfected with TDP-43 in the presence or") Figure 1: TDP-43 is subject to lysine acetylation within the RNA-binding domain a) QBI-293 cells were transfected with TDP-43 in the presence or absence of the acetyltransferase CBP and acetylated TDP-43
Figure 1: TDP-43 is subject to lysine acetylation within the RNA-binding domain a) QBI-293 cells were transfected with TDP-43 in the presence or absence of the acetyltransferase CBP and acetylated TDP-43
Supplementary Figure 1 PARP1 is involved in regulating the stability of mrnas from pro-inflammatory cytokine/chemokine mediators.
 Supplementary Figure 1 PARP1 is involved in regulating the stability of mrnas from pro-inflammatory cytokine/chemokine mediators. (a) A graphic depiction of the approach to determining the stability of
Table S1. Primers used in RT-PCR studies (all in 5 to 3 direction)
") Table S1. Primers used in RT-PCR studies (all in 5 to 3 direction) Epo Fw CTGTATCATGGACCACCTCGG Epo Rw TGAAGCACAGAAGCTCTTCGG Jak2 Fw ATCTGACCTTTCCATCTGGGG Jak2 Rw TGGTTGGGTGGATACCAGATC Stat5A Fw TTACTGAAGATCAAGCTGGGG
Table S1. Primers used in RT-PCR studies (all in 5 to 3 direction) Epo Fw CTGTATCATGGACCACCTCGG Epo Rw TGAAGCACAGAAGCTCTTCGG Jak2 Fw ATCTGACCTTTCCATCTGGGG Jak2 Rw TGGTTGGGTGGATACCAGATC Stat5A Fw TTACTGAAGATCAAGCTGGGG
ASPP1 Fw GGTTGGGAATCCACGTGTTG ASPP1 Rv GCCATATCTTGGAGCTCTGAGAG
 Supplemental Materials and Methods Plasmids: the following plasmids were used in the supplementary data: pwzl-myc- Lats2 (Aylon et al, 2006), pretrosuper-vector and pretrosuper-shp53 (generous gift of
Nature Biotechnology: doi: /nbt Supplementary Figure 1
 Supplementary Figure 1 Schematic and results of screening the combinatorial antibody library for Sox2 replacement activity. A single batch of MEFs were plated and transduced with doxycycline inducible
SUPPLEMENTARY INFORMATION
 doi:.38/nature899 Supplementary Figure Suzuki et al. a c p7 -/- / WT ratio (+)/(-) p7 -/- / WT ratio Log X 3. Fold change by treatment ( (+)/(-)) Log X.5 3-3. -. b Fold change by treatment ( (+)/(-)) 8
SUPPLEMENTARY INFORMATION
 doi:10.1038/nature09732 Supplementary Figure 1: Depletion of Fbw7 results in elevated Mcl-1 abundance. a, Total thymocytes from 8-wk-old Lck-Cre/Fbw7 +/fl (Control) or Lck-Cre/Fbw7 fl/fl (Fbw7 KO) mice
Post-translational modification
 Protein expression Western blotting, is a widely used and accepted technique to detect levels of protein expression in a cell or tissue extract. This technique measures protein levels in a biological sample
Supplementary Materials for
 www.sciencesignaling.org/cgi/content/full/8/404/ra120/dc1 Supplementary Materials for The subcellular localization and activity of cortactin is regulated by acetylation and interaction with Keap1 Akihiro
(a) Immunoblotting to show the migration position of Flag-tagged MAVS
 Immunoblotting to show the migration position of Flag-tagged MAVS") Supplementary Figure 1 Characterization of six MAVS isoforms. (a) Immunoblotting to show the migration position of Flag-tagged MAVS isoforms. HEK293T Mavs -/- cells were transfected with constructs expressing
Supplementary Figure 1 Characterization of six MAVS isoforms. (a) Immunoblotting to show the migration position of Flag-tagged MAVS isoforms. HEK293T Mavs -/- cells were transfected with constructs expressing
Supplementary Figure 1 Phosphorylated tau accumulates in Nrf2 (-/-) mice. Hippocampal tissues obtained from Nrf2 (-/-) (10 months old, 4 male; 2
 mice. Hippocampal tissues obtained from Nrf2 (-/-) (10 months old, 4 male; 2") Supplementary Figure 1 Phosphorylated tau accumulates in Nrf2 (-/-) mice. Hippocampal tissues obtained from Nrf2 (-/-) (10 months old, 4 male; 2 female) or wild-type (5 months old, 1 male; 11 months old,
Supplementary Figure 1 Phosphorylated tau accumulates in Nrf2 (-/-) mice. Hippocampal tissues obtained from Nrf2 (-/-) (10 months old, 4 male; 2 female) or wild-type (5 months old, 1 male; 11 months old,
T H E J O U R N A L O F C E L L B I O L O G Y
 Supplemental material Thompson et al., http://www.jcb.org/cgi/content/full/jcb.200909067/dc1 T H E J O U R N A L O F C E L L B I O L O G Y Figure S1. Modification-specific antibodies do not detect unmodified
Supplementary Table 1. The Q-PCR primer sequence is summarized in the following table.
 Supplementary Table 1. The Q-PCR primer sequence is summarized in the following table. Name Sequence (5-3 ) Application Flag-u ggactacaaggacgacgatgac Shared upstream primer for all the amplifications of
Confocal immunofluorescence microscopy
 Confocal immunofluorescence microscopy HL-6 and cells were cultured and cytospun onto glass slides. The cells were double immunofluorescence stained for Mt NPM1 and fibrillarin (nucleolar marker). Briefly,
Supplementary Figure S1. N-terminal fragments of LRRK1 bind to Grb2.
 Myc- HA-Grb2 Mr(K) 105 IP HA 75 25 105 1-1163 1-595 - + - + - + 1164-1989 Blot Myc HA total lysate 75 25 Myc HA Supplementary Figure S1. N-terminal fragments of bind to Grb2. COS7 cells were cotransfected
 DOI: 10.1038/ncb3259 A Ismail et al. Supplementary Figure 1 B 60000 45000 SSC 30000 15000 Live cells 0 0 15000 30000 45000 60000 FSC- PARR 60000 45000 PARR Width 30000 FSC- 15000 Single cells 0 0 15000
supplementary information
 DOI: 1.138/ncb1839 a b Control 1 2 3 Control 1 2 3 Fbw7 Smad3 1 2 3 4 1 2 3 4 c d IGF-1 IGF-1Rβ IGF-1Rβ-P Control / 1 2 3 4 Real-time RT-PCR Relative quantity (IGF-1/ mrna) 2 1 IGF-1 1 2 3 4 Control /
supplementary information
 DOI: 10.1038/ncb1864 Figure S1 Apak specifically inhibits p53 transcriptional activity. Transcription activity of p53 was measured in U2OS (p53 wild-type) and H1299 (p53 deficient) cells which were transfected
Nature Structural & Molecular Biology: doi: /nsmb.1583
 Acetylation by GCN5 regulates CDC6 phosphorylation in the S-phase of the cell cycle Roberta Paolinelli 1,2, Ramiro Mendoza-Maldonado 2, Anna Cereseto 1 and Mauro Giacca 2 1 Molecular Biology Laboratory,
Electrophoretic Mobility Shift Assay (EMSA). Nuclear extracts were. oligonucleotide spanning the NF-kB site (5 -GATCC-
. Nuclear extracts were. oligonucleotide spanning the NF-kB site (5 -GATCC-") SUPPLEMENTARY MATERIALS AND METHODS Electrophoretic Mobility Shift Assay (EMSA). Nuclear extracts were prepared as previously described. (1) A [ 32 P] datp-labeled doublestranded oligonucleotide spanning
SUPPLEMENTARY MATERIALS AND METHODS Electrophoretic Mobility Shift Assay (EMSA). Nuclear extracts were prepared as previously described. (1) A [ 32 P] datp-labeled doublestranded oligonucleotide spanning
Supplementary Methods Plasmid constructs
 Supplementary Methods Plasmid constructs. Mouse cdna encoding SHP-1, amplified from mrna of RAW264.7 macrophages with primer 5'cgtgcctgcccagacaaactgt3' and 5'cggaattcagacgaatgcccagatcacttcc3', was cloned
SUPPLEMENTARY EXPEMENTAL PROCEDURES
 SUPPLEMENTARY EXPEMENTAL PROCEDURES Plasmids- Total RNAs were extracted from HeLaS3 cells and reverse-transcribed using Superscript III Reverse Transcriptase (Invitrogen) to obtain DNA template for the
Supplementary Figure 1. TRIM9 does not affect AP-1, NF-AT or ISRE activity. (a,b) At 24h post-transfection with TRIM9 or vector and indicated
 At 24h post-transfection with TRIM9 or vector and indicated") Supplementary Figure 1. TRIM9 does not affect AP-1, NF-AT or ISRE activity. (a,b) At 24h post-transfection with TRIM9 or vector and indicated reporter luciferase constructs, HEK293T cells were stimulated
Supplementary Figure 1. TRIM9 does not affect AP-1, NF-AT or ISRE activity. (a,b) At 24h post-transfection with TRIM9 or vector and indicated reporter luciferase constructs, HEK293T cells were stimulated
HPV E6 oncoprotein targets histone methyltransferases for modulating specific. Chih-Hung Hsu, Kai-Lin Peng, Hua-Ci Jhang, Chia-Hui Lin, Shwu-Yuan Wu,
 1 HPV E oncoprotein targets histone methyltransferases for modulating specific gene transcription 3 5 Chih-Hung Hsu, Kai-Lin Peng, Hua-Ci Jhang, Chia-Hui Lin, Shwu-Yuan Wu, Cheng-Ming Chiang, Sheng-Chung
Partial list of differentially expressed genes from cdna microarray, comparing MUC18-
 Supplemental Figure legends Table-1 Partial list of differentially expressed genes from cdna microarray, comparing MUC18- silenced and NT-transduced A375SM cells. Supplemental Figure 1 Effect of MUC-18
Supplementary Figure 1. The Hsp70 acetylation level is related to the co-chaperone binding of Hsp70 under various stress conditions.
 Supplementary Figure 1. The Hsp70 acetylation level is related to the co-chaperone binding of Hsp70 under various stress conditions. 1 (a) Etoposide treatment gradually changes acetylation level and co-chaperone
Supplementary Figure 1
 Supplementary Figure 1 Supplementary Fig. 1 shrna mediated knockdown of ZRSR2 in K562 and 293T cells. (a) ZRSR2 transcript levels in stably transduced K562 cells were determined using qrt-pcr. GAPDH was
SUPPLEMENTARY INFORMATION
 (Supplementary Methods and Materials) GST pull-down assay GST-fusion proteins Fe65 365-533, and Fe65 538-700 were expressed in BL21 bacterial cells and purified with glutathione-agarose beads (Sigma).
Supplementary Materials
 Supplementary Materials Supplementary Figure 1. PKM2 interacts with MLC2 in cytokinesis. a, U87, U87/EGFRvIII, and HeLa cells in cytokinesis were immunostained with DAPI and an anti-pkm2 antibody. Thirty
A RRM1 H2AX DAPI. RRM1 H2AX DAPI Merge. Cont. sirna RRM1
 A H2AX DAPI H2AX DAPI Merge Cont sirna Figure S1: Accumulation of RRM1 at DNA damage sites (A) HeLa cells were subjected to in situ detergent extraction without IR irradiation, and immunostained with the
SUPPLEMENTARY INFORMATION
 SUPPLEMENTARY INFORMATION Dynamic Phosphorylation of HP1 Regulates Mitotic Progression in Human Cells Supplementary Figures Supplementary Figure 1. NDR1 interacts with HP1. (a) Immunoprecipitation using
Supplementary Figure 1: Overexpression of EBV-encoded proteins Western blot analysis of the expression levels of EBV-encoded latency III proteins in
 Supplementary Figure 1: Overexpression of EBV-encoded proteins Western blot analysis of the expression levels of EBV-encoded latency III proteins in BL2 cells. The Ponceau S staining of the membranes or
hours after food deprivation hours after food deprivation
 Figure S.6 protein (fasted / control).2.8.4 p47 p97 Rpt Ufd 3 24 48 hours after food deprivation mrn (fasted / control) C mrn (denervated / control) 2.5 2.5.5 3.5 3 2.5 2.5.5 p97 ** Npl4 Ufd p47 2 3 4
Supplementary Figure S1
 Supplementary Figure S1 Supplementary Figure S1. CD11b expression on different B cell subsets in anti-snrnp Ig Tg mice. (a) Highly purified follicular (FO) and marginal zone (MZ) B cells were sorted from
Supplementary Figure 1 Collision-induced dissociation (CID) mass spectra of peptides from PPK1, PPK2, PPK3 and PPK4 respectively.
 mass spectra of peptides from PPK1, PPK2, PPK3 and PPK4 respectively.") Supplementary Figure 1 lision-induced dissociation (CID) mass spectra of peptides from PPK1, PPK, PPK3 and PPK respectively. % of nuclei with signal / field a 5 c ppif3:gus pppk1:gus 0 35 30 5 0 15 10
Supplementary Figure 1 lision-induced dissociation (CID) mass spectra of peptides from PPK1, PPK, PPK3 and PPK respectively. % of nuclei with signal / field a 5 c ppif3:gus pppk1:gus 0 35 30 5 0 15 10
Gene Forward Primer Reverse Primer GAPDH ATCATCCCTGCCTCTACTGG GTCAGGTCCACCACTGACAC SSB1 AACTTCAGTGAGCCAAACCC GTTCTCAGAGGCTGGAGAGG
 Supplemental Data EXPERIMENTAL PROCEDURES Plasmids and Antibodies- Full length cdna of INT11 or INT12 were cloned into ps- Flag-SBP vector respectively. Anti-RNA pol II (RPB1) was purchased from Santa
supplementary information
 DOI: 10.1038/ncb2116 Figure S1 CDK phosphorylation of EZH2 in cells. (a) Comparison of candidate CDK phosphorylation sites on EZH2 with known CDK substrates by multiple sequence alignments. (b) CDK1 and
Supplemental Figure 1 HDA18 has an HDAC domain and therefore has concentration dependent and TSA inhibited histone deacetylase activity.
 Supplemental Figure 1 HDA18 has an HDAC domain and therefore has concentration dependent and TSA inhibited histone deacetylase activity. (A) Amino acid alignment of HDA5, HDA15 and HDA18. The blue line
Supporting Information
 Supporting Information Su et al. 10.1073/pnas.1211604110 SI Materials and Methods Cell Culture and Plasmids. Tera-1 and Tera-2 cells (ATCC: HTB- 105/106) were maintained in McCoy s 5A medium with 15% FBS
Supplementary Figure 1. TSA (10 nmol/l), non-class-selective HDAC inhibitor, potentiates
, non-class-selective HDAC inhibitor, potentiates") Supplementary Figure 1. TSA (10 nmol/l), non-class-selective HDAC inhibitor, potentiates vascular calcification (VC). (a) Von Kossa staining shows that TSA potentiated the Pi-induced VC. Scale bar, 100
Supplementary Figure 1. TSA (10 nmol/l), non-class-selective HDAC inhibitor, potentiates vascular calcification (VC). (a) Von Kossa staining shows that TSA potentiated the Pi-induced VC. Scale bar, 100
Supplemental Material Igreja and Izaurralde 1. CUP promotes deadenylation and inhibits decapping of mrna targets. Catia Igreja and Elisa Izaurralde
 Supplemental Material Igreja and Izaurralde 1 CUP promotes deadenylation and inhibits decapping of mrna targets Catia Igreja and Elisa Izaurralde Supplemental Materials and methods Functional assays and
1. Primers for PCR to amplify hairpin stem-loop precursor mir-145 plus different flanking sequence from human genomic DNA.
 Supplemental data: 1. Primers for PCR to amplify hairpin stem-loop precursor mir-145 plus different flanking sequence from human genomic DNA. Strategy#1: 20nt at both sides: #1_BglII-Fd primer : 5 -gga
Supplementary Fig. 1 Kinetics of appearence of the faster migrating form of Bcl-10.
 α-cd3 + α-cd28: Time (min): + + + + + + + + + 0 5 15 30 60 120 180 240 300 360 360 n.s. Supplementary Fig. 1 Kinetics of appearence of the faster migrating form of. Immunoblot of lysates from Jurkat cells
Supplementary Fig. 1 Identification of Nedd4 as an IRS-2-associated protein in camp-treated FRTL-5 cells.
 Supplementary Fig. 1 Supplementary Fig. 1 Identification of Nedd4 as an IRS-2-associated protein in camp-treated FRTL-5 cells. (a) FRTL-5 cells were treated with 1 mm dibutyryl camp for 24 h, and the lysates
Estradiol-Estrogen Receptor α Mediates the Expression of the CXXC5 Gene through the Estrogen Response Element-Dependent Signaling Pathway
 Estradiol-Estrogen Receptor α Mediates the Expression of the CXXC5 Gene through the Estrogen Response Element-Dependent Signaling Pathway Pelin Yaşar, Gamze Ayaz and Mesut Muyan SUPPLEMENTARY INFORMATION
Supplementary Figure 1 (related to Figure 1) a. SVEC cells stably expressing egfp tbid 2A BCL xl were analysed by Western blot for expression of egfp
 a. SVEC cells stably expressing egfp tbid 2A BCL xl were analysed by Western blot for expression of egfp") Supplementary Figure 1 (related to Figure 1) a. SVEC cells stably expressing egfp tbid 2A BCL xl were analysed by Western blot for expression of egfp tbid and BCL xl. TOM20 was used as a loading control.
Supplementary Figure 1 (related to Figure 1) a. SVEC cells stably expressing egfp tbid 2A BCL xl were analysed by Western blot for expression of egfp tbid and BCL xl. TOM20 was used as a loading control.
Transcriptional Regulation (Gene Regulation)
") Experimental Techniques in Biomedical Sciences 의생명과학실험기법 Transcriptional Regulation (Gene Regulation) 4/17/13 Jeong Hoon Kim (jeongkim@skku.edu) Department of Health Sciences and Technology, SKKU Graduate
Experimental Techniques in Biomedical Sciences 의생명과학실험기법 Transcriptional Regulation (Gene Regulation) 4/17/13 Jeong Hoon Kim (jeongkim@skku.edu) Department of Health Sciences and Technology, SKKU Graduate
Supplementary Figure 1, related to Figure 1. GAS5 is highly expressed in the cytoplasm of hescs, and positively correlates with pluripotency.
 Supplementary Figure 1, related to Figure 1. GAS5 is highly expressed in the cytoplasm of hescs, and positively correlates with pluripotency. (a) Transfection of different concentration of GAS5-overexpressing
Table 1. Primers, annealing temperatures, and product sizes for PCR amplification.
 Table 1. Primers, annealing temperatures, and product sizes for PCR amplification. Gene Direction Primer sequence (5 3 ) Annealing Temperature Size (bp) BRCA1 Forward TTGCGGGAGGAAAATGGGTAGTTA 50 o C 292
Nature Structural & Molecular Biology: doi: /nsmb Supplementary Figure 1
 Supplementary Figure 1 Endogenous gene tagging to study subcellular localization and chromatin binding. a, b, Schematic of experimental set-up to endogenously tag RNAi factors using the CRISPR Cas9 technology,
Supplementary Figure 1. jmj30-2 and jmj32-1 produce null mutants. (a) Schematic drawing of JMJ30 and JMJ32 genome structure showing regions amplified
 Schematic drawing of JMJ30 and JMJ32 genome structure showing regions amplified") Supplementary Figure 1. jmj30-2 and jmj32-1 produce null mutants. (a) Schematic drawing of JMJ30 and JMJ32 genome structure showing regions amplified by primers used for mrna expression analysis. Gray
Supplementary Figure 1. jmj30-2 and jmj32-1 produce null mutants. (a) Schematic drawing of JMJ30 and JMJ32 genome structure showing regions amplified by primers used for mrna expression analysis. Gray
SUPPLEMENTAL MATERIALS SIRTUIN 1 PROMOTES HYPEROXIA-INDUCED LUNG EPITHELIAL DEATH INDEPENDENT OF NRF2 ACTIVATION
 SUPPLEMENTAL MATERIALS SIRTUIN PROMOTES HYPEROXIA-INDUCED LUNG EPITHELIAL DEATH INDEPENDENT OF NRF ACTIVATION Haranatha R. Potteti*, Subbiah Rajasekaran*, Senthilkumar B. Rajamohan*, Chandramohan R. Tamatam,
Supporting Online Material for
 www.sciencemag.org/cgi/content/full/1154040/dc1 Supporting Online Material for Selective Blockade of MicroRNA Processing by Lin-28 Srinivas R. Viswanathan, George Q. Daley,* Richard I. Gregory* *To whom
Nanog-Luc. R-Luc. 40 HA-Klf Relative protein level of Klf USP21. Vector USP2 USP21 *** *** *** ***
 :Flag Relative protein level of Relative protein level of : Flag Vec 21LV 21SV 2 : HA HA- HA- HA- HA-Klf4 Relative mrna expression Relative protein level of Relative protein level of Relative protein level
Supplementary Figure 1. RAD51 and RAD51 paralogs are enriched spontaneously onto
 Supplementary Figure legends Supplementary Figure 1. and paralogs are enriched spontaneously onto the S-phase chromatin during DN replication. () Chromatin fractionation was carried out as described in
Supplementary figures
 Relative intensity Relative intensity Relative intensity Supplementary figures a None Caffeine None Caffeine c None Caffeine 6 6 6 ISG 6 6 6 UBE1L 6 6 6 UBCH8 6 6 6 EFP 1 1 DOX (h) 1 1 CPT (h) 1 1 UV (h)
SUPPLEMENTARY INFORMATION
 DOI: 10.1038/ncb2271 Supplementary Figure a! WM266.4 mock WM266.4 #7 sirna WM266.4 #10 sirna SKMEL28 mock SKMEL28 #7 sirna SKMEL28 #10 sirna WM1361 mock WM1361 #7 sirna WM1361 #10 sirna 9 WM266. WM136
Khaled_Fig. S MITF TYROSINASE R²= MITF PDE4D R²= Variance from mean mrna expression
 Khaled_Fig. S Variance from mean mrna expression.8 2 MITF.6 TYROSINASE.4 R²=.73.2.8.6.4.2.8.6.4.2.8.6.4.2 MALME3M SKMEL28 UACC257 MITF PDE4D R²=.63 4.5 5 MITF 3.5 4 PDE4B 2.5 3 R²=.2.5 2.5.8.6.4.2.8.6.4.2
Transcriptional regulation of IFN-l genes in Hepatitis C virus-infected hepatocytes via IRF-3 IRF-7 NF- B complex
 POSTER PRESENTATION Transcriptional regulation of IFN-l genes in Hepatitis C virus-infected hepatocytes via IRF-3 IRF-7 NF- B complex Hai-Chon Lee *, Je-In Youn, Kyungwha Lee, Hwanyul Yong, Seung-Yong
Supplementary information
 Supplementary information Supplementary Figure 1 (a) EM image of the pyramidal layer of wt mice. CA3 pyramidal neurons were selected according to their typical alignment, size and shape for subsequent
Supplementary Methods
 Supplementary Methods Reverse transcribed Quantitative PCR. Total RNA was isolated from bone marrow derived macrophages using RNeasy Mini Kit (Qiagen), DNase-treated (Promega RQ1), and reverse transcribed
Supplementary Information: Materials and Methods. Immunoblot and immunoprecipitation. Cells were washed in phosphate buffered
 Supplementary Information: Materials and Methods Immunoblot and immunoprecipitation. Cells were washed in phosphate buffered saline (PBS) and lysed in TNN lysis buffer (50mM Tris at ph 8.0, 120mM NaCl
Supplemental Information. DNp63 Inhibits Oxidative Stress-Induced Cell. Death, Including Ferroptosis, and Cooperates with
 Cell Reports, Volume 21 Supplemental Information DNp63 Inhibits Oxidative Stress-Induced Cell Death, Including Ferroptosis, and Cooperates with the BCL-2 Family to Promote Clonogenic Survival Gary X. Wang,
Supplemental Figure 1 Human REEP family of proteins can be divided into two distinct subfamilies. Residues (single letter amino acid code) identical
 identical") Supplemental Figure Human REEP family of proteins can be divided into two distinct subfamilies. Residues (single letter amino acid code) identical in all six REEPs are highlighted in green. Additional
Supplemental Figure Human REEP family of proteins can be divided into two distinct subfamilies. Residues (single letter amino acid code) identical in all six REEPs are highlighted in green. Additional
Supplemental Table S1. RT-PCR primers used in this study
 Supplemental Table S1. RT-PCR primers used in this study -----------------------------------------------------------------------------------------------------------------------------------------------
Supplementary Information
 Supplementary Information Supplementary Figures Supplementary Figure 1. MLK1-4 phosphorylate MEK in the presence of RAF inhibitors. (a) H157 cells were transiently transfected with Flag- or HA-tagged MLK1-4
Sarker et al. Supplementary Material. Subcellular Fractionation
 Supplementary Material Subcellular Fractionation Transfected 293T cells were harvested with phosphate buffered saline (PBS) and centrifuged at 2000 rpm (500g) for 3 min. The pellet was washed, re-centrifuged
Supplementary Materials for
 www.sciencesignaling.org/cgi/content/full/3/146/ra80/dc1 Supplementary Materials for DNMT1 Stability Is Regulated by Proteins Coordinating Deubiquitination and Acetylation-Driven Ubiquitination Zhanwen
Supplementary information; Mungamuri et al., 2006
 Supplementary information; Mungamuri et al., 6 Antibodies used for western blotting: The following antibodies were used for western blotting: antiser473 Akt (#4), antiakt (#97), antiser9 Gsk 3b (#9336),
Fig. S1 TGF RI inhibitor SB effectively blocks phosphorylation of Smad2 induced by TGF. FET cells were treated with TGF in the presence of
 Fig. S1 TGF RI inhibitor SB525334 effectively blocks phosphorylation of Smad2 induced by TGF. FET cells were treated with TGF in the presence of different concentrations of SB525334. Cells were lysed and
SUPPLEMENTARY INFORMATION
 doi:10.1038/nature11070 Supplementary Figure 1 Purification of FLAG-tagged proteins. a, Purification of FLAG-RNF12 by FLAG-affinity from nuclear extracts of wild-type (WT) and two FLAG- RNF12 transgenic
Supplementary Figure 1 Validate the expression of mir-302b after bacterial infection by northern
 Supplementary Figure 1 Validate the expression of mir-302b after bacterial infection by northern blot. Northern blot analysis of mir-302b expression following infection with PAO1, PAK and Kp in (A) lung
Four different active promoter genes were chosen, ATXN7L2, PSRC1, CELSR2 and
 SUPPLEMENTARY MATERIALS AND METHODS Chromatin Immunoprecipitation for qpcr analysis Four different active promoter genes were chosen, ATXN7L2, PSRC1, CELSR2 and IL24, all located on chromosome 1. Primer
A flag-hausp expression vector was kindly provided by Dr. Wei Gu (Columbia
 Supplementary Materials and Methods Plasmids A flag-hausp expression vector was kindly provided by Dr. Wei Gu (Columbia University). GST-HAUSP (1-212) was generated by PCR amplification of the first 636
T H E J O U R N A L O F C E L L B I O L O G Y
 T H E J O U R N A L O F C E L L B I O L O G Y Supplemental material Han et al., http://www.jcb.org/cgi/content/full/jcb.201311007/dc1 Figure S1. SIVA1 interacts with PCNA. (A) HEK293T cells were transiently
Supplementary Figure 1. α-synuclein is truncated in PD and LBD brains. Nature Structural & Molecular Biology: doi: /nsmb.
 Supplementary Figure 1 α-synuclein is truncated in PD and LBD brains. (a) Specificity of anti-n103 antibody. Anti-N103 antibody was coated on an ELISA plate and different concentrations of full-length
SUPPLEMENTAL FIGURES AND TABLES
 SUPPLEMENTAL FIGURES AND TABLES A B Flag-ALDH1A1 IP: α-ac HEK293T WT 91R 128R 252Q 367R 41/ 419R 435R 495R 412R C Flag-ALDH1A1 NAM IP: HEK293T + + - + D NAM - + + E Relative ALDH1A1 activity 1..8.6.4.2
Supplemental Figure Legends:
 Supplemental Figure Legends: Fig S1. GFP-ABRO1 localization. U2OS cells were infected with retrovirus expressing GFP- ABRO1. The cells were fixed with 3.6% formaldehyde and stained with antibodies against
Supplementary Figure 1. Nur77 and leptin-controlled obesity. (A) (B) (C)
 (B) (C)") Supplementary Figure 1. Nur77 and leptin-controlled obesity. (A) Effect of leptin on body weight and food intake between WT and KO mice at the age of 12 weeks (n=7). Mice were i.c.v. injected with saline
Supplementary Figure 1. Nur77 and leptin-controlled obesity. (A) Effect of leptin on body weight and food intake between WT and KO mice at the age of 12 weeks (n=7). Mice were i.c.v. injected with saline
Description of Supplementary Files. File name: Supplementary Information Description: Supplementary figures and supplementary tables.
 Description of Supplementary Files File name: Supplementary Information Description: Supplementary figures and supplementary tables. File name: Supplementary Data 1 Description: Differential expression
Bcl-2 family member Bcl-G is not a pro-apoptotic BH3-only protein
 Bcl-2 family member Bcl-G is not a pro-apoptotic BH3-only protein Maybelline Giam 1,2, Toru Okamoto 1,2,3, Justine D. Mintern 1,2,4, Andreas Strasser 1,2 and Philippe Bouillet 1, 2 1 The Walter and Eliza
Comparative Analysis of Argonaute-Dependent Small RNA Pathways in Drosophila
 Molecular Cell, Volume 32 Supplemental Data Comparative Analysis of Argonaute-Dependent Small RNA Pathways in Drosophila Rui Zhou, Ikuko Hotta, Ahmet M. Denli, Pengyu Hong, Norbert Perrimon, and Gregory
TITLE: Identification of Androgen Receptor-Regulated Genes in Castration-Recurrent Prostate Cancer
 AD Award Number: W81XWH-11-1-0116 TITLE: Identification of Androgen Receptor-Regulated Genes in Castration-Recurrent Prostate Cancer PRINCIPAL INVESTIGATOR: Irwin H. Gelman, Ph.D. CONTRACTING ORGANIZATION:
Supplemental Fig. 1: PEA-15 knockdown efficiency assessed by immunohistochemistry and qpcr
 Supplemental figure legends Supplemental Fig. 1: PEA-15 knockdown efficiency assessed by immunohistochemistry and qpcr A, LβT2 cells were transfected with either scrambled or PEA-15 sirna. Cells were then
Supplemental Table/Figure Legends
 MiR-26a is required for skeletal muscle differentiation and regeneration in mice Bijan K. Dey, Jeffrey Gagan, Zhen Yan #, Anindya Dutta Supplemental Table/Figure Legends Suppl. Table 1: Effect of overexpression
Engineering splicing factors with designed specificities
 nature methods Engineering splicing factors with designed specificities Yang Wang, Cheom-Gil Cheong, Traci M Tanaka Hall & Zefeng Wang Supplementary figures and text: Supplementary Figure 1 Supplementary
Cytotoxicity of Botulinum Neurotoxins Reveals a Direct Role of
 Supplementary Information Cytotoxicity of Botulinum Neurotoxins Reveals a Direct Role of Syntaxin 1 and SNAP-25 in Neuron Survival Lisheng Peng, Huisheng Liu, Hongyu Ruan, William H. Tepp, William H. Stoothoff,
Supplementary Figure 1. IFN-γ induces TRC dormancy. a, IFN-γ induced dormancy
 Supplementary Figure 1. IFN-γ induces TRC dormancy. a, IFN-γ induced dormancy of various tumor type TRCs, including H22 (murine hepatocarcinoma) and CT26 (murine colon cancer). Bar, 50 µm. b, B16 cells