Functional analysis reveals that RBM10 mutations. contribute to lung adenocarcinoma pathogenesis by. deregulating splicing
|
|
|
- Bernice Ross
- 5 years ago
- Views:
Transcription
1 Supplementary Information Functional analysis reveals that RBM10 mutations contribute to lung adenocarcinoma pathogenesis by deregulating splicing Jiawei Zhao 1,+, Yue Sun 2,3,+, Yin Huang 6, Fan Song 1, Zengshu Huang 5, Yufang Bao 1, Ji Zuo 1, David Saffen 1,3,4, Zhen Shao 6, Wen Liu 1,*, Yongbo Wang 1,* 1 Department of Cellular and Genetic Medicine, School of Basic Medical Sciences, Fudan University, Shanghai, , China 2 School of Life Sciences, Fudan University, Shanghai, , China 3 Institutes of Brain Science, Fudan University, Shanghai, , China 4 State Key Laboratory for Medical Neurobiology, Fudan University, Shanghai, , China 5 Shanghai Medical College, Fudan University, Shanghai, , China 6 Key Laboratory of Computational Biology, CAS-MPG Partner Institute for Computational Biology, Shanghai Institutes for Biological Sciences, Chinese Academy of Sciences, Shanghai , China + These authors contributed equally to this work. * Corresponding authors. Corresponding authors Correspondence to Yongbo Wang, wangyongbo@fudan.edu.cn or Wen Liu, liuwen@shmu.edu.cn 1
2 Supplementary Figures Supplementary Figure S1. Effects of RBM10 copy number alterations (CNAs) on its RNA expression. Box plot shows RBM10 mrna expression in LUAD samples with RBM10 copy number loss (CN LOSS), copy number gain (CN GAIN), without RBM10 mutation and CNA (No Mutation/CNA), and in tumor-adjacent normal tissue (Normal). P values were calculated using Mann-Whitney tests followed by Benjamini & Hochberg corrections. Data are from TCGA and COSMIC (see Methods for details). Boxes represent the medians (inside lines) and the quartiles (upper and bottom boarder lines). Whiskers above and below the boxes represent maximum and minimum values within the 1.5 IQ (inter quarter) range. 2

3 Supplementary Figure S2. RBM10-EGFP overexpression (OE) promotes exon skipping in RBM10 target genes in HEK293 cells. Differences in splicing in five RBM10 target genes transiently overexpressing EGFP or RBM10-EGFP were detected by RT-PCR. Shown are gel images of RT-PCR products, whose identities are indicated on the right, based on Refseq transcript variant 1 sequences of these genes. RT-PCR using primers binding to RBM10 coding sequences (RBM10-CDS) provided a measure of the extent of OE. GAPDH was used as an internal control. Exon inclusion levels, represented by PSI (percent-splice-in) values, were calculated from the PCR band intensities quantified using ImageJ software. 3
 was used to measure the extent of OE. A representative gel image from three independent experiments is shown.")
4 Supplementary Figure S3. RT-PCR assessment of RBM10 mrna expression levels in RBM10-EGFP wild type (WT) or mutant (MUT) transfected HEK293 cells. RT-PCR primer binding to RBM10 coding sequence (RBM10-CDS) was used to measure the extent of OE. A representative gel image from three independent experiments is shown. GAPDH: internal control. 4
5 5
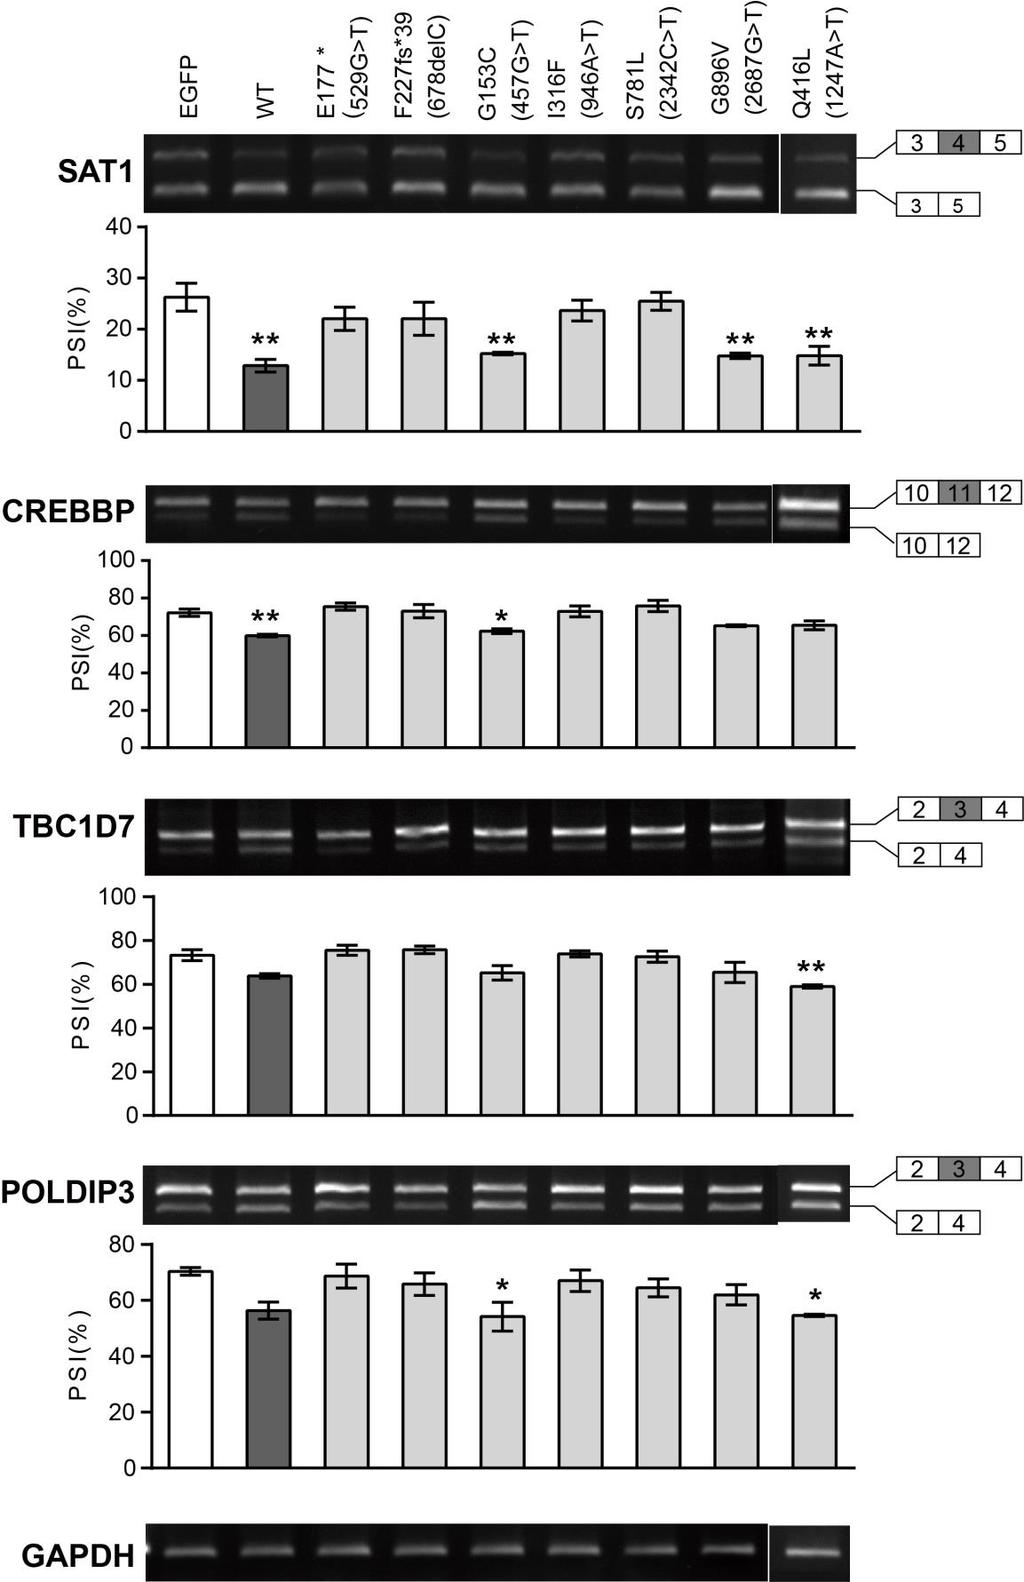
6 Supplementary Figure S4. Splicing changes in four RBM10 target genes induced by RBM10-EGFP wild type (WT) and mutants (MUTs) overexpression in HEK293 cells. Splice variants were examined by RT-PCR and quantified as PSI (percent-splice-in) values. Means ± SEM of PSIs from three independent experiments are plotted below representative gel images. GAPDH: internal control. All samples were compared with EGFP controls. ns: not significant, * P 0.05, ** P 0.01 (One-way ANOVA followed by Dunnett s test for multiple comparisons to control). Note that RT-PCR products for Q416L were prepared in parallel with the other samples, but resolved in non-adjacent lanes in the gels. 6
 RBM10-EGFP E177* and RBM10-EGFP F227fs*39 were cotransfected with DsRed expression plasmids.")
7 Supplementary Figure S5. Subcellular localizations of RBM10-EGFP E177*, F227fs*39 and Q416L in HEK293 cells. (a) RBM10-EGFP E177* and RBM10-EGFP F227fs*39 were cotransfected with DsRed expression plasmids. RBM10-EGFP fluorescence was absent in these cells, consistent with lack of expression of the fusions proteins. (b) RBM10-EGFP Q416L localized to the nucleus. Magnification: 40x. Scale bar: 10 m. Nuclei were visualized by DAPI staining. 7
, I316F, S781L and G896V fusion proteins in tet-on")
8 Supplementary Figure S6. Nuclei subcellular localizations of RBM10-EGFP wild type (WT), I316F, S781L and G896V fusion proteins in tet-on A549 cells. Magnification: 40x. Scale bar: 10 m. Nuclei were visualized by DAPI staining. 8
 Western blots showing the degree of RBM10 depletion achieved by transfecting A549 cells with sirnas against RBM10 [sirbm10(1) or")
![sirbm10(2)] or non-target control sirna (sictrl).](/docs-images/83/87681975/images/9-1.jpg "Sequences of sirbm10(1), sirbm10(2) and control sirna are listed in Supplementary Table S2. α-tubulin served as the loading control.")
9 Supplementary Figure S7. RBM10 depletion promotes proliferation of LUAD A549 cells. (a) Western blots showing the degree of RBM10 depletion achieved by transfecting A549 cells with sirnas against RBM10 [sirbm10(1) or sirbm10(2)] or non-target control sirna (sictrl). Sequences of sirbm10(1), sirbm10(2) and control sirna are listed in Supplementary Table S2. α-tubulin served as the loading control. (b) CCK8 analysis of the proliferation rates of A549 cells transfected with sirbm10(1), sirbm10(2) or sictrl. Error bars: ± SD, n = 4 technical replicates. 9
 treatment. Splice variants were examined by RT-PCR and quantified as PSI (percent-splice-in, %) values and shown below the gel image.")
10 Supplementary Figure S8. Splicing changes of four RBM10 target genes induced by overexpression (OE) of RBM10 wild type (WT) or one of three missense mutants (MUTs) in tet-on A549 cells. OE was achieved by 1 g/ml doxycycline (Dox) treatment. Splice variants were examined by RT-PCR and quantified as PSI (percent-splice-in, %) values and shown below the gel image. Primer binding to RBM10 coding sequence (RBM10-CDS) measures the extent of OE. GAPDH: internal control. 10
 to support the specificity of those by primer E12M-F and BGH-R.")
11 Supplementary Figure S9. (a-d) Full-length images of agarose gels and western blots related to Figure 3c, 4b, 4e and 5, respectively. PCR products by primer T7-F and BGH-R were included in (a) to support the specificity of those by primer E12M-F and BGH-R. The band marked by red arrow in (a) is likely representing RBM10 intron 11 unspliced product, and that 11
12 in (c) is likely representing NUMB intron 9 unspliced product. The nonspecific bands detected in (d) are likely degraded products or artifacts of RBM10-EGFP overexpression. bp: base pair. Marker: 100 bp DNA ladder from NEB. 12
13 Supplementary Tables Supplementary Table S1. RBM10 mutations and mrna expression levels in COSMIC and TCGA LUAD samples. Normalized RBM10 mrna expression levels were obtained from TCGA. FATHMM prediction results were obtained from COSMIC. Four reported oncogene-negative samples were highlighted in yellow. Table S1 is provided as a separate excel file. Supplementary Table S2. Sequences of oligonucleotides and PCR primers used in this study. Construct Primer Name Primer Sequence (5'-3') Vector R10_ NheI_F ACGCGCTAGCATGGAGTATGAAAGACGTGGTG R10_ EcoRI _R ATTTGAATTCCTCTGGGCCTCGTTGAAGCG R10-NotI-F TAATGCGGCCGCGGTCTATATAAGCAGAGCTGGT GFP-MluI-R GTCACGCGTTGATTATGATCTAGAGTCGCGG RBM10-E12M-F RBM10-E12M-R NUMB-1_fwd NUMB-1_rev NUMB-2_fwd NUMB-2_rev NUMB-3_fwd NUMB-3_rev Mutagenesis Primer Name E12M- A1247T-F E12M- A1247T-R 457G-T (G153C)-F 457G-T (G153C)-R 529G-T (E177)-F 529G-T (E177-)-R RBM10-C678del-F RBM10-C678del-R GGGAGACCCAAGCTGGCTAGCGAGGCAGCCCAGC TGCTGC TAGTCCAGTGTGGTGGAATTCCTGCTCCAGTGGGAT CCCCTTTG tttaaacgggccctctagactgccagaagtagaagggg aatgtgtaagtgctcaataaatggtgcc ttattgagcacttacacattgcttgccac gagtcagtgccattagctacaacgggag gtagctaatggcactgactcagccttcc tgatcagcggtttaaacttaacctcttctaaccatcggtc Sequence (5'-3') CCATCTCACTGgtactcagACCCCTTGTGCCTCCCAGC ctgagtaccagtgagatggcccactgggccgcagcaa AGTCGCACtGCGTGCAAGCAC GCAGCTGGCCACGGATGTCATCC CCTTCGTCtAGTTTAGTCACTT CGAAGCCCCGGCTCTGA CGTCCAGAATTCAAACGCCGAGAGAAGTGCTTCAAATG GCGTTTGAATTCTGGACGCCACACTTATTGCACAGC RBM10-EGFP plvx-rbm10-gfp RBM10-E12M minigene NUMB minigene 13
14 946A-T (I316F)-F TGGATTCCtTCCTGGGGGCC 946A-T (I316F)-R TGGTGCTGTGTGGGTTCAGGT RBM10-A1247T-F CCATCTCACTGGCCTCCCAAGGTGGGGAGGGTACCTG RBM10-A1247T-R TGGGAGGCCAGTGAGATGGCCCACTGGGCCGCAGC 2342C-T (S781L)-F CAGCTCTtAGGGCTCCAC 2342C-T (S781L)-R CTGGTGCCGGATGAGCG 2687G-T (G896V)-F TGCGGGtCTCCGGCCTGG 2687G-T (G896V)-R CCCGTGTTTGGGCCTCGATAGGCG RT-PCR Primer Name Sequence (5'-3') Product length (bp) ACLY_F CTGCAAAGAAGGCCAAGCC 141, 171 ACLY_R CGTCTCGGGAGCAGACATAG CHTOP_F GCCCAGCAGATGGAGAATAG 534, 212 CHTOP_R AGCATCCAGGTGTCCTTTTG CREBBP_F AGGCACAACCTGTGAGACCT 142, 187 CREBBP_R ACTGAGCCCATGCTGTTCAT NUMB_F GAAGTAGAAGGGGAGGCAGA 225, 369 NUMB_R GTCGGCCTCAGAGGGAGTA PCPB2_F TTGACCAAGCTGCACCAG 129, 168 PCBP2_R ATCGTTTGGAATGGTGAGTTC POLDIP3-F TCGAATCAAAGGGAAAGTGC 273, 360 POLDIP3-R CCTGAGGCTGCAAACTTCAT SAT1_F TTTGGAGAGCACCCCTTTTA 202, 92 SAT1_R ATGGCAAAACCAACAATGCT TBC1D7_F TGAGAAAGTGGGGTTTCGTG 337, 256 TBC1D7_R TGGAAAAGAGGGACTTCGAG RBM10-CDS-F GCCTCTACTATGACCCCAACTCCCA 82 RBM10-CDS-R GTCCGCCTCTCCCCATCCCA GAPDH-F TGCACCACCAACTGCTTAGC 87 GAPDH-R GGCATGGACTGTGGTCATGAG BGH-R TAGAAGGCACAGTCGAGG / sirnas Oligo Name Sequence (5'-3') sictrl r(uucuccgaacgugucacgu)dtdt sirbm10-1 r(ccgcugugcucaaaucuga)dtdt sirbm10-2 r(cuucgccuucgucgaguuuag) 14
Engineering splicing factors with designed specificities
 nature methods Engineering splicing factors with designed specificities Yang Wang, Cheom-Gil Cheong, Traci M Tanaka Hall & Zefeng Wang Supplementary figures and text: Supplementary Figure 1 Supplementary
Supplementary Figure 1
 Supplementary Figure 1 Supplementary Fig. 1 shrna mediated knockdown of ZRSR2 in K562 and 293T cells. (a) ZRSR2 transcript levels in stably transduced K562 cells were determined using qrt-pcr. GAPDH was
Supplementary Figures
 Supplementary Figures Supplementary Figure 1 Experimental schema for the identification of circular RNAs in six normal tissues and seven cancerous tissues. Supplementary Fiure 2 Comparison of human circrnas
i-stop codon positions in the mcherry gene
 Supplementary Figure 1 i-stop codon positions in the mcherry gene The grnas (green) that can potentially generate stop codons from Trp (63 th and 98 th aa, upper panel) and Gln (47 th and 114 th aa, bottom
Cell proliferation was measured with Cell Counting Kit-8 (Dojindo Laboratories, Kumamoto, Japan).
.") 1 2 3 4 5 6 7 8 Supplemental Materials and Methods Cell proliferation assay Cell proliferation was measured with Cell Counting Kit-8 (Dojindo Laboratories, Kumamoto, Japan). GCs were plated at 96-well
1 2 3 4 5 6 7 8 Supplemental Materials and Methods Cell proliferation assay Cell proliferation was measured with Cell Counting Kit-8 (Dojindo Laboratories, Kumamoto, Japan). GCs were plated at 96-well
Sperm cells are passive cargo of the pollen tube in plant fertilization
 In the format provided by the authors and unedited. SUPPLEMENTARY INFORMATION VOLUME: 3 ARTICLE NUMBER: 17079 Sperm cells are passive cargo of the pollen tube in plant fertilization Jun Zhang 1, Qingpei
Genome-wide genetic screening with chemically-mutagenized haploid embryonic stem cells
 1 2 3 4 5 6 7 8 9 10 11 12 13 14 15 16 17 18 19 20 Supplementary Information Genome-wide genetic screening with chemically-mutagenized haploid embryonic stem cells Josep V. Forment 1,2, Mareike Herzog
SUPPLEMENTARY INFORMATION
 DOI: 10.1038/ncb3363 Supplementary Figure 1 Several WNTs bind to the extracellular domains of PKD1. (a) HEK293T cells were co-transfected with indicated plasmids. Flag-tagged proteins were immunoprecipiated
Figure S1. Figure S2 RT-PCR. qpcr RT-PCR. Northern. IVSwt ΔIVS IVS IVS IVS. NTC mock IVSwt ΔIVS IVS IVS. mock IVSwt ΔIVS
 Figure S1 40 cycles IVS IVS IVS NTC wt Δ Δ mut pri-mirna163 * Fig. S1 Transcripts generated from the MIR163 gene variants in which splice sites have been mutated are not spliced. products were separated
Fig. S1. eif6 expression in HEK293 transfected with shrna against eif6 or pcmv-eif6 vector.
 Fig. S1. eif6 expression in HEK293 transfected with shrna against eif6 or pcmv-eif6 vector. (a) Western blotting analysis and (b) qpcr analysis of eif6 expression in HEK293 T cells transfected with either
Table 1. Primers, annealing temperatures, and product sizes for PCR amplification.
 Table 1. Primers, annealing temperatures, and product sizes for PCR amplification. Gene Direction Primer sequence (5 3 ) Annealing Temperature Size (bp) BRCA1 Forward TTGCGGGAGGAAAATGGGTAGTTA 50 o C 292
Fig Hypoxia causes growth retardation and developmental delay. (A) Morphology of wildtype zebrafish embryos at 48 hours post fertilization
 Morphology of wildtype zebrafish embryos at 48 hours post fertilization") FIGURES AND TABLES Fig. 1-1. Hypoxia causes growth retardation and developmental delay. (A) Morphology of wildtype zebrafish embryos at 48 hours post fertilization (hpf) after 24 h of normoxia or hypoxia
FIGURES AND TABLES Fig. 1-1. Hypoxia causes growth retardation and developmental delay. (A) Morphology of wildtype zebrafish embryos at 48 hours post fertilization (hpf) after 24 h of normoxia or hypoxia
(a) Immunoblotting to show the migration position of Flag-tagged MAVS
 Immunoblotting to show the migration position of Flag-tagged MAVS") Supplementary Figure 1 Characterization of six MAVS isoforms. (a) Immunoblotting to show the migration position of Flag-tagged MAVS isoforms. HEK293T Mavs -/- cells were transfected with constructs expressing
Supplementary Figure 1 Characterization of six MAVS isoforms. (a) Immunoblotting to show the migration position of Flag-tagged MAVS isoforms. HEK293T Mavs -/- cells were transfected with constructs expressing
Nature Structural & Molecular Biology: doi: /nsmb Supplementary Figure 1. Analyses of ECTRs by C-circle and T-circle assays.
 Supplementary Figure 1 Analyses of ECTRs by C-circle and T-circle assays. (a) C-circle and (b) T-circle amplification reactions using genomic DNA from different cell lines in the presence (+) or absence
Supplementary Figure 1 Phosphorylated tau accumulates in Nrf2 (-/-) mice. Hippocampal tissues obtained from Nrf2 (-/-) (10 months old, 4 male; 2
 mice. Hippocampal tissues obtained from Nrf2 (-/-) (10 months old, 4 male; 2") Supplementary Figure 1 Phosphorylated tau accumulates in Nrf2 (-/-) mice. Hippocampal tissues obtained from Nrf2 (-/-) (10 months old, 4 male; 2 female) or wild-type (5 months old, 1 male; 11 months old,
Supplementary Figure 1 Phosphorylated tau accumulates in Nrf2 (-/-) mice. Hippocampal tissues obtained from Nrf2 (-/-) (10 months old, 4 male; 2 female) or wild-type (5 months old, 1 male; 11 months old,
Online Supplementary Information
 Online Supplementary Information NLRP4 negatively regulates type I interferon signaling by targeting TBK1 for degradation via E3 ubiquitin ligase DTX4 Jun Cui 1,4,6,7, Yinyin Li 1,5,6,7, Liang Zhu 1, Dan
Supplemental Data. Na Xu et al. (2016). Plant Cell /tpc
. Plant Cell /tpc") Supplemental Figure 1. The weak fluorescence phenotype is not caused by the mutation in At3g60240. (A) A mutation mapped to the gene At3g60240. Map-based cloning strategy was used to map the mutated site
Supplemental Figure 1. The weak fluorescence phenotype is not caused by the mutation in At3g60240. (A) A mutation mapped to the gene At3g60240. Map-based cloning strategy was used to map the mutated site
Supplementary Material. TRIB3 inhibits proliferation and promotes osteogenesis in hbmscs by regulating the. ERK1/2 signaling pathway
 Supplementary Material TRIB3 inhibits proliferation and promotes osteogenesis in hbmscs by regulating the ERK1/2 signaling pathway Cui Zhang 1, Fan-Fan Hong 1, Cui-Cui Wang 1, Liang Li 1, Jian-Ling Chen
SUPPLEMENTARY INFORMATION
 doi:10.1038/nature12119 SUPPLEMENTARY FIGURES AND LEGENDS pre-let-7a- 1 +14U pre-let-7a- 1 Ddx3x Dhx30 Dis3l2 Elavl1 Ggt5 Hnrnph 2 Osbpl5 Puf60 Rnpc3 Rpl7 Sf3b3 Sf3b4 Tia1 Triobp U2af1 U2af2 1 6 2 4 3
Somatic Primary pirna Biogenesis Driven by cis-acting RNA Elements and Trans-Acting Yb
 Cell Reports Supplemental Information Somatic Primary pirna Biogenesis Driven by cis-acting RNA Elements and Trans-Acting Yb Hirotsugu Ishizu, Yuka W. Iwasaki, Shigeki Hirakata, Haruka Ozaki, Wataru Iwasaki,
Supplementary Figure 1 Collision-induced dissociation (CID) mass spectra of peptides from PPK1, PPK2, PPK3 and PPK4 respectively.
 mass spectra of peptides from PPK1, PPK2, PPK3 and PPK4 respectively.") Supplementary Figure 1 lision-induced dissociation (CID) mass spectra of peptides from PPK1, PPK, PPK3 and PPK respectively. % of nuclei with signal / field a 5 c ppif3:gus pppk1:gus 0 35 30 5 0 15 10
Supplementary Figure 1 lision-induced dissociation (CID) mass spectra of peptides from PPK1, PPK, PPK3 and PPK respectively. % of nuclei with signal / field a 5 c ppif3:gus pppk1:gus 0 35 30 5 0 15 10
Supplementary information for: Ten-Eleven Translocation-2 (Tet2) Is Involved in Myogenic Differentiation of Skeletal Myoblast Cells in
 Is Involved in Myogenic Differentiation of Skeletal Myoblast Cells in") Supplementary information for: Ten-Eleven Translocation-2 (Tet2) Is Involved in Myogenic Differentiation of Skeletal Myoblast Cells in Vitro Xia Zhong*, Qian-Qian Wang*, Jian-Wei Li, Yu-Mei Zhang, Xiao-Rong
Supplementary information for: Ten-Eleven Translocation-2 (Tet2) Is Involved in Myogenic Differentiation of Skeletal Myoblast Cells in Vitro Xia Zhong*, Qian-Qian Wang*, Jian-Wei Li, Yu-Mei Zhang, Xiao-Rong
monoclonal antibody. (a) The specificity of the anti-rhbdd1 monoclonal antibody was examined in
 The specificity of the anti-rhbdd1 monoclonal antibody was examined in") Supplementary information Supplementary figures Supplementary Figure 1 Determination of the s pecificity of in-house anti-rhbdd1 mouse monoclonal antibody. (a) The specificity of the anti-rhbdd1 monoclonal
Supplementary information Supplementary figures Supplementary Figure 1 Determination of the s pecificity of in-house anti-rhbdd1 mouse monoclonal antibody. (a) The specificity of the anti-rhbdd1 monoclonal
CRISPR RNA-guided activation of endogenous human genes
 CRISPR RNA-guided activation of endogenous human genes Morgan L Maeder, Samantha J Linder, Vincent M Cascio, Yanfang Fu, Quan H Ho, J Keith Joung Supplementary Figure 1 Comparison of VEGF activation induced
Use of Minigenes in a Diagnostic Laboratory. Allan Richards. Cambridge
 Use of Minigenes in a Diagnostic Laboratory Allan Richards Cambridge Minigene Analysis Minigenes are used to assess the effect of sequence variants on the processing of pre-mrna into the final message
Supplementary Figure 1, related to Figure 1. GAS5 is highly expressed in the cytoplasm of hescs, and positively correlates with pluripotency.
 Supplementary Figure 1, related to Figure 1. GAS5 is highly expressed in the cytoplasm of hescs, and positively correlates with pluripotency. (a) Transfection of different concentration of GAS5-overexpressing
Nature Immunology: doi: /ni Supplementary Figure 1. Control experiments for Figure 1.
 Supplementary Figure 1 Control experiments for Figure 1. (a) Localization of SETX in untreated or PR8ΔNS1 virus infected A549 cells (4hours). Nuclear (DAPI) and Tubulin staining are shown. SETX antibody
SUPPLEMENTARY INFORMATION
 Secondary mutations as a mechanism of cisplatin resistance in BRCA2-mutated cancers Wataru Sakai, Elizabeth M. Swisher, Beth Y. Karlan, Mukesh K. Agarwal, Jake Higgins, Cynthia Friedman, Emily Villegas,
Supplementary Figure 1. NORAD expression in mouse (A) and dog (B). The black boxes indicate the position of the regions alignable to the 12 repeat
 and dog (B). The black boxes indicate the position of the regions alignable to the 12 repeat") Supplementary Figure 1. NORAD expression in mouse (A) and dog (B). The black boxes indicate the position of the regions alignable to the 12 repeat units in the human genome. Annotated transposable elements
Supplementary Figure 1. NORAD expression in mouse (A) and dog (B). The black boxes indicate the position of the regions alignable to the 12 repeat units in the human genome. Annotated transposable elements
File name: Supplementary Information Description: Supplementary figures and supplementary tables. File name: Peer review file Description:
 File name: Supplementary Information Description: Supplementary figures and supplementary tables. File name: Peer review file Description: Supplementary Figure 1. dcas9-mq1 fusion protein induces de novo
Schematic representation of the endogenous PALB2 locus and gene-disruption constructs
 Supplementary Figures Supplementary Figure 1. Generation of PALB2 -/- and BRCA2 -/- /PALB2 -/- DT40 cells. (A) Schematic representation of the endogenous PALB2 locus and gene-disruption constructs carrying
Supplementary
 Supplementary information Supplementary Material and Methods Plasmid construction The transposable element vectors for inducible expression of RFP-FUS wt and EGFP-FUS R521C and EGFP-FUS P525L were derived
Supplementary Methods
 Supplementary Methods Reverse transcribed Quantitative PCR. Total RNA was isolated from bone marrow derived macrophages using RNeasy Mini Kit (Qiagen), DNase-treated (Promega RQ1), and reverse transcribed
Supplementary Fig. 1 related to Fig. 1 Clinical relevance of lncrna candidate
 Supplementary Figure Legends Supplementary Fig. 1 related to Fig. 1 Clinical relevance of lncrna candidate BC041951 in gastric cancer. (A) The flow chart for selected candidate lncrnas in 660 up-regulated
Nature Biotechnology: doi: /nbt Supplementary Figure 1. In vitro validation of OTC sgrnas and donor template.
 Supplementary Figure 1 In vitro validation of OTC sgrnas and donor template. (a) In vitro validation of sgrnas targeted to OTC in the MC57G mouse cell line by transient transfection followed by 4-day puromycin
(a) Scheme depicting the strategy used to generate the ko and conditional alleles. (b) RT-PCR for
 Scheme depicting the strategy used to generate the ko and conditional alleles. (b) RT-PCR for") Supplementary Figure 1 Generation of Diaph3 ko mice. (a) Scheme depicting the strategy used to generate the ko and conditional alleles. (b) RT-PCR for different regions of Diaph3 mrna from WT, heterozygote
Supplementary Figure 1 Generation of Diaph3 ko mice. (a) Scheme depicting the strategy used to generate the ko and conditional alleles. (b) RT-PCR for different regions of Diaph3 mrna from WT, heterozygote
Supplementary Figure 1 PARP1 is involved in regulating the stability of mrnas from pro-inflammatory cytokine/chemokine mediators.
 Supplementary Figure 1 PARP1 is involved in regulating the stability of mrnas from pro-inflammatory cytokine/chemokine mediators. (a) A graphic depiction of the approach to determining the stability of
Nature Structural and Molecular Biology: doi: /nsmb Supplementary Figure 1
 Supplementary Figure 1 Distribution of mirnas between lncrna and protein-coding genes. Pie chart showing distribution of human mirna between protein coding and lncrna genes. To the right, lncrna mirna
Figure S1. Verification of ihog Mutation by Protein Immunoblotting Figure S2. Verification of ihog and boi
 Figure S1. Verification of ihog Mutation by Protein Immunoblotting Extracts from S2R+ cells, embryos, and adults were analyzed by immunoprecipitation and immunoblotting with anti-ihog antibody. The Ihog
Supplementary Figure 1. jmj30-2 and jmj32-1 produce null mutants. (a) Schematic drawing of JMJ30 and JMJ32 genome structure showing regions amplified
 Schematic drawing of JMJ30 and JMJ32 genome structure showing regions amplified") Supplementary Figure 1. jmj30-2 and jmj32-1 produce null mutants. (a) Schematic drawing of JMJ30 and JMJ32 genome structure showing regions amplified by primers used for mrna expression analysis. Gray
Supplementary Figure 1. jmj30-2 and jmj32-1 produce null mutants. (a) Schematic drawing of JMJ30 and JMJ32 genome structure showing regions amplified by primers used for mrna expression analysis. Gray
T H E J O U R N A L O F C E L L B I O L O G Y
 T H E J O U R N A L O F C E L L B I O L O G Y Supplemental material Han et al., http://www.jcb.org/cgi/content/full/jcb.201311007/dc1 Figure S1. SIVA1 interacts with PCNA. (A) HEK293T cells were transiently
Supplementary data. sienigma. F-Enigma F-EnigmaSM. a-p53
 Supplementary data Supplemental Figure 1 A sienigma #2 sienigma sicontrol a-enigma - + ++ - - - - - - + ++ - - - - - - ++ B sienigma F-Enigma F-EnigmaSM a-flag HLK3 cells - - - + ++ + ++ - + - + + - -
At E17.5, the embryos were rinsed in phosphate-buffered saline (PBS) and immersed in
 and immersed in") Supplementary Materials and Methods Barrier function assays At E17.5, the embryos were rinsed in phosphate-buffered saline (PBS) and immersed in acidic X-gal mix (100 mm phosphate buffer at ph4.3, 3 mm
Supplementary Materials and Methods Barrier function assays At E17.5, the embryos were rinsed in phosphate-buffered saline (PBS) and immersed in acidic X-gal mix (100 mm phosphate buffer at ph4.3, 3 mm
Supplementary Materials for
 www.sciencesignaling.org/cgi/content/full/3/146/ra80/dc1 Supplementary Materials for DNMT1 Stability Is Regulated by Proteins Coordinating Deubiquitination and Acetylation-Driven Ubiquitination Zhanwen
Supplementary Figure S1. Immunodetection of full-length XA21 and the XA21 C-terminal cleavage product.
 Supplementary Information Supplementary Figure S1. Immunodetection of full-length XA21 and the XA21 C-terminal cleavage product. Total protein extracted from Kitaake wild type and rice plants carrying
Supplementary Materials for
 www.sciencesignaling.org/cgi/content/full/10/496/eaam6291/dc1 Supplementary Materials for Regulation of autophagy, NF-κB signaling, and cell viability by mir-124 in KRAS mutant mesenchymal-like NSCLC cells
8Br-cAMP was purchased from Sigma (St. Louis, MO). Silencer Negative Control sirna #1 and
. Silencer Negative Control sirna #1 and") 1 Supplemental information 2 3 Materials and Methods 4 Reagents and animals 5 8Br-cAMP was purchased from Sigma (St. Louis, MO). Silencer Negative Control sirna #1 and 6 Silencer Select Pre-designed sirna
1 Supplemental information 2 3 Materials and Methods 4 Reagents and animals 5 8Br-cAMP was purchased from Sigma (St. Louis, MO). Silencer Negative Control sirna #1 and 6 Silencer Select Pre-designed sirna
Revised: RG-RV2 by Fukuhara et al.
 Supplemental Figure 1 The generation of Spns2 conditional knockout mice. (A) Schematic representation of the wild type Spns2 locus (Spns2 + ), the targeted allele, the floxed allele (Spns2 f ) and the
Supplementary Information. A superfolding Spinach2 reveals the dynamic nature of. trinucleotide repeat RNA
 Supplementary Information A superfolding Spinach2 reveals the dynamic nature of trinucleotide repeat RNA Rita L. Strack 1, Matthew D. Disney 2 & Samie R. Jaffrey 1 1 Department of Pharmacology, Weill Medical
Fig. S1. Effect of p120-catenin overexpression on the interaction of SCUBE2 with E-cadherin. The expression plasmid encoding FLAG.
 Fig. S1. Effect of p120-catenin overexpression on the interaction of SCUBE2 with E-cadherin. The expression plasmid encoding FLAG.SCUBE2, E-cadherin.Myc, or HA.p120-catenin was transfected in a combination
Supplementary Data Supplementary Figures
 Supplementary Data Supplementary Figures Supplementary Figure 1. Pi04314 is expressed during infection, each GFP-Pi04314 fusion is stable and myr GFP-Pi04314 is removed from the nucleus while NLS GFP-Pi04314
JCB. Supplemental material THE JOURNAL OF CELL BIOLOGY. Paul et al.,
 Supplemental material JCB Paul et al., http://www.jcb.org/cgi/content/full/jcb.201502040/dc1 THE JOURNAL OF CELL BIOLOGY Figure S1. Mutant p53-expressing cells display limited retrograde actin flow at
Supplementary Figure 1. Nature Structural & Molecular Biology: doi: /nsmb.3494
 Supplementary Figure 1 Pol structure-function analysis (a) Inactivating polymerase and helicase mutations do not alter the stability of Pol. Flag epitopes were introduced using CRISPR/Cas9 gene targeting
SUPPLEMENTARY INFORMATION. Tolerance of a knotted near infrared fluorescent protein to random circular permutation
 SUPPLEMENTARY INFORMATION Tolerance of a knotted near infrared fluorescent protein to random circular permutation Naresh Pandey 1,3, Brianna E. Kuypers 2,4, Barbara Nassif 1, Emily E. Thomas 1,3, Razan
Supplementary Figure 1. (a) The qrt-pcr for lnc-2, lnc-6 and lnc-7 RNA level in DU145, 22Rv1, wild type HCT116 and HCT116 Dicer ex5 cells transfected
 The qrt-pcr for lnc-2, lnc-6 and lnc-7 RNA level in DU145, 22Rv1, wild type HCT116 and HCT116 Dicer ex5 cells transfected") Supplementary Figure 1. (a) The qrt-pcr for lnc-2, lnc-6 and lnc-7 RNA level in DU145, 22Rv1, wild type HCT116 and HCT116 Dicer ex5 cells transfected with the sirna against lnc-2, lnc-6, lnc-7, and the
Supplementary Figure 1. (a) The qrt-pcr for lnc-2, lnc-6 and lnc-7 RNA level in DU145, 22Rv1, wild type HCT116 and HCT116 Dicer ex5 cells transfected with the sirna against lnc-2, lnc-6, lnc-7, and the
SUPPLEMENTARY INFORMATION
 AS-NMD modulates FLM-dependent thermosensory flowering response in Arabidopsis NATURE PLANTS www.nature.com/natureplants 1 Supplementary Figure 1. Genomic sequence of FLM along with the splice sites. Sequencing
ASPP1 Fw GGTTGGGAATCCACGTGTTG ASPP1 Rv GCCATATCTTGGAGCTCTGAGAG
 Supplemental Materials and Methods Plasmids: the following plasmids were used in the supplementary data: pwzl-myc- Lats2 (Aylon et al, 2006), pretrosuper-vector and pretrosuper-shp53 (generous gift of
Nature Biotechnology: doi: /nbt.4166
 Supplementary Figure 1 Validation of correct targeting at targeted locus. (a) by immunofluorescence staining of 2C-HR-CRISPR microinjected embryos cultured to the blastocyst stage. Embryos were stained
Supplementary Information. Isl2b regulates anterior second heart field development in zebrafish
 Supplementary Information Isl2b regulates anterior second heart field development in zebrafish Hagen R. Witzel 1, Sirisha Cheedipudi 1, Rui Gao 1, Didier Y.R. Stainier 2 and Gergana D. Dobreva 1,3* 1 Origin
Supplemental Table S1. RT-PCR primers used in this study
 Supplemental Table S1. RT-PCR primers used in this study -----------------------------------------------------------------------------------------------------------------------------------------------
Supplementary Information
 Supplementary Information Deletion of the B-B and C-C regions of inverted terminal repeats reduces raav productivity but increases transgene expression Qingzhang Zhou 1, Wenhong Tian 2, Chunguo Liu 3,
Supplementary Materials for
 www.sciencesignaling.org/cgi/content/full/8/404/ra120/dc1 Supplementary Materials for The subcellular localization and activity of cortactin is regulated by acetylation and interaction with Keap1 Akihiro
Stargazin regulates AMPA receptor trafficking through adaptor protein. complexes during long term depression
 Supplementary Information Stargazin regulates AMPA receptor trafficking through adaptor protein complexes during long term depression Shinji Matsuda, Wataru Kakegawa, Timotheus Budisantoso, Toshihiro Nomura,
Chemical hijacking of auxin signaling with an engineered auxin-tir1
 1 SUPPLEMENTARY INFORMATION Chemical hijacking of auxin signaling with an engineered auxin-tir1 pair Naoyuki Uchida 1,2*, Koji Takahashi 2*, Rie Iwasaki 1, Ryotaro Yamada 2, Masahiko Yoshimura 2, Takaho
Salvianolic Acid B Attenuates Experimental Pulmonary Fibrosis through. Inhibition of the TGF-β Signaling Pathway
 Salvianolic Acid B Attenuates Experimental Pulmonary Fibrosis through Inhibition of the TGF-β Signaling Pathway Qingmei Liu 1, Haiyan Chu 1, Yanyun Ma 1, Ting Wu 1, Feng Qian 1, Xian Ren 2, Wenzhen Tu
Supplementary Methods
 Supplementary Methods Microarray Data Analysis Gene expression data were obtained by hybridising a total of 24 samples from 6 experimental groups (n=4 per group) to Illumina HumanHT-12 Expression BeadChips.
Zhang et al., RepID facilitates replication Initiation. Supplemental Information:
 Supplemental Information: a b 1 Supplementary Figure 1 (a) DNA sequence of all the oligonucleotides used in this study. Only one strand is shown. The unshaded nucleotide sequences show changes from the
Supplemental Data. Cui et al. (2012). Plant Cell /tpc a b c d. Stem UBC32 ACTIN
. Plant Cell /tpc a b c d. Stem UBC32 ACTIN") A Root Stem Leaf Flower Silique Senescence leaf B a b c d UBC32 ACTIN C * Supplemental Figure 1. Expression Pattern and Protein Sequence of UBC32 Homologues in Yeast, Human, and Arabidopsis. (A) Expression
A Root Stem Leaf Flower Silique Senescence leaf B a b c d UBC32 ACTIN C * Supplemental Figure 1. Expression Pattern and Protein Sequence of UBC32 Homologues in Yeast, Human, and Arabidopsis. (A) Expression
Supplementary Figure S1 Complementarity between VR-RNA and cola mrna 5 UTR is important for cola regulation. (A) Mutation sites within VR-RNA-colA
 Mutation sites within VR-RNA-colA") Supplementary Figure S1 Complementarity between VR-RNA and cola mrna 5 UTR is important for cola regulation. (A) Mutation sites within VR-RNA-colA RNA duplex. Mutation sites in cola mrna 5 UTR or VR-RNA
Supplementary Figure S1 Complementarity between VR-RNA and cola mrna 5 UTR is important for cola regulation. (A) Mutation sites within VR-RNA-colA RNA duplex. Mutation sites in cola mrna 5 UTR or VR-RNA
Supplementary Figure S1. The tetracycline-inducible CRISPR system. A) Hela cells stably
 Hela cells stably") Supplementary Information Supplementary Figure S1. The tetracycline-inducible CRISPR system. A) Hela cells stably expressing shrna sequences against TRF2 were examined by western blotting. shcon, shrna
Supplementary Information Supplementary Figure S1. The tetracycline-inducible CRISPR system. A) Hela cells stably expressing shrna sequences against TRF2 were examined by western blotting. shcon, shrna
A subclass of HSP70s regulate development and abiotic stress responses in Arabidopsis thaliana
 1 2 3 4 5 6 7 8 9 10 11 12 13 14 15 16 17 18 19 20 21 Journal of Plant Research A subclass of HSP70s regulate development and abiotic stress responses in Arabidopsis thaliana Linna Leng 1 Qianqian Liang
Supplemental Materials Molecular Biology of the Cell
 Supplemental Materials Molecular Biology of the Cell Zorbas et al. Fig S1: Positions of sirnas on transcripts targeted in this work, and sirna-mediated depletion efficiency A, The regions targeted
Supplementary Figure 1 Validate the expression of mir-302b after bacterial infection by northern
 Supplementary Figure 1 Validate the expression of mir-302b after bacterial infection by northern blot. Northern blot analysis of mir-302b expression following infection with PAO1, PAK and Kp in (A) lung
Table S1. Primers used in the study
 Table S1. Primers used in the study Primer name Application Sequence I1F16 Genotyping GGCAAGTGAGTGAGTGCCTA I1R11 Genotyping CCCACTCGTATTGACGCTCT V19 Genotyping GGGTCTCAAAGTCAGGGTCA D18Mit184-F Genotyping
SUPPLEMENTARY INFORMATION
 DOI: 10.1038/ncb3240 Supplementary Figure 1 GBM cell lines display similar levels of p100 to p52 processing but respond differentially to TWEAK-induced TERT expression according to TERT promoter mutation
Supplemental Data. Sethi et al. (2014). Plant Cell /tpc
. Plant Cell /tpc") Supplemental Data Supplemental Figure 1. MYC2 Binds to the E-box but not the E1-box of the MPK6 Promoter. (A) E1-box and E-box (wild type) containing MPK6 promoter fragment. The region shown in red denotes
Supplemental Data Supplemental Figure 1. MYC2 Binds to the E-box but not the E1-box of the MPK6 Promoter. (A) E1-box and E-box (wild type) containing MPK6 promoter fragment. The region shown in red denotes
Supplemental Figure 1 HDA18 has an HDAC domain and therefore has concentration dependent and TSA inhibited histone deacetylase activity.
 Supplemental Figure 1 HDA18 has an HDAC domain and therefore has concentration dependent and TSA inhibited histone deacetylase activity. (A) Amino acid alignment of HDA5, HDA15 and HDA18. The blue line
Design. Construction. Characterization
 Design Construction Characterization DNA mrna (messenger) A C C transcription translation C A C protein His A T G C T A C G Plasmids replicon copy number incompatibility selection marker origin of replication
b alternative classical none
 Supplementary Figure. 1: Related to Figure.1 a d e b alternative classical none NIK P-IkBa Total IkBa Tubulin P52 (Lighter) P52 (Darker) RelB (Lighter) RelB (Darker) HDAC1 Control-Sh RelB-Sh NF-kB2-Sh
SUPPLEMENTARY INFORMATION
 DOI: 10.1038/ncb3164 Supplementary Figure 1 Validation of effective Gnas deletion and epithelial thickness. a, Representative genotyping in mice treated or not with tamoxifen to show Gnas deletion. To
Peter Dy, Weihuan Wang, Pallavi Bhattaram, Qiuqing Wang, Lai Wang, R. Tracy Ballock, and Véronique Lefebvre
 Developmental Cell, Volume 22 Supplemental Information Sox9 Directs Hypertrophic Maturation and Blocks Osteoblast Differentiation of Growth Plate Chondrocytes Peter Dy, Weihuan Wang, Pallavi Bhattaram,
Supplementary Fig.1. Over-expression of RNase L in stable polyclonal cell line
 Supplemental Data mrna Protein A kda 75 40 NEO/vector NEO/RNase L RNASE L β-actin RNASE L β-actin B % of control (neo vector), normalized 240 ** 200 160 120 80 40 0 Neo Neo/RNase L RNase L Protein Supplementary
Efficient Multi-site-directed Mutagenesis directly from Genomic Template.
 Efficient Multi-site-directed Mutagenesis directly from Genomic Template. Fengtao Luo 1, Xiaolan Du 1, Tujun Weng 1, Xuan Wen 1, Junlan Huang 1, Lin Chen 1 Running title: Multi-site-directed Mutagenesis
Impact of Nutraceuticals on TERT gene encoded protein
 Impact of Nutraceuticals on TERT gene encoded protein Xu Liu Department of Biological Sciences Fordham University, Bronx, New York, 10458 Abstract Telomerase is a Ribonucleo-protein polymerase that plays
Supplementary Figure 1. Confirmation of sirna in PC3 and H1299 cells PC3 (a) and H1299 (b) cells were transfected with sirna oligonucleotides
 and H1299 (b) cells were transfected with sirna oligonucleotides") Supplementary Figure 1. Confirmation of sirna in PC3 and H1299 cells PC3 (a) and H1299 (b) cells were transfected with sirna oligonucleotides targeting RCP (SMARTPool (RCP) or two individual oligos (RCP#1
Supplementary Figure 1. Confirmation of sirna in PC3 and H1299 cells PC3 (a) and H1299 (b) cells were transfected with sirna oligonucleotides targeting RCP (SMARTPool (RCP) or two individual oligos (RCP#1
Partial list of differentially expressed genes from cdna microarray, comparing MUC18-
 Supplemental Figure legends Table-1 Partial list of differentially expressed genes from cdna microarray, comparing MUC18- silenced and NT-transduced A375SM cells. Supplemental Figure 1 Effect of MUC-18
Parthanatos mediates AIMP2-activated age-dependent dopaminergic neuronal loss
 SUPPLEMENTARY INFORMATION Parthanatos mediates AIMP2-activated age-dependent dopaminergic neuronal loss Yunjong Lee, Senthilkumar S. Karuppagounder, Joo-Ho Shin, Yun-Il Lee, Han Seok Ko, Debbie Swing,
Coleman et al., Supplementary Figure 1
 Coleman et al., Supplementary Figure 1 BrdU Merge G1 Early S Mid S Supplementary Figure 1. Sequential destruction of CRL4 Cdt2 targets during the G1/S transition. HCT116 cells were synchronized by sequential
A novel tool for monitoring endogenous alpha-synuclein transcription by NanoLuciferase
 A novel tool for monitoring endogenous alpha-synuclein transcription by NanoLuciferase tag insertion at the 3 end using CRISPR-Cas9 genome editing technique Sambuddha Basu 1, 3, Levi Adams 1, 3, Subhrangshu
SUPPORTING INFORMATION. Multidimensional control of Cas9 by evolved RNA polymerase-based biosensors
 SUPPORTING INFORMATION Multidimensional control of Cas9 by evolved RNA polymerase-based biosensors Jinyue Pu 1, Kaitlin Kentala 1, Bryan C. Dickinson 1 * 1 Department of Chemistry, The University of Chicago,
Figure S1: NUN preparation yields nascent, unadenylated RNA with a different profile from Total RNA.
 Summary of Supplemental Information Figure S1: NUN preparation yields nascent, unadenylated RNA with a different profile from Total RNA. Figure S2: rrna removal procedure is effective for clearing out
Supplementary Information
 Supplementary Information MED18 interaction with distinct transcription factors regulates plant immunity, flowering time and responses to hormones Supplementary Figure 1. Diagram showing T-DNA insertion
Nature Methods: doi: /nmeth Supplementary Figure 1. DMS-MaPseq data are highly reproducible at elevated DMS concentrations.
 Supplementary Figure 1 DMS-MaPseq data are highly reproducible at elevated DMS concentrations. a, Correlation of Gini index for 202 yeast mrna regions with 15x coverage at 2.5% or 5% v/v DMS concentrations
Table S1. Primers used in RT-PCR studies (all in 5 to 3 direction)
") Table S1. Primers used in RT-PCR studies (all in 5 to 3 direction) Epo Fw CTGTATCATGGACCACCTCGG Epo Rw TGAAGCACAGAAGCTCTTCGG Jak2 Fw ATCTGACCTTTCCATCTGGGG Jak2 Rw TGGTTGGGTGGATACCAGATC Stat5A Fw TTACTGAAGATCAAGCTGGGG
Table S1. Primers used in RT-PCR studies (all in 5 to 3 direction) Epo Fw CTGTATCATGGACCACCTCGG Epo Rw TGAAGCACAGAAGCTCTTCGG Jak2 Fw ATCTGACCTTTCCATCTGGGG Jak2 Rw TGGTTGGGTGGATACCAGATC Stat5A Fw TTACTGAAGATCAAGCTGGGG
Supplementary Figure 1. Homozygous rag2 E450fs mutants are healthy and viable similar to wild-type and heterozygous siblings.
 Supplementary Figure 1 Homozygous rag2 E450fs mutants are healthy and viable similar to wild-type and heterozygous siblings. (left) Representative bright-field images of wild type (wt), heterozygous (het)
Contents... vii. List of Figures... xii. List of Tables... xiv. Abbreviatons... xv. Summary... xvii. 1. Introduction In vitro evolution...
 vii Contents Contents... vii List of Figures... xii List of Tables... xiv Abbreviatons... xv Summary... xvii 1. Introduction...1 1.1 In vitro evolution... 1 1.2 Phage Display Technology... 3 1.3 Cell surface
Supplementary Table 1. The Q-PCR primer sequence is summarized in the following table.
 Supplementary Table 1. The Q-PCR primer sequence is summarized in the following table. Name Sequence (5-3 ) Application Flag-u ggactacaaggacgacgatgac Shared upstream primer for all the amplifications of
S156AT168AY175A (AAA) were purified as GST-fusion proteins and incubated with GSTfused
 were purified as GST-fusion proteins and incubated with GSTfused") 1 2 3 4 5 6 7 8 9 10 11 12 13 14 15 16 17 18 19 20 21 22 23 24 25 26 27 28 Supplemental Materials Supplemental Figure S1 (a) Phenotype of the wild type and grik1-2 grik2-1 plants after 8 days in darkness.
1 2 3 4 5 6 7 8 9 10 11 12 13 14 15 16 17 18 19 20 21 22 23 24 25 26 27 28 Supplemental Materials Supplemental Figure S1 (a) Phenotype of the wild type and grik1-2 grik2-1 plants after 8 days in darkness.
BS 50 Genetics and Genomics Week of Oct 24
 BS 50 Genetics and Genomics Week of Oct 24 Additional Practice Problems for Section Question 1: The following table contains a list of statements that apply to replication, transcription, both, or neither.
Virus-induced gene complementation reveals a transcription factor network in modulation of tomato fruit ripening
 Supplementary Information Virus-induced gene complementation reveals a transcription factor network in modulation of tomato fruit ripening Tao Zhou 2,3, Hang Zhang 2,4, Tongfei Lai 1, Cheng Qin 1, Nongnong