Comp/Phys/APSc 715. Example Videos. Administrative 4/17/2014. Bioinformatics Visualization. Vis 2013, Schindler. Matlab bioinformatics toolbox
|
|
|
- Marcus Warren
- 6 years ago
- Views:
Transcription
1 Comp/Phys/APSc 715 Bioinformatics Visualization Example Videos Vis 2013, Schindler Lagrangian coherent structures in flow Matlab bioinformatics toolbox s-toolbox-overview html Administrative Presentations next week Briefdata and goal intro Describe ideal design What perceptual characteristics help user do task? Why parameters chosen (color map, viewpoint)? Consider second-best approach Describe implementation if any (and demo) Evaluation plan or report 1
2 Administrative Final Project Turn-in Due 7PM, Tuesday April 29 th Written report Described in link from schedule page Example sent out earlier Videos and Paraview State Files Upload to FTP server Or DropBoxand tell me where to find Demo to me and scientist At or before the final turn-in 4 Introduction Bioinformatics Applying CS algorithms to biological problems Examples Protein folding Gene mapping Gigantic data sets 5 What's in this lecture IEEE InfoVisspecial issue on Bioinformatics Visualization 2005, volume 4, no. 3 Other information from recent pubs/web Visualization of: Microarray data (***) Gene sequences Taxonomies Biological pathways 6 2

 Measure expression level of probes in a sample.")
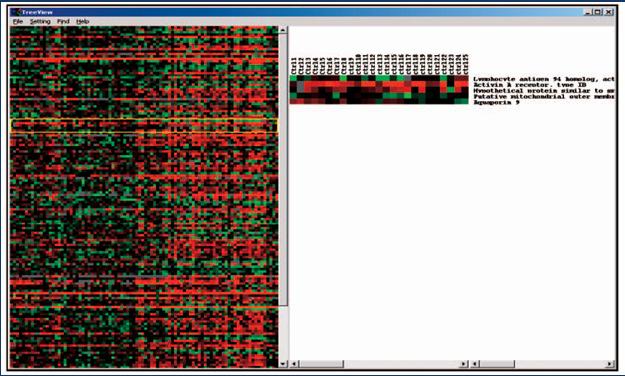
3 Warning: IANAB I am not a biologist Array of probes (e.g. bits of genes) Measure expression level of probes in a sample. relative or absolute Youtube video Microarray Data Microarray Data + Score Gehlenborg et al. Default red-blackgreen map for expression over trial. 3


 Overview, color coding for categorization.")
4 Microarray Data + Score Gehlenborg et al. Default red-blackgreen map for expression over trial. Blue channel for relevance/score Uncertainty vis-ish. Microarray Data + Score Gehlenborg et al. Default red-blackgreen map for expression vs. condition. Blue channel for relevance/score Uncertainty vis-ish. Height by gene score. A) Extra cols. B) Overview, color coding for categorization. C) PC plots D) Height scaling 4


5 Log scaling Most visualizations of microarray data are log-scaled Changes in expression level are smaller for smaller values 13 Selecting Similar Time Behavior TimeSearcher U. Maryland HCI lab 15 5
 2) Pick a time")
 3) Compute derivative scatter plot")
6 Animated Scatter Plots(1) Parallel Coordinates at one time 16 Animated Scatter Plots(2) 2) Pick a time interval Scatter plot X and Y derived 17 Animated Scatter Plots(3) 3) Compute derivative scatter plot 18 6
7 Animated Scatter Plots(4) 4) Animate (move interval) 19 Hierarchical Cluster Explorer Seoet al. Find genes that have similar function Height of join = difference between subclusters Increasing Difference between groups 21 7

8 HCE: minimum similarity slider Changes number of points 22 HCE: minimum similarity slider Changes number of points 23 HCE: linked scatter plot 24 8

9 HCE: Detail Cutoff Bar How to deal with too much detail? Merge clusters below a size threshold Represent w/ average color 25 HCE: algorithm comparison Comparing clustering algorithms for the highlighted region 26 9

 28 Visualizing an entire genome Chromosome Gene Genome Probe 29 Chromosome View (1) Thin = centromeres, variables,")
10 acgh Visualization Array Comparative Genomic Hybridization Genome-wide, high resolution copy numbers Copy number variation: Segment of DNA with different numbers of copies between genomes. Within patient (two halves of diploid) Between patient (tumor vs. non-tumor) 28 Visualizing an entire genome Chromosome Gene Genome Probe 29 Chromosome View (1) Thin = centromeres, variables, cytobands, other White = 0-1SD Light Gray = 1-2SD Dark Gray = 2-3SD Dots = samples x=scaled ratio Line = windowed moving average 10


11 Light blue bars are Z scores # SDs from mean ~ # outliers / inliers Chromosome View (2) 17 breast cancer cell lines Aberration Map 11
12 How do we know if they work? Discussion 34 Insight User Study Count # of insights made by users Insight: an individual observation about the data by the participant, a unit of discovery Characteristics: Time, domain value, hypotheses, expectedness, correctness, breadth, category Quantification via expert 35 Experimental Setup 5 Tools Research: Clusterview, TimeSearcher, HCE Commercial: Spotfire, GeneSpring 3 Microarray Data sets Timeseries data set five time-points Virus data set (Categorical) three viral strains Lupus data set (Multicategorical) 42 healthy, 48 patients Participants only used tools they hadn't seen before


13 37 ClusterView 38 TimeSearcher 39 13


14 (H)ierarchical(C)luster (E)xplorer 40 GeneSpring 41 SpotFire 42 14

15 Learning Curves 43 Anecdotal Results Winner was specific to data set Clusterview Lupus TimeSearcher time series HCE viral SpotFire decent for all Specific/free vs. general/commercial General == no biological context Tying in literature search is good Poor usability can break good visualization Motivation! People learn faster if they care. 44 Where to go from here Lit search +++ Standardization High throughput data Microarray data needs pathway data for context Focus+context 45 15


16 Other topics Biological pathway visualization Sequence visualization Taxonomy visualization 47 Biological Pathways networks of complex reactions at the molecular level in living cells 16
17 Survey of Popular Techniques Saraiya et al. Requirements analysis Anecdotal system evaluations Research agenda (future work) 49 General Goals recognition of changes between experiment vs control or between time points detection of changes in relationship between components of a pathway or between entire pathways identification of global patterns across a pathway mapping pathway state to phenotype (observable effects at the physical level in living organisms) or other biological information 50 Detailed Requirements Construct and update Context Uncertainty Collaboration Pathway node and edge info. Source Spatial information Temporal information High-throughput data Overview Interconnectivity Multi-scale Notebook 17


18 BioCarta 52 Building pathways Easy to use But nobody wants to Statistical pathway comparison for different treatments microarray data Animated node color Different treatments GeneMapp Cytoscape Microarray + pathway data Customizable everything CS-centric Generic network vis UI complaints 18


19 GScope Fish-eye lens confusing Heat-map microarray table icons Distortions made condition comparison hard PathwayAssist: Literature Search Manual pathway building Automatic pathway building NLP over PubMed or ResNet Requires curation Scientific refs. Small database Geared toward cells Regions make biological sense Nucleus,cytoplasm, etc. Patika 19

20 GeneSpring 58 Conclusions Not enough domain-specific info access important for construction (NLP) Context in visualization cell structures, molecular state No standardization Better microarray incorporation 59 20


21 Near-optimal Protein Alignment Smoot et al., animate relationships between two proteins 61 Path Graphs 62 All Together Now 63 21


22 Taxonomy Visualization Graham and Kennedy -Synonomy, Structural Markers 65 Revisions 66 22


23 Comparing Selections Selection % Area Slider 69 23


24 70 Multiscale Trajectory Data Martin Luboschik, Biovis 2012 Compare a signal across time scales Select heterogeneous regions: (small!= large) and mark Shows where details differ Enable drill-down 71 ADVISe:Changes in enzyme annotation Sabrina A. Silveira, Biovis 2012 Annotation difference between releases UniProt/SwissProt database Red/blue is above/below; beige unchanged Area (log) scaled to show value Image is link to movie 72 24


25 Gene-RiViT: Gene Neighborhoods Adam Price, Biovis 2012 Gene position compared to reference strain Diagonal is same Nominal color = strain Can select organism Can zoom 73 enroute: Biological Pathways Christian Partl, Biovis 2012 Hovering selects regulation pathways Detailed view shown for these pathways Image is link to movie
26 This Course: Range of Topics Available Visualization Techniques 2D scalar, 3D scalar, Vector, Tensor, Multivariate InfoVis, BioInformatics Visual Perception How do you pick from all the options? Advanced ParaView Techniques Working as a team for a client Client feedback, peer feedback, team contracts 76 What You Did (for your CV) 10 Designs for real-world data sets 5 team designs for homework 2 rounds of team design for a client (final project) Several in-class designs 16 Design critiques Formal Evaluation of visualization design 77 How Did I Do? Evaluations Look for the with the link soon! Which were the most-useful parts? Team design exercises? In-depth final projects? In-class designs? Particular lectures? Which seem to be the least-useful parts? Suggestions for improvement 78 26
Comp/Phys/Mtsc 715. Example Videos. Administrative 4/12/2012. Bioinformatics Visualization. Vis 2005, Bertram. Vis 2005, Cantarel(tighten.
 Comp/Phys/Mtsc 715 Bioinformatics Visualization Example Videos Vis 2005, Bertram Visualizing sound wavefront propagation Vis 2005, Cantarel(tighten.mov) Visualizing self contact in tightening knots Administrative
Research Powered by Agilent s GeneSpring
 Research Powered by Agilent s GeneSpring Agilent Technologies, Inc. Carolina Livi, Bioinformatics Segment Manager Research Powered by GeneSpring Topics GeneSpring (GS) platform New features in GS 13 What
Visualizing biological pathways: requirements analysis, systems evaluation and research agenda
 (2005), 1 15 & 2005 Palgrave Macmillan Ltd. All rights reserved 1473-8716 $30.00 www.palgrave-journals.com/ivs Visualizing biological pathways: requirements analysis, systems evaluation and research agenda
Microarray Data Analysis in GeneSpring GX 11. Month ##, 200X
 Microarray Data Analysis in GeneSpring GX 11 Month ##, 200X Agenda Genome Browser GO GSEA Pathway Analysis Network building Find significant pathways Extract relations via NLP Data Visualization Options
Measuring gene expression
 Measuring gene expression Grundlagen der Bioinformatik SS2018 https://www.youtube.com/watch?v=v8gh404a3gg Agenda Organization Gene expression Background Technologies FISH Nanostring Microarrays RNA-seq
Agilent GeneSpring GX 10: Beyond. Pam Tangvoranuntakul Product Manager, GeneSpring October 1, 2008
 Agilent GeneSpring GX 10: Gene Expression and Beyond Pam Tangvoranuntakul Product Manager, GeneSpring October 1, 2008 GeneSpring GX 10 in the News Our Goals for GeneSpring GX 10 Goal 1: Bring back GeneSpring
Analysis of Microarray Data
 Analysis of Microarray Data Lecture 3: Visualization and Functional Analysis George Bell, Ph.D. Senior Bioinformatics Scientist Bioinformatics and Research Computing Whitehead Institute Outline Review
Analysis of Microarray Data
 Analysis of Microarray Data Lecture 3: Visualization and Functional Analysis George Bell, Ph.D. Bioinformatics Scientist Bioinformatics and Research Computing Whitehead Institute Outline Review Visualizing
Gene expression analysis: Introduction to microarrays
 Gene expression analysis: Introduction to microarrays Adam Ameur The Linnaeus Centre for Bioinformatics, Uppsala University February 15, 2006 Overview Introduction Part I: How a microarray experiment is
CS 5984: Application of Basic Clustering Algorithms to Find Expression Modules in Cancer
 CS 5984: Application of Basic Clustering Algorithms to Find Expression Modules in Cancer T. M. Murali January 31, 2006 Innovative Application of Hierarchical Clustering A module map showing conditional
Vials - VIsualizing ALternative splicing of genes. By: Louie Dinh
 Vials - VIsualizing ALternative splicing of genes By: Louie Dinh Biology! I m going to have to explain a bit about the cell works before the paper makes any sense. Central Dogma [For Computer Scientists]
Microarrays & Gene Expression Analysis
 Microarrays & Gene Expression Analysis Contents DNA microarray technique Why measure gene expression Clustering algorithms Relation to Cancer SAGE SBH Sequencing By Hybridization DNA Microarrays 1. Developed
Knowledge-Guided Analysis with KnowEnG Lab
 Han Sinha Song Weinshilboum Knowledge-Guided Analysis with KnowEnG Lab KnowEnG Center Powerpoint by Charles Blatti Knowledge-Guided Analysis KnowEnG Center 2017 1 Exercise In this exercise we will be doing
Agilent CytoGenomics 2.0
 For Detection ti of CNC, LOH and UPD New algorithms for CGH+SNP analysis of hematological tumor and constitutional samples Arne IJpma, Ph.D. Product Manager CytoGenomics free trial @ https://earray.chem.agilent.com/earray/
ECS 234: Introduction to Computational Functional Genomics ECS 234
 : Introduction to Computational Functional Genomics Administrativia Prof. Vladimir Filkov 3023 Kemper filkov@cs.ucdavis.edu Appts: Office Hours: Wednesday, 1:30-3p Ask me or email me any time for appt
Introduction to Microarray Technique, Data Analysis, Databases Maryam Abedi PhD student of Medical Genetics
 Introduction to Microarray Technique, Data Analysis, Databases Maryam Abedi PhD student of Medical Genetics abedi777@ymail.com Outlines Technology Basic concepts Data analysis Printed Microarrays In Situ-Synthesized
Next-Generation Sequencing Gene Expression Analysis Using Agilent GeneSpring GX
 Next-Generation Sequencing Gene Expression Analysis Using Agilent GeneSpring GX Technical Overview Introduction RNA Sequencing (RNA-Seq) is one of the most commonly used next-generation sequencing (NGS)
Determining presence/absence threshold for your dataset
 Determining presence/absence threshold for your dataset In PanCGHweb there are two ways to determine the presence/absence calling threshold. One is based on Receiver Operating Curves (ROC) generated for
Gene Expression Data Analysis
 Gene Expression Data Analysis Bing Zhang Department of Biomedical Informatics Vanderbilt University bing.zhang@vanderbilt.edu BMIF 310, Fall 2009 Gene expression technologies (summary) Hybridization-based
Result Tables The Result Table, which indicates chromosomal positions and annotated gene names, promoter regions and CpG islands, is the best way for
 Result Tables The Result Table, which indicates chromosomal positions and annotated gene names, promoter regions and CpG islands, is the best way for you to discover methylation changes at specific genomic
Web-based tools for Bioinformatics; A (free) introduction to (freely available) NCBI, MUSC and World-wide.
 introduction to (freely available) NCBI, MUSC and World-wide.") Page 1 of 24 Web-based tools for Bioinformatics; A (free) introduction to (freely available) NCBI, MUSC and World-wide. When and Where---Wednesdays at 1pm-2pmRoom 438 Library Admin Building Beginning September
Page 1 of 24 Web-based tools for Bioinformatics; A (free) introduction to (freely available) NCBI, MUSC and World-wide. When and Where---Wednesdays at 1pm-2pmRoom 438 Library Admin Building Beginning September
Tools for visual analysis of biological networks
 Tools for visual analysis of biological networks Anton Zoubarev December 18 th, 2009 Abstract: The trend in tools for visualization and analysis of cell pathways is to go beyond small-scale static depictions
Agilent Genomic Workbench 7.0
 Agilent Genomic Workbench 7.0 Product Overview Guide Agilent Technologies Notices Agilent Technologies, Inc. 2012, 2015 No part of this manual may be reproduced in any form or by any means (including electronic
Biology 644: Bioinformatics
 Processes Activation Repression Initiation Elongation.... Processes Splicing Editing Degradation Translation.... Transcription Translation DNA Regulators DNA-Binding Transcription Factors Chromatin Remodelers....
Bioinformatics. Microarrays: designing chips, clustering methods. Fran Lewitter, Ph.D. Head, Biocomputing Whitehead Institute
 Bioinformatics Microarrays: designing chips, clustering methods Fran Lewitter, Ph.D. Head, Biocomputing Whitehead Institute Course Syllabus Jan 7 Jan 14 Jan 21 Jan 28 Feb 4 Feb 11 Feb 18 Feb 25 Sequence
ChIP-seq and RNA-seq. Farhat Habib
 ChIP-seq and RNA-seq Farhat Habib fhabib@iiserpune.ac.in Biological Goals Learn how genomes encode the diverse patterns of gene expression that define each cell type and state. Protein-DNA interactions
The first and only fully-integrated microarray instrument for hands-free array processing
 The first and only fully-integrated microarray instrument for hands-free array processing GeneTitan Instrument Transform your lab with a GeneTitan Instrument and experience the unparalleled power of streamlining
ECS 234: Introduction to Computational Functional Genomics ECS 234
 : Introduction to Computational Functional Genomics Administrativia Prof. Vladimir Filkov 3023 Kemper filkov@cs.ucdavis.edu Appts: Office Hours: M,W, 3-4pm, and by appt. , 4 credits, CRN: 54135 http://www.cs.ucdavis.edu~/filkov/234/
RNA-Seq Analysis. August Strand Genomics, Inc All rights reserved.
 RNA-Seq Analysis August 2014 Strand Genomics, Inc. 2014. All rights reserved. Contents Introduction... 3 Sample import... 3 Quantification... 4 Novel exon... 5 Differential expression... 12 Differential
NCBI web resources I: databases and Entrez
 NCBI web resources I: databases and Entrez Yanbin Yin Most materials are downloaded from ftp://ftp.ncbi.nih.gov/pub/education/ 1 Homework assignment 1 Two parts: Extract the gene IDs reported in table
Chromosome-scale scaffolding of de novo genome assemblies based on chromatin interactions. Supplementary Material
 Chromosome-scale scaffolding of de novo genome assemblies based on chromatin interactions Joshua N. Burton 1, Andrew Adey 1, Rupali P. Patwardhan 1, Ruolan Qiu 1, Jacob O. Kitzman 1, Jay Shendure 1 1 Department
Data Mining for Biological Data Analysis
 Data Mining for Biological Data Analysis Data Mining and Text Mining (UIC 583 @ Politecnico di Milano) References Data Mining Course by Gregory-Platesky Shapiro available at www.kdnuggets.com Jiawei Han
OncoMD User Manual Version 2.6. OncoMD: Cancer Analytics Platform
 OncoMD: Cancer Analytics Platform 1 Table of Contents 1. INTRODUCTION... 3 2. OVERVIEW OF ONCOMD... 3 3. ORGANIZATION OF INFORMATION IN ONCOMD... 3 4. GETTING STARTED... 6 4.1 USER AUTHENTICATION... 6
Introduction to BIOINFORMATICS
 COURSE OF BIOINFORMATICS a.a. 2016-2017 Introduction to BIOINFORMATICS What is Bioinformatics? (I) The sinergy between biology and informatics What is Bioinformatics? (II) From: http://www.bioteach.ubc.ca/bioinfo2010/
BIOINF/BENG/BIMM/CHEM/CSE 184: Computational Molecular Biology. Lecture 2: Microarray analysis
 BIOINF/BENG/BIMM/CHEM/CSE 184: Computational Molecular Biology Lecture 2: Microarray analysis Genome wide measurement of gene transcription using DNA microarray Bruce Alberts, et al., Molecular Biology
Analysis of a Proposed Universal Fingerprint Microarray
 Analysis of a Proposed Universal Fingerprint Microarray Michael Doran, Raffaella Settimi, Daniela Raicu, Jacob Furst School of CTI, DePaul University, Chicago, IL Mathew Schipma, Darrell Chandler Bio-detection
3.1.4 DNA Microarray Technology
 3.1.4 DNA Microarray Technology Scientists have discovered that one of the differences between healthy and cancer is which genes are turned on in each. Scientists can compare the gene expression patterns
Introduction to Bioinformatics and Gene Expression Technology
 Vocabulary Introduction to Bioinformatics and Gene Expression Technology Utah State University Spring 2014 STAT 5570: Statistical Bioinformatics Notes 1.1 Gene: Genetics: Genome: Genomics: hereditary DNA
Philippe Hupé 1,2. The R User Conference 2009 Rennes
 A suite of R packages for the analysis of DNA copy number microarray experiments Application in cancerology Philippe Hupé 1,2 1 UMR144 Institut Curie, CNRS 2 U900 Institut Curie, INSERM, Mines Paris Tech
Introduction to Bioinformatics
 Introduction to Bioinformatics If the 19 th century was the century of chemistry and 20 th century was the century of physic, the 21 st century promises to be the century of biology...professor Dr. Satoru
Comparative Genomic Hybridization
 Comparative Genomic Hybridization Srikesh G. Arunajadai Division of Biostatistics University of California Berkeley PH 296 Presentation Fall 2002 December 9 th 2002 OUTLINE CGH Introduction Methodology,
Bioinformatics for Biologists
 Bioinformatics for Biologists Functional Genomics: Microarray Data Analysis Fran Lewitter, Ph.D. Head, Biocomputing Whitehead Institute Outline Introduction Working with microarray data Normalization Analysis
BIMM 143: Introduction to Bioinformatics (Winter 2018)
") BIMM 143: Introduction to Bioinformatics (Winter 2018) Course Instructor: Dr. Barry J. Grant ( bjgrant@ucsd.edu ) Course Website: https://bioboot.github.io/bimm143_w18/ DRAFT: 2017-12-02 (20:48:10 PST
BIMM 143: Introduction to Bioinformatics (Winter 2018) Course Instructor: Dr. Barry J. Grant ( bjgrant@ucsd.edu ) Course Website: https://bioboot.github.io/bimm143_w18/ DRAFT: 2017-12-02 (20:48:10 PST
Measuring and Understanding Gene Expression
 Measuring and Understanding Gene Expression Dr. Lars Eijssen Dept. Of Bioinformatics BiGCaT Sciences programme 2014 Why are genes interesting? TRANSCRIPTION Genome Genomics Transcriptome Transcriptomics
KnetMiner USER TUTORIAL
 KnetMiner USER TUTORIAL Keywan Hassani-Pak ROTHAMSTED RESEARCH 10 NOVEMBER 2017 About KnetMiner KnetMiner, with a silent "K" and standing for Knowledge Network Miner, is a suite of open-source software
Lecture 8: Predicting and analyzing metagenomic composition from 16S survey data
 Lecture 8: Predicting and analyzing metagenomic composition from 16S survey data What can we tell about the taxonomic and functional stability of microbiota? Why? Nature. 2012; 486(7402): 207 214. doi:10.1038/nature11234
ChIP-seq and RNA-seq
 ChIP-seq and RNA-seq Biological Goals Learn how genomes encode the diverse patterns of gene expression that define each cell type and state. Protein-DNA interactions (ChIPchromatin immunoprecipitation)
Gene expression analysis. Biosciences 741: Genomics Fall, 2013 Week 5. Gene expression analysis
 Gene expression analysis Biosciences 741: Genomics Fall, 2013 Week 5 Gene expression analysis From EST clusters to spotted cdna microarrays Long vs. short oligonucleotide microarrays vs. RT-PCR Methods
DNA. bioinformatics. genomics. personalized. variation NGS. trio. custom. assembly gene. tumor-normal. de novo. structural variation indel.
 DNA Sequencing T TM variation DNA amplicon mendelian trio genomics NGS bioinformatics tumor-normal custom SNP resequencing target validation de novo prediction personalized comparative genomics exome private
Microarray Technique. Some background. M. Nath
 Microarray Technique Some background M. Nath Outline Introduction Spotting Array Technique GeneChip Technique Data analysis Applications Conclusion Now Blind Guess? Functional Pathway Microarray Technique
Quality Control Assessment in Genotyping Console
 Quality Control Assessment in Genotyping Console Introduction Prior to the release of Genotyping Console (GTC) 2.1, quality control (QC) assessment of the SNP Array 6.0 assay was performed using the Dynamic
Introduction to Microarray Analysis
 Introduction to Microarray Analysis Methods Course: Gene Expression Data Analysis -Day One Rainer Spang Microarrays Highly parallel measurement devices for gene expression levels 1. How does the microarray
Cell Stem Cell, volume 9 Supplemental Information
 Cell Stem Cell, volume 9 Supplemental Information Large-Scale Analysis Reveals Acquisition of Lineage-Specific Chromosomal Aberrations in Human Adult Stem Cells Uri Ben-David, Yoav Mayshar, and Nissim
TUTORIAL. Revised in Apr 2015
 TUTORIAL Revised in Apr 2015 Contents I. Overview II. Fly prioritizer Function prioritization III. Fly prioritizer Gene prioritization Gene Set Analysis IV. Human prioritizer Human disease prioritization
Identification of biological themes in microarray data from a mouse heart development time series using GeneSifter
 Identification of biological themes in microarray data from a mouse heart development time series using GeneSifter VizX Labs, LLC Seattle, WA 98119 Abstract Oligonucleotide microarrays were used to study
Introduction to RNA-Seq in GeneSpring NGS Software
 Introduction to RNA-Seq in GeneSpring NGS Software Dipa Roy Choudhury, Ph.D. Strand Scientific Intelligence and Agilent Technologies Learn more at www.genespring.com Introduction to RNA-Seq In a few years,
Tutorial. Primer Design. Sample to Insight. November 27, 2015
 Primer Design November 27, 2015 Sample to Insight CLC bio, a QIAGEN Company Silkeborgvej 2 Prismet 8000 Aarhus C Denmark Telephone: +45 70 22 32 44 www.clcbio.com support-clcbio@qiagen.com Primer Design
Estimating Cell Cycle Phase Distribution of Yeast from Time Series Gene Expression Data
 2011 International Conference on Information and Electronics Engineering IPCSIT vol.6 (2011) (2011) IACSIT Press, Singapore Estimating Cell Cycle Phase Distribution of Yeast from Time Series Gene Expression
AGILENT S BIOINFORMATICS ANALYSIS SOFTWARE
 ACCELERATING PROGRESS IS IN OUR GENES AGILENT S BIOINFORMATICS ANALYSIS SOFTWARE GENESPRING GENE EXPRESSION (GX) MASS PROFILER PROFESSIONAL (MPP) PATHWAY ARCHITECT (PA) See Deeper. Reach Further. BIOINFORMATICS
Nature Methods: doi: /nmeth.3732
 Supplementary Figure 1 GenomeSpace allows the biologist user to conduct complex analysis. 1a. Flow chart of our analytic approach to dissecting a stem cell-like gene regulatory network in human cancers.
BIOINFORMATICS AND SYSTEM BIOLOGY (INTERNATIONAL PROGRAM)
") BIOINFORMATICS AND SYSTEM BIOLOGY (INTERNATIONAL PROGRAM) PROGRAM TITLE DEGREE TITLE Master of Science Program in Bioinformatics and System Biology (International Program) Master of Science (Bioinformatics
BIOINFORMATICS AND SYSTEM BIOLOGY (INTERNATIONAL PROGRAM) PROGRAM TITLE DEGREE TITLE Master of Science Program in Bioinformatics and System Biology (International Program) Master of Science (Bioinformatics
IPA Advanced Training Course
 IPA Advanced Training Course Academia Sinica 2015 Oct Gene( 陳冠文 ) Supervisor and IPA certified analyst 1 Review for Introductory Training course Searching Building a Pathway Editing a Pathway for Publication
Gene expression microarrays and assays. Because your results can t wait
 Gene expression microarrays and assays Because your results can t wait A simple path from data to decision-making The power of expression microarrays Transcriptome-wide analysis can be complex. Matching
Just the Facts: A Basic Introduction to the Science Underlying NCBI Resources
 National Center for Biotechnology Information About NCBI NCBI at a Glance A Science Primer Human Genome Resources Model Organisms Guide Outreach and Education Databases and Tools News About NCBI Site Map
PrimerArray Analysis Tool Ver. 2.2
 For Research Use PrimerArray Analysis Tool Ver. 2.2 Manual Table of Contents I. Calculating and exporting Ct values... 3 II. Relative quantification... 4 III. Troubleshooting...10 2 URL:http://www.takara-bio.com
Engineering Genetic Circuits
 Engineering Genetic Circuits I use the book and slides of Chris J. Myers Lecture 0: Preface Chris J. Myers (Lecture 0: Preface) Engineering Genetic Circuits 1 / 19 Samuel Florman Engineering is the art
Cover Page. The handle holds various files of this Leiden University dissertation.
 Cover Page The handle http://hdl.handle.net/1887/22550 holds various files of this Leiden University dissertation. Author: Yan, Kuan Title: Image analysis and platform development for automated phenotyping
Course Information. Introduction to Algorithms in Computational Biology Lecture 1. Relations to Some Other Courses
 Course Information Introduction to Algorithms in Computational Biology Lecture 1 Meetings: Lecture, by Dan Geiger: Mondays 16:30 18:30, Taub 4. Tutorial, by Ydo Wexler: Tuesdays 10:30 11:30, Taub 2. Grade:
Genetics and Bioinformatics
 Genetics and Bioinformatics Kristel Van Steen, PhD 2 Montefiore Institute - Systems and Modeling GIGA - Bioinformatics ULg kristel.vansteen@ulg.ac.be Lecture 1: Setting the pace 1 Bioinformatics what s
mrna Sequencing Quality Control (V6)
") mrna Sequencing Quality Control (V6) Notes: the following analyses are based on 8 adult brains sequenced in USC and Yale 1. Error Rates The error rates of each sequencing cycle are reported for 120 tiles
mrna Sequencing Quality Control (V6) Notes: the following analyses are based on 8 adult brains sequenced in USC and Yale 1. Error Rates The error rates of each sequencing cycle are reported for 120 tiles
The first thing you will see is the opening page. SeqMonk scans your copy and make sure everything is in order, indicated by the green check marks.
 Open Seqmonk Launch SeqMonk The first thing you will see is the opening page. SeqMonk scans your copy and make sure everything is in order, indicated by the green check marks. SeqMonk Analysis Page 1 Create
Classification in Parkinson s disease. ABDBM (c) Ron Shamir
 Ron Shamir") Classification in Parkinson s disease 1 Parkinson s Disease The 2nd most common neurodegenerative disorder Impairs motor skills, speech, smell, cognition 1-3 sick per 1 >1% in individuals aged above 7
Classification in Parkinson s disease 1 Parkinson s Disease The 2nd most common neurodegenerative disorder Impairs motor skills, speech, smell, cognition 1-3 sick per 1 >1% in individuals aged above 7
Welcome! Introduction to High Throughput Genomics December Norwegian Microarray Consortium FUGE Bioinformatics platform
 Introduction to High Throughput Genomics December 2011 Norwegian Microarray Consortium FUGE Bioinformatics platform Rita Holdhus Kjell Petersen Welcome! Course program Day 1 Thursday 1st December 2011
VALLIAMMAI ENGINEERING COLLEGE
 VALLIAMMAI ENGINEERING COLLEGE SRM Nagar, Kattankulathur 603 203 DEPARTMENT OF COMPUTER SCIENCE AND ENGINEERING QUESTION BANK VII SEMESTER BM6005 BIO INFORMATICS Regulation 2013 Academic Year 2018-19 Prepared
Introduction to Algorithms in Computational Biology Lecture 1
 Introduction to Algorithms in Computational Biology Lecture 1 Background Readings: The first three chapters (pages 1-31) in Genetics in Medicine, Nussbaum et al., 2001. This class has been edited from
Gene List Enrichment Analysis
 Outline Gene List Enrichment Analysis George Bell, Ph.D. BaRC Hot Topics March 16, 2010 Why do enrichment analysis? Main types Selecting or ranking genes Annotation sources Statistics Remaining issues
ELE4120 Bioinformatics. Tutorial 5
 ELE4120 Bioinformatics Tutorial 5 1 1. Database Content GenBank RefSeq TPA UniProt 2. Database Searches 2 Databases A common situation for alignment is to search through a database to retrieve the similar
Gene Regulation Solutions. Microarrays and Next-Generation Sequencing
 Gene Regulation Solutions Microarrays and Next-Generation Sequencing Gene Regulation Solutions The Microarrays Advantage Microarrays Lead the Industry in: Comprehensive Content SurePrint G3 Human Gene
Measuring gene expression (Microarrays) Ulf Leser
 Ulf Leser") Measuring gene expression (Microarrays) Ulf Leser This Lecture Gene expression Microarrays Idea Technologies Problems Quality control Normalization Analysis next week! 2 http://learn.genetics.utah.edu/content/molecules/transcribe/
Measuring gene expression (Microarrays) Ulf Leser This Lecture Gene expression Microarrays Idea Technologies Problems Quality control Normalization Analysis next week! 2 http://learn.genetics.utah.edu/content/molecules/transcribe/
Bioinformatics for Biologists
 Bioinformatics for Biologists Microarray Data Analysis. Lecture 1. Fran Lewitter, Ph.D. Director Bioinformatics and Research Computing Whitehead Institute Outline Introduction Working with microarray data
Standard Data Analysis Report Agilent Gene Expression Service
 Standard Data Analysis Report Agilent Gene Expression Service Experiment: S534662 Date: 2011-01-01 Prepared for: Dr. Researcher Genomic Sciences Lab Prepared by S534662 Standard Data Analysis Report 2011-01-01
Discriminant models for high-throughput proteomics mass spectrometer data
 Proteomics 2003, 3, 1699 1703 DOI 10.1002/pmic.200300518 1699 Short Communication Parul V. Purohit David M. Rocke Center for Image Processing and Integrated Computing, University of California, Davis,
Advanced breeding of solanaceous crops using BreeDB
 Part 6 3 rd transplant Training Workshop - October 2014 Exploiting and understanding Solanaceous genomes Advanced breeding of solanaceous crops using BreeDB Richard Finkers Plant Breeding, Wageningen UR
What is Bioinformatics?
 What is Bioinformatics? Bioinformatics is the field of science in which biology, computer science, and information technology merge to form a single discipline. - NCBI The ultimate goal of the field is
Ganatum: a graphical single-cell RNA-seq analysis pipeline
 Ganatum: a graphical single-cell RNA-seq analysis pipeline User Manual February 28, 2017 University of Hawaii 2017 Contents 1. Introduction... 1 2. Upload... 1 3. Batch-effect removal... 4 4. Outlier removal...
Bioinformatics & Protein Structural Analysis. Bioinformatics & Protein Structural Analysis. Learning Objective. Proteomics
 The molecular structures of proteins are complex and can be defined at various levels. These structures can also be predicted from their amino-acid sequences. Protein structure prediction is one of the
Serial Analysis of Gene Expression
 Serial Analysis of Gene Expression Cloning of Tissue-Specific Genes Using SAGE and a Novel Computational Substraction Approach. Genomic (2001) Hung-Jui Shih Outline of Presentation SAGE EST Article TPE
DNA Microarray probe selection. Oksana Lukjancenko, CBS DTU June 2011, KMUTT
 DNA Microarray probe selection Oksana Lukjancenko, CBS DTU June 2011, KMUTT Bacterial Pan-Genome Definition by Tettelin et al.: Pan-genome is a complete collection of various genes located within populations
Humboldt Universität zu Berlin. Grundlagen der Bioinformatik SS Microarrays. Lecture
 Humboldt Universität zu Berlin Microarrays Grundlagen der Bioinformatik SS 2017 Lecture 6 09.06.2017 Agenda 1.mRNA: Genomic background 2.Overview: Microarray 3.Data-analysis: Quality control & normalization
Analyzing an individual sequence in the Sequence Editor
 BioNumerics Tutorial: Analyzing an individual sequence in the Sequence Editor 1 Aim The Sequence editor window is a convenient tool implemented in BioNumerics to edit and analyze nucleotide and amino acid
Basics of RNA-Seq. (With a Focus on Application to Single Cell RNA-Seq) Michael Kelly, PhD Team Lead, NCI Single Cell Analysis Facility
 Michael Kelly, PhD Team Lead, NCI Single Cell Analysis Facility") 2018 ABRF Meeting Satellite Workshop 4 Bridging the Gap: Isolation to Translation (Single Cell RNA-Seq) Sunday, April 22 Basics of RNA-Seq (With a Focus on Application to Single Cell RNA-Seq) Michael Kelly,
2018 ABRF Meeting Satellite Workshop 4 Bridging the Gap: Isolation to Translation (Single Cell RNA-Seq) Sunday, April 22 Basics of RNA-Seq (With a Focus on Application to Single Cell RNA-Seq) Michael Kelly,
Introduction to Bioinformatics and Gene Expression Technologies
 Introduction to Bioinformatics and Gene Expression Technologies Utah State University Fall 2017 Statistical Bioinformatics (Biomedical Big Data) Notes 1 1 Vocabulary Gene: hereditary DNA sequence at a
Introduction to Bioinformatics and Gene Expression Technologies
 Vocabulary Introduction to Bioinformatics and Gene Expression Technologies Utah State University Fall 2017 Statistical Bioinformatics (Biomedical Big Data) Notes 1 Gene: Genetics: Genome: Genomics: hereditary
From Variants to Pathways: Agilent GeneSpring GX s Variant Analysis Workflow
 From Variants to Pathways: Agilent GeneSpring GX s Variant Analysis Workflow Technical Overview Import VCF Introduction Next-generation sequencing (NGS) studies have created unanticipated challenges with
Microarray Informatics
 Microarray Informatics Donald Dunbar MSc Seminar 31 st January 2007 Aims To give a biologist s view of microarray experiments To explain the technologies involved To describe typical microarray experiments
Textbook Reading Guidelines
 Understanding Bioinformatics by Marketa Zvelebil and Jeremy Baum Last updated: May 1, 2009 Textbook Reading Guidelines Preface: Read the whole preface, and especially: For the students with Life Science
Proteomics 6/4/2009 WESTERN BLOT ANALYSIS
 SDS-PAGE (PolyAcrylamide Gel Electrophoresis) Proteomics WESTERN BLOT ANALYSIS Presented by: Nuvee Prapasarakul Veterinary Microbiology Chulalongkorn University Proteomics has been said to be the next
CollecTF Documentation
 CollecTF Documentation Release 1.0.0 Sefa Kilic August 15, 2016 Contents 1 Curation submission guide 3 1.1 Data.................................................... 3 1.2 Before you start.............................................