Scope of Work for: Cayuga Lake Study to Support a Phosphorus TMDL*
|
|
|
- Hubert Nelson
- 6 years ago
- Views:
Transcription


1 Scope of Work for: Cayuga Lake Study to Support a Phosphorus TMDL* modified from Cayuga Lake QAPP Workshop (Jan 30, 2013) 1/15/2014 Upstate Freshwater Institute 1
2 Project Phasing Phase 1 ( ) lake monitoring stream monitoring bioavailability studies limnological analyses mass balance analyses biological community characterizations lake hydrothermal model setup and testing watershed model testing report summarizing study findings recommendations for Phase 2 water quality model Phase 2 ( 2015) in-lake water quality model development in-lake water quality model testing 1/15/2014 Upstate Freshwater Institute 2


3 Field Water Quality Measurements rapid profiling instruments Secchi disc measurements stream sonde measurements 1/15/2014 Upstate Freshwater Institute 3


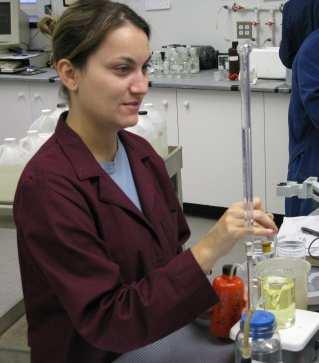
4 Sampling and Laboratory Analysis stream and lake samples 1/15/2014 Upstate Freshwater Institute 4


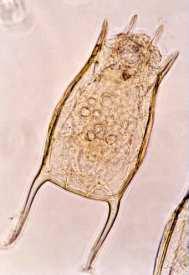

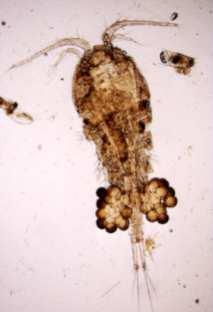
5 Biological Sampling phytoplankton sampling zooplankton sampling dreissenid mussel sampling 1/15/2014 Upstate Freshwater Institute 5


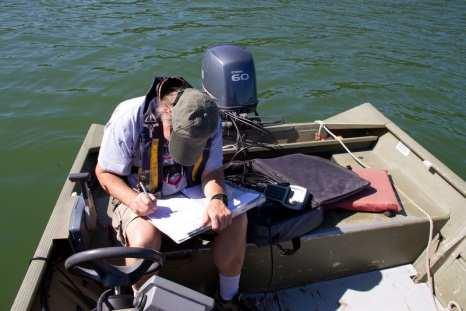
6 In-Lake Sampling 1/15/2014 Upstate Freshwater Institute 6
7 Whole Lake Monitoring Sites 9 in-lake sites 1 site in inlet near mouth 2 times per month, April- October field measurements water collection phytoplankton sampling zooplankton sampling 1/15/2014 Upstate Freshwater Institute 7


8 More Frequent South Monitoring Sites field measurements water collection (less parameters) 1/15/2014 Upstate Freshwater Institute 8
9 In-Lake Instrumentation Measurements No. Parameter Abbrev. Utility 1 temperature T thermal stratification, important model input 2 specific conductance SC conservative tracer 3 field beam attenuation coefficient C 660_f surrogate of Tn, light scattering coefficient and TSS 4 field turbidity Tn_f surrogate of sediment (e.g., suspended particulate material (SPM)), and light scattering coefficient 5 field chlorophyll a Chl_f trophic metric, proxy for phytoplankton biomass 6 scalar irradiance PAR light penetration 1/15/2014 Upstate Freshwater Institute 9
10 In-Lake Instrumentation Measurements example data from Site 5 on May 7 T ( C) Chl (µg/l) Tn (NTU) TP (µg/l) TDP (µg/l) tnh 3 (µg/l) Depth (m) Secchi delivered within 48 hr. of collection to interested stakeholders 1/15/2014 Upstate Freshwater Institute 10
11 Multiple Site Profiles Can Support Spatial Contour Representations Earlier example from 1996 survey 3 LSC 8 0 T ( C) (A) T 30 Depth (m) c(660) (m-1) Chlf (µg l-1) (B) c(660) (C) Chlf Distance from southern end (km) 1/15/2014 Upstate Freshwater Institute 11
12 Laboratory Measurements on Lake Samples phosphorus (P) No. Parameter Abbrev. Utility 1 total phosphorus TP trophic state metric, liming nutrient, quantifies the P pool 2 total dissolved phosphorus TDP available nutrient for phytoplankton 3 soluble reactive phosphorus SRP immediately available nutrient for phytoplankton growth 4 total inorganic phosphorus TIP inorganic phosphorus measured to calculate other pools of phosphorus 1/15/2014 Upstate Freshwater Institute 12
13 Laboratory Measurements on Lake Samples nitrogen (N) No. Parameter Abbrev. Utility 5 nitrate + nitrite NO X used along with NO 2 to calculate NO 3 a phytoplankton nutrient 6 nitrite NO 2 used along with NO X to calculate NO 3 a phytoplankton nutrient 7 total ammonia t-nh 3 phytoplankton nutrient 8 total nitrogen TN quantifies the overall N pool 9 total dissolved nitrogen TDN quantifies the overall dissolved N pool 1/15/2014 Upstate Freshwater Institute 13
14 Laboratory Measurements on Lake Samples carbon/phytoplankton No. Parameter Abbrev. Utility 10 dissolved organic carbon DOC quantify dissolved organic C pool 11 particulate organic carbon POC representation of phytoplankton biomass 12 chlorophyll a Chl trophic metric, proxy for phytoplankton biomass 13 silica DRSi phytoplankton nutrient (diatoms) 14 light attenuation at a wavelength of 254 nm UV 254 surrogate of precursors for disinfection byproduct 1/15/2014 Upstate Freshwater Institute 14
15 Laboratory Measurements on Lake Samples clarity/tracer No. Parameter Abbrev. Purpose 15 turbidity Tn surrogate of sediment (e.g. suspended particulate material (SPM)) and the light scatting coefficient 16 beam attenuation coefficient 17 total suspended solids c 660 TSS surrogate of Tn, light scattering coefficient and TSS gravimetric measure of total sediments 18 fixed suspended solids 19 projected area per unit volume FSS PAV m 20 chloride Cl tracer gravimetric measure of inorganic sediment inorganic particles contribution to turbidity 1/15/2014 Upstate Freshwater Institute 15

16 Intensive Sampling: P X = TP, TDP, SRP O = TIP Features April Oct (1 year) bi-weekly (13 trips) 9 sites Depth (m) Sampling Sites X, O X, O X, O X, O XXX, X, O X, O X, O X, O OOO 5 X X X X X X 10 X, O X, O X, O X, O X, O X, O 20 X X 40 X X 60 X X X X 80 X X 100 X X X 120 X bottom /15/2014 Upstate Freshwater Institute 16 X 7 8 9

17 Less Intensive Sampling X = TDN, TN, Tn, c 660, PAVm (by SAX) Features April Oct (1year) bi-weekly (13 trips) 9 sites Depth (m) bottom Sampling Sites X X X XXX X X 1/15/2014 Upstate Freshwater Institute

")
 Upstate")
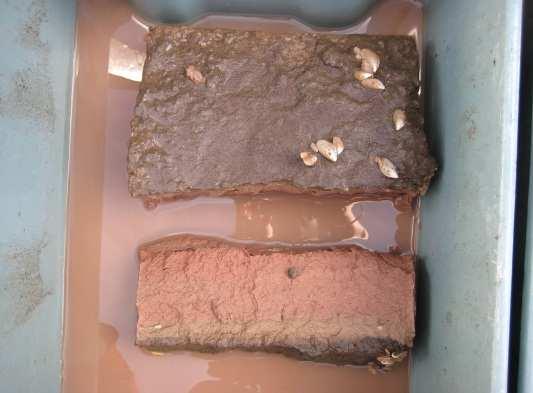
18 Whole Lake Dreissenid Mussel Sampling Sites 100 in-lake sites positioned along 10 transects Zebra Mussel (Dreissena polymorpha) 1/15/2014 Quagga Mussels (Dreissenia rostriformis bugensis) Upstate Freshwater Institute 18


19 Biological Monitoring phytoplankton Professor N. Hairston s lab collections: epilimnion samples 5 sites, below thermocline 3 sites; duplicates preserved subset analyzed, guided by chl a data zooplankton Professor N. Hairston s lab collections at same sites as phytoplankton, vertical hauls preserved subset analyzed dreissenid mussles J. Watkins and L. Rudstam Watkins et al. (2012) surveys, 2006 lake-wide benthic survey, 2013 laboratory excretion rate experiments 1/15/2014 Upstate Freshwater Institute 19


20 Stream Sampling 5 streams 1/15/2014 Upstate Freshwater Institute 20
21 Tributaries to Cayuga Lake Salmon Cr. Taugh. Cr. Fall Cr. Cayuga Inlet Six Mile Cr. 1/15/2014 Upstate Freshwater Institute 21
22 The Selection of Five Streams Selected Streams WS Area Rank Event Based Sampling Gaged Fall Cr. 1 Cayuga Inlet 2 Salmon Cr. 3 Six Mile Cr. 5 No. Streams Taughannock Cr monitored Watershed Area (x1000 ha) fractions of total watershed monitored 5 streams 60% 4 streams (event based) 50% 34 separate watersheds threshold for inclusion of 5 for reasonable program scope selfevident consistent with TMDL focus on shelf 1/15/14 Upstate Freshwater Institute 22
23 Stream Sampling Types fixed frequency (FF) near mouth of stream runoff event (E) sampling using autosamplers near mouth upstream synoptic surveys (SE), selected streams (Fall Creek and Salmon Creek), two events bioavailability 1/15/2014 Upstate Freshwater Institute 23


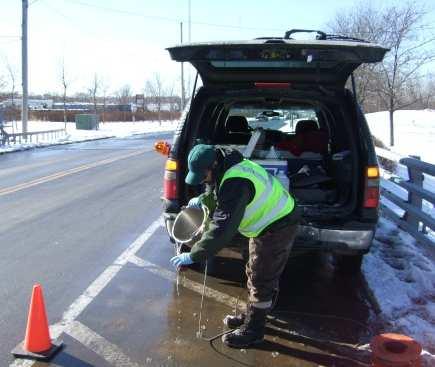
24 Fixed Frequency Stream Sampling twice a month at mouth of Creek grab samples 1/15/2014 Upstate Freshwater Institute 24


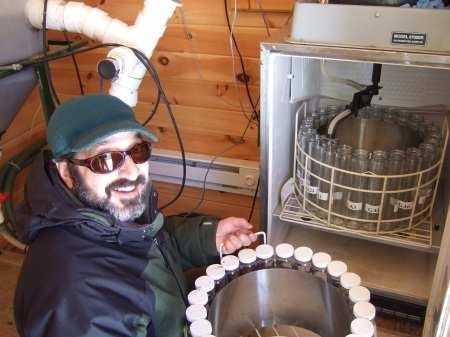
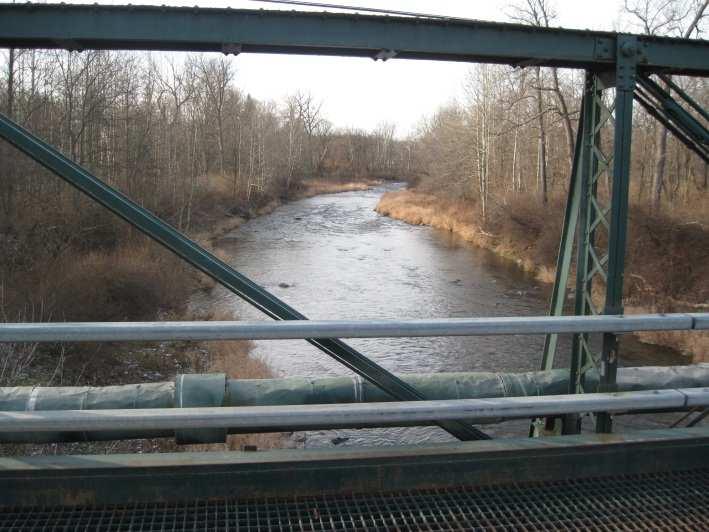
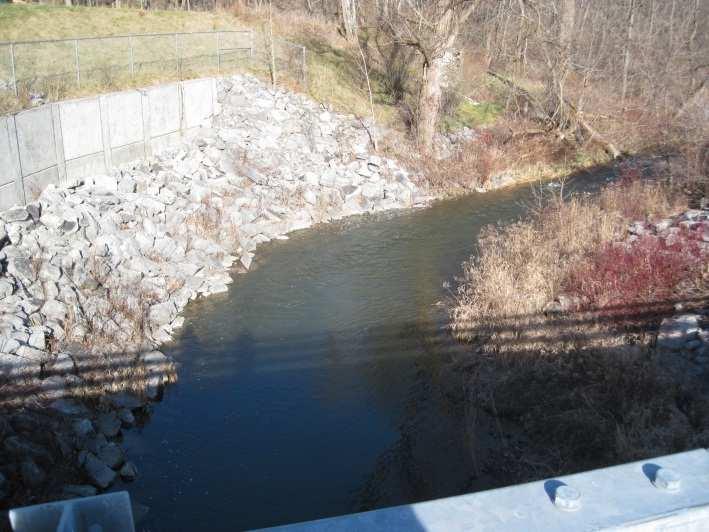
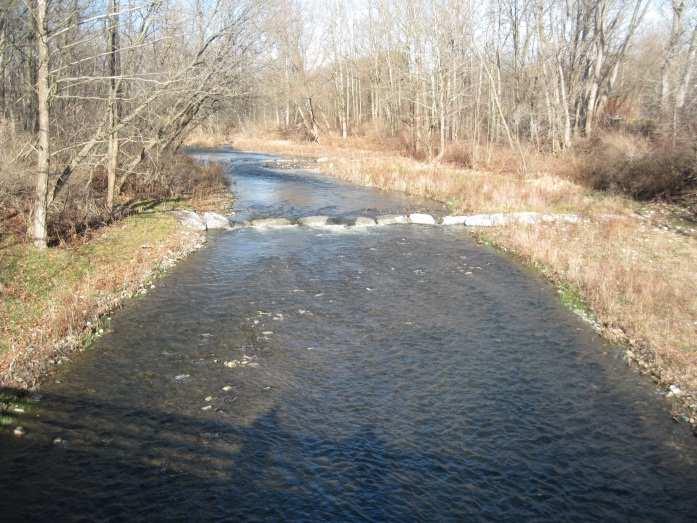
25 Event Stream Sampling at mouth of 4 gaged streams auto sampler inside an enclosure 4 events 1/15/2014 Upstate Freshwater Institute 25


26 Upstream Synoptic Survey mouth site and four upstream sites Salmon Ck. 1 dry weather and two wet weather events five samplings cycles per event 1/15/2014 Upstate Freshwater Institute 26
27 Stream Sampling No. analyte Stream Fall Ck. Cayuga Inlet Salmon Ck. Six Mile Ck. Taughann. Ck. FF E SE FF E FF E SE FF E FF E 1 TP X X X X X X X X X X X 2 TDP X X X X X X X X X X X 3 SRP X X X X X X X X X X X 4 TIP X X X X X X X X X 5 NO x X X X X X X X X X X X 6 t-nh 3 X X X X X X X X X X X 7 DOC X X X X X X X X X 8 UV 254 X X X X X X X X X 9 DRSi X X X X X X X X X 10 Tn X X X X X X X X X X X 11 TSS X X X X X X X X X X X 12 FSS X X X X X X X X X X X 13 PAV m X X X X X X X X X 14 Cl X X X X X X X X X X X 1/15/2014 Upstate Freshwater Institute 27
28 Special Efforts on Phosphorus 1/15/2014 Upstate Freshwater Institute 28
29 Forms of Phosphorus (P) No. Parameter Abbrev. determined relationships 1 total P TP measured TP = TDP +PP TP = TOP + TIP 2 total dissolved P TDP measured TDP = DOP +SRP 3 soluble reactive P SRP measured 4 total inorganic P TIP measured 5 dissolve organic P DOP calculated by difference DOP = TDP - SRP 6 total organic P TOP calculated by difference TOP = TP TIP TOP = DOP + PP O 7 particulate P PP calculated by difference PP = TP - TDP 8 particulate organic P 9 particulate inorganic P frequently measured less frequently measured rarely measured PP o calculated by difference PP O = TOP -DOP PP i calculated by difference PP I = PP - PP O 1/15/2014 Upstate Freshwater Institute 29
30 Example of P Partitioning upper waters Onondaga Lake, Syracuse, NY 30 PP I Phosphorus (µg/l) PP O DOP SRP TP TDP PP Avg 1/15/2014 Upstate Freshwater Institute 30
31 Bioavailability of Forms of Phosphorus SRP immediately and completely available DOP delayed and mostly available PP variable, uncertain, subject to deposition; where PP is an substantial fraction of tributary TP, the associated uncertainty in bioavailability is an important issue clay particles Fractions of PP PP O available through decomposition pathways PP I often low bioavailablity; sorption/ desorption process Clay 1/15/2014 Upstate Freshwater Institute 31
 features semi-permeable membrane separates chambers, mobilized P taken up by P-starved algae sampling 4 streams (Fall Ck., Cayuga Inlet, Six Mile Ck., Salmon Ck.")
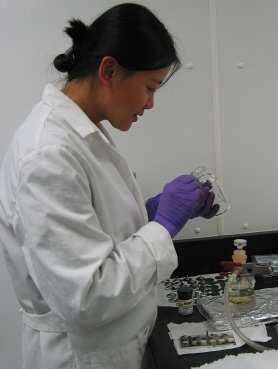
32 Bioavailability Algal Assays dual culture diffusion apparatus (DCDA) - DePinto (1982), Auer et al. (1998), Effler et al. (2012) features semi-permeable membrane separates chambers, mobilized P taken up by P-starved algae sampling 4 streams (Fall Ck., Cayuga Inlet, Six Mile Ck., Salmon Ck.) sampling 2 WWTP (Cayuga Heights, Ithaca Area WWTP) 1 dry weather and two wet weather events assays being conducted in laboratory of M. T. Auer, Michigan Technol. University 1/15/2014 Upstate Freshwater Institute 32
 SD 1/b p b p particle scattering")
 particles b m PAV m based on")
33 Special Efforts on Inorganic important to Particles phosphorus (PP i ), above water clarity (Secchi disc, SD) SD 1/b p b p particle scattering coeff. = b o + b m phytoplankton inorganic (algae) particles b m PAV m based on systemspecific information 1/15/2014 Upstate Freshwater Institute 33


34 Turbidity Plumes 1/15/2014 Upstate Freshwater Institute 34
35 Draft Work Schedule No. Component Description Phase 1 Phase 2 1 develop QAPP 2 review available system information 3 tributary monitoring program a). routine b). event c). tributary analysis d). loading calculations e). bioavailable particulate P estimates 4 lake monitoring program a). lake monitoring b). limnological analysis c). mass balance analysis 5 setup and testing of 2-D transport/hydrothermal model 6 setup and testing of a watershed model a). develop database b). tier-one model c). tier-two model 7 Phase 1 report summary of a). data analysis b). hydrothermal modeling c). watershed modeling d). recommended validation data sets e). recommendations for Phase 2 8 develop QAPP Phase 2 9 1/31/13 Setup and test a phosphorus/eutrophication Upstate Freshwater Institute 35 model starts
36 Incorporation of Other Data Sets philosophy statement, page 96 of 495 The intent is to utilize data collected as part of local research and monitoring efforts to the extent possible stream data acquisition and review - T. Walter s group at Cornell - secondarily, UFI lake data acquisition and review by UFI potential direct involvement of NYSDEC in critical data set decisions stakeholder input on data acquisition and descriptions - completeness 1/15/2014 Upstate Freshwater Institute 36
37 Acquisition of Other Data Sets Data Sources and Ongoing Analysis LSC Monitoring Dr. David Bouldin CSLAP Seneca County (Dr. J. Makarewicz) lake, North CSI IAWWTP effluent, tribs, lake CHWWTP effluent NYS DEC 1/15/2014 Upstate Freshwater Institute 37
38 Photo by William Warmus 1/15/14 Upstate Freshwater Institute 38
39 Value Added Activities* *not specified in QAPP 1/15/14 Upstate Freshwater Institute 39

40 Value Added Activity: Automated Water Quality Platform Site 2 measuring temperature, specific conductance, and turbidity at 15 min intervals in collaboration with T. Cowen (Cornell Univ.) 1/15/2014 Upstate Freshwater Institute 40

41 Value Added Activity: Instrument Deployments at Mouth of Inlet data sonde measuring temperature, specific conductance, and turbidity at 15 min intervals ADCP paired with Cornell s flow meter will assess turbidity loads to the lake together with sonde data to support Tn loading potential differences with upstream gage sampling site in collaboration with T. Cowen (Cornell Univ.) 1/15/2014 Upstate Freshwater Institute 41

42 Value Added Activity: Analysis Sediment Trap Collections deployed May 1, 2013 at Site 2 for determining downward flux and settling velocity collected weekly samples archived, will be analyzed for: TP, TIP, TSS, FSS, Ca, Chla, POC 1/15/2014 Upstate Freshwater Institute 42
43 Value Added Activity: Shelf Monitoring, July shelf region monitored in response to July 1 rain event 25 SeaBird profiles collected in a grid pattern elevated turbidity levels were observed in the inlet and in the entire southern shelf bioavailability sample collected during this survey Latitude ( ) Longitude ( ) 1/15/2014 Upstate Freshwater Institute 43

44 Small Creeks Survey, June 11, 2013 Salmon Cr. Taugh. Cr. Fall Cr. Cayuga Inlet Six Mile Cr. 1/15/2014 Upstate Freshwater Institute 44
45 Value Added Activity: Small Stream Survey, June 11, 2013 UFI conducted a survey of 18 tributaries to Cayuga Lake on June 11, 2013 to characterize nutrient and turbidity inputs for ungauged sources field data, phosphorus and nitrogen data were collected the 5 main tributaries were sampled along with 13 small tribs around the lake s perimeter 1/15/14 Upstate Freshwater Institute 45
46 Value Added Research Activities in Optics successful proposal to NASA by UFI Parameterizing spectral characteristics of optically active constituents in inland waters for improved satellite retrievals program: NASA ROSES 2012, A. 32 Remote Sensing of Water Qualilty 2.3 Improving description of the link between optical and biogeochemical properties funding delayed until summer 2014 (sequestration) seeks to advance remote sensing capabilities of water quality for inland waters through mechanistic algorithm approaches requires detailed optical characterization of various test systems (researcher choice Cayuga Lake chosen) 1/15/14 Upstate Freshwater Institute
47 Added Measurements from Optics Program Field absorption coefficient (a(λ)) scattering coefficient (b(λ)) beam attenuation coefficient (c(λ)) backscattering coefficient (b b (λ)) remote sensing reflectance (R rs (λ)) CDOM fluoescence (CDOM f ) Metrics Laboratory CDOM absorption ((a CDOM (λ)) particle absorption (a P (λ)) phytoplankton absorption (a ϕ (λ)) non-algal particulate absoprtion (a NAP (λ)) lake sites 2,3 and 5, upper waters focus 4 tributaries, a CDOM only anticipate some synergy with TMDL study 1/15/14 Upstate Freshwater Institute
48 Value Added Activity: Additional Stream Sampling for Events Daily Avg. Flow (m 3 /s) Fall Creek Apr May Jun Jul Aug Sep Oct Nov 2013 sampling conducted beyond the 4 required events 1/15/2014 Upstate Freshwater Institute 48
Phosphorus Loading and Related Impacts in Southern Cayuga Lake. Dave Matthews Upstate Freshwater Institute Syracuse, NY
 Phosphorus Loading and Related Impacts in Southern Cayuga Lake Dave Matthews Upstate Freshwater Institute Syracuse, NY Upstate Freshwater Institute (UFI) mission: advance freshwater research and protect
PHOSPHORUS LOADING PROCEDURES AND RESULTS
 July 17, 214 Upstate Freshwater Institute 1 PHOSPHORUS LOADING PROCEDURES AND RESULTS 213 Cayuga Lake Study Public Meeting Cayuga Lake Modeling Project July 17, 214 Ithaca, NY July 17, 214 Upstate Freshwater
SAX and a lake model
 SAX and a lake model 1. system-specific issues; limitations of conventional approach 2. SAX: technical details, advantages, and applications 3. Cayuga Lake 213 water quality studies a. tributaries b. lake
D. Phosphorus Bioavailability and Loads
 D. Phosphorus Bioavailability and Loads importance, recent history, and variability 1 Outline 1. Phosphorus importance and forms 2. Runoff events, phosphorus loading, and variability 3. Bioavailability:
PHOSPHORUS LOADING PROCEDURES AND RESULTS
 May 19, 214 Upstate Freshwater Institute 1 PHOSPHORUS LOADING PROCEDURES AND RESULTS 213 Cayuga Lake Study Technical Briefing (CLTAC) Cayuga Lake Modeling Project May 19, 214 Albany, NY May 19, 214 Upstate
2013 Selected Limnological Features. Upstate Freshwater Institute
 21 Selected Limnological Features 1/1/214 Upstate Freshwater Institute 1 Cayuga Lake, 18-212 LSC monitoring program sites site 8 pelagic zone site 1,, 4,, 7 sites 1/1/214 Upstate Freshwater Institute 2
Cayuga Lake Water Quality Monitoring, Related to the LSC Facility: 2011
 Cayuga Lake Water Quality Monitoring, Related to the LSC Facility: 211 Prepared by: De Frees Hydraulics Laboratory School of Civil and Environmental Engineering Cornell University Ithaca, NY 14853-351
F. Scientific Status of Phosphorus Management for the Shelf
 F. Scientific Status of Phosphorus Management for the Shelf historic observations, process studies, model predictions, and other potentially related issues 1 There is presently a compelling scientific
Cayuga Lake Water Quality Monitoring, Related to the LSC Facility: 2005
 March 31, 26 Cayuga Lake Water Quality Monitoring, Related to the LSC Facility: 25 Prepared by: Upstate Freshwater Institute Box 56 Syracuse, NY 13214 Sponsored by: Cornell University Department of Utilities
Cayuga Lake Water Quality Monitoring, Related to the LSC Facility: 2001
 June 4, 22 Cayuga Lake Water Quality Monitoring, Related to the LSC Facility: 21 Prepared by: Upstate Freshwater Institute Box 56 Syracuse, NY 13214 Sponsored by: Cornell University Department of Utilities
Long-term Study of Minerogenic Particle Optics in Cayuga Lake
 Limnol. Oceanogr., 59(1), 214, in press. Long-term Study of Minerogenic Particle Optics in Cayuga Lake Steven W. Effler and Feng Peng January 15, 214 Light Scattering by Suspended Particles reduces clarity,
Cayuga Lake Water Quality Monitoring, Related to the LSC Facility: 2003
 March 3, 24 Cayuga Lake Water Quality Monitoring, Related to the LSC Facility: 23 Prepared by: Upstate Freshwater Institute Box 56 Syracuse, NY 13214 Sponsored by: Cornell University Department of Utilities
Cayuga Lake Water Quality Monitoring, Related to the LSC Facility: 2002
 March 28, 23 Cayuga Lake Water Quality Monitoring, Related to the LSC Facility: 22 Prepared by: Upstate Freshwater Institute Box 56 Syracuse, NY 13214 Sponsored by: Cornell University Department of Utilities
G. Other potentially related topics
 G. Other potentially related topics 1 Outline 1. Near-field phosphorus monitoring issues 2. problems with potential application of the phosphorus Narrative Standard for the shelf 3. improved scientific
G. Other potentially related topics
 G. Other potentially related topics 1 Outline 1. Near-field phosphorus monitoring issues 2. problems with potential application of the phosphorus Narrative Standard for the shelf 3. improved scientific
ADDENDUM 2 (2013) TO WORK PLAN FOR PILOT TEST TO ADD NITRATE TO THE HYPOLIMNION OF ONONDAGA LAKE
 TO WORK PLAN FOR PILOT TEST TO ADD NITRATE TO THE HYPOLIMNION OF ONONDAGA LAKE") NITRATE TO THE HYPOLIMNION OF Prepared for: 301 Plainfield Road, Suite 330 Syracuse, NY 13212 Prepared by: 301 Plainfield Road, Suite 350 Syracuse, New York 13212 JUNE 2013 TABLE OF CONTENTS LIST OF ACRONYMS...
NITRATE TO THE HYPOLIMNION OF Prepared for: 301 Plainfield Road, Suite 330 Syracuse, NY 13212 Prepared by: 301 Plainfield Road, Suite 350 Syracuse, New York 13212 JUNE 2013 TABLE OF CONTENTS LIST OF ACRONYMS...
Cayuga Lake Water Quality Monitoring, Related to the LSC Facility: 1998
 June 2, 2 Cayuga Lake Water Quality Monitoring, Related to the LSC Facility: 1998 Prepared by: Upstate Freshwater Institute Box 56 Syracuse, NY 13214 Sponsored by: Cornell University 1. Objective/Study
Phosphorus and Sediment Impact / Cayuga Lake
 Phosphorus and Sediment Impact / Cayuga Lake A follow-up project from: Assessment of Total Phosphorus and Sediment Impacts for the North End of the Cayuga Lake Watershed Year 1 Funded by the US EPA, Region
Figure 1. Platte River Sub-Watersheds and Monitoring Locations.
 Figure 1. Platte River Sub-Watersheds and Monitoring Locations. 10 2 1 9 7 BL Pond 8 Hatchery 6 3 5 4 1 Platte River at Fewins Rd 6 B. Creek to Hatchery Spring 2 Platte River at Stone Bridge 7 Platte River
more related to TMDL process than in the water quality model development. Response (Myers): NYSDEC commits to looking at the whole system.
: NYSDEC commits to looking at the whole system.") Workshop Summary Cayuga Lake Modeling Project, Quality Assurance Project Plan Review Wednesday January 30, 2013 Tompkins County Public Library, Borg-Warner Room, Ithaca NY Workshop Participants: Name Affiliation
Workshop Summary Cayuga Lake Modeling Project, Quality Assurance Project Plan Review Wednesday January 30, 2013 Tompkins County Public Library, Borg-Warner Room, Ithaca NY Workshop Participants: Name Affiliation
Simulation of the contribution of minerogenic particles to particulate phosphorus concentration in Cayuga Lake, New York
 Simulation of the contribution of minerogenic particles to particulate phosphorus concentration in Cayuga Lake, New York Rakesh K. Gelda 1, Steven W. Effler 1, Anthony R. Prestigiacomo 1,*, Feng Peng 1,
Sources for Bottom Water Phosphates and Suspended Sediments in Southern Cayuga Lake, New York
 Sources for Bottom Water Phosphates and Suspended Sediments in Southern Cayuga Lake, New York Prabighya Basnet Hobart & William Smith Colleges Geneva, NY Outline of Today s Presentation Introduce Problem
Zu-Tao Ou-Yang Center for Global Change and Earth Observation Michigan State University
 Zu-Tao Ou-Yang Center for Global Change and Earth Observation Michigan State University Ocean Color: Spectral Visible Radiometry Color of the ocean contains latent information on the water qualitycdom,
Mona Lake Modeling: Model Parameters and Sampling Strategy
 Mona Lake Modeling: Model Parameters and Sampling Strategy About Watershed: 200 km 2 Mona Lake: 2.65 km 2 - Black Creek: 0.482-2.69 m 3 /s Little Black Creek: 0.040-0.442 m 3 /s Cress Creek: 0.050-0.163
DRAFT. DRAFT July 9, 2013 Lake-Wide Survey (No. 8) Page 1 of Cayuga Lake. Lake-Wide Seabird Profiles
 Page 1 of Cayuga Lake. Lake-Wide Seabird Profiles") Cayuga Lake Lake-Wide Seabird Profiles July 9, Provisional Data Summary Submitted: for review; for discussion purposes only Anthony R. Prestigiacomo Research Scientist July 9, Lake-Wide Survey (No. 8)
Cayuga Lake Lake-Wide Seabird Profiles July 9, Provisional Data Summary Submitted: for review; for discussion purposes only Anthony R. Prestigiacomo Research Scientist July 9, Lake-Wide Survey (No. 8)
University of Arkansas, Fayetteville. Marc Nelson. L. Wade Cash. Keith Trost. Jennifer Purtle
 University of Arkansas, Fayetteville ScholarWorks@UARK Technical Reports Arkansas Water Resources Center 6-1-2005 Water Quality Sampling, Analysis and Annual Load Determinations for Nutrients and Sediment
Upper Mississippi River Lake Pepin Modeling Lake Pepin Municipal Sector Meeting August 6, 2008
 Upper Mississippi River Lake Pepin Modeling Lake Pepin Municipal Sector Meeting August 6, 2008 Lake Pepin Photo by Guy Schmickle Overview Fundamentals Why model? What is a model? Model Development How
Arkansas Water Resources Center
 Arkansas Water Resources Center WATER QUALITY SAMPLING, ANALYSIS AND ANNUAL LOAD DETERMINATIONS FOR TSS, NITROGEN AND PHOSPHORUS AT THE WYMAN BRIDGE ON THE WHITE RIVER Submitted to the Arkansas Soil and
Data Required to Support Reservoir Water Quality Modeling
 Data Required to Support Reservoir ater Quality Modeling The recommendations contained within this document are intended to assist with developing field data collection programs that can support reservoir
Lake Elsinore and San Jacinto Watersheds Authority. Canyon Lake Phase 2 Water Quality Monitoring Plan
 Lake Elsinore and San Jacinto Watersheds Authority December 2010 Background Canyon Lake was formed in 1928 when the Canyon Lake (Railroad Canyon) Dam was constructed; the lake has three main sections the
Water Quality in Seneca Lake Tributary Streams
 Water Quality in Seneca Lake Tributary Streams Stephen Penningroth, Director Community Science Institute Hobart and William Smith Colleges March 24, 2018 Community Science Institute Independent, nonprofit,
Chemical and Physical Analysis of the Cape Fear Estuary
 The Cape Fear River Chemical and Physical Analysis of the Cape Fear Estuary The Cape Fear River (CFR), the most industrialized of all North Carolina s rivers, winds for over miles through the heart of
Understanding and Managing the Range of Phosphorus Forms Contributing to Eutrophication
 Understanding and Managing the Range of Phosphorus Forms Contributing to Eutrophication Marc Stutter, Benoit Demars The Macaulay Land Use Research Institute, Aberdeen, UK Session 3: Monitoring and evaluation
Soil and Water Lab Biological and Environmental Engineering Cornell University Ithaca, NY
 Watershed Modeling Cayuga Lake Modeling Project Meeting nyalt.org Soil and Water Lab Biological and Environmental Engineering Cornell University Ithaca, NY Why? In order to model the lake, we need to estimate
Water Quality Analysis of Lakewood Lakes
 Water Quality Analysis of Lakewood Lakes December 2016 Prepared by WEST Consultants, Inc. Bellevue, Washington With support from HDR, Inc., Olympia, Washington TABLE OF CONTENTS EXECUTIVE SUMMARY... V
Cayuga Lake Modeling Project Frequently Asked Questions 01/04/13
 Cayuga Lake Modeling Project http://cayugalakemodelingproject.cornell.edu Frequently Asked Questions 01/04/13 1. Project Overview... 3 1.1. What is the Cayuga Lake Modeling Project (CLMP)?... 3 1.2. Why
Arkansas Water Resources Center
 Arkansas Water Resources Center WATER QUALITY SAMPLING, ANALYSIS AND ANNUAL LOAD DETERMINATIONS FOR TSS, NITROGEN AND PHOSPHORUS AT THE WASHINGTON COUNTY ROAD 195 BRIDGE ON THE WEST FORK OF THE WHITE RIVER
Apportionment of Bioavailable Phosphorus. Loads Entering Cayuga Lake, New York 1
 Apportionment of Bioavailable Phosphorus Loads Entering Cayuga Lake, New York 1 Anthony R. Prestigiacomo, Steven W. Effler, David A. Matthews, Martin T. Auer, Benjamin E. Downer, Anika Kuczynski and M.
H1: Watershed land use and stream bank morphology determine sediment load and P- N speciation sensitive to timing, frequency, and intensity of rain-sn
 Question 1: What is the relative importance of endogenous inlake processes (e.g. internal loading, ice cover, hydrodynamics) versus exogenous to-lake processes (e.g. land use change, snow/rain timing,
Long-Term Volunteer Lake Monitoring in the Upper Woonasquatucket Watershed
 Long-Term Volunteer Lake Monitoring in the Upper Woonasquatucket Watershed Linda Green URI Watershed Watch 1-87-95, lgreen@uri.edu WATER QUALITY IS A REFLECTION OF THE ACTIVITIES IN THE LANDS AND WATERS
Water Quality Monitoring for Lake Erie and the Great Lakes Nutrient Initiative (GLNI)
") Water Quality Monitoring for Lake Erie and the Great Lakes Nutrient Initiative (GLNI) 2011-2016 Water Quality Monitoring and Surveillance Division Alice Dove, Sean Backus, Vi Richardson Issues Facing the
Water Quality Monitoring for Lake Erie and the Great Lakes Nutrient Initiative (GLNI) 2011-2016 Water Quality Monitoring and Surveillance Division Alice Dove, Sean Backus, Vi Richardson Issues Facing the
Subwatershed Prioritization of the Lake Wister Watershed Using Baseflow Water Quality Monitoring Data
 Subwatershed Prioritization of the Lake Wister Watershed Using Baseflow Water Quality Monitoring Data Bradley J. Austin, Brina Smith, and Brian E. Haggard Eutrophication Process by which excess nutrients
Meredith Howard Karen McLaughlin Nikolay Nezlin
 Meredith Howard Karen McLaughlin Nikolay Nezlin SCCWRP Objectives For Diversion Determine the fate of effluent nitrogen How quickly is effluent nitrogen consumed or transformed? Is effluent nitrogen being
Arkansas Water Resources Center
 Arkansas Water Resources Center 2003 POLLUTANT LOADS KINGS RIVER NEAR BERRYVILLE, ARKANSAS Submitted to the Arkansas Soil and Water Conservation Commission By Marc A. Nelson, Ph.D., P.E. and L. Wade Cash,
Watershed and Water Quality Modeling to Support TMDL Determinations Lake Oologah
 Watershed and Water Quality Modeling to Support TMDL Determinations Lake Oologah 26 th Annual Conference Oklahoma Clean Lakes and Watersheds Association (OCLWA) April 5-6, 2017 Stillwater, Oklahoma Lake
Upstate Freshwater Institute 10/22/2015
 1 A. Introduction to Meeting goals, key elements, timely input for management 2 Goals for October 2015 meeting related to Cayuga Lake document key features of progress provide timely scientific support
Owasco Lake Water Quality Issues: My 2011 Update Owasco Lake Day
 www.erh.noaa.gov/nerfc/basin_info/owsn.html Owasco Lake Water Quality Issues: My Update Owasco Lake Day Lake Winnipesaukee John D Halfman Environmental Studies Program Department of Geoscience Finger Lakes
Nicholas A. Reckinger. June 11, 2007
 Comparison of Phosphorus Forms at Different Spatial Scales and Assessment of an Area-Weighted P-Index to Multi-Field Watersheds Nicholas A. Reckinger June 11, 2007 Watershed Activities Affect Water Quality
BIO-OPTICAL SENSORS FOR PROFILING FLOATS
 BIO-OPTICAL SENSORS FOR PROFILING FLOATS J. Ronald V. Zaneveld Western Environmental Technology Laboratories, Inc. P.O. Box 518, Philomath, OR 97370, U.S.A. FAX:1-541-929-5277 e-mail:ron@wetlabs.com Introduction
Lake Whatcom Water Quality - Presentation to Bellingham City Council
 Western Washington University Western CEDAR Lake Whatcom Other Reports Lake Whatcom 7-6-2015 Lake Whatcom Water Quality - Presentation to Bellingham City Council Robin A. Matthews Western Washington University,
Tarrant Regional Water District Water Quality Trend Analysis Final Report Executive Summary. July 2011
 Tarrant Regional Water District Water Quality Trend Analysis 1989-2009 Final Report Executive Summary July 2011 Prepared for Tarrant Regional Water District 201 North Shore Drive Fort Worth, TX 76135 Phone:
Nutrient distributions and the interaction between coastal wetlands and the nearshore of Lake Ontario
 Nutrient distributions and the interaction between coastal wetlands and the nearshore of Ontario Krista Chomicki and Gary Bowen International Association of Great s Research, 25 Type Durham Region Coastal
Other Considerations & Review Building a Successful Monitoring Plan
 Other Considerations & Review Building a Successful Monitoring Plan Fundamentals of Developing a Water Quality Monitoring Plan Thursday, July 28, 2016 Larry Hauck hauck@tiaer.tarleton.edu Mention of trade
Fall Line Input Monitoring on the Potomac River at Chain Bridge
 Fall Line Input Monitoring on the Potomac River at Chain Bridge 1983-2007 Metropolitan Washington Council of Governments and Occoquan Watershed Monitoring Laboratory Regional Monitoring Subcommittee Meeting
Arkansas Water Resources Center
 Arkansas Water Resources Center 2004 POLLUTANT LOADS KINGS RIVER NEAR BERRYVILLE, ARKANSAS Submitted to the Arkansas Soil and Water Conservation Commission By Marc A. Nelson, Ph.D., P.E. L. Wade Cash,
Water Quality of Seneca Lake
 The College at Brockport: State University of New York Digital Commons @Brockport Technical Reports Studies on Water Resources of New York State and the Great Lakes 8-1999 Water Quality of Seneca Lake
Arkansas Water Resources Center
 Arkansas Water Resources Center WATER SAMPLING, ANALYSIS AND ANNUAL LOAD DETERMINATIONS FOR TSS, NITROGEN AND PHOSPHORUS AT THE L ANGUILLE RIVER NEAR PALESTINE Submitted to the Arkansas Soil and Water
Owasco Lake Watershed Management Plan: Incorporation of the EPA Nine Key Elements. Community Meeting August 13, 2018
 Owasco Lake Watershed Management Plan: Incorporation of the EPA Nine Key Elements Community Meeting August 13, 2018 Acknowledgments FUNDING This watershed planning effort is funded through a Title 11 Environmental
Spanaway Lake Management Plan
 Spanaway Lake Management Plan Background Spanaway Lake is a valuable Pierce County resource. The lake is threatened by a variety of water quality problems including excess algae and weed growth and elevated
Seneca Lake Water Quality Schulyer County WQCC. John D Halfman Environmental Studies Program Department of Geoscience Finger Lakes Institute
 Seneca Lake Water Quality Schulyer County WQCC John D Halfman Environmental Studies Program Department of Geoscience Finger Lakes Institute Background Information Tourism Agriculture Class AA Drinking
Barnegat Bay Water Quality and Quantity Monitoring Program
 Barnegat Bay Water Quality and Quantity Monitoring Program Helen Pang, Trish Ingelido, Ariane Giudicelli, Barbara Hirst, Amanda Lotto and Jill Lipoti Water Monitoring and Standards NJDEP 2013 Delaware
Watershed - Lake Model to Support TMDL Determinations for Lake Thunderbird
 Watershed - Lake Model to Support TMDL Determinations for Lake Thunderbird 18 th Annual EPA Region 6 Stormwater Conference Workshop 5: TMDLs and You October 3, 2016 Oklahoma City, OK Lake Thunderbird Watershed-Lake
Elsinore Valley Municipal Water District. Lake Elsinore Phase 2 Water Quality Monitoring Plan
 Elsinore Valley Municipal Water District Lake Elsinore Phase 2 Water Quality Monitoring Plan to Evaluate the Efficacy of the In-Lake Nutrient Reduction Facilities (Aeration and Mixing) for Lake Elsinore
2007 Inland and Purdy Reservoirs Report. Rivers and Reservoirs Monitoring Program
 2007 Inland and Purdy Reservoirs Report Rivers and Reservoirs Monitoring Program Field Operations Division Environmental Indicators Section Aquatic Assessment Unit June 2012 Rivers and Reservoirs Monitoring
MODELING THE SPOKANE RIVER-LAKE ROOSEVELT SYSTEM
 MODELING THE SPOKANE RIVER-LAKE ROOSEVELT SYSTEM Chris J. Berger 1, Robert L. Annear, Jr. 2, Michael L. McKillip 3, Vanessa Wells 4 and Scott A. Wells, ASCE 5 1 Senior Research Associate, Department of
2006 Aliceville Reservoir Report. Rivers and Reservoirs Monitoring Program
 2006 Aliceville Reservoir Report Rivers and Reservoirs Monitoring Program Field Operations Division Environmental Indicators Section Aquatic Assessment Unit May 2011 Rivers and Reservoirs Monitoring Program
Water Quality Indicators
 Water Quality Indicators Ashley T. Slagle PVSC NJ Water Monitoring Council Meeting NJDEP Headquarters Trenton, NJ Wednesday, January 25, 2012 Who is the New Jersey Harbor Dischargers Group? 9 Sewerage
Monitoring Update April 1, Northeast Aquatic Research George Knoecklein Hillary Kenyon Sabina Perkins
 Monitoring Update April 1, 215 Northeast Aquatic Research George Knoecklein Hillary Kenyon Sabina Perkins Lake Monitoring Approach for 214 Tonight's discussion will focus on in-lake aspects: Assessment
LM0308: Catchment Management for Water Quality
 LM0308: Catchment Management for Water Quality Case Study 5: Uncertainty in ecological responses to water quality control measures at the river basin scale. Lead: Richard Williams (CEH); Andy Wade (University
APPENDIX F ONONDAGA LAKE WASTEBEDS 1-8 SHORELINE STABILIZATION MONITORING WORK PLAN
 APPENDIX F Prepared for: 301 Plainfield Road, Suite 330 Syracuse, NY 13212 Prepared by: 301 Plainfield Road, Suite 350 Syracuse, New York 13212 OCTOBER 2017 PARSONS TABLE OF CONTENTS Page LIST OF ACRONYMS...
What we can measure vs. What we want to know.
 SCIENTIFIC AND TECHNICAL ADVISORY COMMITTEE 18 September 2015 What we can measure vs. What we want to know. William Ullman School of Marine Science and Policy University of Delaware, Lewes 9/15/2015 Inland
NASA Workshop for Remote Sensing of Coastal & Inland Waters
 NASA Workshop for Remote Sensing of Coastal & Inland Waters Madison, Wisconsin June 20-22, 2012 Dr. Robert Shuchman, MTRI George Leshkevich, NOAA GLERL Contributors: Michael Sayers, MTRI Colin Brooks,
Qian Zhang (UMCES / CBPO) Joel Blomquist (USGS / ITAT)
 Joel Blomquist (USGS / ITAT)") CBP STAC Water Clarity Workshop Solomons, MD, 02/06/2017 Long-term Riverine Inputs from Major Tributaries to Chesapeake Bay Relevant to Water Clarity Qian Zhang (UMCES / CBPO) Joel Blomquist (USGS / ITAT)
CBP STAC Water Clarity Workshop Solomons, MD, 02/06/2017 Long-term Riverine Inputs from Major Tributaries to Chesapeake Bay Relevant to Water Clarity Qian Zhang (UMCES / CBPO) Joel Blomquist (USGS / ITAT)
Characterization of dissolved organic matter in Colorado watersheds: The role of nutrients and algae on DBP formation
 Characterization of dissolved organic matter in Colorado watersheds: The role of nutrients and algae on DBP formation Amanda Hohner, Alia Khan, Diane McKnight, R. Scott Summers, and Fernando Rosario-Ortiz
Gary Fahnenstiel RECENT CHANGES IN PRIMARY PRODUCTIVITY AND PHYTOPLANKTON DYNAMICS
 RECENT CHANGES IN PRIMARY PRODUCTIVITY AND PHYTOPLANKTON DYNAMICS Gary Fahnenstiel Great Lakes Research Center Michigan Tech Research Institute Michigan Technological University And Water Center Graham
NUTRIENTS AND PARTICLES TAHOE.UCDAVIS.EDU 9
 NUTRIENTS AND PARTICLES 9 Sources of clarity-reducing and blueness-reducing pollutants In 2017 Research has quantified the primary sources of nutrients (nitrogen and phosphorus) and particulate material
25 years of Hawaii Ocean Time-series carbon flux determinations: Insights into productivity, export, and nutrient supply in the oligotrophic ocean
 25 years of Hawaii Ocean Time-series carbon flux determinations: Insights into productivity, export, and nutrient supply in the oligotrophic ocean MATTHEW CHURCH, ROBERT BIDIGARE, JOHN DORE, DAVID KARL,
Jordan River TMDL Study What Have We Learned So Far?
 Jordan River TMDL Study What Have We Learned So Far? Salt Lake Countywide Watershed Symposium October 29 th, 2008 Hilary Arens & James Harris Utah Division of Water Quality TMDL Update Impairments Water
5.0 PHYTOPLANKTON PHYSIOLOGY. Luke Twomey Christopher P. Buzzelli Hans W. Paerl. 5.1 Introduction
 5. PHYTOPLANKTON PHYSIOLOGY Luke Twomey Christopher P. Buzzelli Hans W. Paerl 5.1 Introduction Phytoplankon production is the primary source of organic carbon in the water column of the NRE (Matson and
Stream Water Quality Assessment of Long Point Gully, Graywood Gully, and Sutton Point: Conesus Lake Tributaries 2015
 Stream Water Quality Assessment of Long Point Gully, Graywood Gully, and Sutton Point: Conesus Lake Tributaries 2015 Theodore W. Lewis and Joseph C. Makarewicz The Department of Environmental Science and
Bear Creek Hydrologic Reconnection and Habitat Enhancement Project Pre-Restoration Monitoring Report
 Bear Creek Hydrologic Reconnection and Habitat Enhancement Project Pre-Restoration Monitoring Report December 2016 Alan D. Steinman Michael C. Hassett Grand Valley State University Annis Water Resources
What s In your Watershed Reeder Creek
 What s In your Watershed Reeder Creek Stephen Penningroth, Ph.D. Executive Director, Community Science Institute, Ithaca, NY Three Brothers Winery, Geneva, NY October 29, 2015 Sponsored by the Seneca Lake
ASU Regional Water Quality Center Algae and Associated Drinking Water Challenges
 TL13 TL14 Regional ASU Regional Center Algae and Associated Drinking Challenges A Cooperative Research and Implementation Program Arizona State University (Tempe, AZ) Peter Fox, Morteza Abbaszadegan, Marisa
Interpreting Lake Data
 Interpreting Lake Data Indiana Clean Lakes Program The Indiana Clean Lakes Program was created in 1989 as a program within the Indiana Department of Environmental Management's (IDEM) Office of Water Management.
Lake Pepin Photo by Guy Schmickle
 Science Advisory Panel Meeting Lake Pepin Water Quality Modeling Project April 30, 2008 Lake Pepin Photo by Guy Schmickle Overview Modeling status Historical system behavior Model simulation scenarios
Jordan River TMDL Update
 Jordan River TMDL Update 2010 Watershed Symposium August 4 th, 2010 Hilary N. Arens Utah Division of Water Quality Jordan River TMDL Outline What is a TMDL and what is the Jordan impaired for? Evaluation
NUTRIENTS AND PARTICLES TERC.UCDAVIS.EDU
 NU T R I EN T S A N D PA R T I C L E S 9 TAHOE: STATE OF THE L AKE REPORT 2017 Sources of clarity-reducing and blueness-reducing pollutants In 2016 Research has quantified the primary sources of nutrients
Lake Elsinore and Canyon Lake Nutrient TMDL Monitoring Quarter 3 Report (DRAFT)
") Lake Elsinore and Canyon Lake Nutrient TMDL Monitoring 2016-2017 Quarter 3 Report (DRAFT) Prepared for: Lake Elsinore & San Jacinto Watershed Project Authority 11615 Sterling Avenue Riverside, California
Lake Elsinore and Canyon Lake Nutrient TMDL Monitoring 2016-2017 Quarter 3 Report (DRAFT) Prepared for: Lake Elsinore & San Jacinto Watershed Project Authority 11615 Sterling Avenue Riverside, California
2012 Nutrient Regulations Update
 2012 Nutrient Regulations Update OWEA Government Affairs Workshop March 1, 2012 Guy Jamesson, PE, BCEE Malcolm Pirnie, The Water Division of ARCADIS Imagine the result Agenda Nutrient impacts Nutrient
2015 Fall Chesapeake Bay Water Clarity
 2015 Fall Chesapeake Bay Water Clarity Presentation for the Scientific, Technical Assessment & Reporting (STAR) Team, January 28, 2016 Mark Trice Program Chief, Water Quality Informatics Maryland Department
URBAN NON-POINT SOURCE IMPACTS ON SEATTLE AREA STREAM PHOSPHORUS TRANSPORT
 URBAN NON-POINT SOURCE IMPACTS ON SEATTLE AREA STREAM PHOSPHORUS TRANSPORT Michael T. Brett, Sara E. Stanley, Benjamin O. Brattebo, Micaela Ellison & Giorgios Arhonditsis Department of Civil & Environmental
Particulate Soil Phosphorus and Eutrophication in Lakes and Streams
 Particulate Soil Phosphorus and Eutrophication in Lakes and Streams Paul R. Bloom Soil, Water, & Climate Department University of Minnesota With contributions by John Moncrief, Carl Rosen and David Mulla
2016 Summit Lake Water Quality Report Prepared by Thurston County Environmental Health Division
 ! 216 Summit Lake Water Quality Report Prepared by Thurston County Environmental Health Division PART OF TOTTEN INLET WATERSHED LENGTH OF LAKE: 2.2 miles SHORELINE LENGTH: 5.6 miles LAKE SIZE: 53 acres
Interpreting Lake Data
 Interpreting Lake Data Indiana Clean Lakes Program The Indiana Clean Lakes Program was created in 1989 as a program within the Indiana Department of Environmental Management's (IDEM) Office of Water Management.
Hadlock Pond, Washington Co., Lake Hadlock Association, Inc.
 Hadlock Pond, Washington Co., Lake Hadlock Association, Inc. Lake Characteristics Watershed Characteristics Surface Area (ac/ha) Max Depth (ft/m) Mean Depth (ft/m) Retention Time (years) Water Class Dam
SITES. Bull Shoals Lake. Seasonal Analysis
 Taney County and Ozark County SITES Seasonal Analysis Nutrient concentrations in the main lake sites (1, 2, & 7) and Site 8 (located in a tributary of the main lake) all displayed similar patterns during
Watershed, Hydrodynamic, Water Quality and Sediment Flux Modeling to Support TMDL Determinations, Lake Thunderbird
 Watershed, Hydrodynamic, Water Quality and Sediment Flux Modeling to Support TMDL Determinations, Lake Thunderbird 24 th Annual Conference Oklahoma Clean Lakes and Watersheds Association (OCLWA) April
Estimation of chlorophyll-a concentration in estuarine waters:
 Estimation of chlorophyll-a concentration in estuarine waters: case study of the Pearl River estuary Yuanzhi Zhang *, Chuqun Chen #, Hongsheng Zhang *, Xiaofei*, Chen Guiying Chen# *Institute of Space