Remote Sensing (C) School Name: Student Name(s):
|
|
|
- Eric Lynch
- 6 years ago
- Views:
Transcription
1 School Name: Student Name(s): Remote Sensing (C) Nebraska Science Olympiad State Competition University of Nebraska-Lincoln Saturday, April 2 nd 2011 Question and Answer Sheet 100 points total Show all mathematical operations and answer all questions with complete sentences unless noted. Always use significant figures. Use the separate sheet with tables/figures to answer any questions referencing them on this answer sheet. 1) Name at least three types of greenhouse gases and four sources of these gases. At least one example must be from a non-anthropogenic source. (10pts) 2) Provide at least two causes for sea level rise when global temperatures rise. (6pts) Page 1
2 School Name: Student Name(s): 3) Table 1 is a grid radiance values taken from a layer of a satellite image. Assuming the highest value is 100% reflectance and the lowest value is 0% reflectance, complete the table on your answer sheet. Provide the work solving for at least 1 number in the grid. You do not need to answer in complete sentences for this question (6pts: Part of this question will be used as a tie breaker). 0% 100% 4) What is the difference between active and passive sensors? Provide at least 1 example of each type (6pts). Page 2
3 School Name: Student Name(s): 5) In a LandSat 7 image, which bands would be used for a true color and false color image? Indicate which band would represent which color for both images. (6pts) 6) NDVI is defined in Eq. 1. Calculate NDVI from the spectral response of a pixel in Table 2. You do not need to answer in complete sentences for the question. Part of this question will be used as a tiebreaker (6pts) Eq. 1: (NIR-Red)/(NIR+Red) Page 3
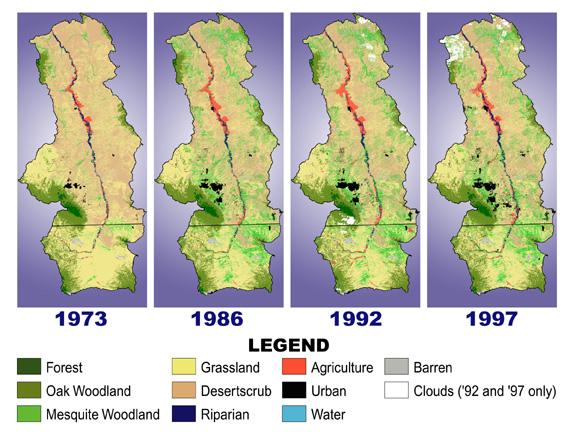
4 School Name: Student Name(s): 7) Using Fig. 1, near what other land cover type is agriculture typically found? Which land cover type has grown the most between 1973 and 1997? Second largest growth? Which land cover type has shrunk the most over this watershed? Between which images did the most change occur? (10pts) 8) Which satellite platform(s) is/are least sensitive to cloud cover? Why? (4pts) 9) Using Fig 2., as of 2004, where is most of the Hemlock Wooly Aphid infestations currently located? If we assume that this species needs the presence of Hemlock to spread within 5 counties, are any regions currently safe from infestation? Provide a scientifically sound reason why there are isolated infections of the Hemlock Wooly Aphid (e.g. infected county surrounded by uninfected Hemlock). (6pts) Page 4
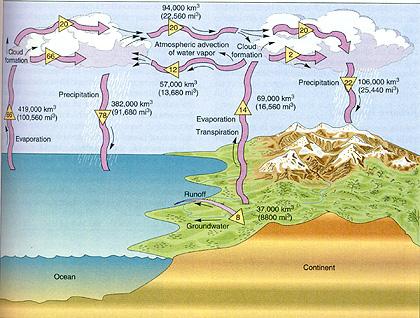
5 School Name: Student Name(s): 10) Using Fig 3., what process in the hydrologic cycle individually involves the largest volume of water? As global warming increases the surface temperature of the earth, it will increase evaporation and transpiration rates. What must happen to balance out this increase? (6pts) 11) If global CO 2 increases but temperatures do not change, what will have to a plant's transpiration rate? If CO 2 is stable, but global temperature increases, what will have to a plant's transpiration rate? (4pts) Page 5
6 School Name: Student Name(s): 12) Using Fig 4., where in the USA is fire potential the highest on 8/6/08? Why does this area have a higher risk potential? Why might the USFS not provide a fire potential for agricultural areas (e.g. Most of IL, IN etc.) (6pts) 13) Using Fig. 5, why is the reflectance of water essentially zero around 0.8 µm? At this same region healthy vegetation has high reflectance, what are some reasons that a healthy plant will reflect more in this region over the red region ~0.67 µm. (6pts) Page 6
7 School Name: Student Name(s): 14) Using Fig. 6 and Fig 7, is Europe most likely experiencing a heat or cold wave in July of 2003? Approximately what is the difference between 2003 and the averaged (Hint 273K = 0 C). Are there any other areas with extreme differences between the two figures, if so, what are they and in which direction is the difference. Part of this question will be a tie breaker. (8 pts) 15) Subsidence is the process of which earth settles to a lower elevation. Fig. 8 and Fig. 9 demonstrate subsidence located near several mine shafts (indicated by the red and white lines). Why might managers of mining operations be interested in figures such as these? How many areas are affected on 8/14/07, 12/30/07? In units of area, how much as the largest subsidence grown from these two dates. You may approximate by estimating each area as a known polygon (please indicate which polygon utilized to ensure accurate grading). (8 pts) Page 7
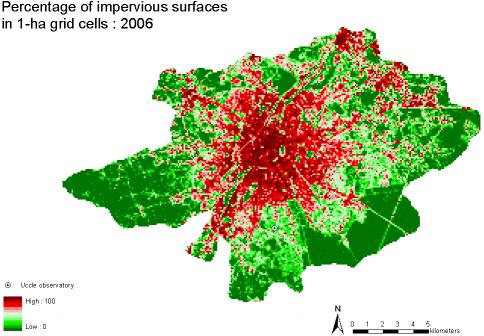
8 School Name: Student Name(s): 16) Due to the devastation of natural disasters, such as the one in Japan on March 11 th, 2011, there is a rush to capture and develop before and after images, such as Fig. 10. While these images can be useful to indicate areas affected by the disaster, list and describe at least 3 potential problems associated with these types of images (e.g. how might someone misinterpret information from the before and after images, etc.) (6pts) 17) Fig. 11 shows an impervious land surface map. Why are city planners interested in such maps? What is the primary driver for increasing impervious surfaces? How much city planners mitigate some increases in impervious surfaces? (6pts) Page 8
9 Remote Sensing (C) Nebraska Science Olympiad State Competition University of Nebraska- Lincoln Saturday, April 2 nd 2011 Table and Figure Sheet Table 1: Radiance grid from a satellite image layer Table 2: Example spectral response from a MODIS pixel Band # Reflectance (%) Page 1
10 Fig. 1: Land cover maps derived from Landsat MSS/TM imagery. (Source: A Landscape approach for detecting and evaluating change in a semi- arid environment, San Pedro Watershed, by Keppner for US EPA, Las Vegas, NV). Page 2
11 Page 3
12 Fig. 2: Hemlock and Hemlock Wooly Aphid distribution as of (Source: USFS). Page 4

13 Fig. 3: Hydrologic cycle (Source: Geosystems: An introduction to physical geography by R.W. Christopherson). Page 5
14 Page 6
15 Fig. 4: Map of risk of fire potential on 8/6/08. (Source USFS) Page 7

16 Page 8

17 Fig. 5: Generalized reflectance spectra of common earth surface materails (source: Remote Sensing Applications Consultants website: Page 9
")
18 Fig. 6: Average land surface temperature for the month of July, 2003 (Source: MODIS product, NASA) Page 10

19 Fig. 7 Average surface temperature average for the month of July from Values are in K (Source: AVHRR product, NOAA) Page 11

20 Fig. 8. Subsidence map created using PALSAR taken on 8/14/07 (Source: Cooperative Research Centre for Spatial Information and the School of Surveying & Spatial Information Systems, the University of New South Wales, using PALSAR data provided by ERSDAC) Page 12
21 Fig. 9. Subsidence map created using PALSAR taken on 12/30/07 (Source: Cooperative Research Centre for Spatial Information and the School of Surveying & Spatial Information Systems, the University of New South Wales, using PALSAR data provided by ERSDAC) Page 13

22 Fig. 10 RapidEye imagery of the Coastline of Miyagi Prefecture (Source: JAXA via Page 14
23 Fig. 11 Percentage of impervious surfaces in Uccle (Belgium) (Source: Estimating Urban Heat Island Effects on the Temperature Series of Uccle (Brussels, Belgium) Using Remote Sensing Data and a Land Surface Scheme by Hamdi in Remote Sensing, 2010, 2(12), ) Page 15
24 Page 16
25 Remote Sensing (C) Nebraska Science Olympiad State Competition University of Nebraska-Lincoln Saturday, April 2 nd points total Show all mathematical operations and answer all questions with complete sentences unless noted. Always use significant figures. Use the separate sheet with tables/figures to answer any questions referencing them on this answer sheet. 1) Name at least three types of greenhouse gases and four sources of these gases. At least one example must be from a non-anthropogenic source. (10pts) water vapor, carbon dioxide, methane, nitrous oxide, ozone, chlorofluorocarbons sources: much more varied acceptable: fossil fuels, volcanic eruptions, agricultural byproduct etc. 2) Provide at least two causes for sea level rise when global temperatures rise. (6pts) Thermal expansion of the ocean and glacial melting. Melting sea ice DOES NOT contribute to sea level rise. 3) Table 1 is a grid radiance values taken from a layer of a satellite image. Assuming the highest value is 100% reflectance and the lowest value is 0% reflectance, complete the table on your answer sheet. Provide the work solving for at least 1 number in the grid. You do not need to answer in complete sentences for this question (6pts: Part of this question will be used as a tie breaker). 0% 47% 7.9% 17% 74% 100% (Number Min)/(Max - Min)*100 Example: (123 34)/(223-34)*100 = 89/189*100 = 47% 4) What is the difference between active and passive sensors? Provide at least 1 example of each type (6pts). Active emits energy and collect reflectance, fluorescence or scattering off of subject of interest (e.g. Lidar) Passive uses energy either reflected, scattered or emitted from object of interest (e.g. LandSat, MODIS)
26 5) In a LandSat 7 image, which bands would be used for a true color and false color image? Indicate which band would represent which color for both images. (6pts) In order of Red, Green, Blue True: 3,2,1 False: Any combination except 3,2,1; however, the most common is 4,3,2 6) NDVI is defined in Eq. 1. Calculate NDVI from the spectral response of a pixel in Table 2. You do not need to answer in complete sentences for the question. Part of this question will be used as a tiebreaker (6pts) Eq. 1: (NIR-Red)/(NIR+Red) MODIS bands for NIR is 2 and Red is 1 ( )/( ) = 43.3/52.7 = ) Using Fig. 1, near what other land cover type is agriculture typically found? Which land cover type has grown the most between 1973 and 1997? Second largest growth? Which land cover type has shrunk the most over this watershed? Between which images did the most change occur? (10pts) Water or Riparian is acceptable Mesquite Woodland Urban Desertscrub 8) Which satellite platform(s) is/are least sensitive to cloud cover? Why? (4pts) Synthetic aperture radar (SAR) is the only type that can definitely penetrate heavy cloud cover. LiDAR has some bands that are less susceptible if the energy output is high enough; however, it is generally not a feasible approach. 9) Using Fig 2., as of 2004, where is most of the Hemlock Wooly Aphid infestations currently located? If we assume that this species needs the presence of Hemlock to spread within 5 counties, are any regions currently safe from infestation? Provide a scientifically sound reason why there are isolated infections of the Hemlock Wooly Aphid (e.g. infected county surrounded by uninfected Hemlock). (6pts) Eastern USA, Eastern Application Mountains No regions are safe using this criteria Anthropogenic or animal-based transport of the aphids (although anthropogenic are more likely).
27 10) Using Fig 3., what process in the hydrologic cycle individually involves the largest volume of water? As global warming increases the surface temperature of the earth, it will increase evaporation and transpiration rates. What must happen to balance out this increase? (6pts) Evaporation of ocean water Increased precipitation rates 11) If global CO 2 increases but temperatures do not change, what will have to a plant's transpiration rate? If CO 2 is stable, but global temperature increases, what will have to a plant's transpiration rate? (4pts) Transpiration rates will decrease with CO2 increase Transpiration rates will increase with temperature increases 12) Using Fig 4., where in the USA is fire potential the highest on 8/6/08? Why does this area have a higher risk potential? Why might the USFS not provide a fire potential for agricultural areas (e.g. Most of IL, IN etc.) (6pts) Nevada and the other western mountain states. Without ancillary data is difficult to know for sure why; however, it is most likely due to reduced rainfail in mountain regions and warm summer temperatures. a) Some of these areas are irrigated which reduces the accuracy of the models, b) these areas are heavily managed, thus reducing the likelihood of a fire. 13) Using Fig. 5, why is the reflectance of water essentially zero around 0.8 µm? At this same region healthy vegetation has high reflectance, what are some reasons that a healthy plant will reflect more in this region over the red region ~0.67 µm. (6pts) Water absorbs most energy at wavebands > 0.8 µm. Plants scatter light in the NIR to minimize heating the plant in regions that are not useful for photosynthesis The red region is photosynthetically active; thus the plant absorbs light to produce sugars.
28 14) Using Fig. 6 and Fig 7, is Europe most likely experiencing a heat or cold wave in July of 2003? Approximately what is the difference between 2003 and the averaged (Hint 273K = 0 C). Are there any other areas with extreme differences between the two figures, if so, what are they and in which direction is the difference. Part of this question will be a tie breaker. (8 pts) Averages C July C So Europe is in a heat wave 3 C-13 C acceptable Any area generally accepted as long as it was justified and the range matches 15) Subsidence is the process of which earth settles to a lower elevation. Fig. 8 and Fig. 9 demonstrate subsidence located near several mine shafts (indicated by the red and white lines). Why might managers of mining operations be interested in figures such as these? How many areas are affected on 8/14/07, 12/30/07? In units of area, how much as the largest subsidence grown from these two dates. You may approximate by estimating each area as a known polygon (please indicate which polygon utilized to ensure accurate grading). (8 pts) They are interested because this is an indication that mining shafts may collapse. The also cause structural damage to buildings, thus need to be mitigated 8/14/07 2 areas; 12/30/07 3 areas. ~1.2km^2 = 1.2e10^6 (For the image printed it was ~2.75 cm^2; however, this could change a bit based on how the test document is printed, therefore the correct units should be that of the map [meters]). 16) Due to the devastation of natural disasters, such as the one in Japan on March 11 th, 2011, there is a rush to capture and develop before and after images, such as Fig. 10. While these images can be useful to indicate areas affected by the disaster, list and describe at least 3 potential problems associated with these types of images (e.g. how might someone misinterpret information from the before and after images, etc.) (6pts) There may be seasonal differences March vs. September (vegetation more developing in September in Japan) Anthropogenic changes not related to the disaster (e.g. building a road, etc.) Non-anthropogenic changes not related to the disaster (Weather, tidal, effects of aftershocks etc.) 17) Fig. 11 shows an impervious land surface map. Why are city planners interested in such maps? What is the primary driver for increasing impervious surfaces? How much city planners mitigate some increases in impervious surfaces? (6pts) Impervious surfaces increase run-off, thus stresses the sewage systems Urban development (build roads, buildings, etc.) Require developers to use materials that are less impervious, require buffer zones, etc.
Remote Sensing (C) Team Name: Student Name(s):
 Team Name: Student Name(s):") Team Name: Student Name(s): Remote Sensing (C) Nebraska Science Olympiad Regional Competition Henry Doorly Zoo Saturday, February 27 th 2010 96 points total Please answer all questions with complete sentences
Team Name: Student Name(s): Remote Sensing (C) Nebraska Science Olympiad Regional Competition Henry Doorly Zoo Saturday, February 27 th 2010 96 points total Please answer all questions with complete sentences
The IPCC Working Group I Assessment of Physical Climate Change
 The IPCC Working Group I Assessment of Physical Climate Change Martin Manning Director, IPCC Working Group I Support Unit 1. Observed climate change 2. Drivers of climate change 3. Attribution of cause
SCIE 4104E - Environmental Systems Science. Tarendra Lakhankar NOAA-CREST Center, The City University of New York
 SCIE 4104E - Environmental Systems Science Tarendra Lakhankar NOAA-CREST Center, The City University of New York About Class This course focuses on Earth as a system and explores the interdependent relationships
Steve Wohlmuth Central Kings Rural High School Canads
 Climate Change What Are Greenhouse Gases? Some greenhouse gases occur naturally in the atmosphere, while others result from human activities (anthropogenic gases). Naturally occurring greenhouse gases
Chapter 19 Global Change
 Chapter 19 Global Change Global Change Global change- any chemical, biological or physical property change of the planet. Examples include cold temperatures causing ice ages. Global climate change-changes
Chapter 19 Global Change
 Chapter 19 Global Change Global Change change - any chemical, biological or physical property change of the planet. Examples include cold temperatures causing ice ages. Global change - changes in the climate
Climate Change and Air Quality
 Climate Change and Air Quality SW PA Air Quality Action June 6, 2007 Peter J. Adams Associate Professor Civil and Environmental Engineering Engineering and Public Policy Outline Climate Change Primer What
Chapter 19 Global Change. Wednesday, April 18, 18
 Chapter 19 Global Change Module 62 Global Climate Change and the Greenhouse Effect After reading this module you should be able to distinguish among global change, global climate change, and global warming.
Chapter 19: Global Change
 1 Summary Of the Case Study Polar Bear population in the Antarctic going down because temperatures are going up and melting the caps. Polar bears are losing their habitat, they also can t get their food
GLOBAL WARMING IS HAPPENING GLOBAL WARMING WILL BE VERY HARD TO STOP (By John B. Wheeler, member Potomac River Association)
") GLOBAL WARMING IS HAPPENING GLOBAL WARMING WILL BE VERY HARD TO STOP (By John B. Wheeler, member Potomac River Association) READ ON AND SEE WHY YOU NEED TO BE WORRIED The Outline of what follows: 1 The
GLOBAL WARMING IS HAPPENING GLOBAL WARMING WILL BE VERY HARD TO STOP (By John B. Wheeler, member Potomac River Association) READ ON AND SEE WHY YOU NEED TO BE WORRIED The Outline of what follows: 1 The
How things work college course/cumulative global warming exam/testbank
 How things work college course/cumulative global warming exam/testbank From Wikiversity Contents 1 GlobalWarmingCumulative 1.1 GlobalWarmingCumulative v1s1 1.1.1 Key to GlobalWarmingCumulative v1s1 1.2
The Atmospheric System 6.1
 The Atmospheric System 6.1 What is the atmosphere? Layer of gas that surrounds our planet. The atmosphere is a dynamic system with inputs, outputs, storages and flows. Heat and pollutants are carried
Research and Applications using Realtime Direct Broadcast Imagery, Weather Radar, and LiDAR in Disaster Response and Preparedness
 Research and Applications using Realtime Direct Broadcast Imagery, Weather Radar, and LiDAR in Disaster Response and Preparedness Richard P. Watson, Ph.D. University of New Mexico Earth Data Analysis Center
Soil & Climate Anne Verhoef
 Soil Research Centre Anne Verhoef December 12, 2014 University of Reading 2014 www.reading.ac.uk Overview Aim: Improve understanding of soil-plant-atmosphere feedbacks for sustainable soil services Selection
NATS 101 Section 13: Lecture 34. Global Warming Part I
 NATS 101 Section 13: Lecture 34 Global Warming Part I Outline of three part global warming presentation What is the problem? How has the Earth s climate changed in recent years? Are these changes attributable
Lecture 11: Global Warming. Human Acticities. Natural Climate Changes. Global Warming: Natural or Man-Made CO 2 CH 4
 Lecture 11: Global Warming Human Acticities CO 2 CH 4 The initial appearance of human species: last 100,000 to 200,000 years Development of the first civilization: the last 10,000 years What is the sensitivity
Scientific Foundation of Climate Change. Human Responsibility for Climate Change
 Scientific Foundation of Climate Change EOH 468 CSU Northridge Spring 2010 Peter Bellin, CIH, Ph.D. 1 Human Responsibility for Climate Change The IPCC finds that it is very likely that emissions of heat-trapping
GLOBAL CLIMATE CHANGE
 1 GLOBAL CLIMATE CHANGE From About Transportation and Climate Change (Source; Volpe center for Climate Change and Environmental forecasting, http://climate.volpe.dot.gov/trans.html Greenhouse effect has
Greenhouse Effect. How we stay warm
 Greenhouse Effect How we stay warm The Sun s energy reaches Earth through Radiation (heat traveling through Space) How much solar radiation reaches Earth? The Earth s surface only absorbs 51% of incoming
Global Climate Change
 Global Climate Change MODULE 11: GLOBAL CLIMATE CHANGE UNIT 1: BIODIVERSITY Objectives Define terms. Understand global climate change. Describe the basic predictions of the global climate models. Understand
Global Climate Change. The sky is falling! The sky is falling!
 Global Climate Change The sky is falling! The sky is falling! 1 Global Climate Change Radiative Equilibrium, Solar and Earth Radiation Atmospheric Greenhouse Effect Greenhouse Gases Global Climate Change
Session 14 Unit VI CLIMATIC CHANGE AND GLOBAL WARMING
 Session 14 Unit VI CLIMATIC CHANGE AND GLOBAL WARMING Dr. H.S. Ramesh Professor of Environmental Engineering S.J. College of Engineering, Mysore 570 006 Carbon di-oxide is a natural constituent of atmosphere,
Some resources (more websites later)
") Some resources (more websites later) Intergovernmental Panel Climate Change 2001: The Scientific Basis at http://www.ipcc.ch/pub/reports.htm John Houghton Global Warming - the complete briefing Cambridge
Some resources (more websites later) Intergovernmental Panel Climate Change 2001: The Scientific Basis at http://www.ipcc.ch/pub/reports.htm John Houghton Global Warming - the complete briefing Cambridge
Global Warming Science Solar Radiation
 SUN Ozone and Oxygen absorb 190-290 nm. Latent heat from the surface (evaporation/ condensation) Global Warming Science Solar Radiation Turbulent heat from the surface (convection) Some infrared radiation
Normal equatorial flow. Climate Variability. El Niño-Southern Oscillation Human-caused climate change Alternative Energy sources
 Normal equatorial flow Climate Variability El Niño-Southern Oscillation Human-caused climate change Alternative Energy sources Vertical normal flow ENSO disruption of flow Vertical ENSO flow Normal vs.
Intergovernmental Panel on Climate Change (IPCC) Fourth Assessment Report
 Fourth Assessment Report") Intergovernmental Panel on Climate Change (IPCC) Fourth Assessment Report Andrea J. Ray, Ph.D. NOAA Earth Systems Research Lab & NOAA-CIRES Western Water Assessment Boulder, CO Andrea.Ray@noaa.gov http:/www.cdc.noaa.gov
Intergovernmental Panel on Climate Change (IPCC) Fourth Assessment Report Andrea J. Ray, Ph.D. NOAA Earth Systems Research Lab & NOAA-CIRES Western Water Assessment Boulder, CO Andrea.Ray@noaa.gov http:/www.cdc.noaa.gov
Greenhouse Effect. The Greenhouse Effect
 Greenhouse Effect The Greenhouse Effect Greenhouse gases let short-wavelength radiation come into the Earth s atmosphere from the sun. However, they absorb and re-radiate Earth s long-wavelength radiation
FACTS ABOUT GL BAL WARMING. gogreen. Shop visit An Ekotribe Initiative
 FACTS ABOUT GL BAL WARMING Shop Online @ www.thegreenecostore.com Definition The earth is a natural greenhouse and is kept warm by water vapors, carbon dioxide (CO2), and other gases in the atmosphere,
Greenhouse gases. A snow-covered surface refl ects massive amounts of sunlight and therefore has a cooling effect on the climate.
 A k t u e l N a t u r v i d e n s k a b 2 0 0 9 G R E E N H O U S E G A S E S 13 Greenhouse gases - and their impact on the climate The greenhouse effect is the best understood and well mapped of the mechanisms
The NISAR Mission. Paul Siqueira Emerging Technologies and Methods in Earth Observation for Agriculture Monitoring College Park, 2018
 The NISAR Mission Paul Siqueira Emerging Technologies and Methods in Earth Observation for Agriculture Monitoring College Park, 2018 Flyer A one-page paper-flyer is available with more information NISAR
Global Ocean and Atmosphere Temperature Trends Compared
 Warmer Oceans result in coral bleaching and the death of coral reefs support more powerful hurricanes 32 Global Ocean and Atmosphere Temperature Trends Compared 33 Warmer Oceans and Coral Bleaching 1997-1998
Global Warming & Climate Change Review Learning Target 1
 Learning Target 1 Click and drag the word to fit the proper description. Word Ice Off Dates Ice Core Samples Description 1.Scientist can check the gases in the bubbles and provide a good estimate of the
CHAPTER 19. Global Change
 CHAPTER 19 Global Change WALKING ON THIN ICE Polar bears play important role in North Pole ecosystem Food seals Important as food and fur for clothing source for indigenous people Problem temperatures
LESSON 9: CONCEPTUALIZING MODULE II Factors Influencing Temperature
 LESSON 9: CONCEPTUALIZING MODULE II Factors Influencing Temperature PURPOSE/QUESTION To understand the need to compare data sets over different parameters thus increasing the strength for students climate
Role of Remote Sensing in Flood Management
 Role of Remote Sensing in Flood Management Presented by: Victor Veiga (M.Sc Candidate) Supervisors: Dr. Quazi Hassan 1, and Dr. Jianxun He 2 1 Department of Geomatics Engineering, University of Calgary
Grade 10 Academic Science Climate Change Unit Test
 Grade 10 Academic Science Climate Change Unit Test Part A - Multiple Choice: Circle the most correct answer. 1. What is the difference between weather and climate? a. Weather deals with wind and precipitation;
CMS and Decision Support Discussion Forum: Current and Near-term Satellite Assets
 CMS and Decision Support Discussion Forum: Current and Near-term Satellite Assets February 6, 2013 Diane E. Wickland 1 and Marc L. Imhoff 2 1 - NASA HQ, Science Mission Directorate, Earth Science Division
Teacher Guide Case Study: Carbon Dioxide and Global Warming: What is the Evidence?
 Teacher Guide Case Study: Carbon Dioxide and Global Warming: What is the Evidence? Developed by: Dan Shepardson Activity Focus: In this case study, students read and interpret data about the link between
Evidence and implications of anthropogenic climate change
 Evidence and implications of anthropogenic climate change Earth s Climate has always been changing 1) Is climate changing now? Global Warming? Sea level rising IPCC 2007 Fig. 5.13 (p. 410) Recontructed
read ALL of Chap. 21 Symbols to know: CO2 = carbon dioxide O2 = oxygen CH4 = methane (natural gas) Glucose = sugar
 Glucose = sugar") read ALL of Chap. 21 Symbols to know: CO2 = carbon dioxide O2 = oxygen CH4 = methane (natural gas) Glucose = sugar Koppen Climate Zones / Factors Carbon Cycle / Ocean Acidification Greenhouse Effect /
read ALL of Chap. 21 Symbols to know: CO2 = carbon dioxide O2 = oxygen CH4 = methane (natural gas) Glucose = sugar Koppen Climate Zones / Factors Carbon Cycle / Ocean Acidification Greenhouse Effect /
Atmosphere. The layer of gas surrounding the Earth
 Earth and Space Notes: Atmosphere Atmosphere The layer of gas surrounding the Earth Breakdown: Nitrogen (~79%) Oxygen (~21%) Argon, CO2, methane, ozone, water, nitrous oxides, sulphur dioxide, etc Gases
To provide timely, accurate, and useful statistics in service to U.S. agriculture
 NASS MISSION: To provide timely, accurate, and useful statistics in service to U.S. agriculture What does NASS do? Administer USDA s Statistical Estimating Program Conduct the 5-year Census of Agriculture
Main Natural Sources of Greenhouse Gases
 Main Natural Sources of Greenhouse Gases Content Atmospheric Composition Composition of the Earth s Atmosphere Greenhouse Gases The Radiative Forcing bar chart: AR5 version Natural Greenhouse Gases Water
Human Impact on the Environment: Part I
 Human Impact on the Environment: Part I The late Alan Gregg pointed out that human population growth within the ecosystem was closely analogous to the growth of malignant tumor cells, that man was acting
Aerosol from biomass burning and mineral aerosols. 1. What are aerosols from biomass burning?
 Lectures 40-41. Global change due to anthropogenic aerosols: Aerosol from biomass burning and mineral aerosols. Objectives: 1. What are aerosols from biomass burning? 2. What is mineral aerosol? 3. Direct
Urban Biodiversity and Climate Change. David J. Nowak USDA Forest Service Syracuse, NY, USA
 Urban Biodiversity and Climate Change David J. Nowak USDA Forest Service Syracuse, NY, USA Overview Urban Biodiversity Climate Change and Urban Climate Vegetation Effects Management Recommendations Urban
Remote Sensing of the Urban Heat Island Effect Across Biomes in the Continental USA
 Remote Sensing of the Urban Heat Island Effect Across Biomes in the Continental USA Marc Imhoff, Lahouari Bounoua, Ping Zhang, and Robert Wolfe NASA s Goddard Space Flight Center Land Cover Land Use Change
Atmosphere, the Water Cycle and Climate Change
 Atmosphere, the Water Cycle and Climate Change OCN 623 Chemical Oceanography 16 April 2013 (Based on previous lectures by Barry Huebert) 2013 F.J. Sansone 1. The water cycle Outline 2. Climate and climate-change
Global climate change and drought in the West. Kevin E. Trenberth NCAR
 Global climate change and drought in the West Kevin E. Trenberth NCAR Climate The atmosphere is a global commons. Air over one place is typically half way round the world a week later, as shown by manned
Climate Change : Facts and Future Scenarios
 Climate Change : Facts and Future Scenarios Dr Jim Salinger National Institute of Water & Atmospheric Research, Auckland, NZ FOA/MAF 6 th Annual Forest Biosecurity Workshop 8-9 th March 2007 Outline Facts
Suitable for grades 3-5. atmospheric composition. solar radiation. climate variability and change. volcanoes. clouds. carbon cycle.
 Color and Understand the Global Climate System atmospheric composition solar radiation climate variability and change H 2 0, CO 2, CH 4, N 2 O, O 3, etc. aerosols volcanoes clouds atmosphere-ice interaction
Global ClimateChange. Pedro M.M. Soares. Instituto Dom Luiz University of Lisbon
 Global ClimateChange Pedro M.M. Soares Instituto Dom Luiz University of Lisbon pmsoares@fc.ul.pt IPCC 5th AssessmentReportfor ClimateChange2013: The Physical Basis Observed Changes in the Climate System
Using Models to Make Predictions
 Activity APPLY For Educator 45 Minutes Grades 7-12+ Ages 12+ Using Models to Make Predictions How much do humans have to reduce greenhouse gas emissions to prevent major warming? For the complete activity
Energy and the Earth. Key words: Incoming Solar Radiation, Electromagnetic wave, Greenhouse effect, conduction, convection, radiation.
 S c i e n c e Energy and the Earth Key words: Incoming Solar Radiation, Electromagnetic wave, Greenhouse effect, conduction, convection, radiation. Energy transfer Heat is energy in transit from warmer
Understanding Global Warming
 Math 483 Spring Semester, 2013 California State University, Northridge Understanding Global Warming Global Warming is Real December 2012 is 334th consecutive Month with global temperatures above the 20th
Temperature Trend, Variability and Global Warming. Tarendra Lakhankar NOAA-CREST Center, The City University of New York
 Temperature Trend, Variability and Global Warming Tarendra Lakhankar NOAA-CREST Center, The City University of New York Overview Global Climate Change Greenhouse effect Watch Climate change mitigation
Human Activity and Climate Change
 Human Activity and Climate Change Textbook pages 482 501 Section 11.1 11.2 Summary Before You Read How might climate change affect the region where you live? Record your thoughts in the lines below. What
Climate Projections for the Chesapeake Bay
 Climate Projections for the Chesapeake Bay Dr. Bruce A. Wielicki NASA Langley Research Center December 5, 2013 VIMS Human Influence on Climate Carbon Dioxide Trends: 100yr lifetime Methane Trends Sulfate
read ALL of Chap. 21 Symbols to know: CO2 = carbon dioxide O2 = oxygen CH4 = methane (natural gas) Glucose = sugar
 Glucose = sugar") read ALL of Chap. 21 Symbols to know: CO2 = carbon dioxide O2 = oxygen CH4 = methane (natural gas) Glucose = sugar Koppen Climate Zones / Factors Carbon Cycle / Ocean Acidification Greenhouse Effect /
read ALL of Chap. 21 Symbols to know: CO2 = carbon dioxide O2 = oxygen CH4 = methane (natural gas) Glucose = sugar Koppen Climate Zones / Factors Carbon Cycle / Ocean Acidification Greenhouse Effect /
Climate Change 101. Dr. Dave DuBois. April 19, 2017
 Climate Change 101 Dr. Dave DuBois April 19, 2017 Is the climate changing? Past 1000 Years Northern Hemisphere temperature reconstructions Mann et al. 2008. Proceedings of the National Academy of Sciences,
How is the atmosphere different from outer space? a mixture of gases that surrounds the Earth
 Chapter 15 Atmosphere Section 1 Objectives Describe the composition of Earth's atmosphere. Explain why air pressure changes with altitude. Explain how air temperature changes with atmospheric composition.
Greenhouse Gas Measurements from Space. Chris O Dell Colorado State University
 Greenhouse Gas Measurements from Space Chris O Dell Colorado State University 1 Climate Forcings & Feedbacks Forcings Greenhouse Gases Aerosols Volcanic Eruptions Solar Forcing Temperature Change Feedbacks
CAN THE UNITED NATIONS KEEP CLIMATE CHANGE UNDER CONTROL?
 CAN THE UNITED NATIONS KEEP CLIMATE CHANGE UNDER CONTROL? Climate change is one of the major challenges of our time and adds considerable stress to our societies and to the environment. From shifting weather
What Causes Climate? Reid Pierce Fulbright Jr. High Bentonville, AR
 What Causes Climate? Reid Pierce Fulbright Jr. High Bentonville, AR Weather: the outdoor conditions at a particular time and place Climate: an average of weather conditions in a given area over a period
Readiness Activity. (An activity to be done before viewing the video)
") KNOWLEDGE UNLIMITED NEWS Matters Global Warming: Hot Enough for You? Vol. 3 No. 5 About NEWSMatters Global Warming: Hot Enough for You? is one in a series of six NewsMatters programs for the 1999-2000
KNOWLEDGE UNLIMITED NEWS Matters Global Warming: Hot Enough for You? Vol. 3 No. 5 About NEWSMatters Global Warming: Hot Enough for You? is one in a series of six NewsMatters programs for the 1999-2000
Sea ice field at time of annual minimum extent. NASA
 Sea ice field at time of annual minimum extent. NASA Climate Models & Climate Sensitivity: A Review Sea ice field at time of annual minimum extent. NASA Paul Kushner Department of Physics, University of
LECTURE #24: Mega Disasters Climate Change
 GEOL 0820 Ramsey Natural Disasters Spring, 2018 LECTURE #24: Mega Disasters Climate Change Date: 17 April 2018 I. Early Earth was more similar to present-day Venus o very high amounts of carbon dioxide
Farming from Space: Current and future opportunities for remote sensing to boost productivity for grain growers
 Farming from Space: Current and future opportunities for remote sensing to boost productivity for grain growers Hamlyn G Jones Division of Plant Sciences and University of Dundee, UK School of Plant Biology
Module 7 GROUNDWATER AND CLIMATE CHANGE
 Module 7 GROUNDWATER AND CLIMATE CHANGE Learning Objectives To become familiar with the basic concepts of the impacts of climate change on groundwater To explore the link between climate change impacts
Contents. Permafrost Global Warming: An Introduction...4. Earth Is Getting Hotter...6. Green Homes The Greenhouse Effect...
 Contents Global Warming: An Introduction...4 Earth Is Getting Hotter...6 The Greenhouse Effect...8 Greenhouse Gases...10 Ozone Layer Depletion...12 The Carbon Cycle...14 The Kyoto Protocol...16 Climate
Carbon Dioxide and Global Warming Case Study
 Carbon Dioxide and Global Warming Case Study Key Concepts: Greenhouse Gas Carbon dioxide El Niño Global warming Greenhouse effect Greenhouse gas La Niña Land use Methane Nitrous oxide Radiative forcing
Global warming: Evidence, risks and mitigation options (or: Why global warming is an energy issue) Filippo Giorgi Abdus Salam ICTP, Trieste
 Filippo Giorgi Abdus Salam ICTP, Trieste") Global warming: Evidence, risks and mitigation options (or: Why global warming is an energy issue) Filippo Giorgi Abdus Salam ICTP, Trieste Four frequent questions Is global warming happening? (If yes)
Global warming: Evidence, risks and mitigation options (or: Why global warming is an energy issue) Filippo Giorgi Abdus Salam ICTP, Trieste Four frequent questions Is global warming happening? (If yes)
Funding provided by NOAA Sectoral Applications Research Project ALTERING CLIMATE. Basic Climatology Oklahoma Climatological Survey
 Funding provided by NOAA Sectoral Applications Research Project ALTERING CLIMATE Basic Climatology Oklahoma Climatological Survey ATMOSPHERIC POLLUTANTS Acid Rain Acid Rain is the precipitation that carries
Climate Change and Ozone Loss
 Climate Change and Ozone Loss During the past 900,000 years, the earth has undergone a series of cold glacial periods followed by warmer interglacial periods. The past 10,000 years has been an interglacial
On the public release of carbon dioxide flux estimates based on the observational data by the Greenhouse gases Observing SATellite IBUKI (GOSAT)
") On the public release of carbon dioxide flux estimates based on the observational data by the Greenhouse gases Observing SATellite IBUKI (GOSAT) National Institute for Environmental Studies (NIES) Ministry
On the public release of carbon dioxide flux estimates based on the observational data by the Greenhouse gases Observing SATellite IBUKI (GOSAT) National Institute for Environmental Studies (NIES) Ministry
SimWater: Simulating Water Supply, Demand, and Management Mountains to Valley: Balancing forests, rivers, and downstream water users
 Name: Date: SimWater: Simulating Water Supply, Demand, and Management Mountains to Valley: Balancing forests, rivers, and downstream water users Water managers are entrusted to best allocate water based
Researcher 2017;9(12)
") Obtaining NDVI zoning map of SEBAL model during harvesting season in Salman Farsi sugarcane cultivation fields Sh. Kooti 1, A. Naseri 2, S.Boroomand Nasab 3 1 M. Sc. Student of Irrigation and Drainage,
Obtaining NDVI zoning map of SEBAL model during harvesting season in Salman Farsi sugarcane cultivation fields Sh. Kooti 1, A. Naseri 2, S.Boroomand Nasab 3 1 M. Sc. Student of Irrigation and Drainage,
greenhouse effect 1 of 5
 This website would like to remind you: Your browser (Apple Safari 4) is out of date. Update your browser for more security, comfort and the best experience on this site. Encyclopedic Entry greenhouse effect
Your web browser (Safari 7) is out of date. For more security, comfort and the best experience on this site: Update your browser Ignore
 is out of date. For more security, comfort and the best experience on this site: Update your browser Ignore") Your web browser (Safari 7) is out of date. For more security, comfort and the best experience on this site: Update your browser Ignore GREENHO U SE EFFECT For the complete encyclopedic entry with media
Your web browser (Safari 7) is out of date. For more security, comfort and the best experience on this site: Update your browser Ignore GREENHO U SE EFFECT For the complete encyclopedic entry with media
Analysis of Environmental and Climate Change for Pyin OO Lwin using Geographic Information System (GIS)
") 2018; SP1: 45-50 E-ISSN: 2278-4136 P-ISSN: 2349-8234 JPP 2018; SP1: 45-50 Hnin Hnin Htun Htet NE OO Aye Pwint Phyu, Thett OO Eain Analysis of Environmental and Climate Change for Pyin OO Lwin using Geographic
2018; SP1: 45-50 E-ISSN: 2278-4136 P-ISSN: 2349-8234 JPP 2018; SP1: 45-50 Hnin Hnin Htun Htet NE OO Aye Pwint Phyu, Thett OO Eain Analysis of Environmental and Climate Change for Pyin OO Lwin using Geographic
CLIMATE CHANGE AND YOU
 CLIMATE CHANGE AND YOU First of all, we should know that weather and climate are not the same thing. WEATHER IS: Short term Limited area Can change rapidly Difficult to predict WEATHER is what s happening
European Forest Fire Information System (EFFIS) - Rapid Damage Assessment: Appraisal of burnt area maps with MODIS data
 - Rapid Damage Assessment: Appraisal of burnt area maps with MODIS data") European Forest Fire Information System (EFFIS) - Rapid Damage Assessment: Appraisal of burnt area maps with MODIS data Paulo Barbosa European Commission, Joint Research Centre, Institute for Environment
European Forest Fire Information System (EFFIS) - Rapid Damage Assessment: Appraisal of burnt area maps with MODIS data Paulo Barbosa European Commission, Joint Research Centre, Institute for Environment
POSSIBILITY OF GCOM-C1 / SGLI FOR CLIMATE CHANGE IMPACTS ANALYZING
 POSSIBILITY OF GCOM-C1 / SGLI FOR CLIMATE CHANGE IMPACTS ANALYZING Y. Honda* a, M. Moriyama b, M. Hori c, M. Murakami c, A. Ono c, K. Kajiwara a a Center for Environmental Remote Sensing (CEReS), Chiba
Land Surface Monitoring from the Moon
 Land Surface Monitoring from the Moon Jack Mustard, Brown University Workshop on Science Associated with Lunar Exploration Architecture Unique Perspective of Lunar Observation Platform Low Earth Orbit:
II. CLIMATE CHANGE AND ADAPTATION
 II. CLIMATE CHANGE AND ADAPTATION Human beings have been adapting to the variable climate around them for centuries. Worldwide local climate variability can influence peoples decisions with consequences
NGSS correlations to Student Climate Data Learning Sequences.
 NGSS correlations to Student Climate Data Learning Sequences. How thoroughly the standard is addressed depends on the level of inquiry used with students. Student Climate Data & NGSS: High School Biomass
Climate: Earth s Dynamic Equilibrium
 Climate: Earth s Dynamic Equilibrium review session CCIU April 30, 2016 High-school standard HS-ESS2-4 focuses on the role energy flows play in Earth s climate HS-ESS2-4 Use a model to describe how variations
Remote Sensing of Mangrove Structure and Biomass
 Remote Sensing of Mangrove Structure and Biomass Temilola Fatoyinbo 1, Marc Simard 2 1 NASA Goddard Space Flight Center, Greenbelt, MD USA 2 NASA Jet Propulsion Laboratory, Pasadena, CA USA Introdution
Chapter Introduction. Matter. Ecosystems. Chapter Wrap-Up
 Chapter Introduction Lesson 1 Lesson 2 Lesson 3 Abiotic Factors Cycles of Matter Chapter Wrap-Up Energy in Ecosystems How do living things and the nonliving parts of the environment interact? What do you
Climate Change: Current State of the Science and Impacts
 Climate Change: Current State of the Science and Impacts Lloyd A. Treinish IBM Distinguished Engineer Chief Scientist, Environmental Modelling, Climate and Weather IBM Thomas J. Watson Research Center
Climate Change and the Campus. Contents. Welcome. iii. Introduction: A Word about Scientific Knowledge. Section 1: What Is Climate Change?
 Climate Change and the Campus Contents iii v 1 5 17 29 Welcome Introduction: A Word about Scientific Knowledge Section 1: What Is Climate Change? Section 2: The Consequences of Climate Change Section 3:
Climate Change Science Tutorial #1: Overview of Our Understanding of the Climate System and Observed Climate Impacts
 Climate Change Science Tutorial #1: Overview of Our Understanding of the Climate System and Observed Climate Impacts September 2013 ACS Climate Science Project, OMSI Others work, collected by Prof. Julie
Greenhouse Effect & Climate Change
 Greenhouse Effect & Climate Change Greenhouse Effect Light energy from the sun (solar radiation) is either reflected or absorbed by the Earth. Greenhouse Effect When it is absorbed by the Earth (or something
Is the Climate Changing? Is the Climate Changing? Is the Climate Changing? Is the Climate Changing? 12/13/2016. Yes!
 1 2 3 Yes! 4 Yes! But Earth's climate is always changing! 5 Yes! But Earth's climate is always changing! 6 Throughout its 4.5 billion year history, Earth's climate has alternated between periods of warmth
Remote Sensing Uses in Agriculture at NASS
 Remote Sensing Uses in Agriculture at NASS United States Department of Agriculture (USDA) National Agriculture Statistics Service (NASS) Research and Development Division Geospatial Information Branch
The Greenhouse Effect
 Name: Date: The Greenhouse Effect This document provides an overview of the earth's atmospheric "greenhouse effect" by briefly exploring the atmospheres of nearby planets and discussing our atmosphere's
Global Warming and Sea Level Rise
 MATERIALS SUITABLE FOR GRADES 1-8 This activity will show how increased temperatures will hasten the melting of ice in the environment, contributing to a rise in sea level and subsequent flooding of coastal
The Forest Changescape: a view from above
 The Forest Changescape: a view from above Daniel J. Hayes ORNL Environmental Science Division SAMSI - Program on Mathematical and Statistical Ecology (ECOL) Workshop Wednesday, 20 August 2014 Research
11/15. Agenda. Albedo Effect Simulator: Discussion Climate Change Notes
 Agenda 11/15 Albedo Effect Simulator: Discussion Climate Change Notes Announcements -Test (11/20) -Notebook check (tomorrow) -Lab due (11.59pm, tomorrow) -No quiz tomorrow Criteria Table of contents labeled
Did You Know? Climate Change & Coral Activities. Background Information Climate Change. Theme. Objectives
 Climate Change & Coral Activities Theme The Ocean stabilizes our respective climates. Global warming threatens to alter this delicate balance. We still have time to change our energy consumption patters