Seasonal changes in water quality and Sargassum biomass in southwest Australia
|
|
|
- Albert Underwood
- 6 years ago
- Views:
Transcription
 Seasonal changes in water quality and Sargassum biomass in southwest Australia. Marine Ecology Progress Series, 551. pp. 63 79. ISSN 0171 8630 doi: https://doi.org/10.")
1 Seasonal changes in water quality and Sargassum biomass in southwest Australia Article Accepted Version Hoang, T. C., Cole, A. J., Fotedar, R. K., O Leary, M. J., Lomas, M. W. and Roy, S. (2016) Seasonal changes in water quality and Sargassum biomass in southwest Australia. Marine Ecology Progress Series, 551. pp ISSN doi: Available at It is advisable to refer to the publisher s version if you intend to cite from the work. To link to this article DOI: Publisher: Inter Research All outputs in CentAUR are protected by Intellectual Property Rights law, including copyright law. Copyright and IPR is retained by the creators or other copyright holders. Terms and conditions for use of this material are defined in the End User Agreement.
2 CentAUR Central Archive at the University of Reading Reading s research outputs online
3 1 2 Manuscript has been accepted for publication in the Marine Ecology Progress Series. doi: /meps11735 (in-press) Season changes in water quality and Sargassum biomass in Southwest Australia Tin C. Hoang 1*, Anthony J. Cole 1, Ravi K. Fotedar 1, Michael J. O Leary 1,2, Michael W. Lomas 3 Shovonlal Roy Department of Environment and Agriculture, School of Science, Faculty of Science and Engineering, Curtin University, Perth, WA 6102, Australia 2 Australian Institute of Marine Science, Crawley, WA 6009, Australia 3 Provasoli-Guillard National Centre for Marine Algae and Microbiota, Bigelow Laboratory for Ocean Sciences, East Boothbay, Maine 04544, U.S.A. 4 Department of Geography and Environmental Science, The University of Reading, Whiteknights, PO Box 227, Reading RG6 6AB, U.K *Corresponding author: tin.hoangcong@postgrad.curtin.edu.au Running tittle: Sargassum beds in Southwest Australia 21 1
4 ABSTRACT Sargassum C. Agardh is one of the most diverse genera of marine macroalgae and commonly inhabits shallow tropical and sub-tropical waters. This study aimed to investigate the effect of seasonality and the associated water quality changes on the distribution, canopy cover, mean thallus length and the biomass of Sargassum beds around Point Peron, Shoalwater Islands Marine Park, Southwest Australia. Samples of Sargassum and seawater were collected every three months from summer 2012 to summer 2014 from four different reef zones. A combination of in situ observations and WorldView-2 satellite remote-sensing images were used to map the spatial distribution of Sargassum beds and other associated benthic habitats. The results demonstrated a strong seasonal variation in the environmental parameters, canopy cover, mean thallus length, and biomass of Sargassum, which were significantly (P < 0.05) influenced by the nutrient concentration (PO4 3-, NO3 -, NH4 + ) and rainfall. However, no variation in any studied parameter was observed among the four reef zones. The highest Sargassum biomass peaks occurred between late spring and early summer (from September to January). The results provide essential information to guide effective conservation and management, as well as sustainable utilisation of this coastal marine renewable resource KEY WORDS: Environmental parameters, Sargassum beds, Seasonality, Canopy cover, Mean thallus length
5 INTRODUCTION Sargassum species are brown macroalgae with a global distribution, and are especially dominant in shallow tropical and sub-tropical waters (Hanisak & Samuel 1987, Mattio et al. 2008, Mattio & Payri 2011). Sargassum are commonly attached to rocks, but can also have floating life forms. In coastal areas and surrounding offshore islands, they form dominant communities playing vital ecological roles for marine ecosystems by providing feeding grounds for sea birds and sea lions and providing essential nursery habitats for invertebrates, larval and juvenile fish surrounding these islands (Wells & Rooker 2004, Tyler 2010). Sargassum also represents a living renewable resource that is used in medicines, and for the production of fertilisers, alginate, and bio-fuels (Chengkui et al. 1984, Arenas & Fernández 2000, Rivera & Scrosati 2006, Hong et al. 2007). Approximately 46 Sargassum species are found along the Southwest Australian (SWA) coast (DPaW 2013) and the majority of these have been studied to determine their taxonomic affiliation, including the molecular basis of identification (e.g. Kendrick 1993, Kendrick & Walker 1994, Goldberg & Huisman 2004, Dixon & Huisman 2010, Dixon et al. 2012, Rothman et al. 2015), and physiology (De Clerck et al. 2008, Huisman et al. 2009, Staehr & Wernberg 2009, Kumar et al. 2011, Muñoz & Fotedar 2011). However, few studies have been carried out on the impact of seasonality on Sargassum along the subtropical/temperate coastal zone of SWA (Kendrick 1993, Kendrick & Walker 1994). Previous studies have shown that the growth, development and distribution of Sargassum beds are strongly influenced by physicochemical water parameters (Payri 1987, Ragaza & Hurtado 1999, Mattio et al. 2008), which play an important role in influencing nutrient uptake via photosynthesis (Nishihara & Terada 2010). Seasonal variations in the physicochemical parameters of seawater strongly influence changes in Sargassum canopy structure, which in turn, affect the density of the local populations (Ang & De Wreede 1992, Arenas & Fernández 2000, Rivera & Scrosati 2006, Ateweberhan et al. 2009). 3
6 In recent years, satellite remote-sensing studies have successfully been applied to benthic marine habitat mapping, and more specifically, have been used to estimate macroalgal biomass in coastal waters (Andréfouët & Robinson 2003, Tiit et al. 2006, Benfield et al. 2007, Vahtmäe & Kutser 2007, Casal et al. 2011a, Fearns et al. 2011, Maheswari 2013). However, the most clear and direct method for marine habitat mapping is visual observations, also termed ground-truthing, using either SCUBA or snorkel survey methods, which provides an essential input to remote-sensing observations (Komatsu et al. 2002). A methodology for mapping Laminariales (Kelp) in turbid waters of the Seno de Corcubión (Northwest Spain), using SPOT-4 satellite images was developed, which showed that the mapping of Sargassum beds could be improved through the application of higher spectral resolution images, increasing the spatial and radiometric resolution and performing new field calibrations simultaneously with the acquisition of images (Casal et al. 2011b). For example, lower resolution Landsat (30 m) and higher resolution Quickbird (2.4 m) satellite images have been used to estimate the spatial distribution of Sargassum beds in South West Lagoon, New Caledonia (Mattio et al. 2008). Nevertheless, only a few studies have been carried out to assess of the spatial distribution of Sargassum and their temporal biomass variations in marine coastal areas using high-resolution satellite remote-sensing data (Noiraksar et al. 2014, Hoang et al. 2015). The WorldView-2 (WV-2) satellite images provide one of the highest available spatial and spectral resolutions (eight spectral sensors ranging from 400 1,040 nm) (Lee et al. 2011, DigitalGlobe 2013). However, a few detailed mapping studies of Sargassum have been performed using high-resolution satellite images, such as WV-2 (Hoang et al. 2015). In addition, a direct visual approach that is integrated into high spatial resolution remote-sensing observations could represent a robust approach to minimize costs and increase the accuracy of detection and distribution patterns of Sargassum shallow coastal waters. The aim of this study is to investigate the effects of seasonal changes in water quality on canopy cover, mean thallus length and the Sargassum biomass at a fringing limestone reef in Point Peron, SWA. We have used in situ 4
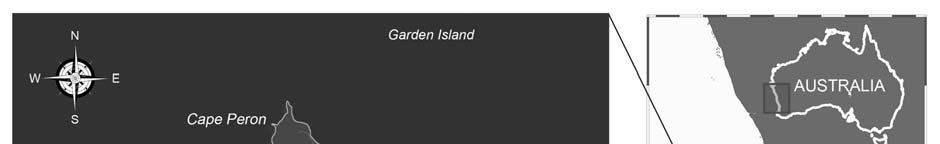
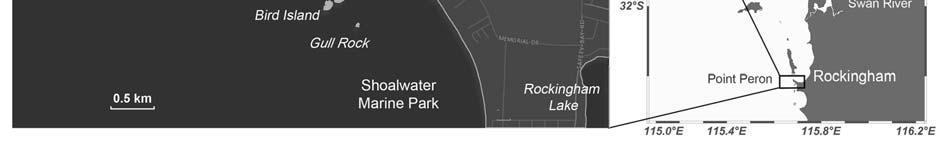
7 observations and remote sensing methods to study the seasonal variation in physicochemical water parameters with changes in mean thallus length, canopy cover, and biomass of the Sargassum community and determined how these changes impacts the broader spatial distribution of Sargassum MATERIALS AND METHODS Study sites We selected our demonstration site Point Peron, SWA, which is a small peninsula located within the Shoalwater Islands Marine Park, an area of approximately 67 km 2, west of the Rockingham city, 50 km south of Perth (Fig. 1). The point is approximately 930 m long and 1,450 m wide and is surrounded by a chain of limestone reefs and islands, including Garden Island to the north. As part of the Shoalwater Islands Marine Park, Point Peron has a high diversity of marine fauna and flora (DEC 2011). The study area includes a chain of limestone reefs approximately 450 m offshore (32 14' 32 17'S and ' 'E). The coastal area of Point Peron was divided into four zones: the Lagoon zone (LZ), Back reef (BR), Reef crest (RC) and Fore reef (FR) zone with the distance approximately 100 m between each zone (Rützler & Macintyre 1982) (Fig. 2). The field studies were carried out from September 2012 to December 2014 during four well-defined seasons; summer (December to February), autumn (March to May), winter (July to August), and spring (September to November) (BoM Australia 2013) Field sampling methods Sampling frequency The total duration of the trial was two and half years wherein summer and spring were represented three times and winter and autumn were represented twice. At least one sampling trip 5
8 was carried out per season, however, we could sample twice during summer and spring seasons which were then averaged out. During every trip, four 400 m long transects were sampled. The average depth along each transect ranged from 0.3 to 2.5 m. For water quality analysis, one sample was collected from every transect. For canopy cover (CC), fresh biomass (FB), and mean thallus length (MTL) of Sargassum spp, every transect was further monitored from four reef zones by deploying random quadrats ( m), one for each reef zone. The distance between the quadrats ranged from 20 to 80 m. The above protocol provided four samples for water quality analysis and 16 (4 transects 4 quadrats) samples for Sargassum measurements per season. Sampling description The transects were selected based-on the actual study site s topography and covering a range of different habitats. Using SCUBA survey techniques, we monitored and sampled Sargassum spp. along four predefined transects extending from the coastline to offshore. From each transect the seawater samples were collected in a 1-L polyethylene bottle. The Sargassum spp. within each quadrat was collected, stored in labelled polyethylene bags and brought to the Curtin Aquatic Research Laboratory (CARL), Curtin University, Western Australia (WA). The locations of the sampling quadrats were recorded by a hand-held GPS (Garmin etrex 10). The collected Sargassum samples were retained in fibreglass tanks with seawater under natural sunlight. The samples were provided with constant aeration till further measurements. Fresh specimens were photographed immediately after arrival at the CARL. The holdfasts, blades, vesicles, and receptacles were also examined and photographed. Sargassum specimens were identified based-on taxonomic references (Noro et al. 1994, Phillips 1994, Garton 1997, Huisman 2000, Huisman et al. 2006, Guiry & Guiry 2014). A morphological study of Sargassum samples was under taken on dried specimens. Herbarium specimens were stored at the CARL. Underwater video and photographs were captured along the monitored transects from five sampling trips in June and 6
9 September in 2013, and January, March, and July in These data were used for ground- truthing and classifying the marine habitats Meteorological data and environmental parameters Meteorological data, including the maximum (MaxAT, o C), mean and minimum (MinAT, o C) air temperature, solar exposure (SE) (MJ m -2 ), and monthly rainfall for each season, were acquired from the nearest Bureau of Meteorology weather station, at Garden Island (32 14'24"S '48"E), 2 km north of Point Peron (BoM Australia 2013). Euphotic depth (ED) (m), sea level pressure (SLP) (hpa), colored dissolved organic matter (CDOM) index, photosynthetically active radiation (PAR), sea surface temperatures (SSTs), and chlorophyll-a concentration (Chl-a) (mg m -3 ) in the study area (32 12' 32 17'S, ' 'E) were extracted from the Moderate Resolution Imaging Spectroradiometer (MODIS) satellite data. The northward wind (NW) (m s -1 ) was extracted from the Modern Era Retrospective-analysis for Research and Applications (MERRA) flat form in the Giovanni system, developed and maintained by the National Aeronautics and Space Administration (NASA) (Acker & Leptoukh 2007). In situ seawater temperature (i-sst), conductivity and ph were measured in each season using a portable waterproof o C/ mv/ ph meter (CyberScan ph 300, Eutech Instruments, Singapore). Salinity was measured using a hand-held refractometer (Atago RHS-10ATC, Japan) in practical salinity units, and dissolved oxygen (DO) was determined with a digital DO meter (YSI 55, Perth Scientific, Australia). Seawater samples were collected during each sampling season for the analysis of nutrients; nitrate, nitrite, ammonium, and phosphate. All samples were stored in 1-L polyethylene bottles and kept in a cold container (approximately 10 o C) in the dark. Samples were transferred to the CARL for analysis within 48 h following collection and followed the methods described in Standard Methods for the Examination of Water and Wastewater (APHA 1998). Nitrate (NO3 - ) and nitrite (NO2 - ) were measured using a Hach DR/890 Colorimeter (Hach, 7
10 Loveland, CO, USA) with the cadmium reduction method (Method 8171) and diazotization method (Method 8507), respectively (APHA 1998). Phosphate (PO4 3- ) concentration was analysed by Ascorbic acid method (Standard Method 4500-PE) and ammonium (NH4 + ) was determined by using Aquanal test kits (Sigma-Aldrich, Germany) (see Table 1 for the list of symbols and acronyms) Satellite remote-sensing data and processing WorldView-2 satellite images at a 2-m spatial resolution were acquired on 7 February 2013 (austral summer), which was a period of high biomass and areal extent of Sargassum beds. Satellite remote-sensing WV-2 images were adjusted to pseudo-color composite images prior to the classification process, to enhance the image contrast to detect the Sargassum beds. The acquired WV-2 images from DigitalGlobe were registered into Georeferenced the global geodetic system 1984 for latitude and longitude. The ground truth data were acquired and confirmed using in situ field checks from five survey trips in 2013 and The ENVI 4.7 environment for visualizing images was used to mask out the land area that was not used for classification at the study area (ENVI 2014). Method of K-means unsupervised classification was employed for image classification as it is the most commonly used classifier in reef studies (Benfield et al. 2007, Hoang et al. 2015). A toolbox in ENVI 4.7 was employed for the classification and to count the number of pixels of the WV-2 satellite image that was used to detect the distribution of Sargassum beds. After classification, the data were converted from raster to vector format and were edited in geographical information systems software packages. The complete diagrammatic processing imagery is presented in Figure Data analysis 8
11 Seaweed distribution and abundance data were processed using statistical software, IBM SPSS Statistics 20 and Microsoft Excel One-way analysis of variance (ANOVA) and general linear models were employed to test for significant differences between seasons in seawater quality. A two-way ANOVA was carried out to test the effects of seasons and distribution sites on the Sargassum CC and MTL. The multiple comparison, least significant difference (LSD s) post hoc test, was also implemented to test for the statistical significance among treatments. The statistical significance level was set at Principle component analysis (PCA) was employed to evaluate the interaction between the physical, chemical and biological parameters and their effect on Sargassum spp. Results from the PCA were acquired based on the correlation matrix of the mean values of water quality parameters against sampling times. Principle component analysis was prepared by using the latest XLSTAT (Addinsoft, France) package for Microsoft Excel. All the results were presented as means ± S.E. (standard error), unless otherwise stated RESULTS Temporal variation in environmental conditions The analysis of air temperature over the three study years ( ) indicates that the monthly mean temperature was highest in the summer months (December to February). Temperatures then decreased in autumn (March to May) and were lowest in winter (June to August) and finally increased in spring (September to November). In the summer months, the maximum monthly mean temperature reached 28.2 ± 0.6 o C and in autumn, it reached 24.1 ± 0.9 o C. In winter and spring, the maximum monthly mean temperatures were 18.5 ± 0.2 and 21.7 ± 1.3 o C, respectively. In 2012, the mean air temperature reached a maximum in January (30.5 o C) and was lowest in July (9.9 o C) (Fig. 3a). Sea surface temperatures also showed a seasonal pattern, with values ranging from 12.9 to 24.1 o C. There were significant (ANOVA, F(9, 37) = , P < 0.001) differences in SSTs 9
12 between the seasons, except for between winter and spring (Fig. 3a). Rainfall and PAR usually showed an inverse pattern and both showed a strong seasonal variation. The PAR reached the highest value in the summer at 58.5 ± 1.5 Einstein m -2 d -1 (a maximum in December 2013 of 63.2 Einstein m -2 d -1 ). Although the monthly rainfall was only 2.6 mm, mean summer rainfall was 11.9 ± 6.4 mm. In contrast, the PAR was the lowest in the winter months at 22.8 ± 3.6 Einstein m -2 d -1 (17.5 Einstein m -2 d -1 in June 2013) and the highest mean rainfall of 95.5 ± 11.9 mm was reached in winter (the maximum value of mm was in September 2013 (Fig. 3b). Seawater salinity in the study area ranged from 35.4 to 36.5 among the seasons, but the differences were not significant (ANOVA, F(9, 37) = 1.43, P = 0.224). The electrical conductivity of seawater in the study area also differed significantly between the sampled seasons (ANOVA, F(9, 37) = 17.01, P < 0.001), with conductivity values ranging from to ECs. Dissolved oxygen (ANOVA, F(9, 37) = 30.05, P < 0.001) and ph (ANOVA, F(9, 37) = 3.32, P = 0.007) were significantly different between the seasons and ranged from 5.39 to 8.27 mg L -1, and , respectively (Table 2). Significant differences were observed in all nutrient levels among seasons during the study period at Point Peron as determined by one-way ANOVA where NO2 - (ANOVA, F(3, 36) = 12.05, P < 0.05), NO3 - (ANOVA, F(3, 36) = 13.38, P < 0.05), NH4 + (ANOVA, F(3, 32) = 5454, P < 0.05), PO4 3- (ANOVA, F(3, 36) = 7.38, P = 0.001). In particular, the concentration of nitrite (NO2 - ) was relatively low, ranging from µg L -1 during the study period. The nitrate (NO3 - ) concentration reached its highest value in spring 2014 (0.48 ± 0.06 mg L -1 ) and lowest value in summer 2013 (0.02 ± mg L -1 ). The concentration of ammonium (NH4 + ) during the study period ranged from mg L -1 and that of phosphate (PO4 3- ) ranged from mg L -1 and reached the highest value in spring 2014 and lowest value in summer In general, the nutrient concentrations were lowest in autumn and highest in spring throughout the study period (Table 3)
13 Seasonal pattern of Sargassum canopy cover The mean values of Sargassum CC in the selected quadrats at the four sites were higher during the warmer months (spring and summer) than in the cooler months (autumn and winter). The mean value of Sargassum CC for the whole area was highest (91.7 ± 2.6 %) in spring 2014 and was lowest (29.7 ± 10.1 %) in autumn 2013 at all sites. Thus, a two-way ANOVA revealed that both seasons and reef sites did affect the Sargassum CC which differed significantly between sampling seasons (ANOVA, F(9, 26) = 9.88, P < 0.001) and reef sites (ANOVA, F(3, 26) = 5.86, P = 0.03) from spring 2012 to summer 2014 (Fig. 4a) The mean length of Sargassum thalli The mean length of the seasonally harvested Sargassum thalli from randomized quadrats at each site is shown in Figure 5. The longest thalli were found in months with higher temperatures (summer 2013 and spring to summer 2014). The MTL for all sampling sites was highest in spring 2014 (53.5 ± 9.6 cm). In a similar pattern of coverage, the MTL was also lowest in the cold months, when the mean length ranged from 11.5 ± 1.5 cm and 13.6 ± 0.7 cm for autumn 2013 and 2014 winter, respectively (Fig. 4b). In terms of spatial distribution, the BR sites had the longest Sargassum thalli during all seasons (31.3 ± 4.7 cm). The height of Sargassum thalli in the FR averaged 28.4 ± 6.9 cm in all seasons. The shortest thalli were present in the LZ (25.9 ± 4.3 cm). The two-way ANOVA revealed that reef sites did not affect the Sargassum MTL (ANOVA, F(3, 26) = 0.59, P = 0.628), but the seasonal changes did have an effect (ANOVA, F(9, 26) = , P < 0.001) from spring 2012 to summer The distribution of Sargassum beds and associated marine habitats 11
14 The Sargassum CC was widely distributed around Point Peron. The highest coverage of Sargassum was recorded at the FR, followed by the RC, BR and LZ sites, with values of 75.9 ± 6.5 %, 63 ± 6.7 %, 61.4 ± 6.7 %, and 51.9 ± 6.4 %, respectively (Table 4). However, no differences (P > 0.05) were found between reef sites. The surveyed data showed that three dominant Sargassum species were present in the study area: S. spinuligerum, S. swartzii, and S. confusum. In addition, S. longifolium was less abundant in the FR zone than the other species. The classification of the benthic habitat was confirmed using WV-2 satellite images. Sargassum was mainly distributed on the coral reefs and submerged limestone substrates from Gull Rock to Bird Island, White Rock and further west from Point Peron, extending to the area further south of the Shoalwater Islands Marine Park. Field studies showed that the bottom depth of the Sargassum distribution area was relatively shallow (between 1.5 and 10 m). A sandy bottom and hard coral substrates were frequently found around Sargassum beds, and the boundaries between Sargassum and seagrass beds were detected with a high spatial resolution (2 m). Five bottom types were identified, including seaweeds (Sargassum sp. and Ecklonia sp.) canopy, seagrass, sand, muddy sand, and bare substrate, which were classified by the K-means unsupervised classification method (Fig. 5) Multivariate analysis The principle component analysis (PCA) to establish multi-dimensional relationships among the studied parameters showed that there were four first principle components that accounted for 88.6 % of the total variation. The first principle component accounted for over 43.3 % of the total variation between sampling seasons and consisted of the physicochemical parameters PAR, SSTs, SE, ED, MinAT, MaxAT, CDOM, salinity, and NW. The second principle component accounted for 28.3 % of the variation and included nutrient parameters such as MLT, CC, NO3 -, PO4 3-, FB, conductivity, NH4 +, and Chl-a. The third principle component explained 9.7 % of the 12
15 total variation, and included DO, NH4 +, rainfall, NO2 -, PAR, and CC. The fourth principle component explained 7.4 % of the total variation, and consisted of salinity, rainfall, and conductivity parameters; 6.6 % of the total variation was explained by the fifth principle component and 4.8% of the variation of the sampling seasons by the sixth component. The bi-plot chart of the first and second components explained 71.6 % of the total variation in the environmental parameters during the sampling time. The results showed that nutrient composition (NO3 -, PO4 3-, and NH4 + ) and Sargassum community structure (CC, FB, and MTL) were encountered at the spring sampling times. The PAR, salinity, and SSTs were key parameters during the summer. The Sargassum population structure was typically explained by rainfall, SLP, and ph parameters during the winter months (Fig. 6) DISCUSSION Seasonal growth trends in Sargassum beds This study investigated the ecology and seasonal growth trends in the brown algae, Sargassum spp. at Point Peron, in the SWA for the first time. It was found that Sargassum biomass increased during the winter and early spring, and stabilized during late spring and early summer, before decreasing during the late summer and early autumn. This pattern of (i) increase, (ii) stabilization, and (iii) reduction in biomass is linked to the five main stages of the Sargassum lifecycle, including: recruitment and growth (increase in biomass), senescence and reproduction (stabilization of the biomass), and regeneration (reduction in biomass) (Gillespie & Critchley 1999). Here, we investigated which of the key environmental parameters, including SSTs, nutrients availability, and irradiance are responsible for regulating the timing of the Sargassum lifecycle events (Fig. 7a). 13
16 i. Increase in biomass: This study showed that Sargassum biomass began to increase in early winter from new recruits and remaining holdfasts, increased throughout winter and accelerates during spring. The highest nutrient concentrations, including NO3 -, PO4 3-, NH4 + were measured during winter and early spring, which coincided with the increase in biomass and the highest growth rates. Considering that these high nutrient values occurred in the winter and spring, which is a high rainfall season for SWA rainwater run-off from the land probably played a vital role in the accelerated growth phase of Sargassum spp. Notably, this phase of high growth was negatively correlated with SSTs, i.e., the fastest growth rates occurred during the period with the lowest SSTs and irradiance (r = 0.43) (Table 5) and only a weak correlation was observed between PAR and Sargassum spp., and this trend has also observed in other studies (Fulton et al. 2014; Sangil et al. 2015) ii. Stabilization of biomass: Following the growth phase, Sargassum biomass stabilized, with little or no observed change in MTL or CC between early spring (September) to mid-summer (January). This period is characterized by higher SSTs, longer day lengths, and relatively high nutrient concentrations and primary productivity. Higher concentrations of ammonium were found at Point Peron during the late spring and were strongly correlated with the increase in CC and fresh biomass (r = 0.74 and 0.65, respectively) iii. Reduction in biomass: Following the reproductive stage, there was a reduction in Sargassum biomass beginning in late summer (February) through the end of autumn (April to May). Die-off occurred towards the end of summer where coincide with the highest water temperature, when some holdfasts remained and regenerated into new thalli in autumn and winter (Arenas et al. 1995). The decomposition of Sargassum thalli might lead to an increase in nitrite concentrations in the summer and autumn months. 14
17 In general, the timing of the Sargassum lifecycle is geared so that full plant maturity is reached by late spring or early summer for the plant to take advantage of the highest levels of sunlight to redirect energy towards sexual reproduction. Towards the end of spring, the growth rates of Sargassum spp. begin to slow and cease as the algae enters its reproductive stage (Kendrick & Walker 1994). The reproductive activity of Sargassum spp. occurs mainly in mid-summer via the release of ova and sperm into the water column (Gillespie & Critchley 1999). Comparison in the seasonality of Sargassum biomass between Point Peron and other localities To further understand how environmental parameters such as nutrients, SSTs, and irradiance drive the Sargassum spp. growth cycle, we compared the seasonal results from Point Peron to other geographic regional studies in Australia and overseas (Table 6). Point Peron and Magnetic Island in Australia s Great Barrier Reef region (Fig. 7b) Magnetic Island is located 8 km off the North Queensland coast at about 22 S experiences a tropical savanna-type climate, with a distinct wet summer and dry winter (opposite to the SWA). The increase in Sargassum biomass on Magnetic Island occurs at the beginning of spring to midsummer, stabilization occurs between mid-summer and mid-autumn, and reduction occurs between mid-autumn and the start of spring (Vuki & Price 1994). The increasing biomass on Magnetic Island occurs during cooler SSTs towards the end of the dry season, and increasing irradiance, stabilization and growth of reproductive organs occurs during the period of highest irradiance and SSTs. In contrast to Point Peron, reproduction on Magnetic Island occurs several months later, with the reduction in biomass occurring during the high SSTs, whereas on Point Peron it occurs during the lowest SSTs and irradiance levels. Sargassum beds in Magnetic Island, Australia do not reach their highest MTL until autumn (Vuki & Price 1994). However, a similar relationship between CC and mean thallus length was observed at both study sites. A positive correlation was found between CC and MTL in Magnetic Island (r = 0.73), and a strong correlation was also present in the Point 15
18 Peron study (r = 0.82). When the MTL was high, the Sargassum spp. in the selected quadrats also had a greater density, in turn resulting in a high biomass. The difference in the Sargassum growth cycle can be explained by high rainfall during the summer (December to February, ± mm), which coincides with high nutrient concentrations from run-off, which provide optimum conditions for Sargassum growth (Vuki & Price 1994). The later growing stage of Sargassum beds in Magnetic Island might be caused by the irregular, high rainfall and lower radiation in summer than in spring and winter, due to the higher cloud cover at this time, or a difference in Sargassum species composition. Point Peron and Pock Dickson, Malaysia with a tropical forest climate (Fig. 7c) Tropical regions near the equator experience high SSTs and high rainfall throughout the whole year, with little difference between the wet and dry season. Several seasonality studies have been performed on Sargassum in tropical regions, such as Pock Dickson in Malaysia, the northern part of the Philippines, and New Caledonia. Due to the effect of two strong monsoons, the Sargassum beds reveal two periods of increasing biomass rates (January to February and June to July) and decreasing biomass rates (April and September) (May-Lin & Ching-Lee 2013). Thus, the growth cycle depends on seasonal changes in the monsoon, the species of Sargassum and the existing nutrient availability (Schaffelke & Klumpp 1998). The highest biomass can occur in the wet season for some species (e.g. S. binderior) or the dry season for others (e.g. S. siliquosum). In these tropical areas, the seasonality of Sargassum beds can be more dependent on changes in SSTs and rainfall (i.e. tropical monsoons) A study in New Caledonia in the Indo-Pacific region showed that Sargassum spp. have a high MTL in the summer months due to higher rainfall at this time, which causes an increased nutrient concentration and growth (Mattio et al. 2008). However, in the Philippines, Sargassum biomass is highest in the dry season, which possibly coincides with high SSTs (Ang, 1986). Thus, 16
19 equatorial climates can also experience a range of seasonal effects on Sargassum spp., although this might be less pronounced than in more temperate climates such as that at Point Peron. Point Peron and studies in the Northern Hemisphere (Fig. 7d) Cape Peñas (Asturias, Spain) is located at latitude 43.4 o N and has a similar Mediterranean climate to Point Peron, and experiences warm dry summers and cool wet winters. The summer season occurs from June to September, with a mean daily high air temperature above 20 C. The increase in Sargassum biomass on Cape Peñas occurs from mid-autumn to late-winter, stabilization with peak biomass occurs between the end of winter and the end of spring, and reduction occurs between early summer and mid-autumn. Growth increases during the winter until spring, when higher SSTs increase photosynthesis and productivity and provide optimum growth conditions, followed by senescence from early summer to mid-autumn (Arenas & Fernández 2000). Seasonal changes in temperature are also thought to drive the growth of Sargassum spp. at La Palma, and in the Canary Islands, Spain. The biomass of S. flavifolium reaches its maximum in spring to summer and is similar to that of Sargassum spp. in this study, coinciding with an increase in the SST and day length (irradiance) (Sangil et al. 2015). The growth and development of Sargassum in the study sites in Spain and SWA share a similar seasonal pattern, which can be explained by similar climate zones. However, they occur at different times of the year due to the reverse timing of seasons in the Northern and Southern hemispheres Spatial distribution of Sargassum spp. from both in situ and satellite observations The distribution of Sargassum beds was restricted mainly to shallow water habitats, similar to the results of others (Hanisak & Samuel 1987, Mattio et al. 2008, Mattio & Payri 2011). Because the holdfasts grow on limestone rock substrates, the beds were widely distributed throughout these habitats, but not on sandy substrates, where seagrass was dominant. A similar study in New Caledonia found that Sargassum was dominant on rubble substrate and rocky bottoms, ranging 17
20 from 2.5 to 12 m deep (Mattio et al. 2008). In this study, biomass increased as depth increased along the transects, and showed some variation in reef zones from the LZ to the FR. This represents a trend, suggesting that the biomass of Sargassum beds increases at greater depths, until light becomes a limiting factor (Ang 1986, Rützler & Macintyre 1982, Vuki & Price 1994). The highest MTL of Sargassum in all seasons is related to its distribution area and was found in the BR zone, which is protected by the RC zone further offshore, where the waves and currents are broken down and their kinetic energy reduces before they approach the shoreline. The lowest MTL value was found in the LZ. The length of thalli in the LZ reflects the shallow depth here, as well as the high heat absorption from the sun, which causes higher SSTs than at other study sites. At Point Peron, the mean MTL of Sargassum species is similar to that found for S. ilicifolium and S. subrepandum in the Southern Red Sea, which was cm and cm, respectively (Ateweberhan et al. 2009). The MTL here is also similar to that from a phenology study of Sargassum species in Tung Ping Chau Marine Park, Hong Kong (48.2 ± 29.9 cm) (Ang 2007). However, the MTL of Sargassum in Point Peron is shorter than that found in previous studies in Rottnest Island, SWA (10 95cm) (Kendrick 1993), in the middle reef flat of Magnetic Island, North-Eastern Australia (Vuki & Price 1994) and in other studies in Malaysia (Wong & Phang 2004, May-Lin & Ching-Lee 2013). The present study was initially applied using WV-2 satellite remote sensing data to determine the spatial distribution of Sargassum and associated marine benthic habitats in the study area. This study can be considered as an original approach for the region when using more advantageous satellite remote sensing data, with higher spatial and spectral resolution, than the previous studies in Thailand with ALOS AVNIR 2 images (10 m spatial resolution) (Noiraksar et al. 2014), New Caledonia with Landsat (30 m) and Quickbird (2.4 m) images (Mattio et al. 2008). Thus, further studies could apply the recent archived results for identifying and mapping Sargassum beds for the SWA region (Hoang et al. 2015, Garcia et al. 2015). The results of spatial 18
21 distribution characteristics of Sargassum beds play an important role in providing information on regional natural resource management and a better understanding of the distribution characteristics, areas, and seasonality of Sargassum, in terms of the highest biomass. However, a limitation does exist in this study due to the lack of temporal satellite remote sensing data sources in evaluating the brown canopy seaweeds distribution. The current satellite remote sensing image only reflects the distribution of brown canopy seaweeds (Sargassum and Ecklonia) in the peak biomass season, spring. However, if there were more than one satellite remote sensing images during another season available at the study region that would markedly illustrate the seasonal variation in the distribution area. In summary, this study provides primary and novel information on Sargassum spp. at Point Peron using a combination of in situ and satellite remote-sensing observations. The results show that the Sargassum beds demonstrated a seasonal variation pattern in CC and MTL, which was significantly influenced by the nutrient concentration (NO3 -, PO4 3-, NH4 + ), and rainfall (P < 0.05). This seasonal variation pattern is similar to that found in areas with a temperate or Mediterranean climate, such as Rottnest Island, Australia and Cape Peñas, Spain (Arenas & Fernández 2000, Kendrick & Walker 1994). The highest peaks in Sargassum biomass generally occurred between late spring and early summer. This seasonal pattern was also found in Sargassum CC and MTL. The seasonal variation in Sargassum biomass, CC and MTL at Point Peron was closely associated with seasonal changes in nutrient concentration and rainfall. These results provide essential information for coastal marine management and conservation, as well as for the sustainable utilisation of this renewable marine resource ACKNOWLEDGMENTS The authors are grateful to the WA Herbarium staff, Juliet Wege (Acting Curator) and Susan Carroll (Database Manager) for their permission to access the WA Herbarium collections 19
22 and the database of WA Flora. We sincerely thank the Department of Environment and Conservation, WA, for the authorization to collect seaweed in Point Peron, Shoalwater Islands Marine Park. We also acknowledge the MODIS mission scientists and associated NASA personnel for the production of the data used in this study. We also thank Simon Longbottom and Anne Barnes at CARL for their efficient assistance with laboratory consumables and fieldwork equipment. The authors also thank Ngoc Nguyen for her assistance with the fieldwork. We also thank the three anonymous reviewers and the Responsible Editor for their valuable comments which significantly improved the manuscript. This research was supported by Australian Awards to H.C.T. Data for this study were collected from the traditional country of the Pindjarup people
23 LITERATURE CITED Acker JG, Leptoukh G (2007) Online analysis enhances use of NASA earth science data. Eos Trans AGU 88:14 17 Andréfouët S, Robinson JA (2003) The use of Space Shuttle images to improve cloud detection in mapping of tropical coral reef environments. Int J Remote Sens 24: Ang PJr. (2007) Phenology of Sargassum spp. in Tung Ping Chau Marine Park, Hong Kong SAR, China. In: Anderson R, Brodie J, Onsøyen E, Critchley A (eds) The 18 th International Seaweed Symposium, Springer Press, Netherlands Ang POJ (1986) Analysis of the vegetation structure of a Sargassum community in the Philippines. Mar Ecol Prog Ser 28:9 19 Ang POJ, De Wreede RE (1992) Density-dependence in a population of Fucus distichus. Mar Ecol Prog Ser 90: APHA (1998) Standard methods for examination of water and waster water, 20 th edn. American Public Health Associa-tion,Washington, DC, USA Arenas F, Fernández C, Rico JM, Fernández E, Haya D (1995) Growth and reproductive strategies of Sargassum muticum (Yendo) Fensholt and Cystoseira nodicaulis (Whit.) Roberts. Sci Mar 59:1 8 Arenas F, Fernández C (2000) Size structure and dynamics in a population of Sargassum muticum (Phaeophyceae). J Phycol 36: Ateweberhan M, Bruggemann JH, Breeman AM (2009) Seasonal changes in size structure of Sargassum and Turbinaria populations (Phaeophyceae) on tropical reef flats in the Southern Red Sea. J Phycol 45:69 80 Benfield SL, Guzman HM, Mair JM, Young JAT (2007) Mapping the distribution of coral reefs and associated sublittoral habitats in Pacific Panama: a comparison of optical satellite sensors and classification methodologies. Int J Remote Sens 28: Bureau of Meteorology (BoM) (2013) Western Australia weather and warnings. Australian Government. (accessed 15 Jan 2015) Casal G, Kutser T, Domínguez-Gómez JA, Sánchez-Carnero N, Freire J (2011a) Mapping benthic macroalgal communities in the coastal zone using CHRIS-PROBA mode 2 images. Estuar Coastal Shelf Sci 94:
24 Casal G, Sánchez-Carnero N, Sánchez-Rodríguez E, Freire J (2011b) Remote sensing with SPOT-4 for mapping kelp forests in turbid waters on the south European Atlantic shelf. Estuar Coastal Shelf Sci 91: Chengkui Z, Tseng CK, Junfu Z, Chang CF (1984) Chinese seaweeds in herbal medicine. Hydrobiologia : De Clerck O, Verbruggen H, Huisman JM, Faye EJ, Leliaert F, Schils T, Coppejans E (2008) Systematics and biogeography of the genus Pseudocodium (Bryopsidales, Chlorophyta), including the description of P. natalense sp. nov. from South Africa. Phycologia 47: DEC Department of Environment and Conservation (2011) Shoalwater Islands Marine Park - Western Australia s submerged wonders. Department of Environment and Conservation, Swan Coastal District Office, Western Australia Government DPaW Department of Parks and Wildlife (2013) Department of Parks and Wildlife, Western Australia Government. (accessed 15 Sep 2014) DigitalGlobe (2013) The Benefits of the 8 Spectral Bands of WorldView-2. (accessed 12 Jan 2014) Dixon RRM, Huisman J (2010) Species boundaries within Sargassum (Fucales: Phaeophyceae) of Western Australia. Proceedings of ASPAB Conference, Rottnest Island, Western Australia Dixon RRM, Huisman JM, Buchanan J, Gurgel CFD, Spencer P (2012) A morphological and molecular study of Austral Sargassum (Fucales, Phaeophyceae) supports the recognition of Phyllotricha at genus level, with further additions to the genus Sargassopsis. J Phycology 48: ENVI Exelis Visual Information Solutions I (2014) ENVI products. (accessed 28 Feb 2013) Fearns PRC, Klonowski W, Babcock RC, England P, Phillips J (2011) Shallow water substrate mapping using hyperspectral remote sensing. Cont Shelf Res 31: Fulton CJ, Martial D, Holmes TH, Noble MM, Radford B, Wernberg T,Wilson SK (2014) Sea temperature shapes seasonal fluctuations in seaweed biomass within the Ningaloo coral reef ecosystem. Limnol Oceanogr 59: Garcia RA, Hedley JD, Hoang TC, Fearns PRCS (2015) A method to analyze the potential of optical remote sensing for benthic habitat mapping. Remote Sens 7: Garton JT (1997) Field guide and atlas of the seaweed resources of the Philippines. Makati City, Philippines 22
25 Gillespie RD, Critchley AT (1999) Phenology of Sargassum spp. (Sargassaceae, Phaeophyta) from Reunion Rocks, KwaZulu-Natal, South Africa. Hydrobiologia : Goldberg NA, Huisman JM (2004) Sargassum kendrickii (Fucales, Phaeophyceae), a new species of subgenus Phyllotrichia from southern Australia. Bot Mar 47: Guiry MD, Guiry GM (2015) AlgaeBase. World-wide electronic publication, National University of Ireland, Galway. (accessed 08 Jun 2015) Hanisak MD, Samuel MA (1987) Growth rates in culture of several species of Sargassum from Florida, USA. Hydrobiologia : Hoang TC, O Leary MJ, Fotedar RK (2015) Remote-sensed mapping of Sargassum spp. distribution around Rottnest Island, Western Australia, using high-spatial resolution WorldView-2 satellite data. J Coast Res doi: /jcoastres-d (in-press). Hong D, Hien H, Son P (2007) Seaweeds from Vietnam used for functional food, medicine and biofertilizer. J Appl Phycol 19: Huisman JM (2000) Marine plants of Australia. University of Western Australia Press, Perth, Australia. Huisman JM, Phillips J, Parker CM (2006) Marine plants of the Perth region. Department of Environment and Conservation, Perth, Australia. Huisman JM, Phillips JC, Freshwater DW (2009) Rediscovery of Gelidiella ramellosa (Katzing) Feldmann et Hamel (Gelidiales: Rhodophyta) from near the type locality in Western Australia. Cryptogamie Algologie 30:3 16 Kendrick GA (1993) Sargassum beds at Rottnest Island: species composition and abundance. In: Wells FE, Walker DI, Kirkman H, Lethbridge R (eds). The marine flora and fauna of Rottnest Island, Western Australia. Proceedings of the 5th International marine biological workshop. Western Australian Museum Kendrick GA, Walker DI (1994) Role of recruitment in structuring beds of Sargassum spp. (Phaeophyta) at Rottnest Island, Western Australia. J Phycol 30: Komatsu T, Chiaki I, Ken-ichi T, Masahiro N,Tomonori H, Asahiko T (2002) Mapping of seagrass and seaweed beds using hydro-acoustic methods. Fish Sci (Tokyo, Jpn) 68: Kumar M, Gupta V, Kumari P, Reddy CRK, Jha B (2011) Assessment of nutrient composition and antioxidant potential of Caulerpaceae seaweeds. J Food Composition and Analysis 24: Lee KR, Kim AM, Olsen RC, Kruse FA (2011) Using WorldView-2 to determine bottom-type and bathymetry. In: Weilin WH, Arnone R (ed.) Proceedings of SPIE Ocean Sensing and Monitoring III Conference D
26 Maheswari R (2013) Mapping the under water habitat related to their bathymetry using Worldview- 2 coastal, yellow, rededge, nir-2 satellite imagery in Gulf of Mannar to conserve the marine resource. Int J Mar Sci 3:91 97 Mattio L, Dirberg G, Payri C, Andréfouët S (2008) Diversity, biomass and distribution pattern of Sargassum beds in the South West lagoon of New Caledonia (South Pacific). J Appl Phycol 20: Mattio L, Payri C (2011) 190 years of Sargassum taxonomy, facing the advent of DNA phylogenies. Bot Rev 77:31 70 May-Lin B, Ching-Lee W (2013) Seasonal growth rate of Sargassum species at Teluk Kemang, Port Dickson, Malaysia. J Appl Phycol 25: McCourt RM (1984) Seasonal patterns of abundance, distributions, and phenology in relation to growth strategies of three Sargassum species. J Exper Mar Bio Ecol 74: Muñoz J, Fotedar R (2011) Seasonal variations of agar extracted from different life stages of Gracilaria cliftonii (Gracilariales, Rhodophyta) from Western Australia. Afr J Mar Sci 33:59 65 Nishihara GN, Terada R (2010) Spatial variations in nutrient supply to the red algae Eucheuma serra (J. Agardh) J. Agardh. Phycol Res 58:29 34 Noiraksar T, Sawayama S, Phauk S, Komatsu T (2014) Mapping Sargassum beds off the coast of Chon Buri Province, Thailand, using ALOS AVNIR-2 satellite imagery. Bot Mar 57: Noro T, Ajisaka T,Yoshida T (1994) Species of Sargassum subgenus Sargassum (Fucales) with compressed primary branches. In: Abbott IA (ed) Taxonomy of economic seaweeds with reference to some Pacific species, California Sea Grant College, 4: Payri CE (1987) Zonation and seasonal variation of the commonest algae on Tiahura reef (Moorea Island, French Polynesia). Bot Mar 30: Phillips N (1994) Biogeography of Sargassum (Phaeophyta) in the Pacific basin. In: Abbott IA (ed) Taxonomy of economic seaweeds with reference to some Pacific species, California Sea Grant College, 5: Ragaza AR, Hurtado AQ (1999) Sargassum studies in Currimao, Ilocos Norte, Northern Philippines II. seasonal variations in alginate yield and viscosity of Sargassum carpophyllum J. Agardh, Sargassum ilicifolium (Turner) C. Agardh and Sargassum siliquosum J. Agardh (Phaeophyta, Sargassaceae). Bot Mar 42: Rivera M, Scrosati R (2006) Population dynamics of Sargassum lapazeanum (Fucales, Phaeophyta) from the Gulf of California, Mexico. Phycologia 45:
27 Rothman MD, Mattio L, Wernberg T, Anderson RJ, Uwai S, Mohring MB, Bolton JJ (2015) A molecular investigation of the genus Ecklonia (Phaeophyceae, Laminariales) with special focus on the Southern Hemisphere. J Phycol 51: Rützler K, Macintyre IG (1982) The habitat distribution and community structure of the barrier reef complex at Carrie Bow Cay, Belize. In: Rützler K, Macintyre IG (eds) The Atlantic barrier reef ecosystem at Carrie Bow Cay, Belize, 1: Structure and Communities, Book 12. Smithsonian Institution, Washington DC Sangil C, Sansón M, Afonso-Carrillo J (2015) Spatio-temporal variations and recruitment of Sargassum flavifolium Kützing in sublittoral cobble bottoms: relationships with environmental variables. J Appl Phycol 27: Schaffelke B, KlumppDW (1998) Nutrient-limited growth of the coral reef macroalga Sargassum baccularia and experimental growth enhancement by nutrient addition in continuous flow culture. Mar Ecol Prog Ser 164: Staehr PA, Wernberg T (2009) Physiological responses of Ecklonia radiata (Laminariales) to a latitudinal gradient in ocean temperature. J Phycol 45:91 99 Tiit K, Vahtmäe E, Martin G (2006) Assessing suitability of multispectral satellites for mapping benthic macroalgal cover in turbid coastal waters by means of model simulations. Estuar Coastal Shelf Sci 67: Tyler RM (2010) Seaweed distribution and abundance in the Inland Bays. In: Bays TC(ed) FY09 research and demonstration project. Delaware Department of Natural Resources and Environmental Control, Dover, USA Vahtmäe E, Kutser T (2007) Mapping bottom type and water depth in shallow coastal waters with satellite remote sensing. J Coast Res 50: Vuki VC, Price IR (1994) Seasonal changes in the Sargassum populations on a fringing coral reef, Magnetic Island, Great barrier reef region, Australia. Aquat Bot 48: Wells R, Rooker JR (2004) Spatial and temporal patterns of habitat use by fishes associated with Sargassum mats in the northwestern Gulf of Mexico. Bull Mar Sci 74:81 99 Wong C-L, Phang S-M (2004) Biomass production of two Sargassum species at Cape Rachado, Malaysia. Hydrobiologia 512:
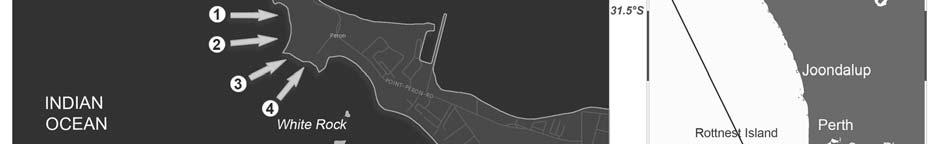
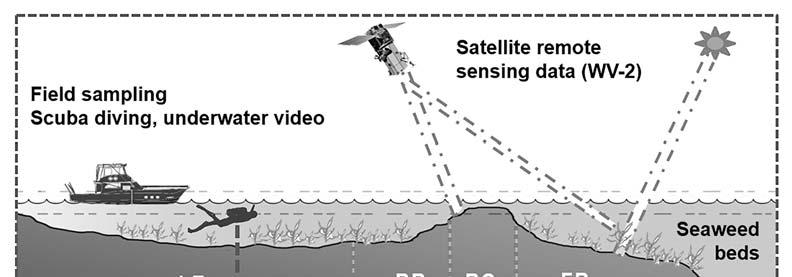
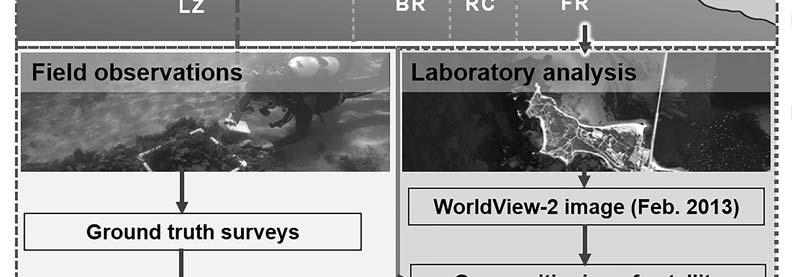
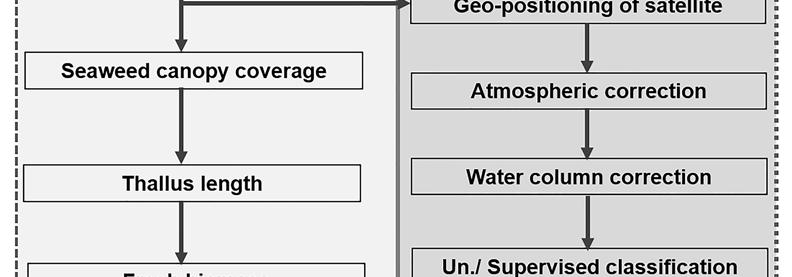
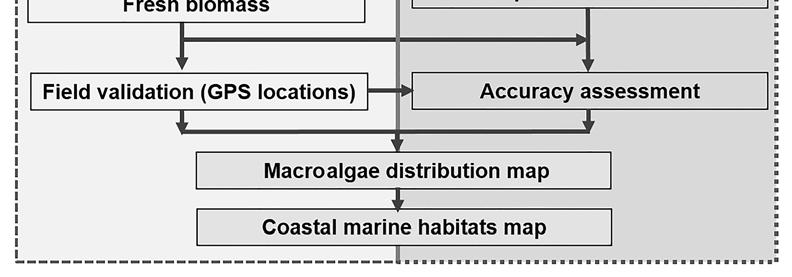
28 633 Table and Figure legends Table 1. List of symbols and acronyms used throughout the text. Table 2. Seasonality of physicochemical parameters (mean ± S.E) observed at Point Peron, Western Australia. SSTs = Sea surface temperatures, DO = Dissolved oxygen. Table 3. Seasonality of the mean nutrient concentrations in collected seawater during the study period at Point Peron, SWA. Table 4. Multiple comparisons of canopy coverage (%) and thallus length (cm) between the sites. Table 5. Correlation matrix between different physicochemical parameters and Sargassum at the study sites. Table 6. The seasonal variation in Sargassum species and their correlation with the environmental parameters reported in tropical and subtropical waters Figure 1. Study area, with sampling sites shown by arrows. Point Peron is located approximately 50 km south of Perth City, Western Australia. Figure 2. Diagram presenting the methodology used to map seaweed distribution and the associated benthic habitats at Point Peron using high-spatial resolution satellite imagery and field survey data. Sites: LZ = Lagoon zone, BR = Back reef, RC = Reef crest, and FR = Fore reef zone. Figure 3. Seasonal changes in (a) air temperature (maximum and minimum value) and sea surface temperature, (b) PAR and rainfall, (c) Chl-a and CDOM index, (d) Sea level pressure and Euphotic depth, (e) Sargassum canopy cover and fresh biomass at the study sites. Sargassum fresh biomass was not available for the sampling trips in September, December 2012 and February The air temperature and rainfall data were obtained from the Garden Island weather station, Bureau of 26
29 Meteorology, Australian Government. The Euphotic depth, CDOM, PAR, SST, Sea level pressure, and Chl-a in the study area (32 12' 32 17' S, ' ' E) were extracted from the Giovanni online data system, developed by NASA. Figure 4. Seasonality of percentage canopy cover (a), mean thallus length (b), and fresh biomass of Sargassum (c) observed in four different areas during spring 2012 to Each column for (a) and (b) present the mean and standard error. Four replicated quadrats ( m) and four reef zones were measured for CC and MTL, respectively. The fresh biomass samples (c) were measured at difference reef zone. Figure 5. Map of the benthic habitat from satellite image classifications showing the canopy seaweed beds (Sargassum spp.), their distribution and associated sub-littoral habitats (seagrass, sand, and muddy sand) around Point Peron in summer (7 February 2013). Figure 6. Principal component analysis biplot showing the relationship between Sargassum sampling time, CC, MTL, fresh biomass, and the physicochemical parameters: FB represents fresh biomass (g 0.25m -2 ); Cond. represents conductivity (ms m -1 ); CC represents canopy coverage (%); MTL represents mean thallus length (cm); NW represents a northward wind (m s -1 ); MaxAT represents maximum air temperature ( o C); SE represents solar exposure (MJ m -2 ); CDOM represents colored dissolved organic matter; i-sst represents in situ sea-surface temperatures; MinAT represents minimum air temperature ( o C); ED represents euphotic depth (m); SSTs represents satellite-derived sea-surface temperatures ( o C); Sal represents salinity; DO represents dissolved oxygen (mg L -1 ); SLP represents sea level pressure (hpa). Figure 7. Diagram showing the seasonal variation in Sargassum biomass in different climate zones across Australia and other geographical localities. (a) Point Peron, Western Australia with a Mediterranean climate; (b) Magnetic Island, Australia with a humid continental climate; (c) Pock Dickson, Malaysia with a tropical rainforest climate; and (d) Cape Peñas, Spain with an oceanic 27
30 climate. The phase of increasing biomass includes recruitment and growth up stages. The stabilization biomass phase includes the late growth and reproduction stages. The reduction phase consists of senescence and regeneration periods. The outer ring and second ring represent SST and solar exposure, respectively. The light color represents months with a low temperature and the darker color represents those with a high temperature. This figure was generated based on the present study and in combination with the published information from other three studies from different geographic regions. These previously published studies have reported the annual observatory data in their respective regions
31 Table 1. Acronym Description and typical units WA Western Australia SWA Southwest Australia DPaW Department of Parks and Wildlife formerly named as the Department of Environment and Conservation (DEC), Government of Western Australia SPOT-4 Satellite Pour l'observation de la Terre 4 WV-2 World View 2 LZ Lagoon zone BR Back reef RC Reef crest FR Fore reef zone BoM Bureau of Meteorology, Australian Government FB Fresh biomass (g 0.25m -2 ) CC Canopy cover (%) MTL Mean thallus length (cm) APHA American Public Health Association GPS Global Positioning System CARL Curtin Aquatic Research Laboratory ED Euphotic depth (m) NW Northward wind (m s -1 ) MaxAT Maximum air temperature ( o C) SE Solar exposure (MJ m -2 ) MinAT Minimum air temperature ( o C) SLP Sea level pressure (hpa) CDOM Colored dissolved organic matter PAR Photosynthetically active radiation (Einstein m -2 d -1 ) SSTs Sea surface temperatures ( o C) DO Dissolved oxygen (mg L -1 ) ENVI Environment for visualizing image ANOVA Analysis of variance PCA Principle component analysis MODIS Moderate Resolution Imaging Spectroradiometer NASA The National Aeronautics and Space Administration 29
32 692 Table 2. Year Month Season Salinity ph Cond. (mv) SSTs ( o C) DO (mg L -1 ) Sep Spr ± ± 0.08 ab ± 2.89 a 17.6 ± 0.2 d 7.53 ± 0.28 c Dec Sum ± ± 0.05 ab ± 0.28 d 22.1 ± 0.1 f 6.07 ± 0.08 b 2013 Apr Aut ± ± 0.06 ab ± 6.13 c 22.8 ± 0.3 h 6.08 ± 0.02 b Jun Win ± ± 0.06 b ± 0.25 bc 16.3 ± 0.3 b 8.27 ± 0.13 d Sep Spr ± ± 0.11 ab ± 0.00 bc 17.0 ± 0.0 c 7.75 ± 0.25 c Dec Sum ± ± 0.02 b ± 2.79 b 24.1 ± 0.0 z 5.92 ± 0.40 b 2014 Mar Aut ± ± 0.14 c ± 2.95 b 22.6 ± 0.1 gh 5.99 ± 0.05 b Jul Win ± ± 0.01 ab ± 0.58 bc 12.9 ± 0.2 a 5.39 ± 0.01 a Sep Spr ± ± 0.01 ab ± 0.28 a 19.7 ± 0.1 e 5.84 ± 0.03 ab Dec Sum ± ± 0.02 a ± 0.50 a 22.2 ± 0.1 fg 7.33 ± 0.11 cd F P < 0.05 < 0.05 < 0.05 The mean in the same column with different superscript letter are significantly different at the 0.05 level. 30
33 696 Table Year Month Season NO 2 - (µg L -1 ) NO 3 - (mg L -1 ) PO 4 3- (mg L -1 ) NH 4 + (mg L -1 ) 2012 Sep Spr ± 1.86 b 0.33 ± 0.08 cd 0.45 ± 0.08 c 1.97 ± 0.12 de Dec Sum ± 2.07 c 0.05 ± 0.02 a 0.14 ± 0.02 a 1.70 ± 0.13 cd 2013 Apr Aut ± 0.41 a 0.02 ± 0.00 a 0.24 ± 0.03 b 0.73 ± 0.09 a Jun Win ± 0.65 ab 0.02 ± 0.00 a 0.14 ± 0.02 a 1.55 ± 0.06 c Sep Spr ± 0.65 ab 0.17 ± 0.00 bc 0.20 ± 0.01 ab 2.00 ± 0.06 e Dec Sum ± 1.56 c 0.09 ± 0.01 ab 0.26 ± 0.03 b 1.11 ± 0.04 b 2014 Mar Aut ± 0.48 a 0.02 ± 0.01 a 0.19 ± 0.02 ab 0.55 ± 0.10 a Jul Win ± 0.58 ab 0.02 ± 0.00 a 0.22 ± 0.06 ab 1.53 ± 0.09 c Sep Spr ± 0.33 ab 0.42 ± 0.04 d 0.72 ± 0.05 d 2.03 ± 0.09 e Dec Sum ± 0.67 ab 0.28 ± 0.09 c 0.17 ± 0.03 ab F P < 0.05 < < 0.05 The data is presented as the mean ± S.E of four replicates per sampling period. The different superscript letters are significantly different means of environment parameters in the same column. The mean difference is significant at the 0.05 level Table 4. Sites Canopy coverage (%) Thalli length (cm) Mean ± S.E Mean ± S.E Lagoon zone Back reef Reef crest Fore reef zone
34 706 Table Variables CC MTL FB PAR Rain SST Chl ph DO NO2 - NO3 - PO4 3- NH4 + CC 1 MTL FB PAR Rain SST Chl-a Sal ph DO NO NO PO NH
35 Table 6. Study site Country Climate Species Max MTL Peak FB Max CC Nutrient SST PAR Rainfall Substrate Depth (m) Ref. Point Peron Australia Csa Sargassum spp. Sp.-Su. Sp.-Su. Sp.-Su. x Rb, CR (1) (9 12) (10 12) (10 1) Rottnest Isl. Australia Csa S. spp. Sp. Su. Su S, Rb, - (2) (8 9) (1 2) (1 2) CR Ningaloo reef Australia Bwh S. spp. - Su. - - CR 1-5 (3) (2) Magnetic Isl. Australia Dfb S. spp. Au. Sp. Sp CR. - (4) (3 4) (01) (10) Port Dickson Malaysia Af S. binderi Wet - - x x x CR - (5) (1 2) S. siliquosum Dry - - x x x CR - (6 7) The Northern Philippines Af S. spp. - - Dry (6) (10) Tung-Ping C. Hong Kong Cwa S. spp. Au (7) (11 2) New Caledonia N. Caledonia Af S. spp. Wet CR, Rb, 20 (8) (12 3) S Cape Peñas Spain Cfb S. muticum Wi. Sp.-Su Rb - (9) (12 1) (4 6) La Palma Isl. Spain Bwh S. flavifolium Sp.-Su P, Rb, S 6-18 (10) (5 7) Massawa Eritrea Bwh S. spp. Su CR - (11) (2 3) Gulf of Cali. Mexico Bwh S. spp. - Sp. (4 5) CR - (12) Note: Climate Zones (according to Köppen-Geiger climate classification): Af = tropical rainforest climate, Bwh = Hot desert climate, Cfb = Oceanic climate, Csa = Mediterranean climate, Cwa = Humid subtropical climate, Dfb = Humid continental climate. Sp. = spring (specific months), Su.= summer, Au.= autumn, Wi.= winter for oceanic climate and Mediterranean and Wet= wet months, Dry = dry months for the tropical climate zones. (-) = data not available, ( ) = affected/ correlated factors (P < 0.05), (x) = no correlated factors. Substrate types: C = cobbles, S = sand-covered, R = rock, Rb = rubble, CR = coral reef. Ref.= References; (1) This study, (2) Kendrick & Walker 1994, (3) Fulton et al. 2014, (4) Vuki & Price 1994, (5) May-Lin & Ching-Lee 2013, (6) Ang 1986, (7) Ang 2007, (8) Mattio et al. 2008, (9) Arenas and Fernández 2000, (10) Sangil et al. 2015, (11) Ateweberhan et al. 2009, (12) McCourt

36 34 1 Figure


37 35 5 Figure

38 36 8 Figure

39 37 11 Figure
40 38 14 Figure

41 39 17 Figure
Life in Water. Chapter 3
 Life in Water Chapter 3 Outline Hydrologic Cycle Oceans Shallow Marine Waters Marine Shores Estuaries, Salt Marshes, and Mangrove Forests Rivers and Streams Lakes 2 The Hydrologic Cycle Over 71% of the
Chapter Concepts LIFE IN WATER. The Hydrologic Cycle. The Hydrologic Cycle
 Chapter Concepts Chapter 3 LIFE IN WATER The hydrologic cycle exchanges water among reservoirs The biology of aquatic environments corresponds broadly to variations in physical factors such as light, temperature,
Cleveland Bay Marine Water Quality (Turbidity and Available Light) Monitoring Plan
 Monitoring Plan") Cleveland Bay Marine Water Quality (Turbidity and Available Light) Monitoring Plan 1 BACKGROUND Port of Townsville Limited (PoTL) administers the Port of Townsville, a general purpose cargo port in North
Cleveland Bay Marine Water Quality (Turbidity and Available Light) Monitoring Plan 1 BACKGROUND Port of Townsville Limited (PoTL) administers the Port of Townsville, a general purpose cargo port in North
Aquatic Communities Aquatic communities can be classified as freshwater
 Aquatic Communities Aquatic communities can be classified as freshwater or saltwater. The two sets of communities interact and are joined by the water cycle. Gravity eventually returns all fresh water
Remote Sensing in Support of Multilateral Environmental Agreements
 Remote Sensing in Support of Multilateral Environmental Agreements Alex de Sherbinin CIESIN, The Earth Institute, Columbia University Presented at the Satellites and the Law Enforcement Meeting London,
Chapter 6. Aquatic Biodiversity. Chapter Overview Questions
 Chapter 6 Aquatic Biodiversity Chapter Overview Questions Ø What are the basic types of aquatic life zones and what factors influence the kinds of life they contain? Ø What are the major types of saltwater
Marine Primary Productivity: Measurements and Variability
 Why should we care about productivity? Marine Primary Productivity: Measurements and Variability Photosynthetic activity in oceans created current O 2 -rich atmosphere Plankton form ocean sediments & fossil
State of phytoplankton and. zooplankton in the Estuary and northwestern Gulf of St. Lawrence during Summary. DFO Science
 Fisheries and Oceans Canada Science Pêches et Océans Canada Sciences DFO Science Laurentian Region Stock Status Report C4-18 (2) State of phytoplankton and zooplankton in the Estuary and northwestern Gulf
How global warming and climate change may be accelerating losses of Chesapeake Bay seagrasses.
 How global warming and climate change may be accelerating losses of Chesapeake Bay seagrasses. Dr. Ken Moore The Virginia Institute of Marine Science School of Marine Science College of William and Mary
AP Environmental Science
 AP Environmental Science Types of aquatic life zones MARINE Estuaries coral reefs mangrove swamps neritic zone pelagic zone FRESHWATER lakes and ponds streams and rivers wetlands Distribution of aquatic
Impacts of global warming on bio-products of marine and coastal system Ling TONG Qisheng TANG
 Impacts of global warming on bio-products of marine and coastal system Ling TONG Qisheng TANG Yellow Sea Fisheries Research Institute, CAFS Both environmental and human factors affect the bioproducts in
Chapter 4, sec. 1 Prentice Hall Biology Book p (This material is similar to Ch.17, sec.3 in our book)
") Chapter 4, sec. 1 Prentice Hall Biology Book p.87-89 (This material is similar to Ch.17, sec.3 in our book) Term Definition Weather Day-to-day condition of earth s atmosphere at a particular time and place
Chapter 4, sec. 1 Prentice Hall Biology Book p.87-89 (This material is similar to Ch.17, sec.3 in our book) Term Definition Weather Day-to-day condition of earth s atmosphere at a particular time and place
Unit III Nutrients & Biomes
 Unit III Nutrients & Biomes Nutrient Cycles Carbon Cycle Based on CO 2 cycling from animals to plants during respiration and photosynthesis. Heavy deposits are stored in wetland soils, oceans, sedimentary
15.1 Life in the Earth System. KEY CONCEPT The biosphere is one of Earth s four interconnected systems.
 15.1 Life in the Earth System KEY CONCEPT The biosphere is one of Earth s four interconnected systems. 15.1 Life in the Earth System The biosphere is the portion of Earth that is inhabited by life. The
Application of PALSAR data to classify vegetation in an anthropogenically affected wetland area in Central Spain (Las Tablas de Daimiel)
") Rhodes, Greece, Application of PALSAR data to classify vegetation in an anthropogenically affected wetland area in Central Spain (Las Tablas de Daimiel) Thomas Schmid 1, Magaly Koch 2, Jesús Solana 3 and
Rhodes, Greece, Application of PALSAR data to classify vegetation in an anthropogenically affected wetland area in Central Spain (Las Tablas de Daimiel) Thomas Schmid 1, Magaly Koch 2, Jesús Solana 3 and
BIOMES. Living World
 BIOMES Living World Biomes Biomes are large regions of the world with distinctive climate, wildlife and vegetation. They are divided by terrestrial (land) or aquatic biomes. Terrestrial Biomes Terrestrial
Includes the coastal zone and the pelagic zone, the realm of the oceanographer. I. Ocean Circulation
 Includes the coastal zone and the pelagic zone, the realm of the oceanographer I. Ocean Circulation II. Water Column Production A. Coastal Oceans B. Open Oceans E. Micronutrients F. Harmful Algal Blooms
Need & Opportunities for more integrated farming practices in coastal and offshore aquaculture. Patrick Sorgeloos Ghent University, Belgium
 Need & Opportunities for more integrated farming practices in coastal and offshore aquaculture Patrick Sorgeloos Ghent University, Belgium The Ny-Ålesund Symposium 2016 Ny-Ålesund, Svalbard-Norway, September
1. Jill made the table below during her research on aquatic zones and living organisms. Based on Jill s observations, which conclusion could you draw?
 1. Jill made the table below during her research on aquatic zones and living organisms. Based on Jill s observations, which conclusion could you draw? A. Organisms in the intertidal zone must be able to
Chapter 3: Communities, Biomes, and Ecosystems
 Chapter 3: Communities, Biomes, and Ecosystems How would you describe your Community? Did you include your family and friends? Did you include your school? Did you include plants and animals? A biological
Production vs Biomass
 Patterns of Productivity OCN 201 Biology Lecture 5 Production vs Biomass Biomass = amount of carbon per unit area (= standing stock * C/cell) Units (e.g.): g C m -2 Primary Production = amount of carbon
Rice crop monitoring using EO data in the Mekong Delta, Vietnam
 The 10th GEOSS Asia-Pacific Symposium WG5: Agriculture and Food Security Hanoi, 18-20 th, Sep. 2017 Rice crop monitoring using EO data in the Mekong Delta, Vietnam Lam Dao Nguyen, Hoang Phi Phung, Dang
Site and Species Observations. June 26, 2015
 June 26, 2015 Mason County Department of Community Development Attn: Grace Miller, Senior Planner 411 N. Fifth Street PO Box 279 Shelton, WA 98584 Re: Geoduck Floating Nursery Monitoring Plan, Quarterly
Patterns of Productivity
 Patterns of Productivity OCN 201 Biology Lecture 8 Primary Production - the production of autotrophic biomass Secondary Production - the production of heterotrophic biomass Production vs Biomass Biomass
Earth Observation for Sustainable Development of Forests (EOSD) - A National Project
 - A National Project") Earth Observation for Sustainable Development of Forests (EOSD) - A National Project D. G. Goodenough 1,5, A. S. Bhogal 1, A. Dyk 1, R. Fournier 2, R. J. Hall 3, J. Iisaka 1, D. Leckie 1, J. E. Luther
Earth Observation for Sustainable Development of Forests (EOSD) - A National Project D. G. Goodenough 1,5, A. S. Bhogal 1, A. Dyk 1, R. Fournier 2, R. J. Hall 3, J. Iisaka 1, D. Leckie 1, J. E. Luther
LIFE SCIENCE CHAPTER 20 & 21 FLASHCARDS
 LIFE SCIENCE CHAPTER 20 & 21 FLASHCARDS The base of the ocean s food chains is formed by A. blue whales. B. plankton. C. coral reefs. D. sargassums. The place where the ocean meets the land is the The
Use of EO for integrated Coastal Zone Management [ICZM]
![Use of EO for integrated Coastal Zone Management [ICZM]](/thumbs/78/78380350.jpg "Use of EO for integrated Coastal Zone Management [ICZM]") Use of EO for integrated Coastal Zone Management [ICZM] Prof. George Zalidis Aristotle University of Thessaloniki, School of Agriculture Director of the Laboratory of Applied Soil Science Director of the
Use of EO for integrated Coastal Zone Management [ICZM] Prof. George Zalidis Aristotle University of Thessaloniki, School of Agriculture Director of the Laboratory of Applied Soil Science Director of the
Seagrass Health in Texas
 Seagrass Health in Texas A Comprehensive Monitoring Program Florida Museum of Natural History Harte Institute Florida Museum of Natural History Prepared by Susan E. Linn Marine Science Department University
Human Biology 100A Biome Images
 Human Biology 100A Biome Images Coastal Zone Kelp Forest (temperate latitudes) Instructor: Mark Eberle Oregon Coast Aquarium, Newport, Oregon (photographs by Megan Rohweder) Coral Reef (tropical latitudes)
Zu-Tao Ou-Yang Center for Global Change and Earth Observation Michigan State University
 Zu-Tao Ou-Yang Center for Global Change and Earth Observation Michigan State University Ocean Color: Spectral Visible Radiometry Color of the ocean contains latent information on the water qualitycdom,
Measuring Ocean Color: The Basics
 Measuring Ocean Color: The Basics Radiation of energy from the Sun and the Earth s surface. Recall from previous lectures that the Sun (6000 K), radiates energy in three portions of the energy spectrum:
SUMMARY OF THE COPERNICUS MARINE ENVIRONMENT MONITORING SERVICE OCEAN STATE REPORT 2016
 SUMMARY OF THE COPERNICUS MARINE ENVIRONMENT MONITORING SERVICE OCEAN STATE REPORT 2016 C O P E RNICUS M ARINE E NVIRO N MEN T M ONIT ORING SE R VICE OCEAN STATE REPORT No.1, 2016 Journal of Operational
Linking environmental variables with regional-scale variability in ecological structure and standing stock of carbon within UK kelp forests
 The following supplement accompanies the article Linking environmental variables with regional-scale variability in ecological structure and standing stock of carbon within UK kelp forests Dan A. Smale*,
Remote sensing as a tool to detect and quantify vegetation properties in tropical forest-savanna transitions Edward Mitchard (University of Edinburgh)
") Remote sensing as a tool to detect and quantify vegetation properties in tropical forest-savanna transitions Edward Mitchard (University of Edinburgh) Presentation to Geography EUBAP 10 th Oct 2008 Supervisor:
Remote sensing as a tool to detect and quantify vegetation properties in tropical forest-savanna transitions Edward Mitchard (University of Edinburgh) Presentation to Geography EUBAP 10 th Oct 2008 Supervisor:
Variation Trend and Characteristics of Anthropogenic CO Column Content in the Atmosphere over Beijing and Moscow
 ATMOSPHERIC AND OCEANIC SCIENCE LETTERS, 214, VOL. 7, NO. 3, 243 247 Variation Trend and Characteristics of Anthropogenic CO Column Content in the Atmosphere over Beijing and Moscow WANG Pu-Cai 1, Georgy
Slide 1. Earth Science. Chapter 11 Living Systems
 Slide 1 Earth Science Chapter 11 Living Systems Slide 2 Biomes A biome is a region with a certain climate and certain forms of vegetation. It is mostly the climate temperature and precipitation in an area
CTD (CONDUCTIVITY-TEMPERATURE-DEPTH)
") CTD (CONDUCTIVITY-TEMPERATURE-DEPTH) Related lesson plan Fresh and Seawater Density What is this sensor? CTD is an acronym for Conductivity, Temperature and Depth. However, this is somewhat misleading
CTD (CONDUCTIVITY-TEMPERATURE-DEPTH) Related lesson plan Fresh and Seawater Density What is this sensor? CTD is an acronym for Conductivity, Temperature and Depth. However, this is somewhat misleading
A REVIEW OF FOREST FIRE INFORMATION TECHNOLOGIES IN VIETNAM
 A REVIEW OF FOREST FIRE INFORMATION TECHNOLOGIES IN VIETNAM Le Thanh Ha 1, Nguyen Hai Chau 1, Nguyen Hoang Nam 1, Bui Quang Hung 1, Nguyen Thi Nhat Thanh 1, Nguyen Ba Tung 1, Do Khac Phong 1, Nguyen Van
CH. 15 THE BIOSPHERE 1
 CH. 15 THE BIOSPHERE 1 15.1 BIOSPHERE Part of Earth where life exists All of Earth s ecosystems Biota all living things in biosphere Abiotic factors NOT included Ex: water, air, rocks 2 EARTH S SYSTEMS
Mercury in the Biostrome Community of the Great Salt Lake
 Utah State University DigitalCommons@USU Watershed Sciences Faculty Publications Watershed Sciences 2009 Mercury in the Biostrome Community of the Great Salt Lake Wayne A. Wurtsbaugh Utah State University
Remotely-Sensed Fire Danger Rating System to Support Forest/Land Fire Management in Indonesia
 Remotely-Sensed Fire Danger Rating System to Support Forest/Land Fire Management in Indonesia Orbita Roswintiarti Indonesian National Institute of Aeronautics and Space (LAPAN) SE Asia Regional Research
Integrated Coastal Zone Management Project Republic of India
 Integrated Coastal Zone Management Project Republic of India Restoration and conservation of mangroves, coral reefs transplantation along the coastline of Gujarat and Orissa regions Abstract The ICZM project
Cambridge International Examinations Cambridge International General Certificate of Secondary Education
 Cambridge International Examinations Cambridge International General Certificate of Secondary Education *5927851245* GEOGRAPHY 0460/22 Paper 2 October/November 2015 Candidates answer on the Question Paper.
Distribution Limits. Kangaroo Distributions and Climate. Kangaroo Distributions and Climate
 Distribution Limits Physical environment limits geographic distribution of a species. Organisms can only compensate so much for environmental variation Kangaroo Distributions and Climate Caughley found
MONITORING OF KEY EUTROPHICATION PARAMETERS AT THREE INSHORE STATIONS OF STRYMONIKOS GULF, NORTH AEGEAN SEA
 Volume 1 No. 9 21 REPRINT pp. 76-71 MONITORING OF KEY EUTROPHICATION PARAMETERS AT THREE INSHORE STATIONS OF STRYMONIKOS GULF, NORTH AEGEAN SEA N. Stamatis - D. Ioannidou - E. Koutrakis Angerstr. 12 85354
Nitrogen and phosphorus removal rates using small algal turfs grown with dairy manure
 Journal of Applied Phycology 14: 469 473, 2002. 2003 Kluwer Academic Publishers. Printed in the Netherlands. 469 Nitrogen and phosphorus removal rates using small algal turfs grown with dairy manure C.
21 st Century Climate Change Impacts on Marine Fisheries
 21 st Century Climate Change Impacts on Marine Fisheries Anne B. Hollowed, NOAA, NMFS, Alaska Fisheries Science Center, Seattle, WA USA International Workshop on Climate and Oceanic Fisheries, Rarotonga,
Climate Change and Coral Bleaching
 Rising ocean temperatures may push coral reefs to their limits. Climate Change and Coral Bleaching http://www.nova.org.au/coral-bleaching Essentials! Corals are animals that live in a mutually beneficial
Trawling: finding common ground on the scientific knowledge regarding best practices
 Trawling: finding common ground on the scientific knowledge regarding best practices Ray Hilborn, Simon Jennings, Michel Kaiser Executive Summary summary and specific request sections One of the most contentious
Nutrient Sources, Fate, Transport, and Effects Study of Galveston Bay, Texas Rachel Windham,
 Nutrient Sources, Fate, Transport, and Effects Study of Galveston Bay, Texas Rachel Windham, Department of Marine Biology Texas A&M University at Galveston 2 Acknowledgements: Dr. Antonietta Quigg Members
YIR01WQ2 Total oxygen in river stations by river size
 YIR01WQ2 Total oxygen in river stations by river size Figure 1 Annual average dissolved oxygen concentrations (mg O 2 /l) at stations in different sized rivers between 1993 and 1998 11.0 mg O2/l 10.5 10.0
Urban Greening and the UHI: Seasonal Trade-offs in Heating and Cooling Energy Consumption in Manchester, UK
 Urban Greening and the UHI: Seasonal Trade-offs in Heating and Cooling Energy Consumption in Manchester, UK T H E R E S E A R C H E R S C y n t h i a S k e l h o r n PhD Physical Geography Post-Doctoral
Climate: describes the average condition, including temperature and precipitation, over long periods in a given area
 Ch. 6 - Biomes Section 6.1: Defining Biomes Biome: a group of ecosystems that share similar biotic and abiotic conditions, large region characterized by a specific type of climate, plants, and animals
Dead-Zones and Coastal Eutrophication: Case- Study of Chesapeake Bay W. M. Kemp University of Maryland CES Horn Point Laboratory Cambridge, MD
 Dead-Zones and Coastal Eutrophication: Case- Study of Chesapeake Bay W. M. Kemp University of Maryland CES Horn Point Laboratory Cambridge, MD Presentation to COSEE Trends Orientation at UMCES HPL 4 August
A Case Study on Ocean Acidification By Sindia M. Rivera-Jiménez, Ph.D. Department of Natural Science, Santa Fe College, Gainesville Fl
 A Case Study on Ocean Acidification By Sindia M. Rivera-Jiménez, Ph.D. Department of Natural Science, Santa Fe College, Gainesville Fl Please read the following abstract of an article from the journal
GLOBAL CLIMATE CHANGE
 1 GLOBAL CLIMATE CHANGE From About Transportation and Climate Change (Source; Volpe center for Climate Change and Environmental forecasting, http://climate.volpe.dot.gov/trans.html Greenhouse effect has
Corals and coral reefs. Dr. Rob van Woesik
 Corals and coral reefs Dr. Rob van Woesik Today Corals life cycle An amazing relationship symbiosis Coral growth Controlling factors Coral polyp A brief history Tynne (1859) reported coral gametogenesis,,
Causes of Gulf of Mexico Hypoxia
 Causes of Gulf of Mexico Hypoxia Nancy N. Rabalais 1 R. Eugene Turner 2 1 Louisiana Universities Marine Consortium 2 Louisiana State University Center for Sponsored Coastal Ocean Research, Coastal Ocean
UNIVERSITY OF CAMBRIDGE INTERNATIONAL EXAMINATIONS International General Certificate of Secondary Education GEOGRAPHY 0460/01
 UNIVERSITY OF CAMBRIDGE INTERNATIONAL EXAMINATIONS International General Certificate of Secondary Education GEOGRAPHY 060/01 Paper 1 Additional Materials: Answer Booklet/Paper Ruler May/June 2006 1 hour
1 Biodiversity and Sustainability In t h e w o r l d s many ecosystems whether desert valleys, coral reefs, riverbanks,
 1 Biodiversity and Sustainability In t h e w o r l d s many ecosystems whether desert valleys, coral reefs, riverbanks, or backyard gardens are unique assortments of. The vary in s and in how closely or
STOCK ASSESSMENT OF WITCH FLOUNDER (GLYPTOCEPHALUS CYNOGLOSSUS) IN NAFO SUBDIVISION 3PS
 IN NAFO SUBDIVISION 3PS") Canadian Science Advisory Secretariat Newfoundland and Labrador Region Science Advisory Report 2018/011 STOCK ASSESSMENT OF WITCH FLOUNDER (GLYPTOCEPHALUS CYNOGLOSSUS) IN NAFO SUBDIVISION 3PS Image: Witch
Canadian Science Advisory Secretariat Newfoundland and Labrador Region Science Advisory Report 2018/011 STOCK ASSESSMENT OF WITCH FLOUNDER (GLYPTOCEPHALUS CYNOGLOSSUS) IN NAFO SUBDIVISION 3PS Image: Witch
Exploration of alternative monitoring strategies in relation to water body assessments. Imre Schep
 Imre Schep DID Team Hydro Advise on information and monitoring strategies Advise on instruments and sensors Exploration of alternative monitoring strategies in relation to water body assessments How can
The SAFARI Initiative. Societal Applications in Fisheries & Aquaculture using Remotely-Sensed Imagery
 The SAFARI Initiative Societal Applications in Fisheries & Aquaculture using Remotely-Sensed Imagery Introduction July 2007, request from GEO to assimilate satellite Earth Observation (EO) into fisheries
15 19 May 2017 Panel: The effects of climate change on oceans
 15 19 May 2017 Panel: The effects of climate change on oceans Segment 1 : The effects of climate change on oceans, including environmental, social and economic implications Nathalie Hilmi Centre Scientifique
Pre-Program Student Sheet
 Pre-Program Student Sheet The North American Agreement on Environmental Cooperation (NAAEC) is a supplemental agreement of NAFTA (the North American Free Trade Agreement). Ecological regions are a way
Gas Guzzlers. Biological Pump
 Gas Guzzlers Biological Pump Aquatic Biodiversity Chapter 8 Coral Reefs Open Ocean Deep Sea Marine equivalent of tropical rain forests Habitats for one-fourth of all marine species Coral polyps, which
UK Trade Statistics 2015
 Value ( million) Rate of exchange (GBP to USD) ORNAMENTAL AQUATIC TRADE ASSOCIATION LTD. "The Voice of the Ornamental Fish Industry" st Floor Office Suite, Wessex House 4 Station Road, Westbury, Wiltshire
Cambridge International Examinations Cambridge International General Certificate of Secondary Education
 Cambridge International Examinations Cambridge International General Certificate of Secondary Education *0123456789* ENVIRONMENTAL MANAGEMENT 0680/02 Paper 2 Management in context For Examination from
Crop Growth Monitor System with Coupling of AVHRR and VGT Data 1
 Crop Growth Monitor System with Coupling of AVHRR and VGT Data 1 Wu Bingfng and Liu Chenglin Remote Sensing for Agriculture and Environment Institute of Remote Sensing Application P.O. Box 9718, Beijing
PROGRAMMES & PROJECTS
 PROGRAMMES & PROJECTS Service d Observation CORAIL A Long-Term Monitoring Program for the Coral Reefs of the South Pacific http://observatoire.criobe.pf Context, Motivations and Scientific Objectives Since
STAAR Science Tutorial 55 TEK 8.11D: Human Dependence on Ocean Systems
 Name: Teacher: Pd. Date: STAAR Science Tutorial 55 TEK 8.11D: Human Dependence on Ocean Systems TEK 8.11D: Recognize human dependence on ocean systems and explain how human activities such as runoff, artificial
SCOPE FOR RENEWABLE ENERGY IN HIMACHAL PRADESH, INDIA - A STUDY OF SOLAR AND WIND RESOURCE POTENTIAL
 SCOPE FOR RENEWABLE ENERGY IN HIMACHAL PRADESH, INDIA - A STUDY OF SOLAR AND WIND RESOURCE POTENTIAL Gautham Krishnadas and Ramachandra T V Energy & Wetlands Research Group, Centre for Ecological Sciences,
The challenges and complexities of impact assessment for a seismic survey in a remote coral reef environment
 The challenges and complexities of impact assessment for a seismic survey in a remote coral reef environment J.G. Colman 1,2, C.C. Grebe 1 & R.L. Hearn 1 1 Woodside Energy Ltd (cameron.grebe@woodside.com.au,
Coral Reefs- A Challenging Ecosystem for Human Societies* B. Salvat Originally published in Global Environmental Change, 1992, vol. 2, pp.
 Coral Reefs- A Challenging Ecosystem for Human Societies* B. Salvat Originally published in Global Environmental Change, 1992, vol. 2, pp. 12-18 18 Presented by: Amy Dewees & Melissa Parente What is coral?
Mrs. Butler Oceanography
 Mrs. Butler Oceanography InstrumentsLab.doc Instruments Lab This exercise is to be done in the classroom. At each of the seven stations you are to decide what tools or instruments are to be used to conduct
Real time Water Quality Monitoring
 Real time Water Quality Monitoring Robert Schuster New Jersey Department of Environmental Protection Water Monitoring and Standards Bureau of Marine Water Monitoring Presented at NJWMCC Meeting September
Ecology, the Environment, and Us
 BIOLOGY OF HUMANS Concepts, Applications, and Issues Fifth Edition Judith Goodenough Betty McGuire 23 Ecology, the Environment, and Us Lecture Presentation Anne Gasc Hawaii Pacific University and University
Remote Sensing (C) Team Name: Student Name(s):
 Team Name: Student Name(s):") Team Name: Student Name(s): Remote Sensing (C) Nebraska Science Olympiad Regional Competition Henry Doorly Zoo Saturday, February 27 th 2010 96 points total Please answer all questions with complete sentences
Team Name: Student Name(s): Remote Sensing (C) Nebraska Science Olympiad Regional Competition Henry Doorly Zoo Saturday, February 27 th 2010 96 points total Please answer all questions with complete sentences
The Open Ocean. College of Marine Sciences, Shanghai Ocean University
 The Open Ocean Regions of the Open Sea Beyond the shallow coastal seas over the continental shelves (neritic zone) lies the open ocean (oceanic zone). The photic zone is the layer that receives enough
Barnegat Bay-Little Egg Harbor: Ecosystem Condition. Michael J. Kennish Institute of Marine and Coastal Sciences Rutgers University
 Barnegat Bay-Little Egg Harbor: Ecosystem Condition Michael J. Kennish Institute of Marine and Coastal Sciences Rutgers University Coastal Lagoons Barnegat Bay- Little Egg Harbor ANTHROPOGENIC EFFECTS*
Chapter 4 Guided Notes and presentations
 Module 9: The Unequal Heating of Earth Definitions Troposphere: Chapter 4 Guided Notes and presentations Stratosphere: Albedo: Ozone Graph the following temperature data and corresponding layers of the
The Biosphere. GETTING READY TO LEARN Preview Key Concepts 15.1 Life in the Earth System The biosphere is one of Earth s four interconnected systems.
 CHAPTER 15 The Biosphere GETTING READY TO LEARN Preview Key Concepts 15.1 Life in the Earth System The biosphere is one of Earth s four interconnected systems. 15.2 Climate Climate is a key abiotic factor
Title: CEDEX Proposal for Use. of CHRIS imagery for Monitoring. Authors: Spain) Topic/subtopic
 Topic/subtopic") Title: CEDEX Proposal for Use of CHRIS imagery for Monitoring oring Ecological Water Quality in smallest Mediterranean Reservoirs integrated in the Intercalibration Exercise of WFD Implementation Process
Title: CEDEX Proposal for Use of CHRIS imagery for Monitoring oring Ecological Water Quality in smallest Mediterranean Reservoirs integrated in the Intercalibration Exercise of WFD Implementation Process
COMPARISON OF GEOSYNTHETIC MATERIALS AS SUBSTRATES ON COASTAL STRUCTURES GOLD COAST (AUSTRALIA) AND ARABIAN GULF
 AND ARABIAN GULF") COMPARISON OF GEOSYNTHETIC MATERIALS AS SUBSTRATES ON COASTAL STRUCTURES GOLD COAST (AUSTRALIA) AND ARABIAN GULF Bobbie Corbett 1, L. Angus Jackson 1, Timothy Evans 1 and Simon Restall 2 Coastal structures
COMPARISON OF GEOSYNTHETIC MATERIALS AS SUBSTRATES ON COASTAL STRUCTURES GOLD COAST (AUSTRALIA) AND ARABIAN GULF Bobbie Corbett 1, L. Angus Jackson 1, Timothy Evans 1 and Simon Restall 2 Coastal structures
USING HYDROSCAPES TO MAXIMIZE THE BENEFITS OF RIPARIAN CORRIDOR RESTORATION FOR MULTIPLE RIVER ECOSYSTEM SERVICES
 REFORM International Conference on River and Stream Restoration Novel Approaches to Assess and Rehabilitate Modified Rivers TEMPLATE FOR EXTENDED SUMMARY USING HYDROSCAPES TO MAXIMIZE THE BENEFITS OF RIPARIAN
Chapter 05 Lecture Outline
 Chapter 05 Lecture Outline William P. Cunningham University of Minnesota Mary Ann Cunningham Vassar College Copyright The McGraw-Hill Companies, Inc. Permission required for reproduction or display. 1
Forest Changes and Biomass Estimation
 Forest Changes and Biomass Estimation Project Title: Comparative Studies on Carbon Dynamics in Disturbed Forest Ecosystems: Eastern Russia and Northeastern China Supported by NASA Carbon Cycle Science
MARINE ECOLOGICAL ENGINEERING A sustainable solution for coastal cities and areas
 PÔLE MER MÉDITERRANÉE THE STRUCTURATION OF AN EMERGING SECTOR MARINE ECOLOGICAL ENGINEERING A sustainable solution for coastal cities and areas SEPTEMBER 23 RD 2014 GENOA This document has been achieved
Biotic and Abiotic Factors
 Biotic and Abiotic Factors Different Approaches to the Study of Ecology Ecology is the study of an organism or organisms and their relationship to the environment. An organism s environment consists of
Application of Gliders for Near-Real Time METOC Data Collection Capability for Battlespace Characterization
 DISTRIBUTION STATEMENT A: Approved for public release; distribution is unlimited. Application of Gliders for Near-Real Time METOC Data Collection Capability for Battlespace Characterization Charles Trees
9/23/2015 Question 1 Review Chapter 15 What biome do you live in? Biomes Answer 1 Question 2 Temperate Deciduous Forest Name the 6 Major biomes.
 Review Chapter 15 Biomes Question 1 What biome do you live in? Answer 1 Question 2 Temperate Deciduous Forest Name the 6 Major biomes. 1 Answer 2 Question 3 Fill in Tropical Rainforest Desert Temperate
Monitoring Trends in Burn Severity (MTBS) Project Overview
 Project Overview") Monitoring Trends in Burn Severity (MTBS) Project Overview Adrian Grell US Forest Service Remote Sensing Applications Center Webinar for the Northern Rockies Fire Science Network February 6, 2013 Consistently
Monitoring Trends in Burn Severity (MTBS) Project Overview Adrian Grell US Forest Service Remote Sensing Applications Center Webinar for the Northern Rockies Fire Science Network February 6, 2013 Consistently
Session 2 Biodiversity Conservation
 Session 2 Biodiversity Conservation Nutrient Concentration and Water Turbidity on Coral Reef Area and their Effects on the Living Coral Koichi KINJO Okinawa Prefectural Institute of Health and Environment
Aqaba Projects Partner Country Priorities NATO Forum
 Aqaba Projects Partner Country Priorities NATO Forum March 12 th 2008 Mohammad Badran and Mohammad Al Zibdah Marine Science Station; University of Jordan / Yarmouk University, Aqaba Jordan. 3/12/2008 1
Unit 1 Hydrodynamics. Introduction to Seagrasses
 Unit 1 On the cutting edge Scientists at the University of South Florida s Biology department are on the cutting edge of science studying how water velocity influences the ecology of seagrass communities.
EVALUATION OF TSUNAMI DAMAGE IN THE EASTERN PART OF SRI LANKA DUE TO THE 2004 SUMATRA EARTHQUAKE USING REMOTE SENSING TECHNIQUE ABSTRACT
 EVALUATION OF TSUNAMI DAMAGE IN THE EASTERN PART OF SRI LANKA DUE TO THE 2004 SUMATRA EARTHQUAKE USING REMOTE SENSING TECHNIQUE H. Miura 1, A. C. Wijeyewickrema 2 and S. Inoue 3 ABSTRACT In order to develop
2009/2010 Water Column Overview, Red Tide Update, and Bay Eutrophication Model 2010 Results. OMSAP Meeting June 30, 2011.
 29/21 Water Column Overview, Red Tide Update, and Bay Eutrophication Model 21 Results OMSAP Meeting June 3, 211 Scott Libby Contributions from D. Anderson, D. Borkman, C.S. Chen, R. Geyer, and C. Oviatt
FORMA: Forest Monitoring for Action
 FORMA: Forest Monitoring for Action FORMA uses freely-available satellite data to generate rapidly-updated online maps of tropical forest clearing. We have designed it to provide useful information for
Discussion of the NASA OCO-2 Satellite Measurements of CO 2 Concentrations
 Physics Journal Vol. 1, No. 3, 2015, pp. 189-193 http://www.aiscience.org/journal/pj Discussion of the NASA OCO-2 Satellite Measurements of CO 2 Concentrations A. Parker * School of Engineering and Physical
Parinya Sutthinon 1, Wara Taparhudee 2 * and Renu Yashiro 1 ABSTRACT
 Kasetsart J. (Nat. Sci.) 41 : 104-109 (2007) Nursing of Babylon Snail (Babylonia areolata Link, 1807) from Veliger Larvae to Early Juveniles Using Different Materials Attached on Edge of Nursing Tanks