Presented by Andrew Velasquez URS Corporation/Florida s Turnpike Enterprise
|
|
|
- Jade Terry
- 6 years ago
- Views:
Transcription


1 Presented by Andrew Velasquez URS Corporation/Florida s Turnpike Enterprise
2 Traffic and Revenue Study Assessment of the viability of tolling a facility and expected toll revenue over a long term time frame. Evaluates congestion relief potential of tolling options. Allows agencies to evaluate financing the options. Cash Financing Debt Financing Public Private Pi Partnerships 2
3 Traffic and Revenue Study Levels Top Down Comparative analysis of similar facilities Sketch Level Involves analysis tools with generic inputassumptions Planning Level Involves some data collection and use of various modeling tools, including time of day diversion models. Investment Grade Extensive data collection (O/D, value of time, socioeconomic) and refined modeling tools. 3


 4")

4 Study Area District 4 Portion 4 Managed Lanes on I 75 from NW 170 th Street to I 595 Reversible lane direct connection to I 595 District 6 Portion 4 Managed Lanes on I 75 from SR 826 to NW 170 th Street Direct ramp connection from SR 826 to I 75 (two managed lanes) 4 Managed Lanes on SR 826 between SR 836 and SR 826 4
5 Traffic and Revenue Models Land Use Review Bluetooth OD SP/RP Survey Travel Demand Model (3 Period) Time of Day Model (Hourly) Probability Model Toll Revenue Model 5


6 OD Estimation Bluetooth Detection Technology Bluetooth Detector (Traffax) has 100 meter range and consecutive 5 second scan windows. Discoverable bluetooth devices are detected and timestamped. Bluetooth devices have a unique MAC ID. Chronological MAC IDs are linked together to form trips. Dataanalysis analysis provides studyareaspeed speed profiles and origin destination estimates. 6


7 Bluetooth Data Collection Effort 46 detectors deployed in the study area Deployment designed primarily to sequester interchanges Data collection occurred October 12 20, 2011 Penetration rate ranges from 3% 9%, 5% mean O D table by period (AM, PM, OP) 7
8 Bluetooth Data Collection Effort 5 detectors deployed in the I 95 Data collection occurred February 23 March 1, 2012 Purpose to understand vehicle movements eligible to use 95 Express 63% or 155,00 vpd O D critical for accurate model calibration 8
9 Stated/Revealed Preference Surveys Stated Preference Survey: Hypothetical choice scenarios to understand response to future conditions What would you do if...? Revealed Preference Survey: Observed choice bh behavior given existing iti conditions What did you do...? I 75/SR 826 Stated Preference Survey Estimate Values of Time (VTTS) for drivers in the I 75 and SR 826 corridors Input for traffic and revenue forecast for Express Lanes expansion I 95 Stated/Revealed d Preference Survey Estimate VOT for drivers in the I 95 corridor Understand why drivers choose to use the I 95 Express Lanes without a large travel time benefit Validate/calibrate travel demand model 9
10 I 95 Trip Characteristics Ranking of Reasons for Using the I 95 Express Lanes Reasons for using I 95 Express Lanes Faster travel time cited most frequently Faster travel time ranked highest Less congestion andtravel time reliability ranked 2 nd and 3 rd Faster travel time (N = 213) Less congestion (N = 193) More reliable travel time (N = 139) Safe road conditions (N = 44) No large trucks (N = 74) 33% 26% 18% 16% Only 1 respondent reported fuel savings as a reason Other (N = 8) 63% 13% 25% 18% 73% 29% 40% 66% 78% 22% 45% 27% Ranked 1st Ranked 2nd Ranked 3rd or lower 5% 10
11 Discrete Choice Modeling Overview Stated and Revealed Preference data used to estimate coefficients of a discrete choice model Coefficients provide information about sensitivity to: Travel time Toll cost Travel Time uncertainty Used to feed the ELTOD model 11
12 SP/RP Model Calibration Time and Cost Savings Reliability Other Variables Utility for alternative () (i): U(i) () = βtime * traveltime(i) () + βcost * tollcost(i) () + βentropylate * entropy () (i) + CalibratedTollConstant Entropy for alternative (i): Entropy(i) = 2.15*EXP( VC(i)* )/(1+EXP( VC(i)* )) Where: βtime = travel time coefficient βcost = toll cost coefficient βentropylate = entropy coefficient for travelers arriving late CalibratedTollConstant = Calibrated toll constant for appropriate travel direction and time period traveltime(i) = Travel time for alternative(i) tollcost(i) () = Toll cost for alternative(i) () VC(i) = Volume/Capacity ratio for alternative(i) Coefficient Before Calibration After Calibration Time Cost VTTS = $11.03 Entropy Toll Constant (Peak) 1.50 (Off Peak) 12
13 SP/RP Model Calibration V/C Entropy 0% % % % % % % % % % % % % % % % % % % % % 2.14 Entropy Entropy VC Relationship 0% 10% 20% 30% 40% 50% 60% 70% 80% 90% 100% Volume/Capacity 13
14 95 Express Calibration Results 2,500 NB Observed vs Model Traffic 3,000 SB Observed vs Model Traffic 2,000 1,500 1, Observed NB Modeled NB 2,500 2,000 1,500 1, Observed SB Modeled SB Hour of Day Hour of Day NB Observed Toll vs Model Toll SB Observed Toll vs Model Toll $4.00 $4.00 $3.50 $3.50 $3.00 $3.00 $2.50 $2.50 $2.00 $1.50 $1.00 Model NB Observed NB $2.00 $1.50 $1.00 Model SB Observed SB $0.50 $0.50 $ $ Hour of Day Hour of Day
15 95 Express Calibration Results Calibration Results Average Weekday Observed Model % Difference Transactions 47,404 50, % Revenue $67,314 $67, % 0.5% For the period November 1, 2011 to December 16,
16 Model Interactions Land Use Review Bluetooth OD SP/RP Survey Travel Demand Model SERPM CORSIM Micro Simulation Step 1 Step 2 Time of Day Model ELTOD Toll Revenue Model Step 3 Step 4 Probability Model 16
17 Traffic and Revenue Process Step 1 Step 2 Initial feed dfrom the SERPM into the ELTOD model Run ELTOD for full experimental design into probability model. Probability model provides target revenue values. Step 1 Step 2 SERPM ELTOD Probability Step 4 Step 3 Toll Revenue Model 17


18 Southeast Regional Planning Model (SERPM) 3 Counties Miami Dade, Broward and Palm Beach County Project Level Validation Updated Highway Network to 2010 Benchmarked Population to 2010 Census Updated 3,700 links with counts by time of day 18

19 Subarea Feed from SERPM 19
20 TOD Model Flowchart Travel Demand Corridor Daily O D Matrix Model Parameters Akcelik parameters Value of time Model scale Equilibration settings ELTOD Equilibrium Assignment Supply Toll Policy Minimum toll Maximum toll Toll escalation Highway Network Geometry GP links ML links Access links Assumed tolls Equilibrium Flows by Period Toll levels, revenues Speeds, travel times V/C ratios Output Report Notes: Blue boxes represent elements from SERPM Green boxes are other ELTOD inputs Orange boxes are ELTOD calculations 20
21 ELTOD Express Lanes Time of Day Assignment Model Traffic allocation analysis for managed toll lanes projects Produces traffic forecast estimates in a pre defined limited access corridor for general use and managed toll lanes Utilizes output from the SERPM Traffic estimates are by: Direction, Project Section, Hour, Lane Type (GUL or ML) 21
22 ELTOD: Input Data VTTS & Choice Model Coefficients: $11.03 Maximum Service Volume (Vehicles/Lane/Hour): vph Free Flow Speed: mph Geometry (GP & ML) Number of Lanes, Link Length (Distance) Sub area O D matrix (AM, PM, Off Peak) Hourly traffic distribution Volume Delay Measure (Akcelik Function) 22
23 ELTOD: Volume Delay Curve 23
24 Input Data: ELTOD: Pricing Policy Minimum/Maximum Toll Rates Min = $0.15/mile, Max = $2.00/mile Pricing Curve Level (frequency of toll rate change) Exponential curve (not a step function) Higher exponential values represent more traffic serviced 24
25 ELTOD: Pricing Policy Curve Comparison p$1.00 To oll Rate er Mile ($ $) $2.00 $1.80 $1.60 $1.40 $1.20 $1.00 $0.80 $0.60 $0.40 $0.20 $0.00 Revenue Maximizing I-75/S.R. 826 IG I-75/S.R. 826 PL 95 Express Traffic Maximizing Revenue Potential Increases Curves are defined by the EXP value. Traffic Volume Increases LOS A LOS B LOS C LOS D LOS E Volume/Capacity 25
26 ELTOD: Output Traffic volumes Preliminary revenue Toll rates Speeds Volume to capacity ratios Application: UsedtheELTOD to generate hourly traffic and toll rates to feed the revenue model 26

27 CORSIM Micro Simulation Models developed for I 75/S.R. 826 Project Development and Environment (PD&E) Studies Consolidated two separate models into one model Developed interface to read ELTOD volumes into CORSIM Re calibrated to ELTOD volumes and Bluetooth th Speeds 27
28 Existing Speed Comparison Bluetooth ELTOD BT vs CORSIM Avg. Avg. ELTOD Avg. Direction Period Speed Speed Diff Speed Diff I 75 SB AM % % PM % % NB AM % % PM % % 28% SR 826 SB AM % % PM % % NB AM % % PM % 4.1% % 28
29 Probability Modeling Variable B Variable A Variable C Probability distributions for traffic and revenue 29


30 Improving the Reliability of Traffic and Revenue Forecasts There is broad recognition of issues with traffic forecasts and of ways of improving those forecasts. Improve the models that are used for forecasting Progress has been made along a number of fronts Model structure Model inputs Recognize and quantify inherent uncertainties and simplifications Identify key uncertainties in model structure and inputs Use quantified probability analysis
31 Sensitivity Analyses are Essential But Have Clear Limitations Typically run for each input separately, without accounting for interactions between inputs Generally need to evaluate effects of changes to more than one variable in combination; this cannot be accomplished without A new model run this can be time consuming given the number of possible combinations of possible uncertainties titi 31
32 How Are the Variables Assessed? 1. Estimate range of uncertainty associated with each significant variable 2. Outline scenarios involving combinations of factors 3. Determine sensitivityof traffic andrevenue by: Running travel demand model for those scenarios Developing statistical model to approximate the travel demand model 4. Use simulation method to determine full distribution of traffic and revenue accounting for uncertainties in input factors 32
33 Key Forecast Variables of Possible Significance Define key variables and their uncertainties, including: Vl Values of time distribution ib ti from survey Network changes FDOT work program Local road improvements Population, employment BEBR scenarios Employment projections 33
34 Experimental Design 2040 Model Population Roadway Network VTTS 1 6,263,300 Needs Plan $ ,263,300 CF Plan $ ,918,700 Needs Plan $ ,918,700 CF Plan $ ,918,700 E+C $ ,626,250 E+C $ ,263,300 Needs Plan $ Travel 8 6,263,300 Demand CF Plan $ Time of Day 9 6,263,300 Model E+C $ Model ,918,700 SERPM Needs Plan $ ELTOD ,918,700 CF Plan $ ,918,700 E+C $ ,626,250, Needs Plan $ ,626,250 CF Plan $ ,626,250 E+C $ ,918,700 Needs Plan $ ,918,700 CF Plan $ ,918,700 E+C $ ,626,250 CF Plan $ ,626,250 E+C $
35 Probability Model Risk Factors Revenue Risk Variable Case Factor Demographics Low 0.91 High 1.10 Value of Time Low 0.73 High Road Network Low 1.00 High General Uncertainty Low 0.75 High
36 Probability Analysis Process Input Distributions tions Input Distributions tions Travel Demand Model with Toll Module Regression Model Representative scenario runs Monte Carlo simulation runs Traffic & Revenue Estimations Traffic & Revenue Estimations * 20 runs for each year * 10, runs for each year 36
37 Application of Probability Model Monte Carlo simulations used to determine distributions of traffic and revenue for each model year Sample Output 37
38 Generic Probability Distribution P50 P75 P25 P90 P10 10% 25% 50% 75% 90% 38
39 The Final Steps Step 3 Step 4 Probability model supplies target revenue for P50 and P75 scenarios to ELTOD. Final ELTOD runs to produce hourly refinement for the Toll Revenue Model Step 1 Step 2 SERPM ELTOD Probability Step 4 Step 3 Toll Revenue Model 39
40 Revenue Forecasting Process ELTOD Gross Revenue Traffic and Revenue Factors Toll Collection Expenses Preliminary Net Revenue Other Operating Expenses Final Net Revenue Maintenance Expense 40


41 Traffic and Revenue Factors under FDOT Directive Weekend Traffic Weekend Toll Rates Toll Evasion No Trucks No Toll by Plate Tolls Indexed annually 41
42 Annual Gross Revenue ($000) $160,000 $140,000 $120,000 $100,000 $80,000 Final IG P50 Final IG P75 $60,000 $40,000 $20,000 $0 Note: Numbers are expressed in 2011 dollars. 42
 I 394 Minneapolis (9 miles) I 495 Washington DC (14 miles) I")
 I 25 Denver (7 miles) I 10 Houston (13 miles) I 95 Miami ( 7")
43 Managed Lanes in Operation SR 167 Seattle (10 miles) I 15 Salt Lake City (40 miles) I 394 Minneapolis (9 miles) I 495 Washington DC (14 miles) I 85 Atlanta ( 7 miles) SR 91 Orange County (10 miles) I 15 San Diego (16 miles) I 25 Denver (7 miles) I 10 Houston (13 miles) I 95 Miami ( 7 miles) 43
44 Managed Lanes Traffic and Revenue Stats Facility Length General Use Lanes Express Lanes Annual Revenues (millions) Average Daily Rate/Mile Avg. Revenue/Lane Mile I 85 GA $ $0.07 $160 S.R. 167 WA $ $0.09 $28 I 394 MN $ $0.13 $73 I 25 CO $ $0.10 $179 I 10 TX $ $0.04 $146 I 95 FL $15.0 $0.12 $564 S.R. 91 CA $ $0.30 $1,000 I 595 FL Reversible $5.0 $0.06 $167 I 75/SR 826 IG $21.9 $0.24 $219 44
45 Questions & Answers 45
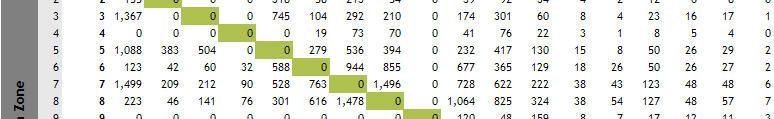
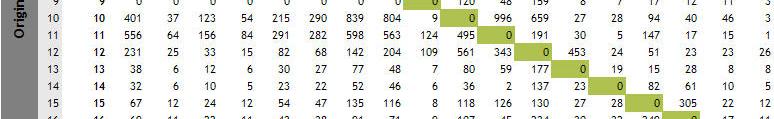
Origin-Destination Trips and Skims Matrices
 Origin-Destination Trips and Skims Matrices presented by César A. Segovia, AICP Senior Transportation Planner AECOM September 17, 2015 Today s Webinar Content Matrix Estimation Data sources Florida Application
Current Trends in Traffic Congestion Mitigation
 Current Trends in Traffic Congestion Mitigation April 24, 2009 NCSL Spring Forum Washington, DC Jeff Lindley Associate Administrator, Office of Operations Federal Highway Administration U.S. Department
Travel Time Reliability in the SLOCOG Region. October 27, 2014 San Luis Obispo Council of Governments Transportation Education Series
 Travel Time Reliability in the SLOCOG Region October 27, 2014 San Luis Obispo Council of Governments Transportation Education Series 1 Transportation Education Series - Agenda Grab Some Free Lunch!! Introductions
OPTIMIZING RAMP METERING STRATEGIES
 OPTIMIZING RAMP METERING STRATEGIES Presented by Kouros Mohammadian, Ph.D. Saurav Chakrabarti. ITS Midwest Annual Meeting Chicago, Illinois February 7, 2006 Background Ramp control is the application of
Quantifying the performance of a traffic data collection system: Scout Connect match rate evaluation
 Technology Showcase Miovision Scout Quantifying the performance of a traffic data collection system: Scout Connect match rate evaluation Contents Executive summary 2 Elements of the study 2 Objectives
Truck GPS Data for Freight Planning
 Truck GPS Data for Freight Planning presented to Florida Model Task Force, Orlando presented by Frank Tabatabaee Abdul Pinjari Jeff Short (ATRI) Florida DOT University of South Florida (USF) American Transportation
Woodburn Interchange Project Transportation Technical Report
 Final Report Woodburn Interchange Project Transportation Technical Report Prepared for Oregon Department of Transportation April 212 Prepared by DKS Associates Contents Methodologies... 4 Volume Development...
Sunrise Project South I-205 Corridor Improvement Project
 Sunrise Project South I-205 Corridor Improvement Project January 24, 2007 Sunrise and I-205 Project Summary Conclusions Sunrise Scoping Study Key Results South I-205 Scoping Study Key Results South I-205
APPENDIX H: TRAVEL DEMAND MODEL VALIDATION AND ANALYSIS
 APPENDIX H: TRAVEL DEMAND MODEL VALIDATION AND ANALYSIS Travel demand models (TDM) simulate current travel conditions and forecast future travel patterns and conditions based on planned system improvements
Analytical Tools and Decision Support Systems SANDAG I-15 ICM. ITS PA January 30 th, 2014
 Analytical Tools and Decision Support Systems SANDAG I-15 ICM ITS PA January 30 th, 2014 Project Partners/Stakeholders National ICM Evaluator National AMS Contractor 2 San Diego I-15 Corridor 21 mile corridor
I-66 Corridor Improvements Outside the Capital Beltway in Northern Virginia, USA
 15th International Conference on Managed Lanes I-66 Corridor Improvements Outside the Capital Beltway in Northern Virginia, USA Case Study for Funding of Transit Service and Transportation Demand Management
MDX Contract #: RFP MDX Work Program #: ETDM #: 11501
 SR 874/Don Shula Expressway Ramp Connector Project Development & Environment (PD&E) Study PUBLIC HEARING December 8, 2011 MDX Contract #: RFP-09-04 MDX Work Program #: 87410.011 ETDM #: 11501 1 This Public
III. Regional TSM&O Overview from the 2040 Regional Transportation Plan (Jessica Josselyn, Kittelson & Associates, Inc.)
") Regional Transportation Technical Advisory Committee (RTTAC) Transportation System Management & Operations (TSM&O) Subcommittee Meeting Agenda June 23, 2015 1:30 PM FDOT District Four Headquarters Auditorium
Regional Transportation Technical Advisory Committee (RTTAC) Transportation System Management & Operations (TSM&O) Subcommittee Meeting Agenda June 23, 2015 1:30 PM FDOT District Four Headquarters Auditorium
Appendix B. Benefit-Cost Technical Memorandum
 Appendix B Benefit-Cost Technical Memorandum This Page Left Blank Intentionally MEMORANDUM TO: FROM: Michael Kalnbach MnDOT District 1 Project Manager Graham Johnson, PE DATE: September 2, 2014 RE: TH
The Secrets to HCM Consistency Using Simulation Models
 The Secrets to HCM Consistency Using Simulation Models Ronald T. Milam, AICP David Stanek, PE Chris Breiland Fehr & Peers 2990 Lava Ridge Court, Suite 200 Roseville, CA 95661 r.milam@fehrandpeers.com (916)
IMPLEMENTING TOLL PLAZA ANALYSIS INTO FREEPLAN
 IMPLEMENTING TOLL PLAZA ANALYSIS INTO FREEPLAN By ROBIN PHILIP OSBORNE A THESIS PRESENTED TO THE GRADUATE SCHOOL OF THE UNIVERSITY OF FLORIDA IN PARTIAL FULFILLMENT OF THE REQUIREMENTS FOR THE DEGREE OF
Appendix 1. Problem Identification for MoTI Business Cases
 Guidelines for Preparing MoTI Business Cases Appendix 1 Problem Identification for MoTI Business Cases Prepared By: Planning and Programming Branch Infrastructure Department BC Ministry of Transportation
The New Highway Capacity Manual 6 th Edition It s Not Your Father s HCM
 The New Highway Capacity Manual 6 th Edition It s Not Your Father s HCM Tom Creasey, PE, PhD Principal, Stantec Consulting Services Inc. Chair, TRB Highway Capacity and Quality of Service Committee Presented
TRAFFIC ANALYSES TO SUPPORT NEPA STUDIES
 VIRGINIA DEPARTMENT OF TRANSPORTATION ENVIRONMENTAL DIVISION NEPA PROGRAM LOCATION STUDIES TRAFFIC ANALYSES TO SUPPORT NEPA STUDIES CONSULTANT RESOURCE GUIDANCE DOCUMENT Issued on: November 18, 2016 Last
Roadway Traffic Assignment (Last Edit August 26, 2005)
") Roadway Traffic Assignment (Last Edit August 26, 2005) This chapter focuses on the Roadway Traffic Assignment module of the Dallas-Fort Worth Regional Travel Model (DFWRTM). Based on the input vehicle
Roadway Traffic Assignment (Last Edit August 26, 2005) This chapter focuses on the Roadway Traffic Assignment module of the Dallas-Fort Worth Regional Travel Model (DFWRTM). Based on the input vehicle
Curbfront Case Studies
 1 A Sharper Saw? Using Advanced Planning Tools and Data to Improve Your Planning Efforts Finding the Right Saw, Curbfront Case Studies Jill Capelli, P.E. Associate Kimley-Horn and Associates, Inc. jill.capelli@kimley-horn.com
Trips on project forecasting How STOPS works Making STOPS work for you Experience thus far with STOPS applications
 STOPS presented to MTF Transit and Rail Committee presented by Jim Ryan, FTA Bill Woodford, RSG March 25, 2014 Parts of the Presentation Trips on project forecasting How STOPS works Making STOPS work for
Buffalo Niagara Integrated Corridor Management Project. ENTERPRISE Webinar Keir Opie, Cambridge Systematics September 26, 2016
 Buffalo Niagara Integrated Corridor Management Project ENTERPRISE Webinar Keir Opie, Cambridge Systematics September 26, 2016 1 Buffalo-Niagara ICM Corridors I-190 ICM Corridor Cross Border Corridor 2
Florida International University; University of Central Florida. Mohammed Hadi, Ph.D., PE (Dr. Haitham Al-Deek from UCF is Co-PI)
") Project Information Form Project Title University Principal Investigator PI Contact Information Performance Measurements of Transportation Systems based on Fine- Grained Data Collected by AVI and AVL Systems
Project Information Form Project Title University Principal Investigator PI Contact Information Performance Measurements of Transportation Systems based on Fine- Grained Data Collected by AVI and AVL Systems
Simulating High-Occupancy/Toll (HOT) Lane Operations
 Lane Operations") Michalaka, Yin, and Hale 0 0 0 Simulating High-Occupancy/Toll (HOT) Lane Operations Dimitra Michalaka Department of Civil and Coastal Engineering University of Florida Weil Hall Gainesville, FL -0 -- ext.
Michalaka, Yin, and Hale 0 0 0 Simulating High-Occupancy/Toll (HOT) Lane Operations Dimitra Michalaka Department of Civil and Coastal Engineering University of Florida Weil Hall Gainesville, FL -0 -- ext.
APPENDIX B. Public Works and Development Engineering Services Division Guidelines for Traffic Impact Studies
 APPENDIX B Public Works and Development Engineering Services Division Guidelines for Traffic Impact Studies Revised December 7, 2010 via Resolution # 100991 Reformatted March 18, 2011 TABLE OF CONTENTS
Comparing Roundabout Capacity Analysis Methods, or How the Selection of Analysis Method Can Affect the Design
 Comparing Roundabout Capacity Analysis Methods, or How the Selection of Analysis Method Can Affect the Design ABSTRACT Several analysis methods have been proposed to analyze the vehicular capacity of roundabouts.
Greenhouse Gas Emission Reduction Strategies
 Greenhouse Gas Emission Reduction Strategies 2011 ITE Quad Conference April 18 19, 2011, Embassy Suites; Lynnwood, WA Victor L. Sl Salemann, PE Senior Associate David Evans and Associates Bellevue, WA
I-70 East ROD 1: Phase 1 (Central 70 Project) Air Quality Conformity Technical Report
 Air Quality Conformity Technical Report") I-70 East ROD 1: Air Quality Conformity Technical Report January 2017 I-70 East ROD 1: Air Quality Conformity Technical Report TABLE OF CONTENTS Chapter Page 1 PURPOSE OF THIS REPORT... 1 2 PROJECT DESCRIPTION...
I-70 East ROD 1: Air Quality Conformity Technical Report January 2017 I-70 East ROD 1: Air Quality Conformity Technical Report TABLE OF CONTENTS Chapter Page 1 PURPOSE OF THIS REPORT... 1 2 PROJECT DESCRIPTION...
Published by the Palm Beach Metropolitan Planning Organization (MPO) in coordination with Leftwich Consulting Engineers, Inc.
 in coordination with Leftwich Consulting Engineers, Inc.") AMENDMENT #3 + Published by the Palm Beach Metropolitan Planning Organization (MPO) in coordination with Leftwich Consulting Engineers, Inc. Adopted October 16, 2014 by the Board of Directors Palm Beach
AMENDMENT #3 + Published by the Palm Beach Metropolitan Planning Organization (MPO) in coordination with Leftwich Consulting Engineers, Inc. Adopted October 16, 2014 by the Board of Directors Palm Beach
Construction Alternative Screening with Regional Travel Demand Model
 Construction Alternative Screening with Regional Travel Demand Model By: Marty Milkovits (Corresponding Author) Cambridge Systematics, Inc. 100 CambridgePark Drive, Suite 400 Cambridge, MA 02140 Phone:
FREEWAY PERFORMANCE MEASUREMENT SYSTEM (PeMS): AN OPERATIONAL ANALYSIS TOOL
: AN OPERATIONAL ANALYSIS TOOL") FREEWAY PERFORMANCE MEASUREMENT SYSTEM (PeMS): AN OPERATIONAL ANALYSIS TOOL Tom Choe Office of Freeway Operations California Department of Transportation District 7 120 S Spring Street Los Angeles, CA
FREEWAY PERFORMANCE MEASUREMENT SYSTEM (PeMS): AN OPERATIONAL ANALYSIS TOOL Tom Choe Office of Freeway Operations California Department of Transportation District 7 120 S Spring Street Los Angeles, CA
Conclusions & Lessons Learned
 What is a DDI Recommended Practices Traffic Operations Analysis Geometric Design FHWA Review Conclusions & Lessons Learned It s not about you, it s about the public Developed by Access Utah County
SCOPE OF SERVICES INTERSTATE 195 CORRIDOR PLANNING STUDY FROM INTERSTATE 95/NW 12 TH AVENUE TO ALTON ROAD
 SCOPE OF SERVICES INTERSTATE 195 CORRIDOR PLANNING STUDY FROM INTERSTATE 95/NW 12 TH AVENUE TO ALTON ROAD (ROADWAY ID 87004000 - MP 0.000 TO MP 4.910) (ROADWAY ID 87003000 MP 3.962 TO MP 4.132) BACKGROUND
Overcoming Barriers to Mixed-Use Infill Development: Let s Get Trip Generation Right
 Overcoming Barriers to Mixed-Use Infill Development: Let s Get Trip Generation Right By: Matt Goyne, Mackenzie Watten, and Dennis Lee with Fehr & Peers Please contact Matt Goyne at m.goyne@fehrandpeers.com
CE 452 Traffic Impact Assessment
 CE 452 Traffic Impact Assessment 1 Why Required? New developments Produce/ attract new traffic Production: Residences Attraction: Shops, Offices, Schools, Hospitals etc. etc. Changes in traffic pattern
South Florida East Coast Corridor (SFECC) Study
 Study") South Florida East Coast Corridor (SFECC) Study P r o j e c t U p d a t e J u l y 2 7, 2 0 11 FM Number: 417031-3-22-01 Re-introduce Passenger Rail Service on FEC Corridor (85 miles) Improve Freight Capacity
South Florida East Coast Corridor (SFECC) Study P r o j e c t U p d a t e J u l y 2 7, 2 0 11 FM Number: 417031-3-22-01 Re-introduce Passenger Rail Service on FEC Corridor (85 miles) Improve Freight Capacity
SR 417 Extension. June 2003 INTRODUCTION AND HISTORY PROJECT SCOPE AND PURPOSE STUDY OBJECTIVE STUDY PHASES
 Planning Feasibility Study June 2003 INTRODUCTION AND HISTORY The SR 417 Extension Study was a yearlong effort undertaken by Florida s Turnpike Enterprise to investigate the feasibility of a new toll road
EXHIBIT A. TRANSIT AND MULTIMODAL DEVELOPMENT SUPPORT CONTINUING SERVICES SCOPE OF SERVICES FM No
 EXHIBIT A TRANSIT AND MULTIMODAL DEVELOPMENT SUPPORT CONTINUING SERVICES SCOPE OF SERVICES FM No. 429768-4-12-01 This Exhibit forms an integral part of the Agreement between the DEPARTMENT and, the CONSULTANT,
National Governors Association
 National Governors Association Roundtable Presentation April 2, 2001 Dr. Christine Johnson Director, ITS Joint Program Office Program Manager, FHWA Operations 1 Congestion is a critical problem Transportation
Strategic Transportation Plan. Presented to: ECO-Rapid Transit Board of Directors Presented by: Gill V. Hicks, Cambridge Systematics, Inc.
 Strategic Transportation Plan Presented to: ECO-Rapid Transit Board of Directors Presented by: Gill V. Hicks, Cambridge Systematics, Inc. June 11, 2014 1 Local Solutions for all Gateway Cities Communities
Transform 66 Multimodal Project: Prioritization Process and Evaluation Criteria Approved March 3, 2016
 Transform 66 Multimodal Project: Prioritization Process and Evaluation Criteria Approved March 3, 2016 The Memorandum of Agreement (MOA) for the Transform 66: Inside the Beltway Project directs NVTC to
Variable Speed Warnings on DMS
 Variable Speed Warnings on DMS Evolving Tools for Better Safety and Service Jeanne Olubogun, P.E. District Traffic Engineer - St. Louis Region Jeanne.Olubogun@modot.mo.gov 314-275-1536 2014 Traffic and
Florida Freight Supplychain Intermodal Model
 Florida Freight Supplychain Intermodal Model Innovations in Travel Modeling 2014 April 29, 2014 Introduction Support freight plan development Office of Freight Logistics and Passenger Operations Evaluate
Appendix J RFP No (Addendum No. 1)
") 3. Current State 3.1. Overview This section evaluates SRTA s current ERP configuration environment related to the following functional areas: General Ledger Budget Procurement Project Management Contract/
3. Current State 3.1. Overview This section evaluates SRTA s current ERP configuration environment related to the following functional areas: General Ledger Budget Procurement Project Management Contract/
LAS VEGAS STREET RAILROAD CROSSING RR/PUC CONNECTION AND PRELIMINARY DESIGN
 LAS VEGAS STREET RAILROAD CROSSING RR/PUC CONNECTION AND PRELIMINARY DESIGN Prepared for: City of Colorado Springs Prepared by: Felsburg Holt & Ullevig 508 South Tejon Street Colorado Springs, CO 80903
THE PROJECT. Executive Summary. City of Industry. City of Diamond Bar. 57/60 Confluence.
 THE PROJECT A freeway segment ranked 6th worst in the Nation, with levels of congestion, pollution and accidents that are simply unacceptable and which have Statewide and National implications. Executive
SR 99 Incident Response After- Action Plan
 SR 99 Incident Response After- Action Plan Background On June 10, 2014 at 1:52 PM, a pickup truck and a passenger car collided on southbound SR 99 (E Marginal Way S), just south of S Spokane St. The SDOT
US 75 Integrated Corridor Management System Using Technology and Partnership to Maximize Transportation System Capacity
 US 75 Integrated Corridor Management System Using Technology and Partnership to Maximize Transportation System Capacity Ahmad Sadegh, Ph.D. Schneider Electric US 75 Corridor Networks Freeway with continuous
Volume to Capacity Estimation of Signalized Road Networks for Metropolitan Transportation Planning. Hiron Fernando, BSCE. A Thesis CIVIL ENGINEERING
 Volume to Capacity Estimation of Signalized Road Networks for Metropolitan Transportation Planning by Hiron Fernando, BSCE A Thesis In CIVIL ENGINEERING Submitted to the Graduate Faculty of Texas Tech
SIEMENS CONCERT: City of Seattle
 SIEMENS CONCERT: City of Seattle Use of ATMS to Enhance and Extend Signal Operations Abstract: Today s signal systems are part of a complex environment that includes varied and disparate data sources and
Integrated Corridor Management --An Overview --
 Integrated Corridor Management --An Overview -- Neil Spiller FHWA Office of Operations Program Manager: ICM KBPS video 1 Integrated.. combining or coordinating separate agencies so as to provide a harmonious,
Use of Operation Data to Evaluate the Benefits and Costs of Advanced Traffic Management Components
 Use of Operation Data to Evaluate the Benefits and Costs of Advanced Traffic Management Components By: Mohammed Hadi, Ph.D., P.E. (Corresponding Author) Assistant Professor Department of Civil and Environmental
Appendix D: Functional Classification Criteria and Characteristics, and MnDOT Access Guidance
 APPENDICES Appendix D: Functional Classification Criteria and Characteristics, and MnDOT Access Guidance D.1 Functional classification identifies the role a highway or street plays in the transportation
INSIDE THIS ISSUE. mctrans.ce.ufl.edu VOLUME 64 \\ OCTOBER Streets Heat Map Freeways Animation HSM Supplement
 mctrans.ce.ufl.edu INSIDE THIS ISSUE McTrans Center University of Florida Civil & Coastal Engineering PO Box 116585 Gainesville, FL 32611-6585 Streets Heat Map Freeways Animation HSM Supplement Phone:
Regional Transitway Priorities Peer Region Research
 Regional Transitway Priorities Peer Region Research July 27, 2016 Background 9 transit corridor studies completed, 7 more initiated since 2008 2040 Transportation Policy Plan identifies a $31 B investment
An Introduction to the. Safety Manual
 An Introduction to the Highway Safety Manual An Introduction to the HIGHWAY SAFETY MANUAL Table of Contents Section 1: HSM Overview... 1 What is the Highway Safety Manual?... 1 How is the HSM Applied?...
3.6 GROUND TRANSPORTATION
 3.6.1 Environmental Setting 3.6.1.1 Area of Influence The area of influence for ground transportation consists of the streets and intersections that could be affected by automobile or truck traffic to
Operations in the 21st Century DOT Meeting Customers Needs and Expectations
 Operations in the 21st Century DOT Meeting Customers Needs and Expectations 1 Purpose of this Meeting: Share Thoughts & Discuss Challenges brought about by the changing transportation environment and public
Working with Transportation Concurrency Exception Areas
 Working with Transportation Concurrency Exception Areas September 2006 Presented by the Florida Department of Transportation Working with Transportation Concurrency Exception Areas Volume 1, September
Development of TSP warrants. to-day variability in traffic demand
 Development of TSP warrants considering vehicular emissions and day-to to-day variability in traffic demand Zeeshan Abdy Supervisor: Bruce R. Hellinga Dec 2006 Introduction Signalized intersections Traffic
Freeway Management/Managed Lanes - New Publications/Resources:
 FHWA Update on Managed Lanes/HOV/Congestion Pricing Greg Jones, FHWA Resource Center Presented at the Managed Lanes Committee Meeting, 2018 TRB Annual Meeting January 10, 2018 Freeway Management/Managed
Progress Report on the Implementation of the Strategic Intermodal System (SIS)
") Progress Report on the Implementation of the Strategic Intermodal System (SIS) Supplement to the Review of the Department of Transportation Tentative Work Program FY 2006/07 through 2010/11 Supplement
Progress Report on the Implementation of the Strategic Intermodal System (SIS) Supplement to the Review of the Department of Transportation Tentative Work Program FY 2006/07 through 2010/11 Supplement
Technical Methods Part 2
 Technical Methods Part 2 Performance Measurement in Transportation Planning Leading for results means that performance must be planned, not just reported Learning Objectives Describe a sample technical
Pollutant concentration profiles in vehicular road tunnels
 Proceedings of the th IASME/WSEAS Int. Conference on Heat Transfer, Thermal Engineering and Environment, Athens, Greece, August -, Pollutant concentration profiles in vehicular road tunnels K.L. Mak, W.T.
Central Phoenix Transportation Framework Study
 Central Phoenix Transportation Framework Study Study Area 2013, All Rights Reserved. 1 Agenda Introductions Work Products Feedback on previous products Draft products for Planning Partner review SR-30
2 Purpose and Need. 2.1 Study Area. I-81 Corridor Improvement Study Tier 1 Draft Environmental Impact Statement
 2 Purpose and Need 2.1 Study Area Interstate 81 (I-81) is relied upon for local and regional travel and interstate travel in the eastern United States. It extends 855 miles from Tennessee to New York at
FAIRFAX COUNTY PARK-AND-RIDE DEMAND ESTIMATION STUDY
 FAIRFAX COUNTY PARK-AND-RIDE DEMAND ESTIMATION STUDY Michael Demmon GIS Spatial Analyst Fairfax County, DOT Fairfax, VA Scudder Wagg Planner Michael Baker Jr, Inc. Richmond, VA Additional support from:
HIGHWAY 14 NEW ULM TO NICOLLET 4-Lane Expansion Open House
 HIGHWAY 14 NEW ULM TO NICOLLET 4-Lane Expansion Open House HIGHLIGHTS OF HWY 14 PROGRESS 1960s & 70s Four-lane expansion in Rochester and Mankato areas 1993 Owatonna to Kasson EIS Completed (redone to
SR 9/I-95 Interchange at 45th Street PD&E Study Palm Beach County, Florida FPID No.: FAP No.: ETDM No.
 Palm Beach County, Florida Palm Beach Metropolitan Planning Organization April 217 Project Study Area LIMITS: SR 9/I-95: from S of 45th Street to N of 45th Street 45th Street: From Village Boulevard to
Management and Integration of Data and Modeling at Santa Clara County Congestion Management Agency
 Management and Integration of Data and Modeling at Santa Clara County Congestion Management Agency VTA Modeling and GIS Group Peter Chen ITE SF Bay Area Annual Modeling Workshop April 29, 2015 Outlines
CENTRAL FLORIDA EXPRESSWAY AUTHORITY. SR 408 Eastern Extension PD&E Study
 CENTRAL FLORIDA EXPRESSWAY AUTHORITY SR 408 Eastern Extension PD&E Study WHAT IS A PD&E? Process used to evaluate - o Engineering Alternatives o Environmental Impacts and Social, Cultural and Economic
Dallas ICM & 511 System. 87 th Annual Transportation Short Course
 Dallas ICM & 511 System 87 th Annual Transportation Short Course October 16, 2013 Agenda Introduction ICM Overview 511 Overview Next Steps / Schedule Q&A What is ICM? The integrated management of freeway,
The Logic of Flow: Some Indispensable Concepts
 The Logic of Flow: Some Indispensable Concepts FLOWCON 014 San Francisco, CA September 3, 014 No part of this presentation may be reproduced without the written permission of the author. Donald G. Reinertsen
ADDENDUM NO. 1 DATE: July 29, 2016
 ADDENDUM NO. 1 RFP-DOT-16/17-4004PM FLORIDA DEPARTMENT OF TRANSPORTATION ADDENDUM NO. 1 DATE: July 29, 2016 RE: RFP NUMBER: RFP-DOT-16/17-4004PM RFP TITLE: Treasure Coast Regional Household Travel Survey
Traffic Noise Introduction to Traffic Noise Analysis and Abatement
 Traffic Noise Introduction to Traffic Noise Analysis and Abatement NW Bethany Blvd Improvement Project Michael Minor, President Michael Minor & Associates Inc. Introduction to Acoustics What is Noise?
AMPO Annual Conference Session: Performance (Part 1) October 18, 2017 Savannah, GA
 October 18, 2017 Savannah, GA") AMPO Annual Conference Session: Performance (Part 1) October 18, 2017 Savannah, GA Introduction: North Jersey Transportation Planning Authority NJTPA Congestion Management Process Study Goals Analysis
AMPO Annual Conference Session: Performance (Part 1) October 18, 2017 Savannah, GA Introduction: North Jersey Transportation Planning Authority NJTPA Congestion Management Process Study Goals Analysis
Florida Gas Transmission Section #3 Hydrostatic Test
 Florida Gas Transmission Section #3 Hydrostatic Test 14-Inch Saint Petersburg Lateral Pipeline From East of Lake Magdalene to West of County Line Hillsborough and Pinellas Counties Today s Outline Who
Los Angeles County Congestion Reduction Demonstration Project
 Los Angeles County Congestion Reduction Demonstration Project frequently asked questions update #1 /august 2008 Los Angeles County Metropolitan Transportation Authority (Metro), California Department of
Travel Time in Macroscopic Traffic Models for Origin-Destination Estimation
 University of Wisconsin Milwaukee UWM Digital Commons Theses and Dissertations May 2013 Travel Time in Macroscopic Traffic Models for Origin-Destination Estimation Eric Youngblom University of Wisconsin-Milwaukee
VISION. 4. Vision. 31 Page
 VISION 4. Vision The 2035 LRTP, branded as Transformation, is the Broward MPO s plan for change. Economic vitality for the region, a better environment, and enhanced quality of life are envisioned. This
TABLE OF CONTENTS PAGE NUMBER. Executive Summary Why Variable Pricing? What Was Studied? User Surveys Air Quality Analysis User And Equity Analysis
 TABLE OF CONTENTS PAGE NUMBER Executive Summary Why Variable Pricing? What Was Studied? User Surveys Air Quality Analysis User And Equity Analysis Findings Scenario 1 Base Case Scenario 2 Detoll Scenario
Forecast and Capacity Planning for Nogales Ports of Entry
 Forecast and Capacity Planning for Nogales Ports of Entry Rene Villalobos, Arnie Maltz*, L.J. Xue, Octavio Sanchez Industrial Engineering Department * Supply Chain Department Arizona State University October
Request for Information from the Florida Dept. of Transportation
 Request for Information from the Florida Dept. of Transportation The Florida Department of Transportation (FDOT), Transportation Data and Analytics Office (TDA), is requesting information from vendors
Advanced Transportation Management System (ATMS)
") Advanced Transportation Management System (ATMS) Presentation to the ITS Technology Workshop for Municipalities February 15, 2017 ATMS Project Background Increasing traffic volumes Roadway network is near
Advanced Transportation Management System (ATMS) Presentation to the ITS Technology Workshop for Municipalities February 15, 2017 ATMS Project Background Increasing traffic volumes Roadway network is near
DEVELOPMENT, ANALYSIS, AND DESIGN OF A NEW PARKWAY AT GRADE INTERSECTION (PAGI)
") 2013 ITE Western District Annual Meeting COCEPT DEVELOPMET, AALYSIS, AD DESIG OF A EW PARKWAY AT GRADE ITERSECTIO (PAGI) Lead Author: James M. Witkowski, PhD Supporting Author: Darrell Truitt, PE The Pima
2013 ITE Western District Annual Meeting COCEPT DEVELOPMET, AALYSIS, AD DESIG OF A EW PARKWAY AT GRADE ITERSECTIO (PAGI) Lead Author: James M. Witkowski, PhD Supporting Author: Darrell Truitt, PE The Pima
report Smart Growth - Refined Transport Modelling
 report Smart Growth - Refined Transport Modelling report Smart Growth - Refined Transport Modelling Prepared for Smart Growth By Beca Carter Hollings & Ferner Ltd November 2002 8111359/210 Rev A L1:90421
Chapter 1. FHWA Guidance & Policies Traffic Analysis
 Chapter 1 FHWA Guidance & Policies Traffic Analysis Microsimulation as a Design Tool James P. McCarthy Federal Highway Administration James.mccarthy@fhwa.dot.gov 651-291-6112 Traffic Analysis in Design?
Scope of Services Traffic Signal Retiming Contract FM NO Florida Department of Transportation District Four
 Scope of Services Traffic Signal Retiming Contract FM NO. 230017-8-32-01 Florida Department of Transportation District Four A-1 Contents 1. Background... 3 2. Summary of Services... 3 3. Consultant Requirements...
ASSESSING THE IMPACT OF SECURITY MEASURES AT GATES OF SEAPORTS ON TRAFFIC OPERATION
 ASSESSING THE IMPACT OF SECURITY MEASURES AT GATES OF SEAPORTS ON TRAFFIC OPERATION Dr. Arun Chatterjee Professor Emeritus Dept of Civil & Environmental Engineering The University of Tennessee Knoxville,
II. Approval of June 23, 2015 Meeting Notes. IV. Recap of the 2040 Regional Transportation Plan (Jessica Josselyn, Kittelson & Associates, Inc.
 Regional Transportation Technical Advisory Committee (RTTAC) Transportation System Management & Operations (TSM&O) Subcommittee Meeting Agenda July 20, 2016 10:00 AM FDOT District Four Headquarters Auditorium
U.S. 70 Corridor Economic Assessment
 U.S. 70 Corridor Economic Assessment prepared for U.S. 70 Corridor Commission and NCDOT prepared by Cambridge Systematics, Inc. with Sanford Holshouser Economic Development Consulting March 07, 2014 www.camsys.com
TRAFFIC & TRANSPORTATION COMMISSION AGENDA REPORT
 TRAFFIC & TRANSPORTATION COMMISSION AGENDA REPORT AGENDA ITEM #4 T/T MTG: 092616 DATE: SEPTEMBER 26, 2016 TO: TRAFFIC & TRANSPORTATION COMMISSION FROM: BENJAMIN CHAN, P.E, T.E., DEPUTY PUBLIC WORKS DIRECTOR
AN INTEGRATED TRANSPORTATION PLANNING AND OPERATIONS MODEL FOR MEMPHIS, TENNESSEE
 AN INTEGRATED TRANSPORTATION PLANNING AND OPERATIONS MODEL FOR MEMPHIS, TENNESSEE Jeffery Karafa, Mihalis M. Golias, Martin Lipinski Department of Civil Engineering & Intermodal Freight Transportation
HOUSTON S TRAVEL RATE IMPROVEMENT PROGRAM
 HOUSTON S TRAVEL RATE IMPROVEMENT PROGRAM TOOLBOX OF IMPROVEMENT STRATEGIES MANAGE THE CONSTRUCTION AND MAINTENANCE Prepared for Greater Houston Partnership Prepared by Texas Transportation Institute The
Maximize Transportation System Capacity
 US 75 Integrated Corridor Management System Using Technology and Partnership to Using Technology and Partnership to Maximize Transportation System Capacity What is ICM? The integrated management of freeway,
Evaluation Summary for the San Diego Testbed. Final Report August 2017 FHWA-JPO
 Analysis, Modeling, and Simulation (AMS) Testbed Development and Evaluation to Support Dynamic Mobility Applications (DMA) and Active Transportation and Demand Management (ATDM) Programs Evaluation Summary
TECHNICAL MEMORANDUM I-710 EIR/EIS INITIAL FEASIBILITY ANALYSIS (IFA) TECHNICAL APPENDIX WBS TASK ID:
 TECHNICAL APPENDIX WBS TASK ID:") FINAL REPORT TECHNICAL MEMORANDUM I-710 EIR/EIS INITIAL FEASIBILITY ANALYSIS (IFA) TECHNICAL APPENDIX WBS TASK ID: 165.10.09 Prepared for Los Angeles County Metropolitan Transportation Authority December
FINAL REPORT TECHNICAL MEMORANDUM I-710 EIR/EIS INITIAL FEASIBILITY ANALYSIS (IFA) TECHNICAL APPENDIX WBS TASK ID: 165.10.09 Prepared for Los Angeles County Metropolitan Transportation Authority December
TRAFFIC FORECASTING REQUIREMENTS BY PROJECT TYPE. August Research Report
 I. Report No. 2. Government Accession No. FHWA/TX-95 I 1235-8 4. Tide and Subtitle TRAFFIC FORECASTING REQUIREMENTS BY PROJECT TYPE Technical Report Documentation Page 3. Recipient's Catalog No. 5. Report
CAPITAL AREA TRANSIT PLANNING SERVICE STANDARDS AND PROCESS. Planning Department
 CAPITAL AREA TRANSIT PLANNING SERVICE STANDARDS AND PROCESS Planning Department January 2016 INTRODUCTION Transit Service Standards are public rules and guidelines used to make decisions about where transit